Capital Management
Highlights Ppt PowerPoint Presentation Icon Outfit
This is a highlights ppt powerpoint presentation icon outfit. This is a five stage process. The stages in this process are countries, stores worldwide, total revenue, monthly website visitors, associates.
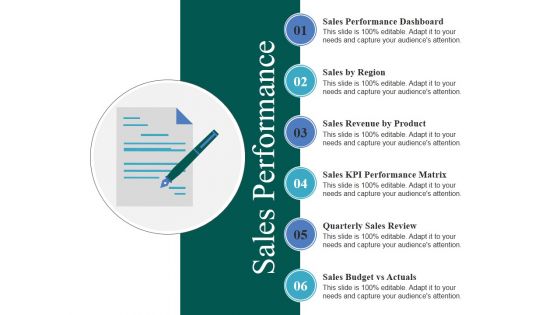
Sales Performance Ppt PowerPoint Presentation Infographics Visuals
This is a sales performance ppt powerpoint presentation infographics visuals. This is a six stage process. The stages in this process are sales by region, sales revenue by product, sales kpi performance matrix, quarterly sales review, sales budget vs actuals.
Sales Performance Ppt PowerPoint Presentation Visual Aids Icon
This is a sales performance ppt powerpoint presentation visual aids icon. This is a six stage process. The stages in this process are quarterly sales review, sales performance dashboard, sales by region, sales revenue by product.

Identifying Targets Ppt PowerPoint Presentation Inspiration Example
This is a identifying targets ppt powerpoint presentation inspiration example. This is a six stage process. The stages in this process are country, industry, company, deal size, target company revenue.
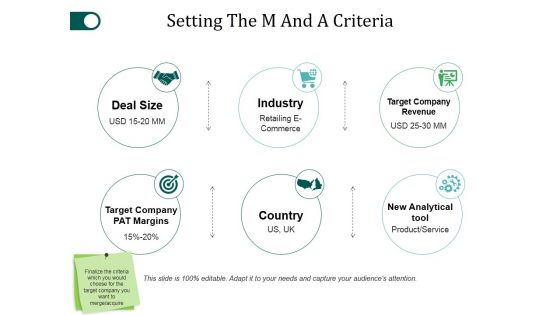
Setting The M And A Criteria Ppt PowerPoint Presentation Portfolio Shapes
This is a setting the m and a criteria ppt powerpoint presentation portfolio shapes. This is a six stage process. The stages in this process are deal size, industry, country, target company revenue, new analytical tool.
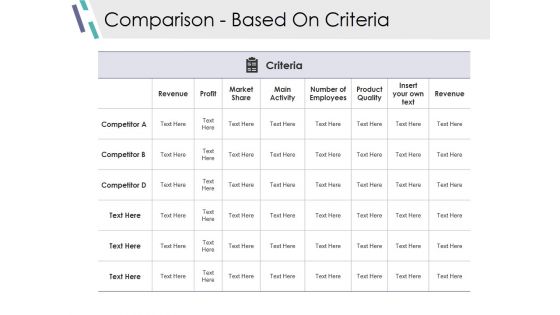
Comparison Based On Criteria Ppt PowerPoint Presentation Show Outline
This is a comparison based on criteria ppt powerpoint presentation show outline. This is a six stage process. The stages in this process are revenue, profit, market share, main activity, number of employees.

Comparison Based On Criteria Ppt PowerPoint Presentation Show Graphics Pictures
This is a comparison based on criteria ppt powerpoint presentation show graphics pictures. This is a seven stage process. The stages in this process are competitor, revenue, profit, market share, main activity.
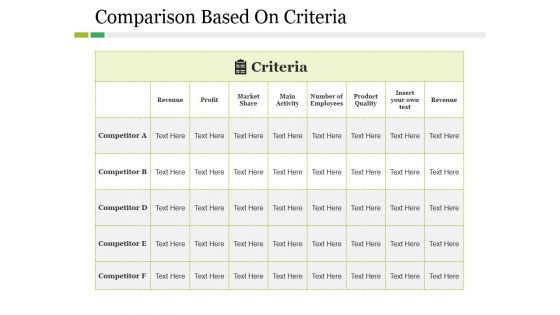
Comparison Based On Criteria Ppt PowerPoint Presentation Styles Picture
This is a comparison based on criteria ppt powerpoint presentation styles picture. This is a five stage process. The stages in this process are competitor, revenue, profit, criteria, market share.
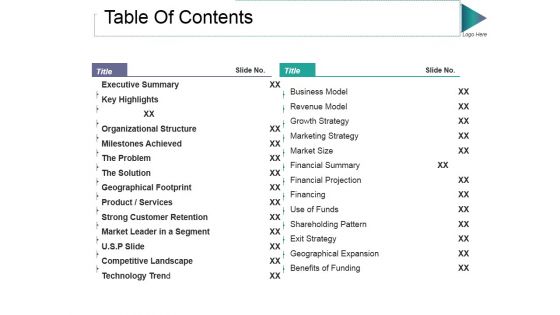
Table Of Contents Ppt PowerPoint Presentation Infographics Layouts
This is a table of contents ppt powerpoint presentation infographics layouts. This is a two stage process. The stages in this process are business model, revenue model, the problem, the solution, exit strategy.
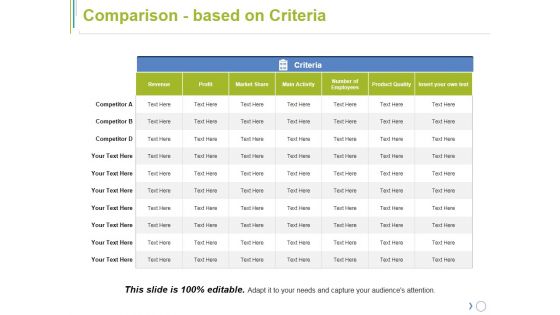
Comparison Based On Criteria Ppt PowerPoint Presentation Model Inspiration
This is a comparison based on criteria ppt powerpoint presentation model inspiration. This is a seven stage process. The stages in this process are revenue, profit, market share, number of employees, product quality.
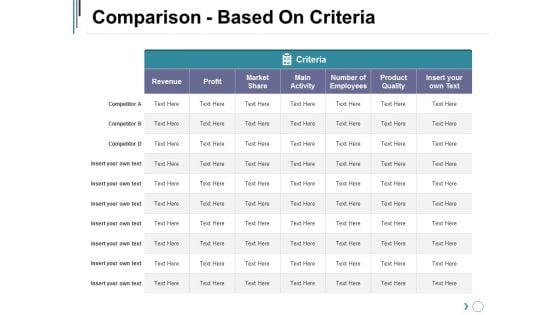
Comparison Based On Criteria Ppt PowerPoint Presentation Show Background Image
This is a comparison based on criteria ppt powerpoint presentation show background image. This is a seven stage process. The stages in this process are revenue, market share, main activity, number of employees, product quality, insert your own text.
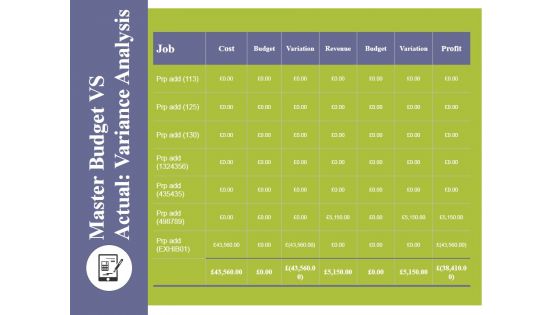
Master Budget Vs Actual Variance Analysis Template 1 Ppt PowerPoint Presentation Model Ideas
This is a master budget vs actual variance analysis template 1 ppt powerpoint presentation model ideas. This is a seven stage process. The stages in this process are cost, budget, variation, revenue, budget.
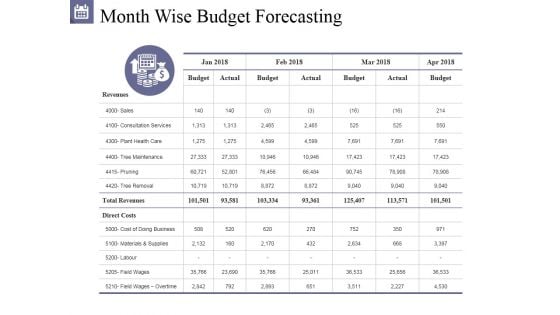
Month Wise Budget Forecasting Ppt PowerPoint Presentation Rules
This is a month wise budget forecasting ppt powerpoint presentation rules. This is a four stage process. The stages in this process are budget, actual, revenues, sales, direct costs.
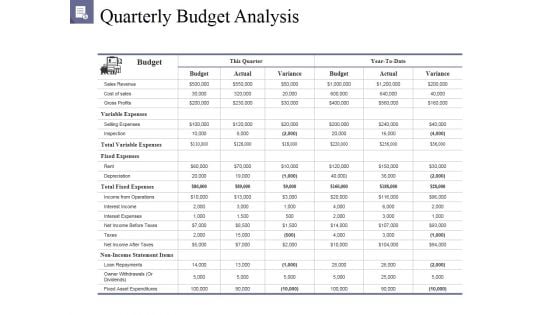
Quarterly Budget Analysis Ppt PowerPoint Presentation Outline Background Image
This is a quarterly budget analysis ppt powerpoint presentation outline background image. This is a two stage process. The stages in this process are budget, this quarter, sales revenue, cost of sales, gross profits.
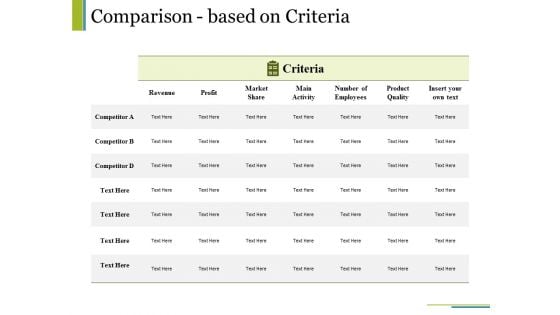
Comparison Based On Criteria Ppt PowerPoint Presentation File Templates
This is a comparison based on criteria ppt powerpoint presentation file templates. This is a seven stage process. The stages in this process are revenue, market share, main activity, number of employees, product quality, insert your own text.
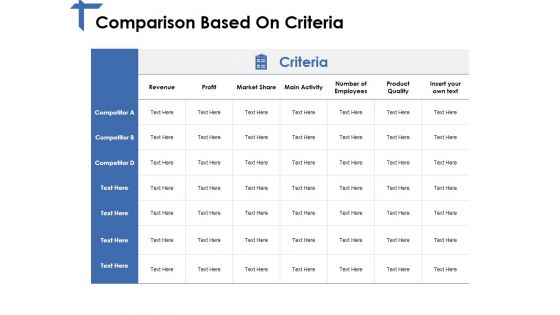
Comparison Based On Criteria Ppt PowerPoint Presentation Model Layouts
This is a comparison based on criteria ppt powerpoint presentation model layouts. This is a seven stage process. The stages in this process are revenue, profit, market share, main activity, product quality.

Competitor Analysis Ppt PowerPoint Presentation Professional Designs
This is a competitor analysis ppt powerpoint presentation professional designs. This is a four stage process. The stages in this process are sales development of industry, sales development, performance indicators, revenue.
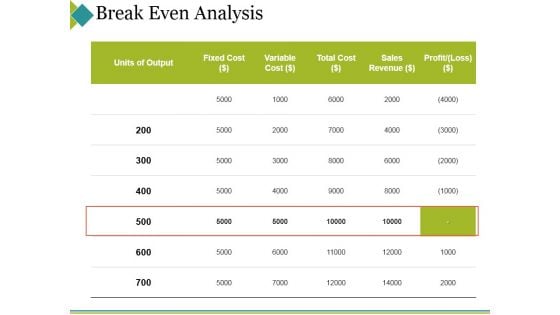
Break Even Analysis Ppt PowerPoint Presentation Outline Example Topics
This is a break even analysis ppt powerpoint presentation outline example topics. This is a five stage process. The stages in this process are units of output, variable, fixed cost, total cost, sales revenue.
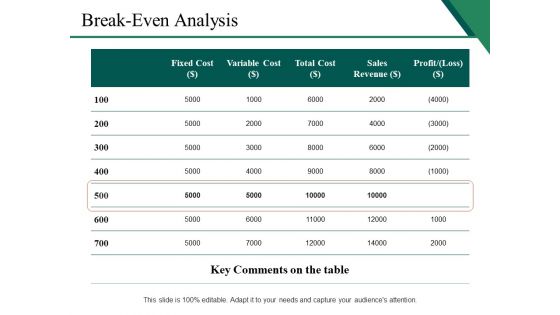
Break Even Analysis Ppt PowerPoint Presentation Pictures Good
This is a break even analysis ppt powerpoint presentation pictures good. This is a five stage process. The stages in this process are key comments on the table, units of output, fixed cost, variable cost, sales revenue.
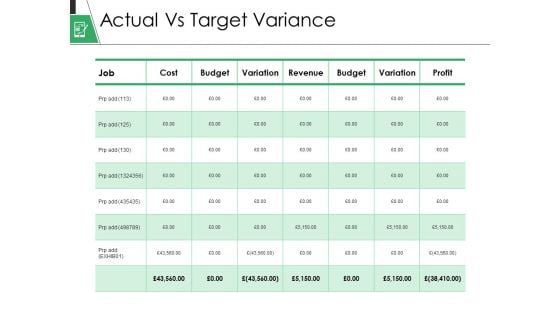
Actual Vs Target Variance Ppt PowerPoint Presentation Gallery Background
This is a actual vs target variance ppt powerpoint presentation gallery background. This is a eight stage process. The stages in this process are Cost, Budget, Variation, Revenue, Budget.
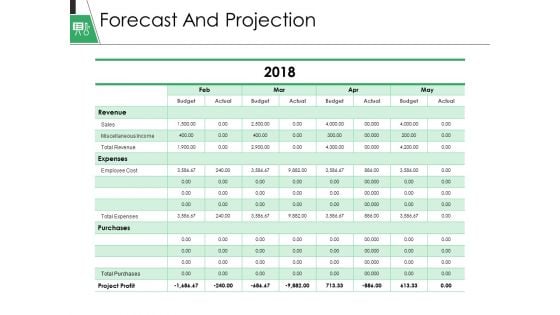
Forecast And Projection Ppt PowerPoint Presentation Gallery Display
This is a forecast and projection ppt powerpoint presentation gallery display. This is a four stage process. The stages in this process are revenue, expenses, purchases, project profit, budget.

Actual Vs Target Variance Ppt PowerPoint Presentation File Backgrounds
This is a actual vs target variance ppt powerpoint presentation file backgrounds. This is a eight stage process. The stages in this process are job, cost, budget, revenue, variation.
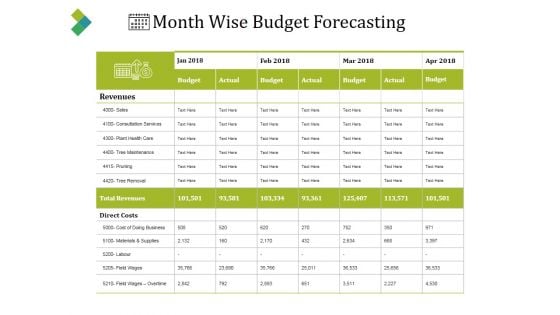
Month Wise Budget Forecasting Ppt PowerPoint Presentation Model Show
This is a month wise budget forecasting ppt powerpoint presentation model show. This is a four stage process. The stages in this process are budget, actual, revenue, sales, direct costs.
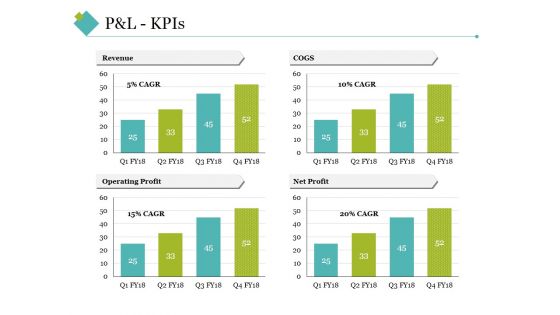
P And L Kpis Template 2 Ppt PowerPoint Presentation Inspiration Grid
This is a p and l kpis template 2 ppt powerpoint presentation inspiration grid. This is a four stage process. The stages in this process are revenue, cogs, operating profit, net profit.
Income Statement Overview Ppt PowerPoint Presentation Infographic Template Icon
This is a income statement overview ppt powerpoint presentation infographic template icon. This is a five stage process. The stages in this process are revenue, profit margin, operating profit margin.
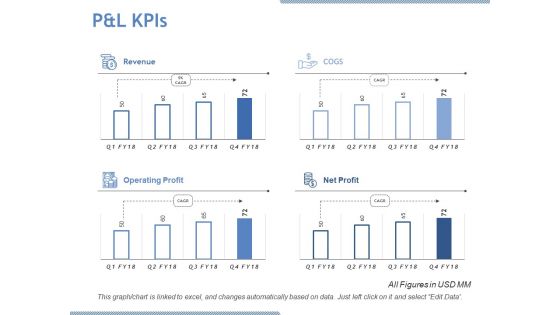
P And L Kpis Ppt PowerPoint Presentation Designs Download
This is a p and l kpis ppt powerpoint presentation designs download. This is a four stage process. The stages in this process are revenue, cogs, operating profit, net profit.
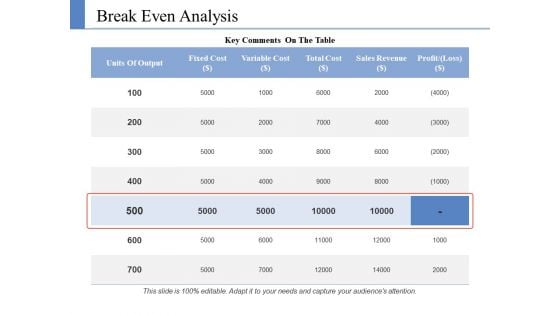
Break Even Analysis Ppt PowerPoint Presentation Portfolio Graphics Design
This is a break even analysis ppt powerpoint presentation portfolio graphics design. This is a five stage process. The stages in this process are units of output, fixed cost, variable cost, total cost, sales revenue.
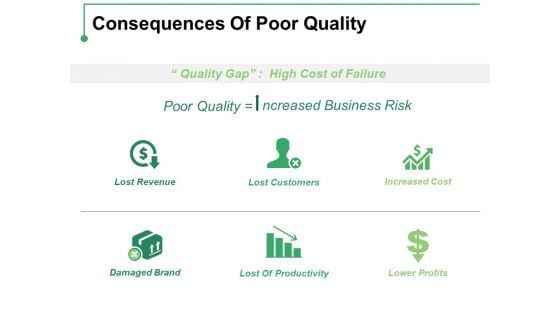
Consequences Of Poor Quality Ppt PowerPoint Presentation Styles Guidelines
This is a consequences of poor quality ppt powerpoint presentation styles guidelines. This is a six stage process. The stages in this process are lost revenue, lost customers, increased cost, damaged brand, lower profits.
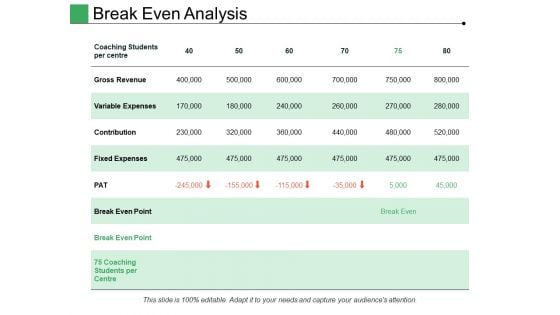
Break Even Analysis Ppt PowerPoint Presentation Inspiration Example Introduction
This is a break even analysis ppt powerpoint presentation inspiration example introduction. This is a four stage process. The stages in this process are gross revenue, variable expenses, contribution, break even point, pat.
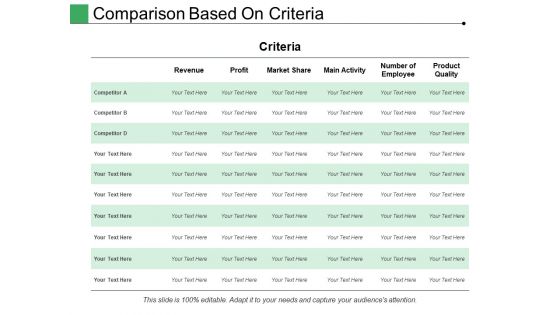
Comparison Based On Criteria Ppt PowerPoint Presentation Gallery Information
This is a comparison based on criteria ppt powerpoint presentation gallery information. This is a six stage process. The stages in this process are criteria, revenue, profit, business, competitor.
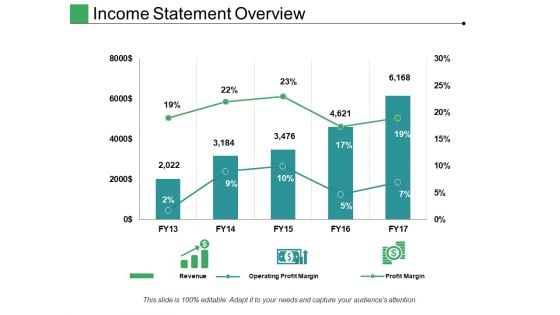
Income Statement Overview Ppt PowerPoint Presentation File Structure
This is a income statement overview ppt powerpoint presentation file structure. This is a five stage process. The stages in this process are revenue, operating profit margin, profit margin.
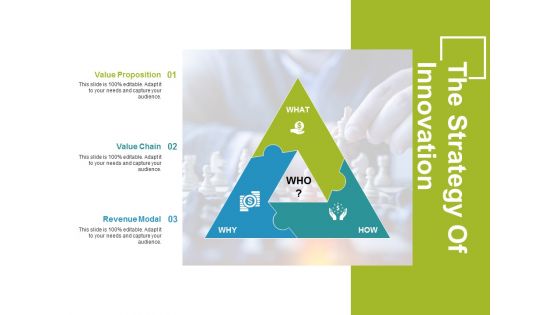
The Strategy Of Innovation Template 1 Ppt PowerPoint Presentation Professional Graphics Download
This is a the strategy of innovation template 1 ppt powerpoint presentation professional graphics download. This is a three stage process. The stages in this process are value proposition, value chain, revenue modal.
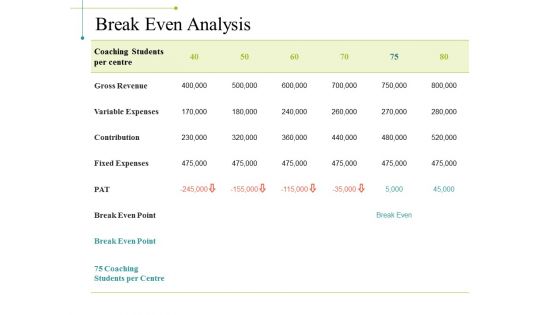
Break Even Analysis Ppt PowerPoint Presentation Model Example File
This is a break even analysis ppt powerpoint presentation model example file. This is a six stage process. The stages in this process are gross revenue, variable expenses, contribution, fixed expenses, break even point.
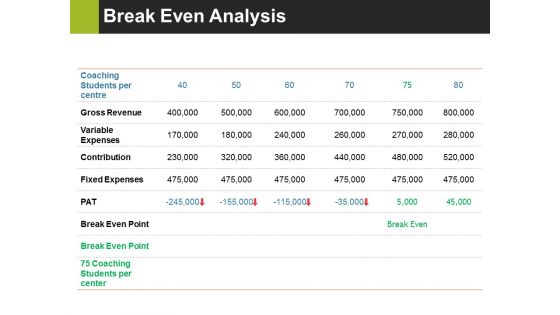
Break Even Analysis Ppt PowerPoint Presentation Layouts Rules
This is a break even analysis ppt powerpoint presentation layouts rules. This is a six stage process. The stages in this process are gross revenue, variable expenses, contribution, fixed expenses.

Comparison Based On Criteria Ppt PowerPoint Presentation Infographic Template Graphic Tips
This is a comparison based on criteria ppt powerpoint presentation infographic template graphic tips. This is a seven stage process. The stages in this process are revenue, market share, main activity, number of employee, product quality.

Business Model Innovation Ppt PowerPoint Presentation File Infographic Template
This is a business model innovation ppt powerpoint presentation file infographic template. This is a three stage process. The stages in this process are revenue model innovation, customer model innovation, organizational model innovation.
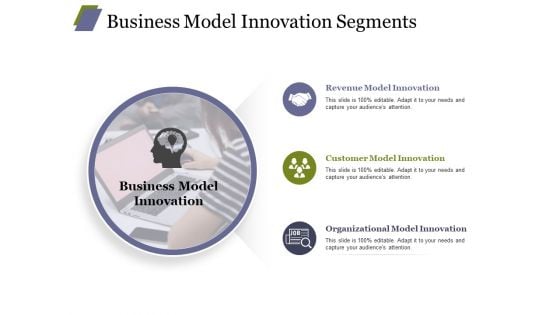
Business Model Innovation Segments Ppt PowerPoint Presentation Professional Example Topics
This is a business model innovation segments ppt powerpoint presentation professional example topics. This is a three stage process. The stages in this process are revenue model innovation, customer model innovation, organizational model innovation.
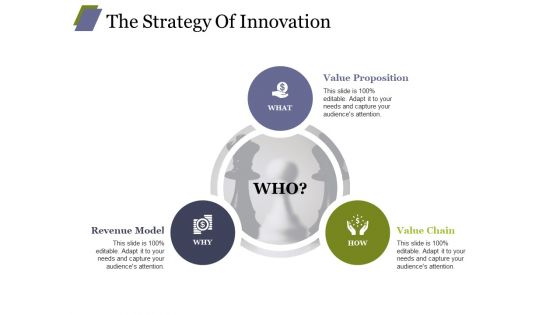
The Strategy Of Innovation Ppt PowerPoint Presentation Model Templates
This is a the strategy of innovation ppt powerpoint presentation model templates. This is a three stage process. The stages in this process are value proposition, value chain, revenue model.
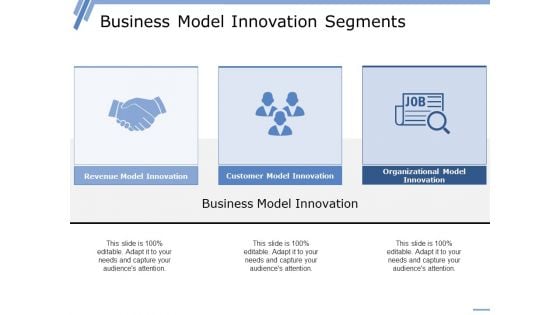
Business Model Innovation Segments Ppt PowerPoint Presentation Summary Introduction
This is a business model innovation segments ppt powerpoint presentation summary introduction. This is a three stage process. The stages in this process are customer model innovation, business model innovation, revenue model innovation.
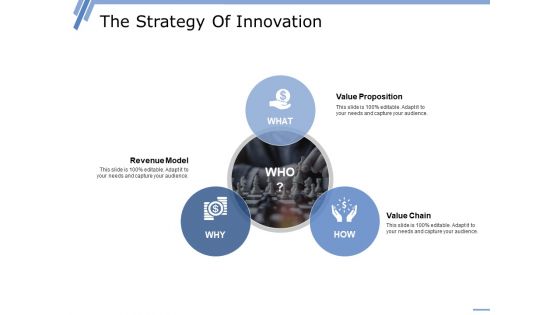
The Strategy Of Innovation Ppt PowerPoint Presentation Outline Display
This is a the strategy of innovation ppt powerpoint presentation outline display. This is a three stage process. The stages in this process are value proposition, value chain, revenue model.
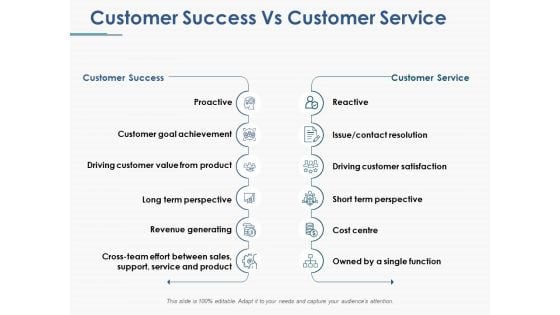
Customer Success Vs Customer Service Ppt PowerPoint Presentation Portfolio Professional
This is a customer success vs customer service ppt powerpoint presentation portfolio professional. This is a six stage process. The stages in this process are reactive, proactive, cost centre, revenue generating, customer service, customer success.

Customer Success Vs Customer Service Ppt PowerPoint Presentation Summary Objects
This is a customer success vs customer service ppt powerpoint presentation summary objects. This is a two stage process. The stages in this process are proactive, customer goal achievement, driving customer value from product, long term perspective, revenue generating.
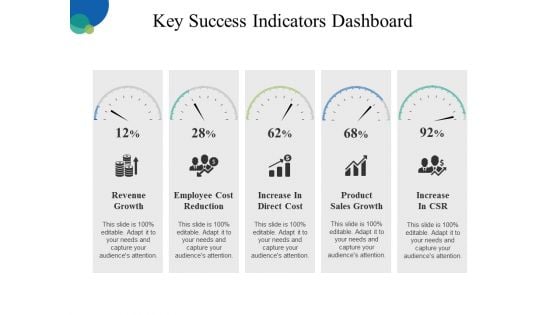
Key Success Indicators Dashboard Ppt PowerPoint Presentation Outline Slideshow
This is a key success indicators dashboard ppt powerpoint presentation outline slideshow. This is a five stage process. The stages in this process are revenue growth, employee cost reduction, increase in direct cost, product sales growth, increase in csr.
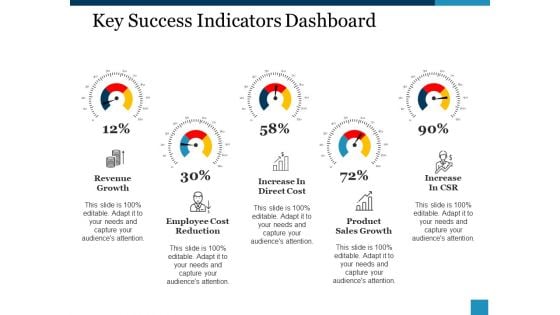
Key Success Indicators Dashboard Ppt PowerPoint Presentation Inspiration Guide
This is a key success indicators dashboard ppt powerpoint presentation inspiration guide. This is a five stage process. The stages in this process are revenue growth, increase in direct cost, increase in csr, employee cost reduction, product, sales growth.
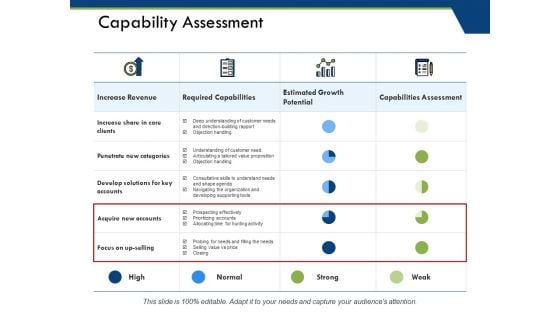
Capability Assessment Ppt PowerPoint Presentation Ideas Visual Aids
This is a capability assessment ppt powerpoint presentation ideas visual aids. This is a four stage process. The stages in this process are increase revenue, required capabilities, capabilities assessment, acquire new accounts.
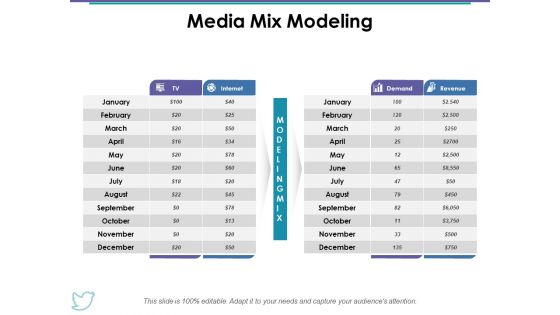
Media Mix Modeling Ppt PowerPoint Presentation Gallery Example
This is a media mix modeling ppt powerpoint presentation gallery example. This is a two stage process. The stages in this process are media mix modeling, demand, revenue, business, table.

Dollar Signs With Growing Up Arrow For Profit Growth Ppt PowerPoint Presentation Layouts Examples
This is a dollar signs with growing up arrow for profit growth ppt powerpoint presentation layouts examples. This is a four stage process. The stages in this process are growth, increase sales, increase revenue.
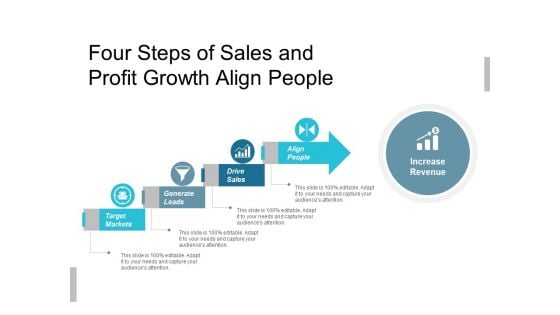
Four Steps Of Sales And Profit Growth Align People Ppt PowerPoint Presentation Infographic Template Deck
This is a four steps of sales and profit growth align people ppt powerpoint presentation infographic template deck. This is a four stage process. The stages in this process are growth, increase sales, increase revenue.
Profit Growth Bar Graph With Rising Arrow And Dollar Sign Ppt PowerPoint Presentation Icon Designs
This is a profit growth bar graph with rising arrow and dollar sign ppt powerpoint presentation icon designs. This is a five stage process. The stages in this process are growth, increase sales, increase revenue.
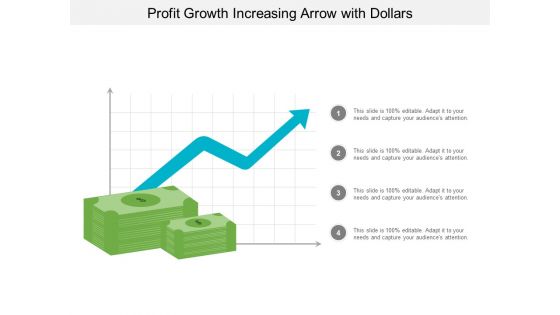
Profit Growth Increasing Arrow With Dollars Ppt PowerPoint Presentation Model Outfit
This is a profit growth increasing arrow with dollars ppt powerpoint presentation model outfit. This is a four stage process. The stages in this process are growth, increase sales, increase revenue.
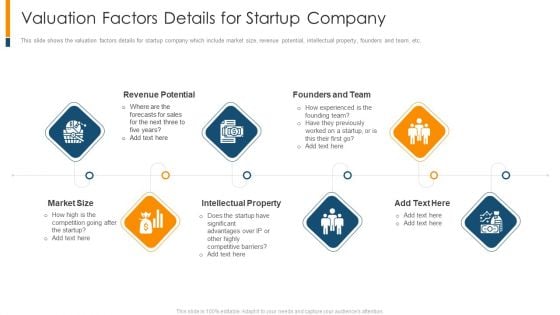
Valuation Factors Details For Startup Company Ppt Pictures Topics PDF
This slide shows the valuation factors details for startup company which include market size, revenue potential, intellectual property, founders and team, etc. This is a valuation factors details for startup company ppt pictures topics pdf template with various stages. Focus and dispense information on six stages using this creative set, that comes with editable features. It contains large content boxes to add your information on topics like market size, intellectual property, revenue potential. You can also showcase facts, figures, and other relevant content using this PPT layout. Grab it now.
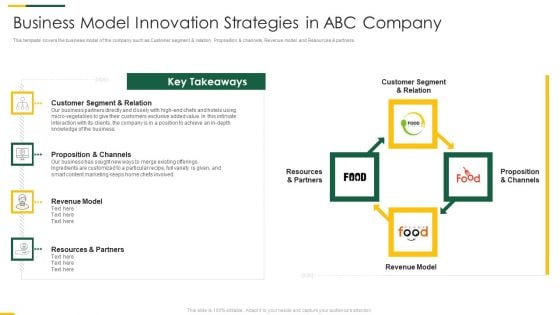
Packaged Food Brand Funding Investor Pitch Deck Business Model Innovation Strategies In ABC Company Information PDF
This template covers the business model of the company such as Customer segment and relation, Proposition and channels, Revenue model and Resources and partners. This is a packaged food brand funding investor pitch deck business model innovation strategies in abc company information pdf template with various stages. Focus and dispense information on four stages using this creative set, that comes with editable features. It contains large content boxes to add your information on topics like customer segment and relation, proposition and channels, revenue model, resources and partners. You can also showcase facts, figures, and other relevant content using this PPT layout. Grab it now.
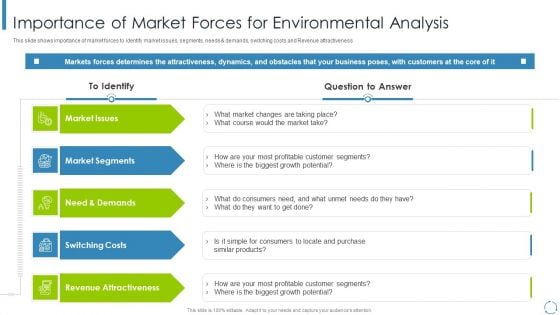
Internal And External Business Environment Analysis Importance Of Market Forces For Environmental Analysis Guidelines PDF
This slide shows importance of market forces to identify market issues, segments, needs and demands, switching costs and Revenue attractivenessThis is a internal and external business environment analysis importance of market forces for environmental analysis guidelines pdf template with various stages. Focus and dispense information on five stages using this creative set, that comes with editable features. It contains large content boxes to add your information on topics like market segments, revenue attractiveness, switching costs You can also showcase facts, figures, and other relevant content using this PPT layout. Grab it now.
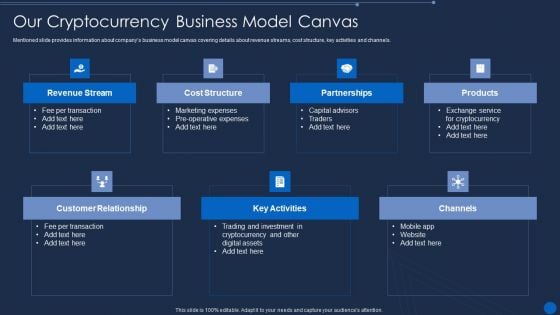
Cryptocurrency Pre Seed Stage Our Cryptocurrency Business Model Canvas Information PDF
Mentioned slide provides information about companys business model canvas covering details about revenue streams, cost structure, key activities and channels. Presenting cryptocurrency pre seed stage our cryptocurrency business model canvas information pdf to provide visual cues and insights. Share and navigate important information on eight stages that need your due attention. This template can be used to pitch topics like revenue stream, cost structure, partnerships, products, customer relationship, key activities. In addtion, this PPT design contains high resolution images, graphics, etc, that are easily editable and available for immediate download.

Metrics To Measure Business Performance Short Term Goals Ppt Portfolio Good PDF
This slide covers the short term goals set by the firm for FY20. Goals covered are to capture competitors market share, reduce churn rate, increase sales revenue and to invest in CSR activities. This is a Metrics To Measure Business Performance Short Term Goals Ppt Portfolio Good PDF template with various stages. Focus and dispense information on five stages using this creative set, that comes with editable features. It contains large content boxes to add your information on topics like Reduce Customer Churn, Growth, Invest, Sales Revenue. You can also showcase facts, figures, and other relevant content using this PPT layout. Grab it now.
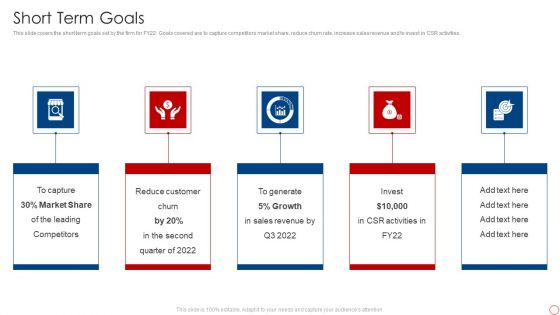
Kpis For Evaluating Business Sustainability Short Term Goals Infographics PDF
This slide covers the short term goals set by the firm for FY22. Goals covered are to capture competitors market share, reduce churn rate, increase sales revenue and to invest in CSR activities. This is a Kpis For Evaluating Business Sustainability Short Term Goals Infographics PDF template with various stages. Focus and dispense information on five stages using this creative set, that comes with editable features. It contains large content boxes to add your information on topics like Market Share, Reduce Customer Churn, Sales Revenue. You can also showcase facts, figures, and other relevant content using this PPT layout. Grab it now.
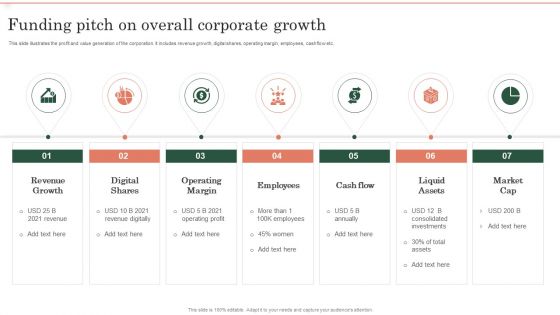
Funding Pitch On Overall Corporate Growth Ppt Show Designs PDF
This slide illustrates the profit and value generation of the corporation. It includes revenue growth, digital shares, operating margin, employees, cashflow etc. Persuade your audience using this Funding Pitch On Overall Corporate Growth Ppt Show Designs PDF. This PPT design covers seven stages, thus making it a great tool to use. It also caters to a variety of topics including Revenue Growth, Digital Shares, Operating Margin. Download this PPT design now to present a convincing pitch that not only emphasizes the topic but also showcases your presentation skills.
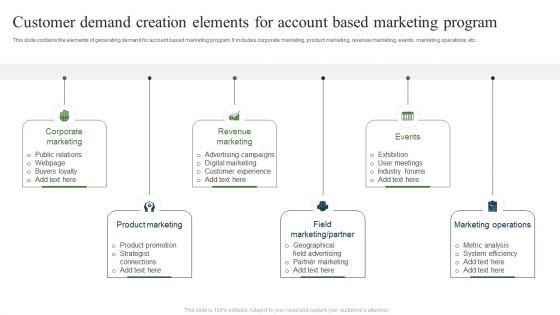
Customer Demand Creation Elements For Account Based Marketing Program Ppt Portfolio Ideas PDF
This slide contains the elements of generating demand for account based marketing program. It includes corporate marketing, product marketing, revenue marketing, events, marketing operations, etc. Presenting Customer Demand Creation Elements For Account Based Marketing Program Ppt Portfolio Ideas PDF to dispense important information. This template comprises six stages. It also presents valuable insights into the topics including Corporate Marketing, Revenue Marketing, Marketing Operations, Product Marketing. This is a completely customizable PowerPoint theme that can be put to use immediately. So, download it and address the topic impactfully.
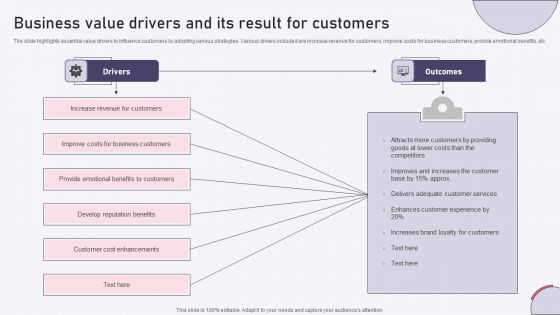
Business Value Drivers And Its Result For Customers Ppt Infographics Ideas PDF
The slide highlights essential value drivers to influence customers by adopting various strategies. Various drivers included are increase revenue for customers, improve costs for business customers, provide emotional benefits, etc . Presenting Business Value Drivers And Its Result For Customers Ppt Infographics Ideas PDF to dispense important information. This template comprises two stages. It also presents valuable insights into the topics including Drivers, Outcomes, Increase Revenue, Customers. This is a completely customizable PowerPoint theme that can be put to use immediately. So, download it and address the topic impactfully.
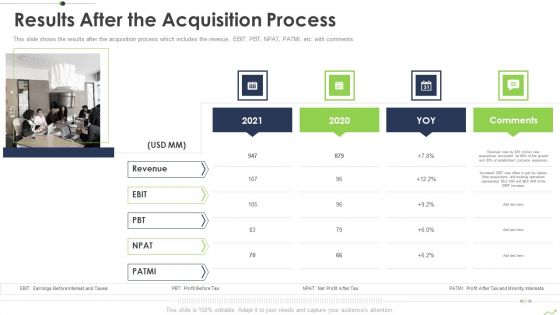
Paths To Inorganic Expansion Results After The Acquisition Process Ppt Summary Background Image PDF
This slide shows the results after the acquisition process which includes the revenue, EBIT, PBT, NPAT, PATMI, etc. with comments. Presenting paths to inorganic expansion results after the acquisition process ppt summary background image pdf to provide visual cues and insights. Share and navigate important information on one stages that need your due attention. This template can be used to pitch topics like results after the acquisition process. In addtion, this PPT design contains high resolution images, graphics, etc, that are easily editable and available for immediate download.


 Continue with Email

 Home
Home


