Chart Analysis
Pie Chart Showing Three Phases Of Business Transformation Process Ppt PowerPoint Presentation Gallery Icon PDF
Showcasing this set of slides titled pie chart showing three phases of business transformation process ppt powerpoint presentation gallery icon pdf. The topics addressed in these templates are analysis phase, design phase, implementation phase. All the content presented in this PPT design is completely editable. Download it and make adjustments in color, background, font etc. as per your unique business setting.
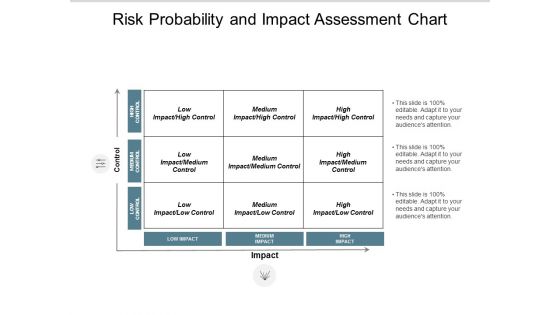
Risk Probability And Impact Assessment Chart Ppt PowerPoint Presentation Show Smartart
Presenting this set of slides with name risk probability and impact assessment chart ppt powerpoint presentation show smartart. This is a two stage process. The stages in this process are control impact matrix, analysis strategic framework, risk assessment. This is a completely editable PowerPoint presentation and is available for immediate download. Download now and impress your audience.
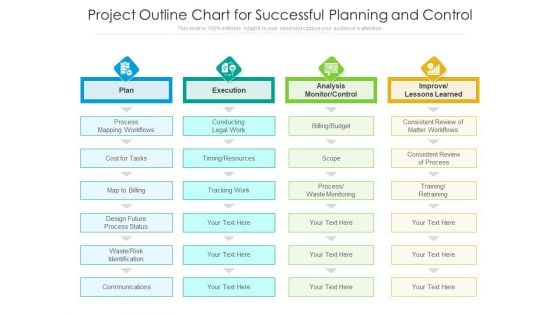
Project Outline Chart For Successful Planning And Control Ppt PowerPoint Presentation Gallery Slides PDF
Showcasing this set of slides titled project outline chart for successful planning and control ppt powerpoint presentation gallery slides pdf. The topics addressed in these templates are plan, execution, analysis monitor control. All the content presented in this PPT design is completely editable. Download it and make adjustments in color, background, font etc. as per your unique business setting.
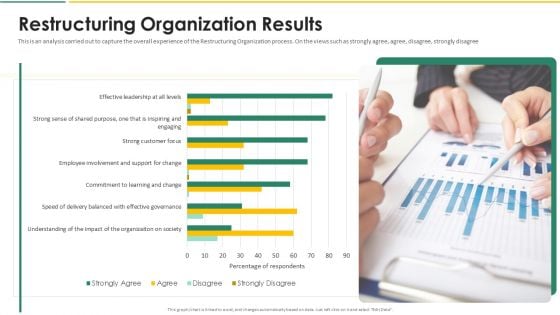
Organization Chart And Corporate Model Transformation Restructuring Organization Results Elements PDF
This is an analysis carried out to capture the overall experience of the Restructuring Organization process. On the views such as strongly agree, agree, disagree, strongly disagree. Deliver an awe inspiring pitch with this creative organization chart and corporate model transformation restructuring organization results elements pdf bundle. Topics like effective, involvement, organizations can be discussed with this completely editable template. It is available for immediate download depending on the needs and requirements of the user.
Marketing Campaign Tracking Chart With Launch Platform Ppt Show Slides PDF
This slide covers the marketing campaign analysis sheet. It includes campaign details such as campaign name, status, platform, campaign category, start date, target audience, and audience stage. There are so many reasons you need a Marketing Campaign Tracking Chart With Launch Platform Ppt Show Slides PDF. The first reason is you can not spend time making everything from scratch, Thus, Slidegeeks has made presentation templates for you too. You can easily download these templates from our website easily.
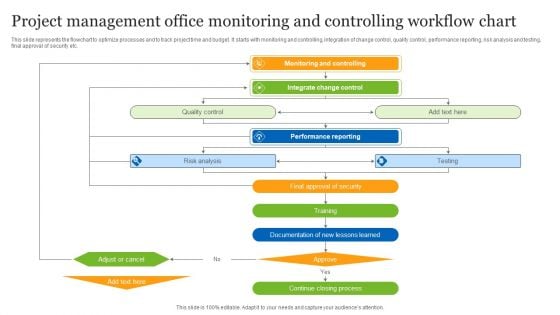
Project Management Office Monitoring And Controlling Workflow Chart Ppt Slides Mockup PDF
This slide represents the flowchart to optimize processes and to track project time and budget. It starts with monitoring and controlling, integration of change control, quality control, performance reporting, risk analysis and testing, final approval of security etc. Presenting Project Management Office Monitoring And Controlling Workflow Chart Ppt Slides Mockup PDF to dispense important information. This template comprises five stages. It also presents valuable insights into the topics including Monitoring And Controlling, Integrate Change Control, Performance Reporting. This is a completely customizable PowerPoint theme that can be put to use immediately. So, download it and address the topic impactfully.
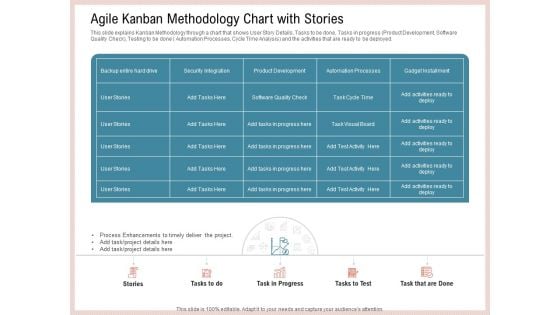
Agile Model Improve Task Team Performance Agile Kanban Methodology Chart With Stories Guidelines PDF
This slide explains Kanban Methodology through a chart that shows User Story Details, Tasks to be done, Tasks in progress Product Development, Software Quality Check, Testing to be done Automation Processes, Cycle Time Analysis and the activities that are ready to be deployed. Deliver an awe inspiring pitch with this creative agile model improve task team performance agile kanban methodology chart with stories guidelines pdf bundle. Topics like security integration, product development, automation processes can be discussed with this completely editable template. It is available for immediate download depending on the needs and requirements of the user.
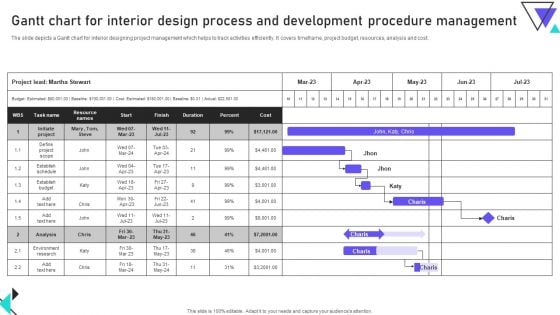
Gantt Chart For Interior Design Process And Development Procedure Management Diagrams PDF
The slide depicts a Gantt chart for interior designing project management which helps to track activities efficiently. It covers timeframe, project budget, resources, analysis and cost. Showcasing this set of slides titled Gantt Chart For Interior Design Process And Development Procedure Management Diagrams PDF. The topics addressed in these templates are Cost, Establish Budget, Development Procedure Management. All the content presented in this PPT design is completely editable. Download it and make adjustments in color, background, font etc. as per your unique business setting.

Various Billing Software Comparison Chart Ppt PowerPoint Presentation File Diagrams PDF
Following slide represents comparative analysis of various software for company billing system. It includes various parameters such as prices, installation, time tracking, individual invoices, expense tracking etc. Do you have an important presentation coming up Are you looking for something that will make your presentation stand out from the rest Look no further than Various Billing Software Comparison Chart Ppt PowerPoint Presentation File Diagrams PDF With our professional designs, you can trust that your presentation will pop and make delivering it a smooth process. And with Slidegeeks, you can trust that your presentation will be unique and memorable. So why wait Grab Various Billing Software Comparison Chart Ppt PowerPoint Presentation File Diagrams PDF today and make your presentation stand out from the rest.
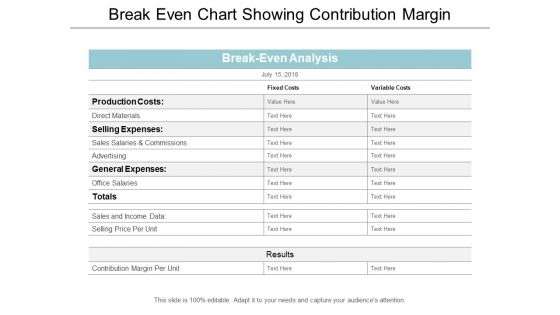
break even chart showing contribution margin ppt powerpoint presentation professional templates
This is a break even chart showing contribution margin ppt powerpoint presentation professional templates. This is a two stage process. The stages in this process are break even point,break even analysis,break even level.
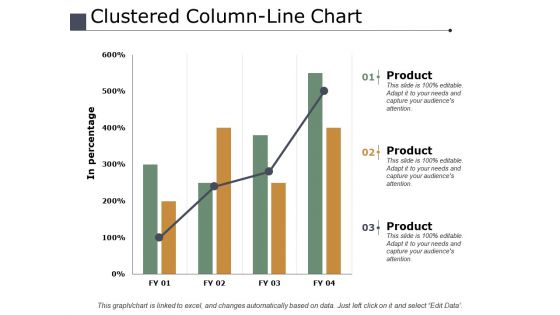
Clustered Column Line Chart Finance Ppt PowerPoint Presentation Inspiration Design Templates
This is a clustered column line chart finance ppt powerpoint presentation inspiration design templates. This is a three stage process. The stages in this process are finance, analysis, business, investment, marketing.
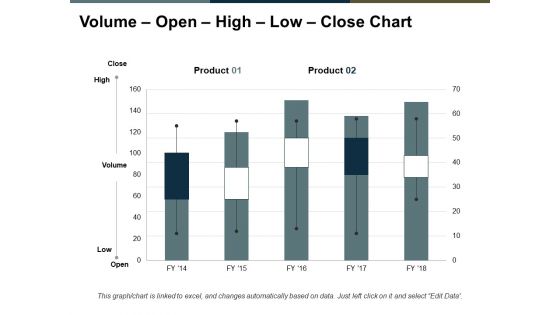
Volume Open High Low Close Chart Ppt PowerPoint Presentation Model Ideas
This is a volume open high low close chart ppt powerpoint presentation model ideas. This is a five stage process. The stages in this process are finance, marketing, analysis, business, investment.
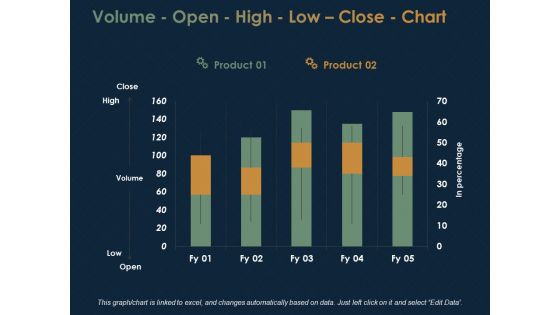
Volume Open High Low Close Chart Finance Ppt PowerPoint Presentation Gallery Graphic Tips
This is a volume open high low close chart finance ppt powerpoint presentation gallery graphic tips. This is a two stage process. The stages in this process are finance, analysis, business, investment, marketing.
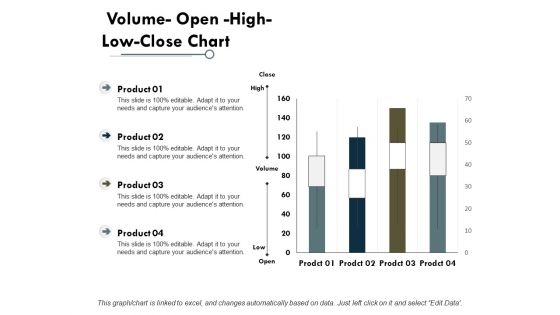
Volume Open High Low Close Chart Finance Ppt PowerPoint Presentation Professional Background Image
This is a volume open high low close chart finance ppt powerpoint presentation professional background image. This is a four stage process. The stages in this process are finance, analysis, business, investment, marketing.
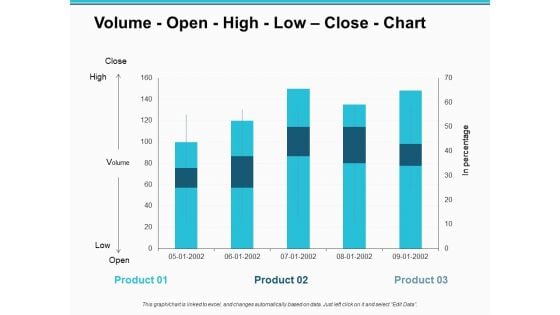
Volume Open High Low Close Chart Finance Ppt PowerPoint Presentation Model Graphic Images
This is a volume open high low close chart finance ppt powerpoint presentation model graphic images. This is a three stage process. The stages in this process are finance, analysis, business, investment, marketing.
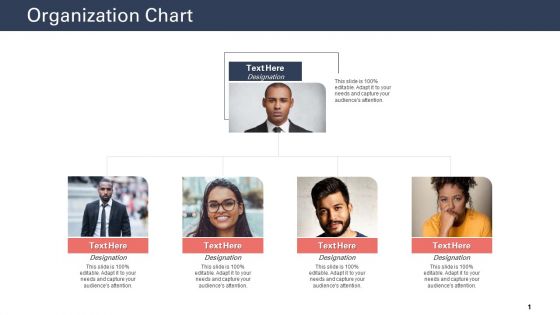
Techniques To Increase Customer Satisfaction Organization Chart Ppt Summary Design Templates PDF
Presenting techniques to increase customer satisfaction organization chart ppt summary design templates pdf to provide visual cues and insights. Share and navigate important information on four stages that need your due attention. This template can be used to pitch topics like organization chart. In addtion, this PPT design contains high resolution images, graphics, etc, that are easily editable and available for immediate download.
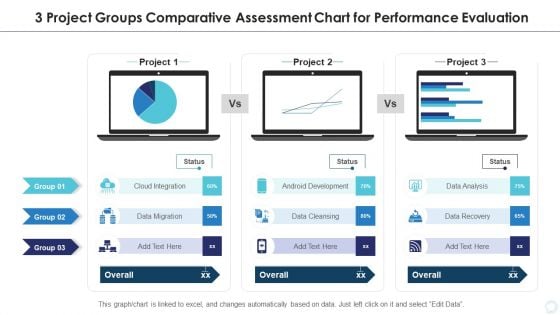
3 Project Groups Comparative Assessment Chart For Performance Evaluation Background PDF
Showcasing this set of slides titled 3 project groups comparative assessment chart for performance evaluation background pdf. The topics addressed in these templates are data analysis, data recovery, android development. All the content presented in this PPT design is completely editable. Download it and make adjustments in color, background, font etc. as per your unique business setting.
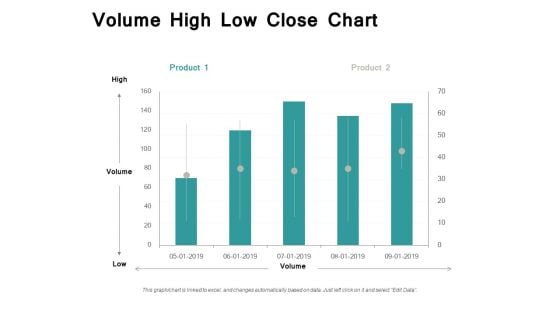
Volume High Low Close Chart Ppt PowerPoint Presentation Infographic Template Example File
Presenting this set of slides with name volume high low close chart ppt powerpoint presentation infographic template example file. The topics discussed in these slides are finance, marketing, management, investment, analysis. This is a completely editable PowerPoint presentation and is available for immediate download. Download now and impress your audience.

Enterprise Examination And Inspection Management Organizational Chart Ppt Inspiration Show PDF
Presenting enterprise examination and inspection management organizational chart ppt inspiration show pdf to provide visual cues and insights. Share and navigate important information on two stages that need your due attention. This template can be used to pitch topics like marketing, communication, development. In addtion, this PPT design contains high resolution images, graphics, etc, that are easily editable and available for immediate download.
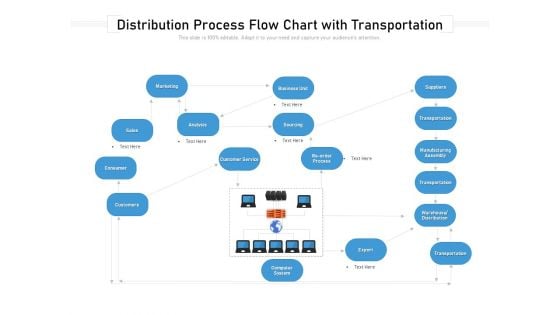
Distribution Process Flow Chart With Transportation Ppt PowerPoint Presentation Slides Deck PDF
Presenting distribution process flow chart with transportation ppt powerpoint presentation slides deck pdf to dispense important information. This template comprises one stages. It also presents valuable insights into the topics including business unit, suppliers,analysis, marketing, consumer, transportation, transportation, manufacturing assembly. This is a completely customizable PowerPoint theme that can be put to use immediately. So, download it and address the topic impactfully.
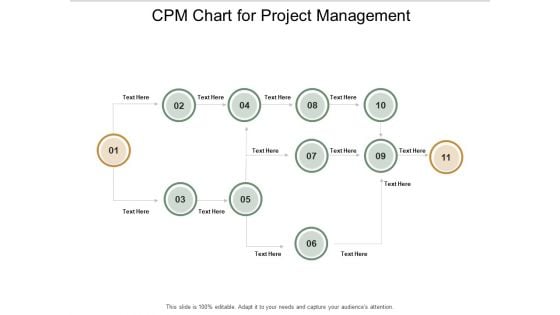
Cpm Chart For Project Management Ppt PowerPoint Presentation Portfolio Background Image
This is a cpm chart for project management ppt powerpoint presentation portfolio background image. This is a eleven stage process. The stages in this process are critical path method, critical path analysis, cpm.
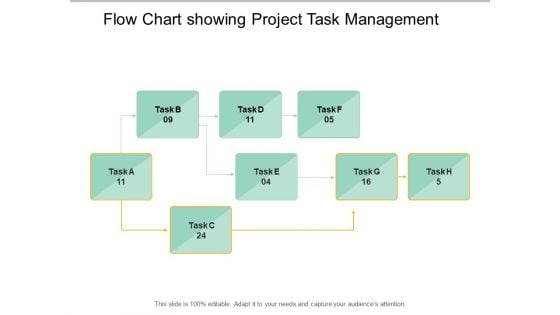
Flow Chart Showing Project Task Management Ppt PowerPoint Presentation Styles Smartart
This is a flow chart showing project task management ppt powerpoint presentation styles smartart. This is a eight stage process. The stages in this process are critical path method, critical path analysis, cpm.
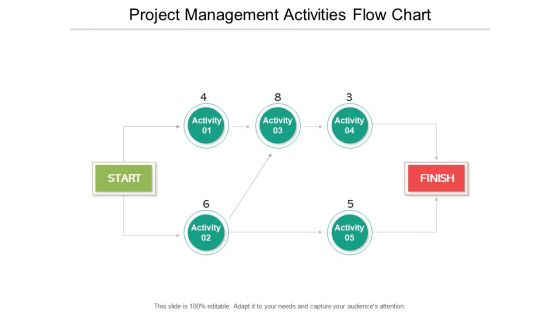
Project Management Activities Flow Chart Ppt PowerPoint Presentation File Example File
This is a project management activities flow chart ppt powerpoint presentation file example file. This is a seven stage process. The stages in this process are critical path method, critical path analysis, cpm.
Clustered Bar Chart Yearly Operating Plan Ppt PowerPoint Presentation Styles Icon
This is a clustered bar chart yearly operating plan ppt powerpoint presentation styles icon. This is a four stage process. The stages in this process are business, management, strategy, analysis, marketing.
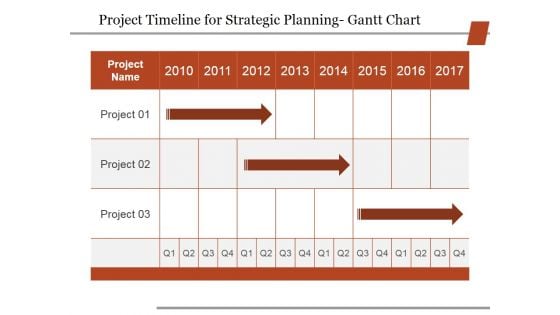
Project Timeline For Strategic Planning Gantt Chart Ppt PowerPoint Presentation Professional Ideas
This is a project timeline for strategic planning gantt chart ppt powerpoint presentation professional ideas. This is a three stage process. The stages in this process are Business, Strategy, Marketing, Analysis, Table.
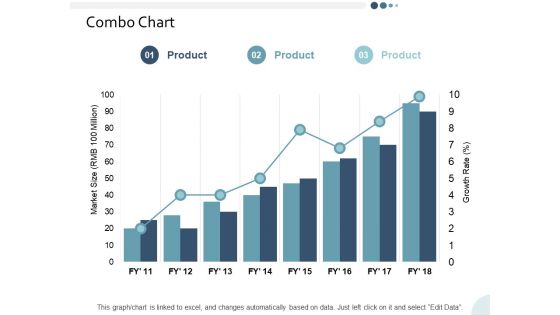
Combo Chart Yearly Operating Plan Ppt PowerPoint Presentation Infographic Template Skills
This is a combo chart yearly operating plan ppt powerpoint presentation infographic template skills. This is a three stage process. The stages in this process are business, management, strategy, analysis, marketing.
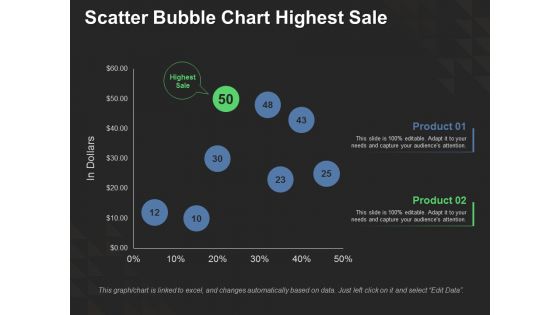
Scatter Bubble Chart Highest Sale Ppt PowerPoint Presentation Show Slide Download
This is a scatter bubble chart highest sale ppt powerpoint presentation show slide download. This is a two stage process. The stages in this process are finance, investment, analysis, business, marketing.

Column Chart Employee Value Proposition Ppt PowerPoint Presentation Slides Graphics Design
This is a column chart employee value proposition ppt powerpoint presentation slides graphics design. This is a two stage process. The stages in this process are business, management, strategy, analysis, marketing.
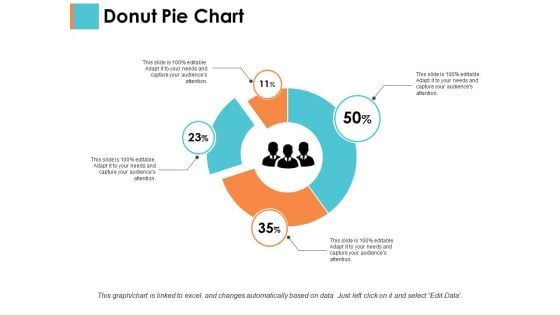
Donut Pie Chart Sample Budget Ppt Ppt PowerPoint Presentation Layouts Styles
This is a donut pie chart sample budget ppt ppt powerpoint presentation layouts styles. This is a four stage process. The stages in this process are business, management, strategy, analysis, marketing.
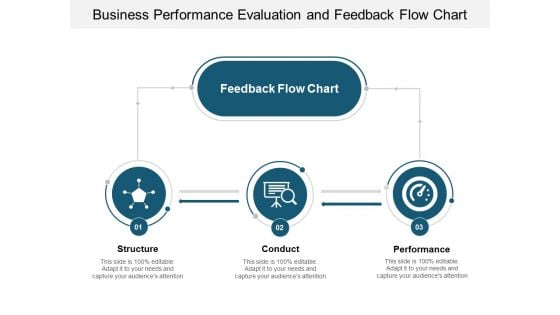
Business Performance Evaluation And Feedback Flow Chart Ppt Powerpoint Presentation Model Example Topics
This is a business performance evaluation and feedback flow chart ppt powerpoint presentation model example topics. This is a three stage process. The stages in this process are performance management, structure conduct performance, performance review and analysis.
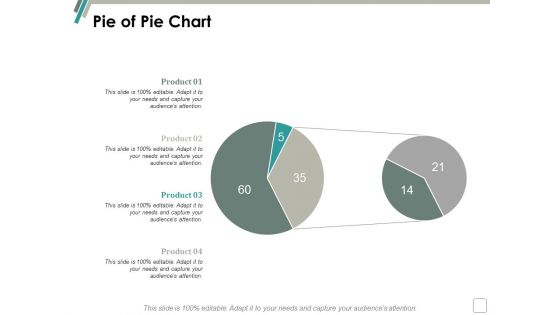
Pie Of Pie Chart Finance Ppt Powerpoint Presentation File Design Templates
This is a pie of pie chart finance ppt powerpoint presentation file design templates. This is a four stage process. The stages in this process are finance, marketing, management, investment, analysis.

Donut Chart Finance Marketing Ppt Powerpoint Presentation Infographics Skills Ppt Powerpoint Presentation File Skills
This is a donut chart finance marketing ppt powerpoint presentation infographics skills ppt powerpoint presentation file skills. This is a four stage process. The stages in this process are finance, marketing, management, investment, analysis.
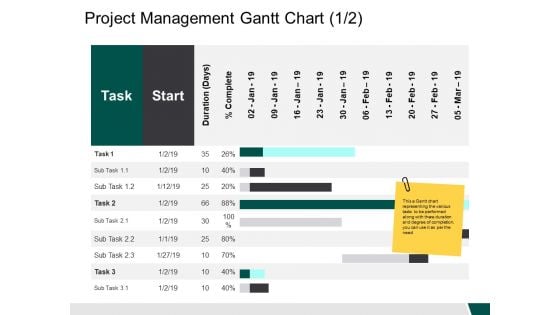
Project Management Gantt Chart Start Ppt PowerPoint Presentation Outline Example Introduction
This is a project management gantt chart start ppt powerpoint presentation outline example introduction. This is a two stage process. The stages in this process are business, management, strategy, analysis, marketing.
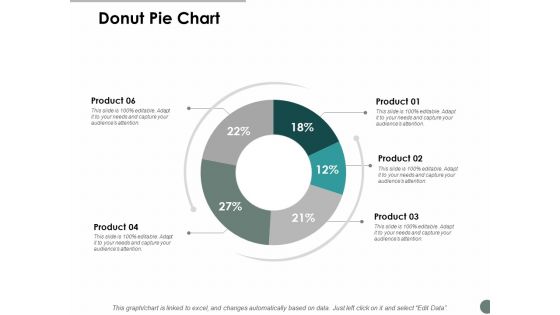
Donut Pie Chart Marketing Ppt Powerpoint Presentation Infographic Template Graphics Template
This is a donut pie chart marketing ppt powerpoint presentation infographic template graphics template. This is a six stage process. The stages in this process are finance, marketing, management, investment, analysis.
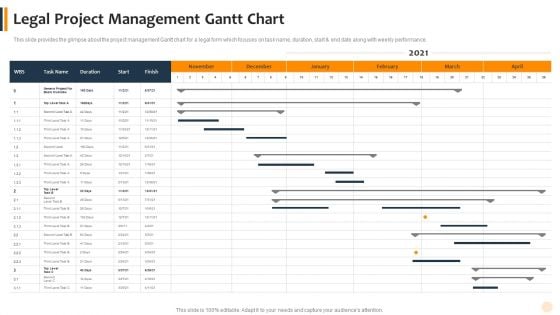
Agile Technique To Lawful Pitch And Proposals IT Legal Project Management Gantt Chart Slides PDF
Design a highly optimized project management report using this well-researched agile technique to lawful pitch and proposals it legal project management gantt chart slides pdf. This layout can be used to present the professional details of a task or activity. Showcase the activities allocated to the business executives with this Gantt Chart PowerPoint theme. List down the column tasks in various timeframes and allocate time for each. In addition, also monitor the actual time and make comparisons to interpret the final progress using this innovative Gantt Chart Template. Showcase the work breakdown structure to attract your audience. Download and share it using Google Slides, if it suits your requirement.
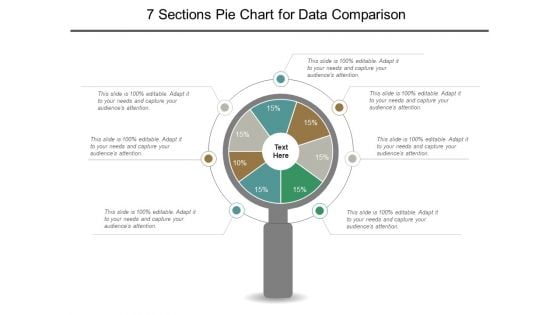
7 Sections Pie Chart For Data Comparison Ppt PowerPoint Presentation File Graphics Template
This is a 7 sections pie chart for data comparison ppt powerpoint presentation file graphics template. This is a seven stage process. The stages in this process are 6 piece pie chart, 6 segment pie chart, 6 parts pie chart.
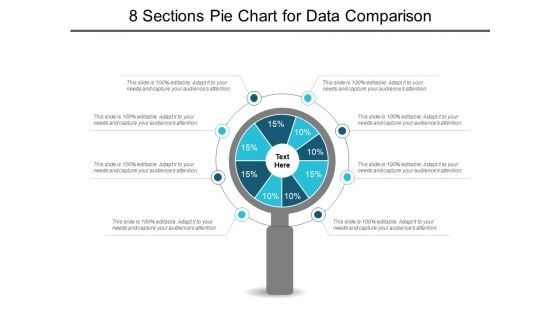
8 Sections Pie Chart For Data Comparison Ppt PowerPoint Presentation Show Slideshow
This is a 8 sections pie chart for data comparison ppt powerpoint presentation show slideshow. This is a eight stage process. The stages in this process are 6 piece pie chart, 6 segment pie chart, 6 parts pie chart.
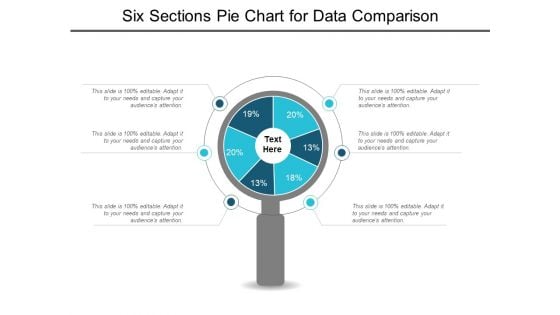
Six Sections Pie Chart For Data Comparison Ppt PowerPoint Presentation Styles Graphics Example
This is a six sections pie chart for data comparison ppt powerpoint presentation styles graphics example. This is a six stage process. The stages in this process are 6 piece pie chart, 6 segment pie chart, 6 parts pie chart.
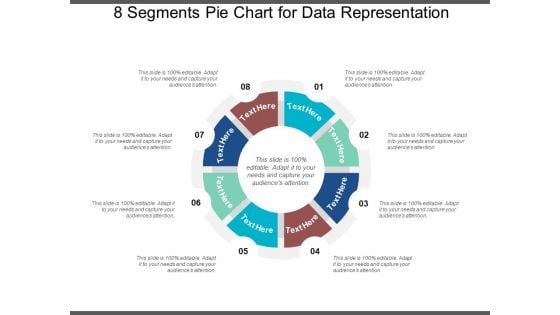
8 Segments Pie Chart For Data Representation Ppt PowerPoint Presentation Infographics Design Templates
This is a 8 segments pie chart for data representation ppt powerpoint presentation infographics design templates. This is a eight stage process. The stages in this process are 6 piece pie chart, 6 segment pie chart, 6 parts pie chart.
6 Segments Pie Chart For Data Representation Ppt PowerPoint Presentation Icon Graphics
This is a 6 segments pie chart for data representation ppt powerpoint presentation icon graphics. This is a six stage process. The stages in this process are 6 piece pie chart, 6 segment pie chart, 6 parts pie chart.
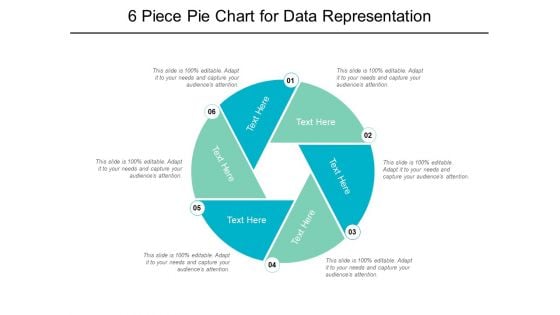
6 Piece Pie Chart For Data Representation Ppt PowerPoint Presentation Professional Brochure
This is a 6 piece pie chart for data representation ppt powerpoint presentation professional brochure. This is a six stage process. The stages in this process are 6 piece pie chart, 6 segment pie chart, 6 parts pie chart.
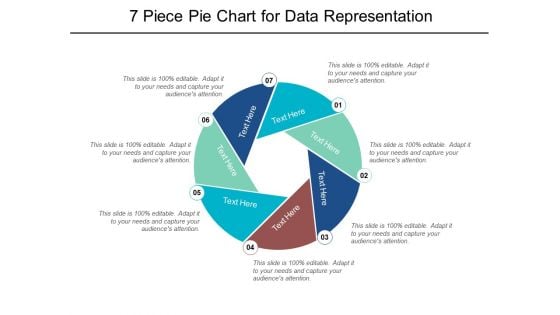
7 Piece Pie Chart For Data Representation Ppt PowerPoint Presentation Portfolio Graphics
This is a 7 piece pie chart for data representation ppt powerpoint presentation portfolio graphics. This is a seven stage process. The stages in this process are 6 piece pie chart, 6 segment pie chart, 6 parts pie chart.
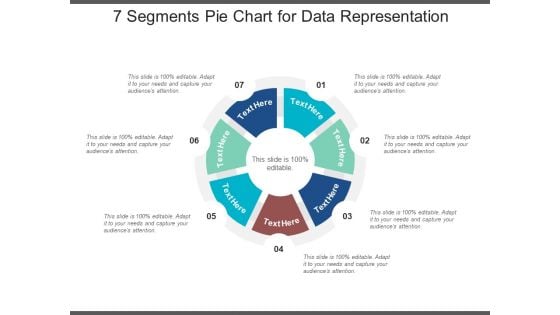
7 Segments Pie Chart For Data Representation Ppt PowerPoint Presentation Styles Summary
This is a 7 segments pie chart for data representation ppt powerpoint presentation styles summary. This is a seven stage process. The stages in this process are 6 piece pie chart, 6 segment pie chart, 6 parts pie chart.
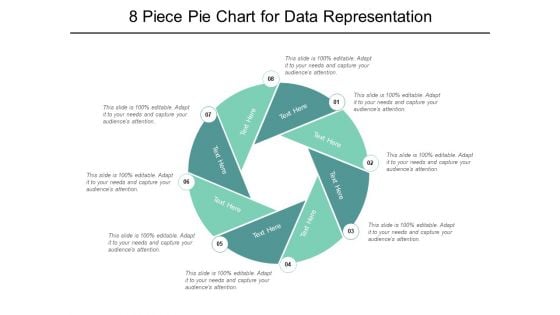
8 Piece Pie Chart For Data Representation Ppt PowerPoint Presentation Ideas
This is a 8 piece pie chart for data representation ppt powerpoint presentation ideas. This is a eight stage process. The stages in this process are 6 piece pie chart, 6 segment pie chart, 6 parts pie chart.
Histogram Column Chart With Red Arrow Vector Icon Ppt PowerPoint Presentation Outline Ideas Cpb
This is a histogram column chart with red arrow vector icon ppt powerpoint presentation outline ideas cpb. This is a three stage process. The stages in this process are bar chart icon, bar graph icon, data chart icon.
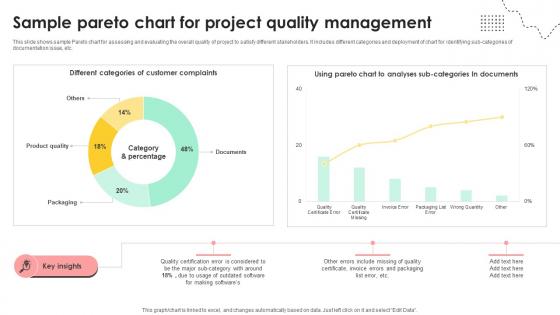
Administering Quality Assurance Sample Pareto Chart For Project Quality Management PM SS V
This slide shows sample Pareto chart for assessing and evaluating the overall quality of project to satisfy different stakeholders. It includes different categories and deployment of chart for identifying sub-categories of documentation issue, etc. Slidegeeks is here to make your presentations a breeze with Administering Quality Assurance Sample Pareto Chart For Project Quality Management PM SS V With our easy-to-use and customizable templates, you can focus on delivering your ideas rather than worrying about formatting. With a variety of designs to choose from, you are sure to find one that suits your needs. And with animations and unique photos, illustrations, and fonts, you can make your presentation pop. So whether you are giving a sales pitch or presenting to the board, make sure to check out Slidegeeks first This slide shows sample Pareto chart for assessing and evaluating the overall quality of project to satisfy different stakeholders. It includes different categories and deployment of chart for identifying sub-categories of documentation issue, etc.
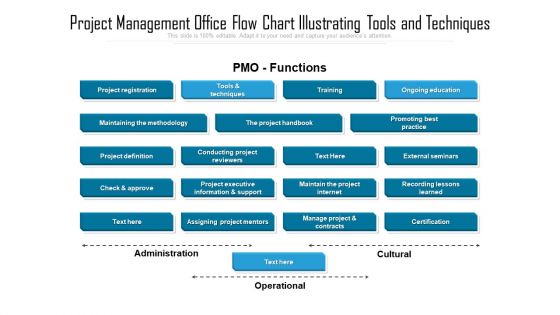
Project Management Office Flow Chart Illustrating Tools And Techniques Slides PDF
Presenting project management office flow chart illustrating tools and techniques slides pdf to dispense important information. This template comprises one stage. It also presents valuable insights into the topics including promoting best practice, project executive information, project internet. This is a completely customizable PowerPoint theme that can be put to use immediately. So, download it and address the topic impactfully.
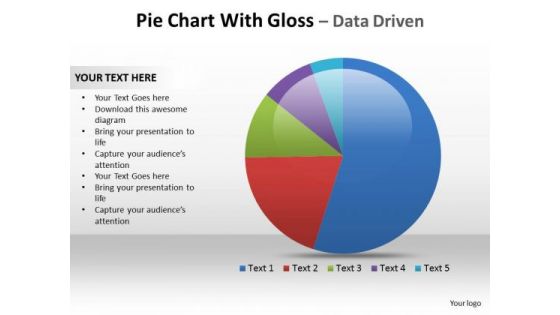
Business Marketing PowerPoint Templates Business Pie Chart With Gloss Ppt Slides
Business Marketing PowerPoint Templates Business pie chart with gloss PPT Slides-This PowerPoint pie chart template is fully data driven. The designer 3D pie charts are bevelled. Borders and gloss are added to some of the pie graphs to add that extra impact. -Business Marketing PowerPoint Templates Business pie chart with gloss PPT Slides-This ppt can be used for concepts relating to- pie graphs, pie charts and donut charts. Make them smell the coffee with our Business Marketing PowerPoint Templates Business Pie Chart With Gloss Ppt Slides. Help them come to the correct conclusion.
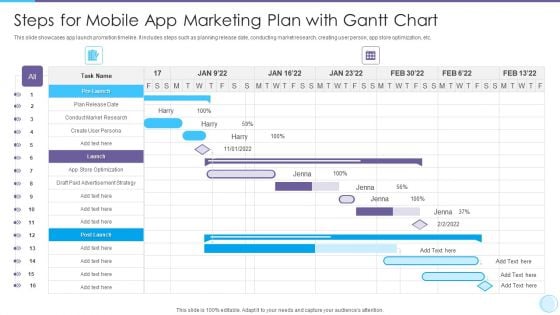
Steps For Mobile App Marketing Plan With Gantt Chart Rules PDF
Your complex projects can be managed and organized simultaneously using this detailed Steps For Mobile App Marketing Plan With Gantt Chart Rules PDF template. Track the milestones, tasks, phases, activities, and subtasks to get an updated visual of your project. Share your planning horizon and release plan with this well crafted presentation template. This exemplary template can be used to plot various dependencies to distinguish the tasks in the pipeline and their impact on the schedules and deadlines of the project. Apart from this, you can also share this visual presentation with your team members and stakeholders. It a resourceful tool that can be incorporated into your business structure. Therefore, download and edit it conveniently to add the data and statistics as per your requirement
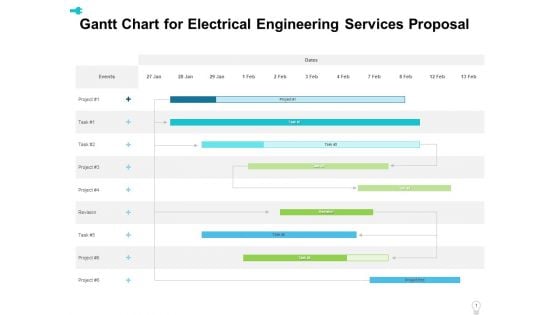
Gantt Chart For Electrical Engineering Services Proposal Ppt Layouts Layout PDF
Your complex projects can be managed and organized simultaneously using this detailed gantt chart for electrical engineering services proposal ppt layouts layout pdf template. Track the milestones, tasks, phases, activities, and subtasks to get an updated visual of your project. Share your planning horizon and release plan with this well-crafted presentation template. This exemplary template can be used to plot various dependencies to distinguish the tasks in the pipeline and their impact on the schedules and deadlines of the project. Apart from this, you can also share this visual presentation with your team members and stakeholders. It a resourceful tool that can be incorporated into your business structure. Therefore, download and edit it conveniently to add the data and statistics as per your requirement.
Sample Pareto Chart For Project Quality Management Executing Quality Ppt Slides PM SS V
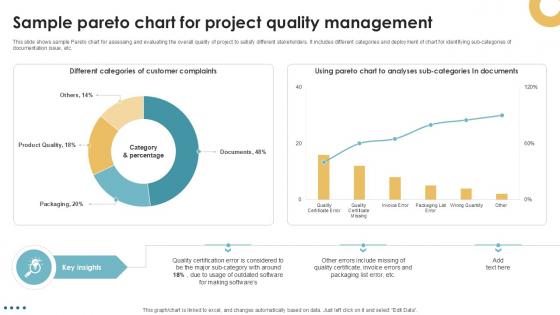
This slide shows sample Pareto chart for assessing and evaluating the overall quality of project to satisfy different stakeholders. It includes different categories and deployment of chart for identifying sub categories of documentation issue, etc. Find highly impressive Sample Pareto Chart For Project Quality Management Executing Quality Ppt Slides PM SS V on Slidegeeks to deliver a meaningful presentation. You can save an ample amount of time using these presentation templates. No need to worry to prepare everything from scratch because Slidegeeks experts have already done a huge research and work for you. You need to download Sample Pareto Chart For Project Quality Management Executing Quality Ppt Slides PM SS V for your upcoming presentation. All the presentation templates are 100 percent editable and you can change the color and personalize the content accordingly. Download now This slide shows sample Pareto chart for assessing and evaluating the overall quality of project to satisfy different stakeholders. It includes different categories and deployment of chart for identifying sub categories of documentation issue, etc.
One Page For Reconstructing Roster And NFL Depth Chart PDF Document PPT Template
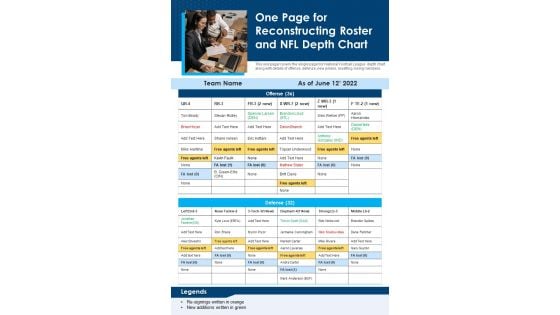
Heres a predesigned One Page For Reconstructing Roster And NFL Depth Chart PDF Document PPT Template for you. Built on extensive research and analysis, this one-pager template has all the centerpieces of your specific requirements. This temple exudes brilliance and professionalism. Being completely editable, you can make changes to suit your purpose. Get this One Page For Reconstructing Roster And NFL Depth Chart PDF Document PPT Template Download now.
Pie Chart Business Diagram 10 Stages Ppt Plan Example PowerPoint Templates
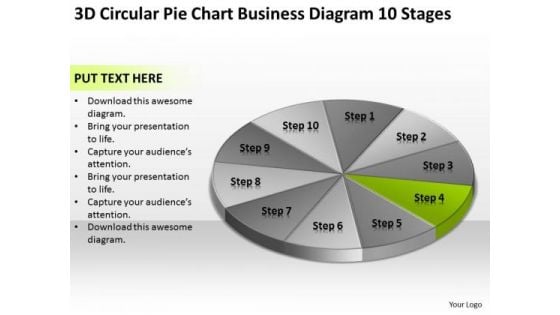
We present our pie chart business diagram 10 stages ppt plan example PowerPoint templates.Download our Flow Charts PowerPoint Templates because Our PowerPoint Templates and Slides ensures Effective communication. They help you put across your views with precision and clarity. Download our Process and Flows PowerPoint Templates because It is Aesthetically crafted by artistic young minds. Our PowerPoint Templates and Slides are designed to display your dexterity. Download our Marketing PowerPoint Templates because You are an avid believer in ethical practices. Highlight the benefits that accrue with our PowerPoint Templates and Slides. Download and present our Business PowerPoint Templates because Our PowerPoint Templates and Slides ensures Effective communication. They help you put across your views with precision and clarity. Present our Shapes PowerPoint Templates because Our PowerPoint Templates and Slides will let your team Walk through your plans. See their energy levels rise as you show them the way.Use these PowerPoint slides for presentations relating to Graph, icon, market, isolated, statistics, percent, economics, ten, economy, display, business, render, success, presentation,diagram, circle, data, analyst, analysis, bank, report, calculation, accounting, trend, illustration, three, piece, pie, circular, chart, money, dimensional, clipart,accountant, growth, colorful, competition, account, stats, profit, part, information, background, improvement, financial. The prominent colors used in the PowerPoint template are White, Green, Black. Convey your message in an exact manner. Enable accuracy with our Pie Chart Business Diagram 10 Stages Ppt Plan Example PowerPoint Templates.
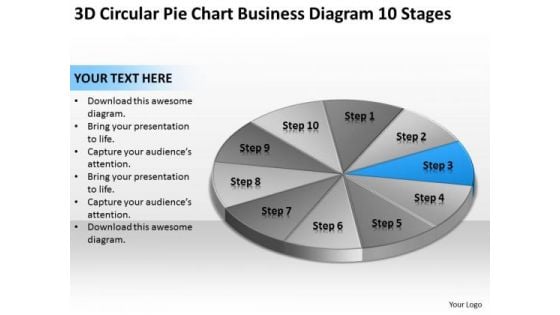
Chart Business Diagram 10 Stages Ppt Non Profit Plan Template PowerPoint Slides
We present our chart business diagram 10 stages ppt non profit plan template PowerPoint Slides.Use our Process and Flows PowerPoint Templates because You should Ascend the ladder of success with ease. Our PowerPoint Templates and Slides will provide strong and sturdy steps. Use our Circle Charts PowerPoint Templates because you should Whip up a frenzy with our PowerPoint Templates and Slides. They will fuel the excitement of your team. Use our Business PowerPoint Templates because Timeline crunches are a fact of life. Meet all deadlines using our PowerPoint Templates and Slides. Download and present our Marketing PowerPoint Templates because Our PowerPoint Templates and Slides are topically designed to provide an attractive backdrop to any subject. Download and present our Shapes PowerPoint Templates because you can Add colour to your speech with our PowerPoint Templates and Slides. Your presentation will leave your audience speechless.Use these PowerPoint slides for presentations relating to Chart, pie, graph, market, economics, economy, target, business, concept, success, diagram, circle, percentage, graphic, finance, revenue, element, analysis, report, marketing, modern, illustration, icon, earnings,, growth, ratio, progress, credit, commerce, statistic. The prominent colors used in the PowerPoint template are Blue , Gray, Black. Everyday there is a new way. Stay contemporary with our Chart Business Diagram 10 Stages Ppt Non Profit Plan Template PowerPoint Slides.
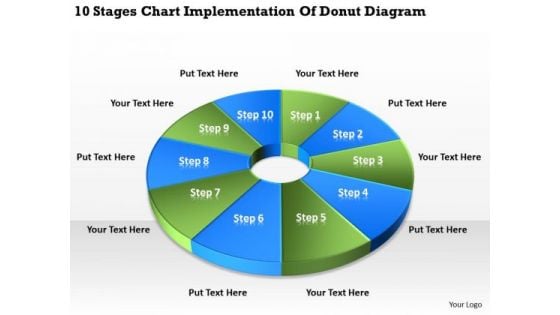
10 Stages Chart Implementation Of Donut Diagram Ppt Need Business Plan PowerPoint Templates
We present our 10 stages chart implementation of donut diagram ppt need business plan PowerPoint templates.Download and present our Communication PowerPoint Templates because Our PowerPoint Templates and Slides will let your team Walk through your plans. See their energy levels rise as you show them the way. Use our Advertising PowerPoint Templates because You can safely bank on our PowerPoint Templates and Slides. They will provide a growth factor to your valuable thoughts. Present our Circle Charts PowerPoint Templates because It can Conjure up grand ideas with our magical PowerPoint Templates and Slides. Leave everyone awestruck by the end of your presentation. Download our Business PowerPoint Templates because It is Aesthetically crafted by artistic young minds. Our PowerPoint Templates and Slides are designed to display your dexterity. Download our Shapes PowerPoint Templates because Watching this your Audience will Grab their eyeballs, they wont even blink.Use these PowerPoint slides for presentations relating to Chart, business, donut, market, sales, document, economy, display, corporate, income, concept, success, presentation, symbol, diagram, percentage, graphic, finance, analysis, report, marketing, accounting, management, graph, forecast, design, growth, competition, progress, profit, information, trade, investment, statistic, financial, infographics, 3d. The prominent colors used in the PowerPoint template are Green, White, Blue. Your ideas deserve the best accessories. Our 10 Stages Chart Implementation Of Donut Diagram Ppt Need Business Plan PowerPoint Templates are a shining example.
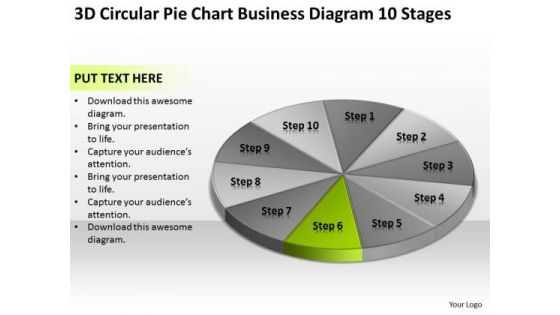
Pie Chart Business Diagram 10 Stages Creating Small Plan PowerPoint Slides
We present our pie chart business diagram 10 stages creating small plan PowerPoint Slides.Present our Flow Charts PowerPoint Templates because Our PowerPoint Templates and Slides will provide you a launch platform. Give a lift off to your ideas and send them into orbit. Present our Process and Flows PowerPoint Templates because Our PowerPoint Templates and Slides will give good value for money. They also have respect for the value of your time. Present our Marketing PowerPoint Templates because Our PowerPoint Templates and Slides will fulfill your every need. Use them and effectively satisfy the desires of your audience. Use our Business PowerPoint Templates because It will mark the footprints of your journey. Illustrate how they will lead you to your desired destination. Download our Shapes PowerPoint Templates because They will bring a lot to the table. Their alluring flavours will make your audience salivate.Use these PowerPoint slides for presentations relating to Graph, icon, market, isolated, statistics, percent, economics, ten, economy, display, business, render, success, presentation,diagram, circle, data, analyst, analysis, bank, report, calculation, accounting, trend, illustration, three, piece, pie, circular, chart, money, dimensional, clipart,accountant, growth, colorful, competition, account, stats, profit, part, information, background, improvement, financial. The prominent colors used in the PowerPoint template are Gray, Green, Black. Go to any extent with our Pie Chart Business Diagram 10 Stages Creating Small Plan PowerPoint Slides. Whatever the distance they will cover it with you.
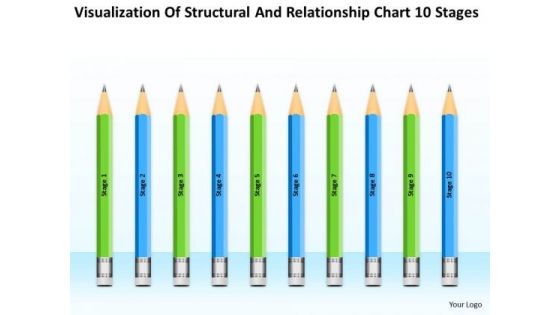
Structural And Relationship Chart 10 Stages Ppt One Page Business Plan PowerPoint Templates
We present our structural and relationship chart 10 stages ppt one page business plan PowerPoint templates.Download and present our Business PowerPoint Templates because Our PowerPoint Templates and Slides will fulfill your every need. Use them and effectively satisfy the desires of your audience. Download and present our Flow Charts PowerPoint Templates because Our PowerPoint Templates and Slides are conceived by a dedicated team. Use them and give form to your wondrous ideas. Download and present our Shapes PowerPoint Templates because It can Bubble and burst with your ideas. Use our Marketing PowerPoint Templates because You have a driving passion to excel in your field. Our PowerPoint Templates and Slides will prove ideal vehicles for your ideas. Download and present our Process and Flows PowerPoint Templates because Our PowerPoint Templates and Slides are created by a hardworking bunch of busybees. Always flitting around with solutions gauranteed to please.Use these PowerPoint slides for presentations relating to Market, isolated, rate, mark, corporate, row, business, plan, concept, bright, symbol, diagram, crayon, stack, graphic, finance, stock,analysis, drawing, paint, calculation, accounting, creative, economic, creativity, chart, forecast, design, color, objects, stationary, pencil, education,profit, information, background, investment, figures, rainbow, financial, artist, capital, business, business process. The prominent colors used in the PowerPoint template are Green, Blue, Black. Be productive with our Structural And Relationship Chart 10 Stages Ppt One Page Business Plan PowerPoint Templates. You will come out on top.
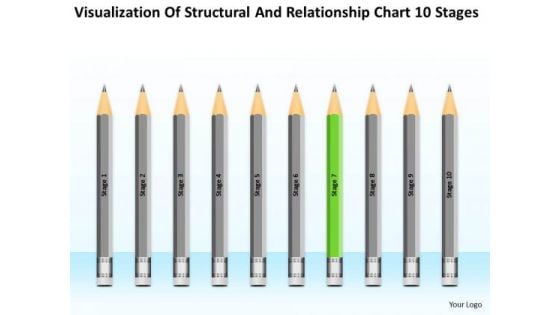
Structural And Relationship Chart 10 Stages Ppt Help With Business Plan PowerPoint Templates
We present our structural and relationship chart 10 stages ppt help with business plan PowerPoint templates.Use our Education PowerPoint Templates because You are an avid believer in ethical practices. Highlight the benefits that accrue with our PowerPoint Templates and Slides. Download our Process and Flows PowerPoint Templates because You can Double your output with our PowerPoint Templates and Slides. They make beating deadlines a piece of cake. Use our Flow Charts PowerPoint Templates because It is Aesthetically crafted by artistic young minds. Our PowerPoint Templates and Slides are designed to display your dexterity. Use our Marketing PowerPoint Templates because You can Connect the dots. Fan expectations as the whole picture emerges. Download and present our Business PowerPoint Templates because Our PowerPoint Templates and Slides will let you Clearly mark the path for others to follow.Use these PowerPoint slides for presentations relating to Mark, corporate, business, plan, concept, bright, symbol, diagram, crayon, stack, graphic, finance, stock,analysis, drawing, paint, calculation, accounting, creative, economic, creativity, chart, forecast, design, color, objects, stationary, pencil, education,profit, information, background, investment, figures, ten, business, business process. The prominent colors used in the PowerPoint template are Black, Green, Gray. Preach the value of good business ethics. Our Structural And Relationship Chart 10 Stages Ppt Help With Business Plan PowerPoint Templates will keep the faith.
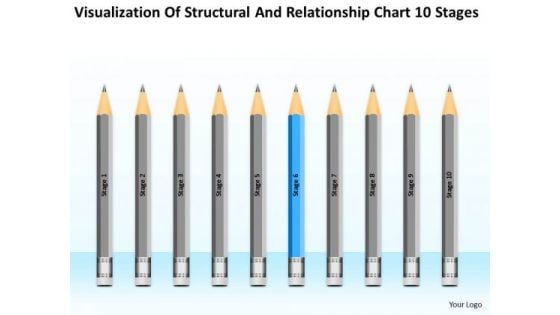
Structural And Relationship Chart 10 Stages Ppt Samples Business Plan PowerPoint Slides
We present our structural and relationship chart 10 stages ppt samples business plan PowerPoint Slides.Download and present our Education PowerPoint Templates because You can Score a slam dunk with our PowerPoint Templates and Slides. Watch your audience hang onto your every word. Download and present our Process and Flows PowerPoint Templates because Our PowerPoint Templates and Slides help you pinpoint your timelines. Highlight the reasons for your deadlines with their use. Use our Flow Charts PowerPoint Templates because our PowerPoint Templates and Slides are the string of your bow. Fire of your ideas and conquer the podium. Download and present our Marketing PowerPoint Templates because You can Bait your audience with our PowerPoint Templates and Slides. They will bite the hook of your ideas in large numbers. Download our Business PowerPoint Templates because You can Zap them with our PowerPoint Templates and Slides. See them reel under the impact.Use these PowerPoint slides for presentations relating to Mark, corporate, business, plan, concept, bright, symbol, diagram, crayon, stack, graphic, finance, stock,analysis, drawing, paint, calculation, accounting, creative, economic, creativity, chart, forecast, design, color, objects, stationary, pencil, education,profit, information, background, investment, figures, ten, business, business process. The prominent colors used in the PowerPoint template are Blue, Gray, Black. Flood your audience with great slides with our Structural And Relationship Chart 10 Stages Ppt Samples Business Plan PowerPoint Slides. Try us out and see what a difference our templates make.
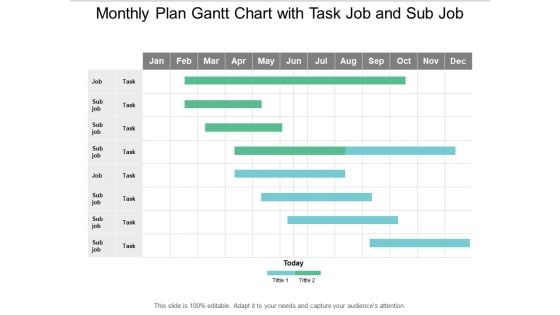
Monthly Plan Gantt Chart With Task Job And Sub Job Ppt PowerPoint Presentation Infographic Template Mockup
This is a monthly plan gantt chart with task job and sub job ppt powerpoint presentation infographic template mockup. The topics discussed in this diagram are critical path method, critical path analysis, cpm. This is a completely editable PowerPoint presentation, and is available for immediate download.


 Continue with Email

 Home
Home


