Chart Analysis
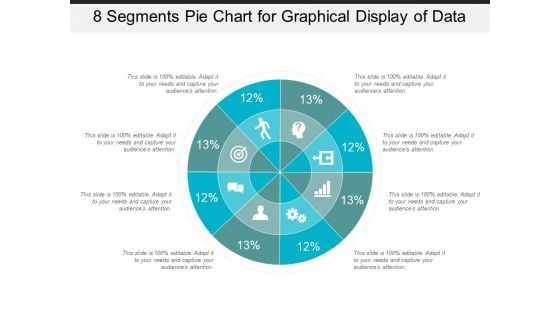
8 Segments Pie Chart For Graphical Display Of Data Ppt PowerPoint Presentation Infographic Template Templates
This is a 8 segments pie chart for graphical display of data ppt powerpoint presentation infographic template templates. This is a eight stage process. The stages in this process are 6 piece pie chart, 6 segment pie chart, 6 parts pie chart.
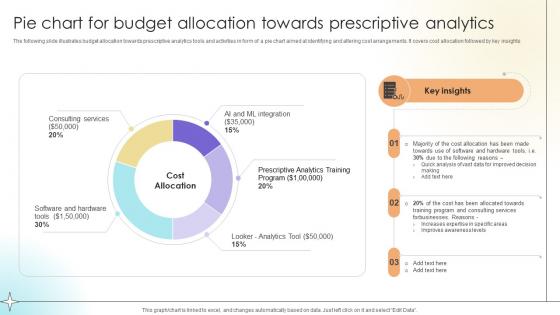
Pie Chart For Budget Allocation Towards Prescriptive Analytics Data Analytics SS V
The following slide illustrates budget allocation towards prescriptive analytics tools and activities in form of a pie chart aimed at identifying and altering cost arrangements. It covers cost allocation followed by key insights.Coming up with a presentation necessitates that the majority of the effort goes into the content and the message you intend to convey. The visuals of a PowerPoint presentation can only be effective if it supplements and supports the story that is being told. Keeping this in mind our experts created Pie Chart For Budget Allocation Towards Prescriptive Analytics Data Analytics SS V to reduce the time that goes into designing the presentation. This way, you can concentrate on the message while our designers take care of providing you with the right template for the situation. The following slide illustrates budget allocation towards prescriptive analytics tools and activities in form of a pie chart aimed at identifying and altering cost arrangements. It covers cost allocation followed by key insights.
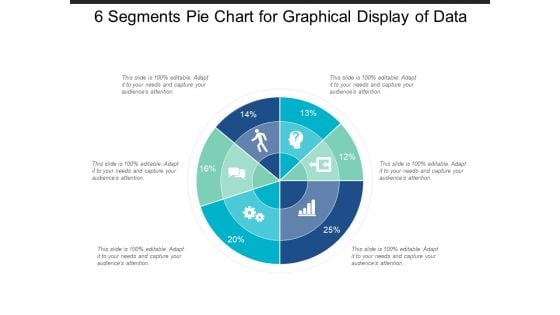
6 Segments Pie Chart For Graphical Display Of Data Ppt PowerPoint Presentation Portfolio Rules
This is a 6 segments pie chart for graphical display of data ppt powerpoint presentation portfolio rules. This is a six stage process. The stages in this process are 6 piece pie chart, 6 segment pie chart, 6 parts pie chart.

7 Segments Pie Chart For Graphical Display Of Data Ppt PowerPoint Presentation Model Elements
This is a 7 segments pie chart for graphical display of data ppt powerpoint presentation model elements. This is a seven stage process. The stages in this process are 6 piece pie chart, 6 segment pie chart, 6 parts pie chart.
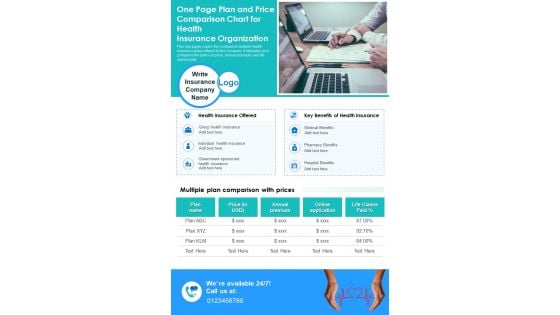
One Page Plan And Price Comparison Chart For Health Insurance Organization PDF Document PPT Template
Heres a predesigned One Page Plan And Price Comparison Chart For Health Insurance Organization PDF Document PPT Template for you. Built on extensive research and analysis, this one-pager template has all the centerpieces of your specific requirements. This temple exudes brilliance and professionalism. Being completely editable, you can make changes to suit your purpose. Get this One Page Plan And Price Comparison Chart For Health Insurance Organization PDF Document PPT Template Download now.
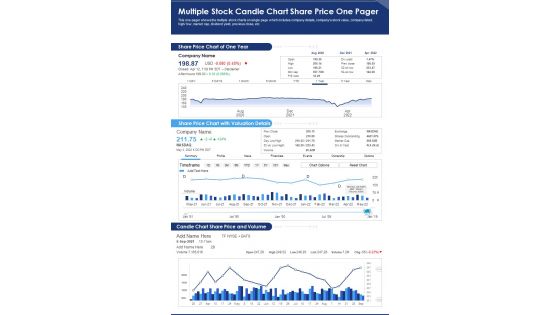
Multiple Stock Candle Chart Share Price One Pager PDF Document PPT Template
Heres a predesigned Multiple Stock Candle Chart Share Price One Pager PDF Document PPT Template for you. Built on extensive research and analysis, this one-pager template has all the centerpieces of your specific requirements. This temple exudes brilliance and professionalism. Being completely editable, you can make changes to suit your purpose. Get this Multiple Stock Candle Chart Share Price One Pager PDF Document PPT Template Download now.
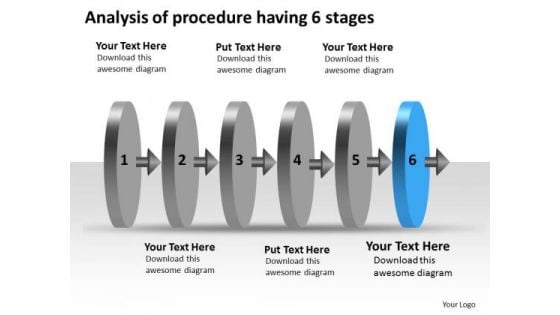
Of Procedure Having 6 Stages Ppt Technical Support Process Flow Chart PowerPoint Templates
We present our of procedure having 6 stages ppt technical support process flow chart PowerPoint templates.Present our Leadership PowerPoint Templates because this diagram can be used to illustrate the logical path or system. Download and present our Arrows PowerPoint Templates because this slide depicts the occasion for gifting and giving. Use our Process and Flows PowerPoint Templates because you will be able to Highlight the various ways in which we can maintain its efficiency. Download our Business PowerPoint Templates because your product has established a foothold in the market. Customers are happy with the value it brings to their lives. Present our Circle Charts PowerPoint Templates because you can Bullet-point your thoughts and ideas to profitably accomplish every step of every stage along the way.Use these PowerPoint slides for presentations relating to Analysis, Analyze, Argument, Argumentation, Black, Business, Calculation, Concept, Criticism, Critique, Detection, Discussion, Dispute, Examination, Experiment, Interpretation, Interview, Know, Learning, Loupe, Magnification, Magnify, Magnifying, Operation, Problem, Procedure, Strategy, Technical, Verification. The prominent colors used in the PowerPoint template are Blue, Gray, Black. People tell us our of procedure having 6 stages ppt technical support process flow chart PowerPoint templates are Stunning. PowerPoint presentation experts tell us our Calculation PowerPoint templates and PPT Slides are Luxuriant. Presenters tell us our of procedure having 6 stages ppt technical support process flow chart PowerPoint templates are Efficient. The feedback we get is that our Black PowerPoint templates and PPT Slides provide you with a vast range of viable options. Select the appropriate ones and just fill in your text. You can be sure our of procedure having 6 stages ppt technical support process flow chart PowerPoint templates look good visually. Professionals tell us our Argument PowerPoint templates and PPT Slides are Luxuriant. Creat an attractive presentation with our Of Procedure Having 6 Stages Ppt Technical Support Process Flow Chart PowerPoint Templates. Dont pass up this opportunity to shine.
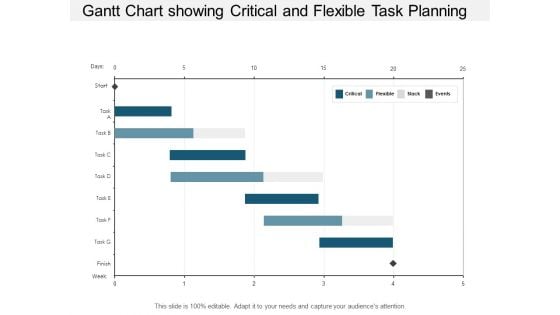
Gantt Chart Showing Critical And Flexible Task Planning Ppt PowerPoint Presentation Model Shapes
This is a gantt chart showing critical and flexible task planning ppt powerpoint presentation model shapes. The topics discussed in this diagram are critical path method, critical path analysis, cpm. This is a completely editable PowerPoint presentation, and is available for immediate download.
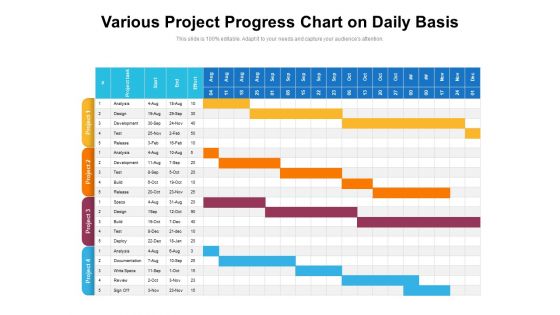
Various Project Progress Chart On Daily Basis Ppt PowerPoint Presentation Gallery Brochure PDF
Showcasing this set of slides titled various project progress chart on daily basis ppt powerpoint presentation gallery brochure pdf. The topics addressed in these templates are analysis, development, design. All the content presented in this PPT design is completely editable. Download it and make adjustments in color, background, font etc. as per your unique business setting.
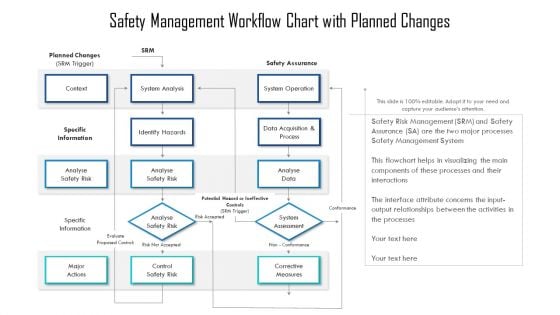
Safety Management Workflow Chart With Planned Changes Ppt PowerPoint Presentation Pictures Graphics PDF
Showcasing this set of slides titled safety management workflow chart with planned changes ppt powerpoint presentation pictures graphics pdf. The topics addressed in these templates are identify hazards, analyse safety risk, system analysis. All the content presented in this PPT design is completely editable. Download it and make adjustments in color, background, font etc. as per your unique business setting.
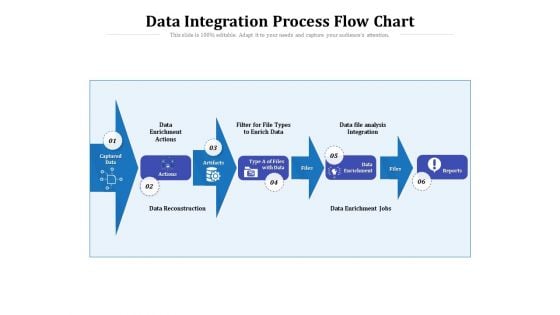
Data Integration Process Flow Chart Ppt PowerPoint Presentation File Templates PDF
Presenting this set of slides with name data integration process flow chart ppt powerpoint presentation file templates pdf. This is a six stage process. The stages in this process are actions, integration, analysis. This is a completely editable PowerPoint presentation and is available for immediate download. Download now and impress your audience.
Software Comparison Chart With Features Ppt PowerPoint Presentation Icon Slide Download
Presenting this set of slides with name software comparison chart with features ppt powerpoint presentation icon slide download. The topics discussed in these slides are linux operating system, cloud storage, realtime data analysis. This is a completely editable PowerPoint presentation and is available for immediate download. Download now and impress your audience.
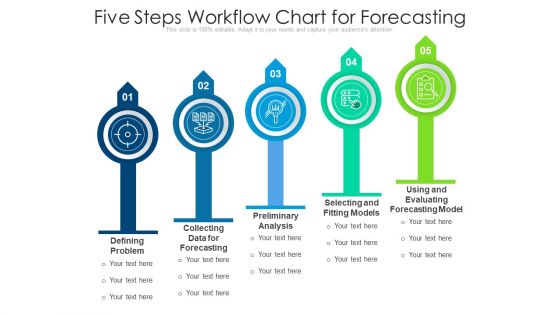
Five Steps Workflow Chart For Forecasting Ppt PowerPoint Presentation Outline Designs Download PDF
Presenting five steps workflow chart for forecasting ppt powerpoint presentation outline designs download pdf to dispense important information. This template comprises five stages. It also presents valuable insights into the topics including collecting data for forecasting, preliminary analysis, selecting and fitting models. This is a completely customizable PowerPoint theme that can be put to use immediately. So, download it and address the topic impactfully.
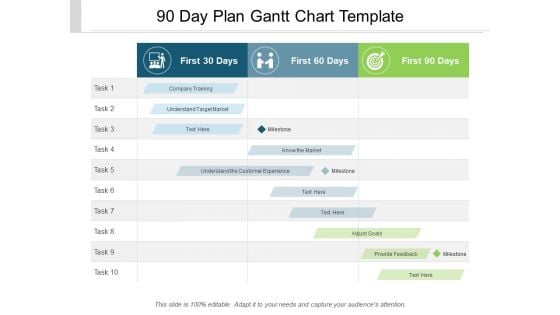
90 Day Plan Gantt Chart Template Ppt PowerPoint Presentation Outline Graphics
Presenting this set of slides with name 90 day plan gantt chart template ppt powerpoint presentation outline graphics. The topics discussed in these slides are 30 60 90 action plan, business analysis, business strategy. This is a completely editable PowerPoint presentation and is available for immediate download. Download now and impress your audience.
AAR Process Chart Activity Begin End Ppt PowerPoint Presentation File Icon
Presenting this set of slides with name aar process chart activity begin end ppt powerpoint presentation file icon. The topics discussed in these slides are after action review, performance analysis, future performances. This is a completely editable PowerPoint presentation and is available for immediate download. Download now and impress your audience.
Employee Orientation Workflow Chart With Outcome Ppt PowerPoint Presentation Icon Inspiration PDF
Presenting this set of slides with name employee orientation workflow chart with outcome ppt powerpoint presentation icon inspiration pdf. The topics discussed in these slides are analysis, knowledge, validation. This is a completely editable PowerPoint presentation and is available for immediate download. Download now and impress your audience.
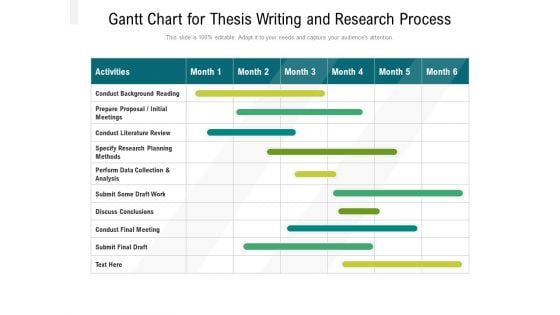
Gantt Chart For Thesis Writing And Research Process Ppt PowerPoint Presentation Gallery Show PDF
Presenting this set of slides with name gantt chart for thesis writing and research process ppt powerpoint presentation gallery show pdf. The topics discussed in these slides are planning, data collection, analysis. This is a completely editable PowerPoint presentation and is available for immediate download. Download now and impress your audience.
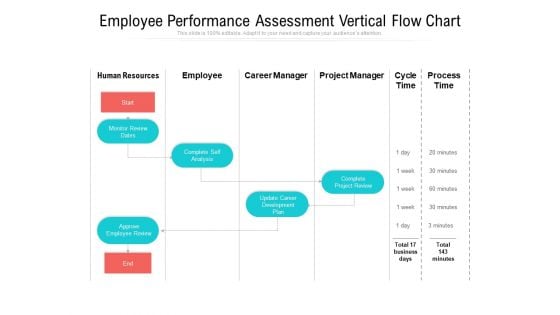
Employee Performance Assessment Vertical Flow Chart Ppt PowerPoint Presentation File Slide Download PDF
Presenting employee performance assessment vertical flow chart ppt powerpoint presentation file slide download pdf to dispense important information. This template comprises one stages. It also presents valuable insights into the topics including human resources, analysis, process. This is a completely customizable PowerPoint theme that can be put to use immediately. So, download it and address the topic impactfully.
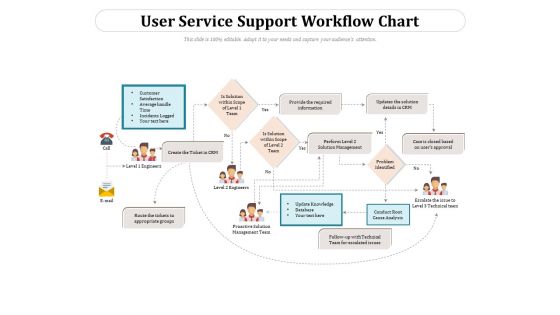
User Service Support Workflow Chart Ppt PowerPoint Presentation Gallery Infographics PDF
Presenting this set of slides with name user service support workflow chart ppt powerpoint presentation gallery infographics pdf. This is a one stage process. The stages in this process are management, technical, analysis. This is a completely editable PowerPoint presentation and is available for immediate download. Download now and impress your audience.
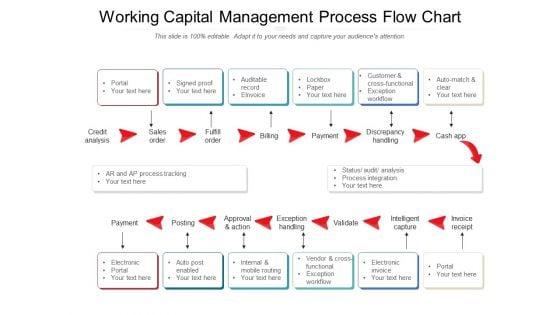
Working Capital Management Process Flow Chart Ppt PowerPoint Presentation File Graphics Pictures PDF
Presenting this set of slides with name working capital management process flow chart ppt powerpoint presentation file graphics pictures pdf. This is a twelve stage process. The stages in this process are analysis, sales, exception. This is a completely editable PowerPoint presentation and is available for immediate download. Download now and impress your audience.
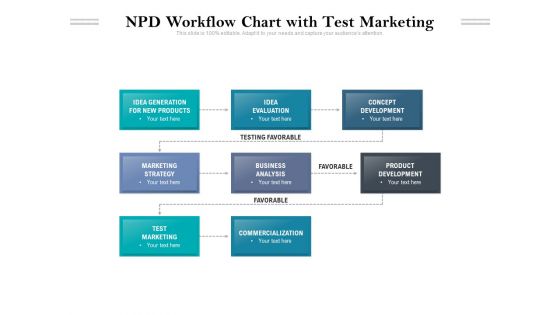
NPD Workflow Chart With Test Marketing Ppt PowerPoint Presentation File Aids PDF
Presenting this set of slides with name npd workflow chart with test marketing ppt powerpoint presentation file aids pdf. This is a eight stage process. The stages in this process are development, evaluation, analysis. This is a completely editable PowerPoint presentation and is available for immediate download. Download now and impress your audience.
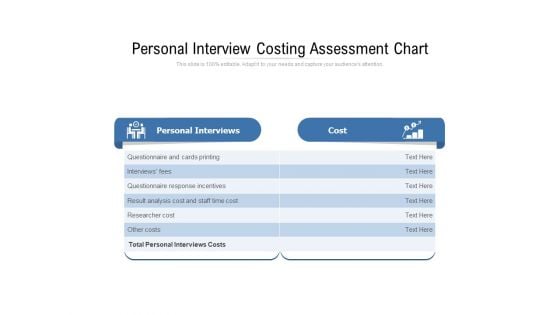
Personal Interview Costing Assessment Chart Ppt PowerPoint Presentation File Graphics Template PDF
Showcasing this set of slides titled personal interview costing assessment chart ppt powerpoint presentation file graphics template pdf. The topics addressed in these templates are analysis, cost, researcher. All the content presented in this PPT design is completely editable. Download it and make adjustments in color, background, font etc. as per your unique business setting.
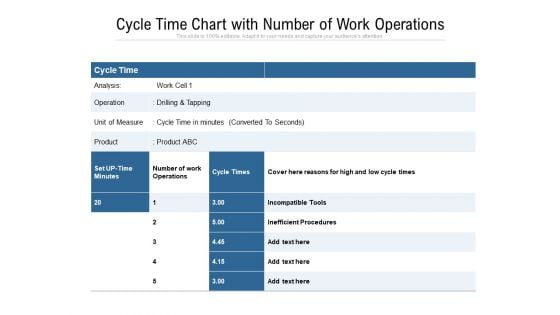
Cycle Time Chart With Number Of Work Operations Ppt PowerPoint Presentation Pictures Information PDF
Pitch your topic with ease and precision using this cycle time chart with number of work operations ppt powerpoint presentation pictures information pdf. This layout presents information on analysis, operation, product, inefficient procedures, drilling and tapping. It is also available for immediate download and adjustment. So, changes can be made in the color, design, graphics or any other component to create a unique layout.
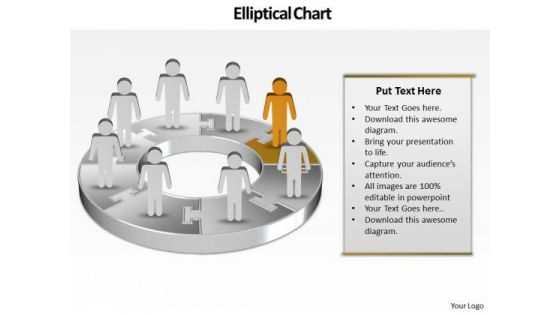
Ppt Team Work Person Presentation Standing Orange Piece Of Chart PowerPoint Templates
PPT team work person presentation standing orange piece of chart PowerPoint Templates-Use this graphical approach to represent global business issues such as financial data, stock market Exchange, increase in sales, corporate presentations and more. Create captivating presentations to deliver comparative and weighted arguments.-PPT team work person presentation standing orange piece of chart PowerPoint Templates-arrow, bar, business, businessman, candidate, cartoon, character, chart, circle, circular, client, communication, company, concept, diagram, finance, financial, flow, growth, human, illustration, increase, information, iteration, man, market, marketing, process, processing, profit, sales, statistics, stats, success, target Bounce back with our Ppt Team Work Person Presentation Standing Orange Piece Of Chart PowerPoint Templates. You will come out on top.
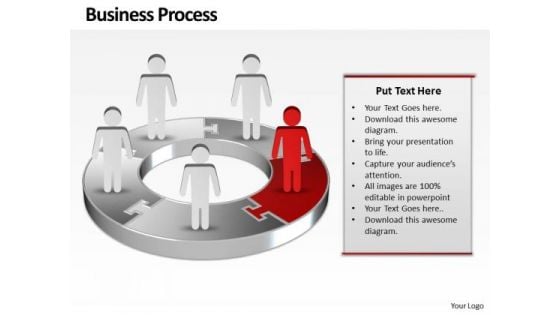
Ppt Red Men Standing On Business PowerPoint Theme Pie Chart Templates
PPT red men standing on business powerpoint theme pie chart Templates-Use this graphical approach to represent global business issues such as financial data, stock market Exchange, increase in sales, corporate presentations and more.-PPT red men standing on business powerpoint theme pie chart Templates-3d, arrow, background, blue, chart, circle, circular, clipart, colorful, connection, continuity, cycle, cyclic, diagram, direction, flow, graph, icon, illustration, isolated, loop, motion, process, progress, recycle, ring, round, step, sticker, symbol, teamwork, template, turn, vector Make a beautiful presentation with our Ppt Red Men Standing On Business PowerPoint Theme Pie Chart Templates. Just download, type and present.
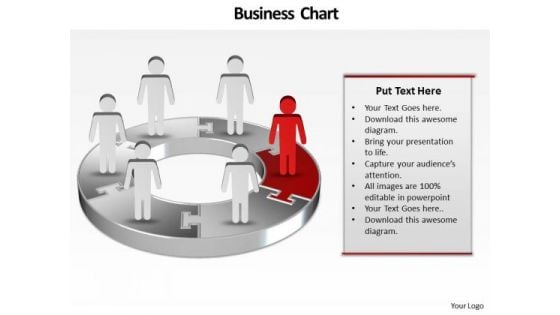
Ppt Illustration Of 3d PowerPoint Bar Chart With Standing Business People Templates
PPT illustration of 3d powerpoint bar chart with standing business people Templates-Develop competitive advantage with our above template which contains a diagram of one pie chart with cartoon men on it.This structure of our templates allows you to effectively highlight the key issues concerning to your business.-PPT illustration of 3d powerpoint bar chart with standing business people Templates-Adult, Art, Background, Business, Career, Chart, Communication, Concept, Conference, Corporate, Creative, Design, Economy, Executive, Finance, Group, Growth, Idea, Illustration, Leadership, Meeting, New, Occupation, Office, People, Person, Progress, Silhouette, Space, Speaking, Standing, Success You have been given an exacting task. Plan your approach with our Ppt Illustration Of 3d PowerPoint Bar Chart With Standing Business People Templates.
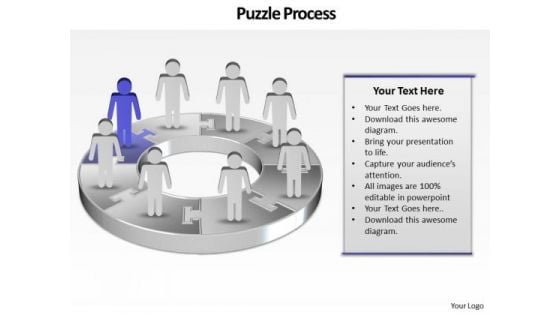
Ppt Group Of People Pie Chart Person Standing Purple Piece PowerPoint Templates
PPT group of people pie chart person standing purple piece PowerPoint Templates-This continual illustration of procedure graphic is a visual representation of your information and ideas. Use this diagram as a method of graphically representing the flow of data as an information processing system.-PPT group of people pie chart person standing purple piece PowerPoint Templates-arrow, bar, business, businessman, candidate, cartoon, character, chart, circle, circular, client, communication, company, concept, diagram, finance, growth, human, illustration, increase, information, marketing, person, presentation, process, profit, sales, stats, success, target Establish your command over the subject. Display your awareness with our Ppt Group Of People Pie Chart Person Standing Purple Piece PowerPoint Templates.
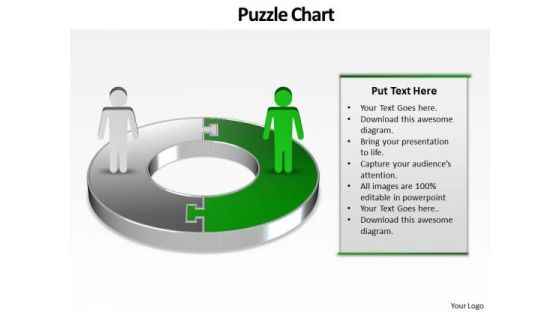
Ppt Green PowerPoint Slide Man On Circular Gantt Chart Template Templates
PPT green powerpoint slide man on circular gantt chart template Templates-This PowerPoint Diagram shows you the Circular way to represent Business components or losses in Business related Activities. This PowerPoint Diagram can be use in Investor presentations for Initial Public Offerings, Annual general meetings and financial seminars.-PPT green powerpoint slide man on circular gantt chart template Templates-abstract, accounting, background, business, businessman, chart, company, connection, corporate, diagram, earnings, finance, forecast, graph, growth, investment, management, network, people, profit, progress, puzzle, shapes, team, technology, vector, wealth Fight down jealousies with our Ppt Green PowerPoint Slide Man On Circular Gantt Chart Template Templates. Make everyone feel equal with your words.
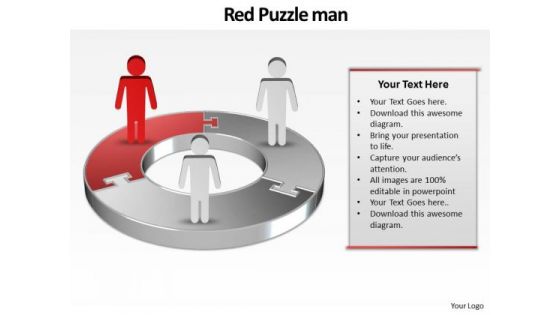
Ppt Red World Business Layouts People Stand On Circular Chart PowerPoint Templates
PPT red world business layouts people stand on circular chart PowerPoint Templates-This 3D PowerPoint Diagram shows the Three interconnected stages represented by first Red Quadrant. It signifies the concept of aspect, attribute, bearing, complexion, component, differentia, disposition, distinction, earmark, essence, essential etc.-PPT red world business layouts people stand on circular chart PowerPoint Templates-abstract, accounting, background, business, businessman, chart, company, connection, corporate, diagram, earnings, finance, forecast, graph, growth, investment, management, network, people, profit, progress, puzzle, shapes, team, technology, vector, wealth Make a powerful statement with our Ppt Red World Business Layouts People Stand On Circular Chart PowerPoint Templates. You'll always stay ahead of the game.
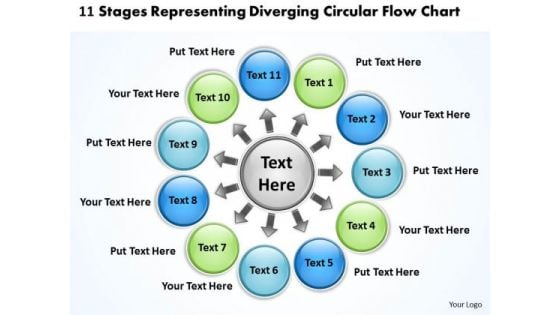
11 Stages Representing Diverging Circular Flow Chart Ppt Cycle Process PowerPoint Templates
We present our 11 stages representing diverging circular flow chart ppt Cycle Process PowerPoint templates.Present our Circle Charts PowerPoint Templates because they will Amplify your basic corporate concept and forefront the benefits of overlapping processes to arrive at common goals. Download and present our Arrows PowerPoint Templates because this slide is an excellent backdrop for you to enlighten your audience on the process you have gone through and the vision you have for the future. Use our Ring Charts PowerPoint Templates because your listeners do not have to put on their thinking caps. Download and present our Business PowerPoint Templates because it helps you to project your enthusiasm and single mindedness to your colleagues. Use our Flow Charts PowerPoint Templates because you have examined every element down to the finest detail.Use these PowerPoint slides for presentations relating to arrows, business, chart, circle, company, concept, continuity, continuous, cycle, dependency, diagram, direction, dynamic, endless, feeds, graph, iteration, iterative, method, path, phase, presentation, process, production, progress, progression, report, rotation, sequence, succession, vector. The prominent colors used in the PowerPoint template are Green, Blue, Gray. Presenters tell us our 11 stages representing diverging circular flow chart ppt Cycle Process PowerPoint templates are Pleasant. You can be sure our cycle PowerPoint templates and PPT Slides will get their audience's attention. Professionals tell us our 11 stages representing diverging circular flow chart ppt Cycle Process PowerPoint templates are Flirty. People tell us our circle PowerPoint templates and PPT Slides will save the presenter time. People tell us our 11 stages representing diverging circular flow chart ppt Cycle Process PowerPoint templates are aesthetically designed to attract attention. We guarantee that they will grab all the eyeballs you need. Professionals tell us our circle PowerPoint templates and PPT Slides are Playful. Be fantastic with our 11 Stages Representing Diverging Circular Flow Chart Ppt Cycle Process PowerPoint Templates. Give a boost to your creativity.
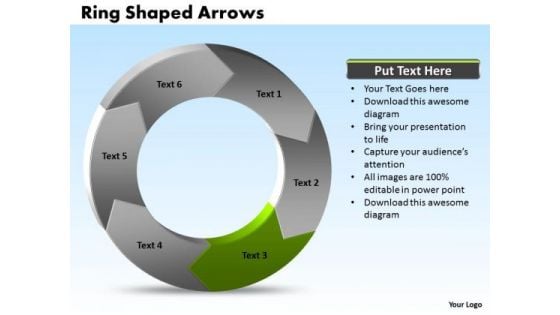
Ppt Power Point Org Chart Shaped Arrows 6 Segments PowerPoint Templates
PPT power point org chart shaped arrows 6 segments PowerPoint Templates-This Organizational chart makes information accessible throughout the organization with a collective, visible view of critical data from different perspectives and providing the tools to upcoming business scenarios and plan for change.-PPT power point org chart shaped arrows 6 segments PowerPoint Templates-Abstract, Around, Arrow, Arrow Circles, Chart, Circle, Circular, Circular Arrows, Circular Flow, Circulation, Cycle, Cyclic, Direction, Element, Flow, Icon, Illustration, Isolated, Motion, Movement, Refresh, Ring, Rotation, Round, Section, Set, Shape, Sign, Symbol Cash in on a bargain with our Ppt Power Point Org Chart Shaped Arrows 6 Segments PowerPoint Templates. Dont pass up this opportunity to shine.
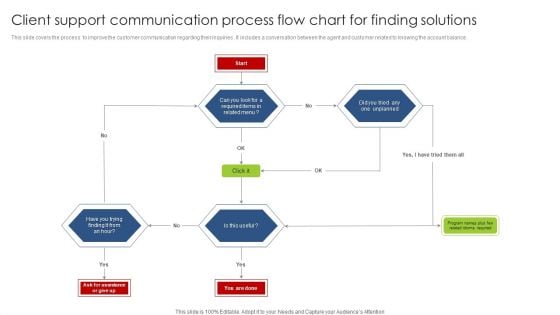
Client Support Communication Process Flow Chart For Finding Solutions Brochure PDF
This slide covers the process to improve the customer communication regarding their inquiries . It includes a conversation between the agent and customer related to knowing the account balance. Persuade your audience using this Client Support Communication Process Flow Chart For Finding Solutions Brochure PDF. This PPT design covers one stages, thus making it a great tool to use. It also caters to a variety of topics including Client Support Communication Process, Flow Chart For Finding Solutions. Download this PPT design now to present a convincing pitch that not only emphasizes the topic but also showcases your presentation skills.
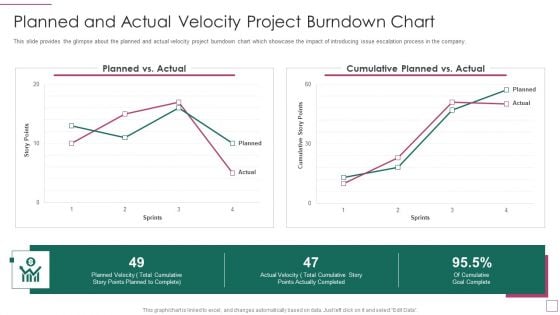
Approach Avoidance Conflict Planned And Actual Velocity Project Burndown Chart Structure PDF
This slide provides the glimpse about the planned and actual velocity project burndown chart which showcase the impact of introducing issue escalation process in the company. Deliver an awe inspiring pitch with this creative approach avoidance conflict planned and actual velocity project burndown chart structure pdf bundle. Topics like planned and actual velocity project burndown chart can be discussed with this completely editable template. It is available for immediate download depending on the needs and requirements of the user.
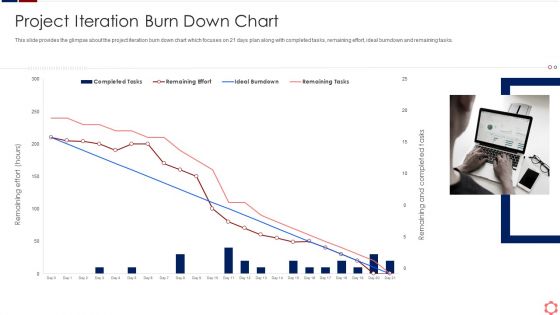
Business Operation Modeling Approaches Project Iteration Burn Down Chart Template PDF
This slide provides the glimpse about the project iteration burn down chart which focuses on 21 days plan along with completed tasks, remaining effort, ideal burndown and remaining tasks.Deliver an awe inspiring pitch with this creative business operation modeling approaches project iteration burn down chart template pdf bundle. Topics like project iteration burn down chart can be discussed with this completely editable template. It is available for immediate download depending on the needs and requirements of the user.
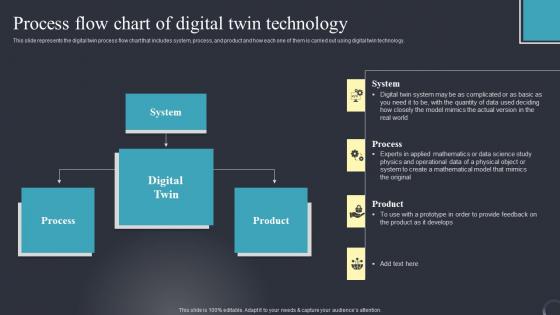
Process Flow Chart Of Digital Twin Industrial Transformation Using Digital Twin Sample Pdf
This slide represents the digital twin process flow chart that includes system, process, and product and how each one of them is carried out using digital twin technology. Here you can discover an assortment of the finest PowerPoint and Google Slides templates. With these templates, you can create presentations for a variety of purposes while simultaneously providing your audience with an eye catching visual experience. Download Process Flow Chart Of Digital Twin Industrial Transformation Using Digital Twin Sample Pdf to deliver an impeccable presentation. These templates will make your job of preparing presentations much quicker, yet still, maintain a high level of quality. Slidegeeks has experienced researchers who prepare these templates and write high quality content for you. Later on, you can personalize the content by editing the Process Flow Chart Of Digital Twin Industrial Transformation Using Digital Twin Sample Pdf. This slide represents the digital twin process flow chart that includes system, process, and product and how each one of them is carried out using digital twin technology.
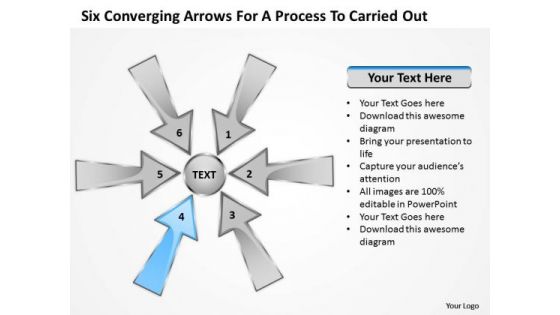
Six Coverging Arrow For Process To Carried Out Circular Chart PowerPoint Slides
We present our six coverging arrow for process to carried out Circular Chart PowerPoint Slides.Download and present our Arrows PowerPoint Templates because you can Focus on each one and investigate which one would be the best fit for your needs. Download and present our Circle Charts PowerPoint Templates because they are the tools that helped most of us evolve. Use our Shapes PowerPoint Templates because our template will help pinpoint their viability. Use our Business PowerPoint Templates because the majestic tiger lord of all it surveys.It exudes power even when it is in repose. Download our Flow Charts PowerPoint Templates because there is a vision, a need you can meet.Use these PowerPoint slides for presentations relating to 6, abstract, arrows, blank, business, central, centralized, chart, circle, circular, circulation, concept, conceptual, converging, design, diagram, empty, executive, icon, idea, illustration, management, map, mapping, mba, model, numbers, organization, outwards, pointing, procedure, process, radial, radiating, relationship, resource, sequence, sequential, six, square, strategy, template. The prominent colors used in the PowerPoint template are Blue, Gray, Black. Presenters tell us our six coverging arrow for process to carried out Circular Chart PowerPoint Slides are Wistful. The feedback we get is that our central PowerPoint templates and PPT Slides are Quaint. Presenters tell us our six coverging arrow for process to carried out Circular Chart PowerPoint Slides are Nice. You can be sure our chart PowerPoint templates and PPT Slides are Dazzling. People tell us our six coverging arrow for process to carried out Circular Chart PowerPoint Slides are Magnificent. PowerPoint presentation experts tell us our blank PowerPoint templates and PPT Slides are Nostalgic. Amend archaic ideas with our Six Coverging Arrow For Process To Carried Out Circular Chart PowerPoint Slides. Ring in desirable changes with your thoughts.
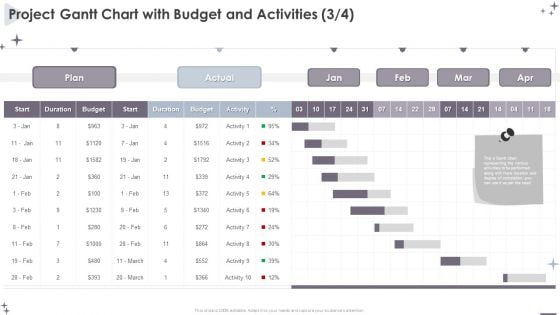
Project Administration Bundle Project Gantt Chart With Budget And Activities Infographics PDF
Your complex projects can be managed and organized simultaneously using this detailed Project Administration Bundle Project Gantt Chart With Budget And Activities Infographics PDF template. Track the milestones, tasks, phases, activities, and subtasks to get an updated visual of your project. Share your planning horizon and release plan with this well crafted presentation template. This exemplary template can be used to plot various dependencies to distinguish the tasks in the pipeline and their impact on the schedules and deadlines of the project. Apart from this, you can also share this visual presentation with your team members and stakeholders. It a resourceful tool that can be incorporated into your business structure. Therefore, download and edit it conveniently to add the data and statistics as per your requirement.
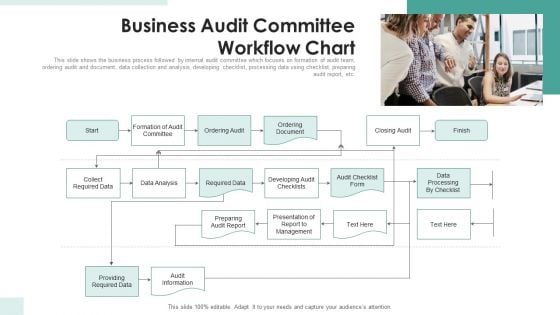
Business Audit Committee Workflow Chart Ppt PowerPoint Presentation Gallery Graphics Example PDF
This slide shows the business process followed by internal audit committee which focuses on formation of audit team, ordering audit and document, data collection and analysis, developing checklist, processing data using checklist, preparing audit report, etc. Persuade your audience using this business audit committee workflow chart ppt powerpoint presentation gallery graphics example pdf. This PPT design covers one stages, thus making it a great tool to use. It also caters to a variety of topics including data analysis, management, data processing. Download this PPT design now to present a convincing pitch that not only emphasizes the topic but also showcases your presentation skills.
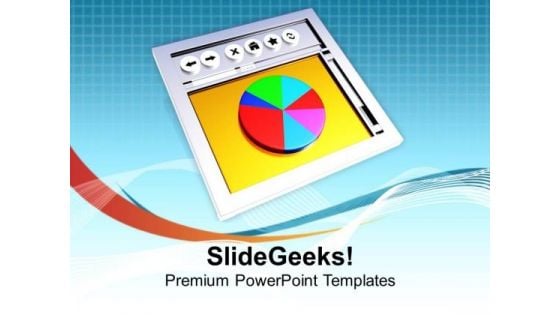
Internet Browser And Pie Chart Business PowerPoint Templates Ppt Backgrounds For Slides 0513
Reduce the drag with our Internet Browser And Pie Chart Business PowerPoint Templates PPT Backgrounds For Slides. Give more lift to your thoughts. Your thoughts will make a dramatic entry. Write the script on our Internet PowerPoint Templates. Our Pie charts PowerPoint Templates enjoy drama. They provide entertaining backdrops. Enthuse your audience with your ideas. Our Internet Browser And Pie Chart Business PowerPoint Templates Ppt Backgrounds For Slides 0513 will generate keenness.
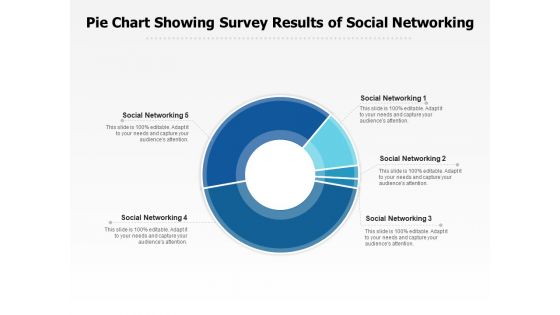
Pie Chart Showing Survey Results Of Social Networking Ppt PowerPoint Presentation Gallery Ideas PDF
Presenting this set of slides with name pie chart showing survey results of social networking ppt powerpoint presentation gallery ideas pdf. The topics discussed in these slide is pie chart showing survey results of social networking. This is a completely editable PowerPoint presentation and is available for immediate download. Download now and impress your audience.
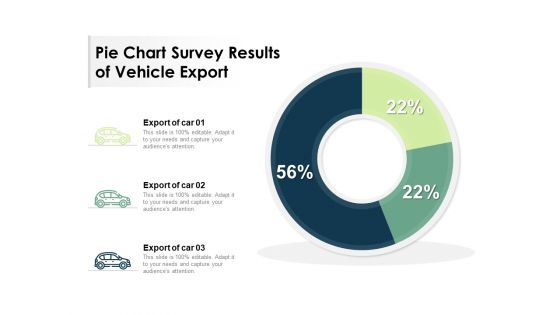
Pie Chart Survey Results Of Vehicle Export Ppt PowerPoint Presentation Portfolio Slide Portrait PDF
Presenting this set of slides with name pie chart survey results of vehicle export ppt powerpoint presentation portfolio slide portrait pdf. The topics discussed in these slides are pie chart survey results of vehicle export, export of car. This is a completely editable PowerPoint presentation and is available for immediate download. Download now and impress your audience.
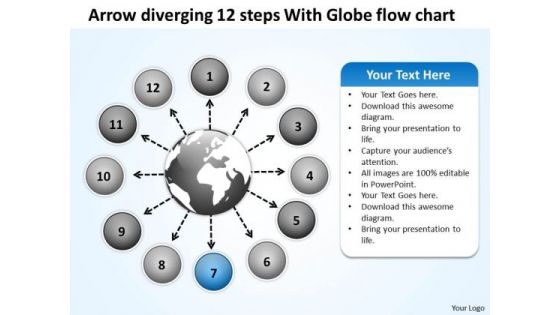
Arrow Diverging 12 Steps With Globe Flow Chart Circular PowerPoint Slides
We present our arrow diverging 12 steps with globe flow chart Circular PowerPoint Slides.Use our Circle Charts PowerPoint Templates because this diagram put it all together to form the complete picture and reach the goal. Use our Arrows PowerPoint Templates because the chart is designed to give you the flavour of the kind of tools you may need and the work that is performed in the lifecycle. Present our Globe PowerPoint Templates because you require care and diligence to function well. Use our Business PowerPoint Templates because this is the unerring accuracy in reaching the target. the effortless ability to launch into flight. Use our Flow Charts PowerPoint Templates because your marketing strategies can funnel down to the cone, stage by stage, refining as you go along.Use these PowerPoint slides for presentations relating to 3d, abstract, aim, arrow, background, business, career, chart, circle, color, concept, creative, curve, design, development, direction, financial, flowing, gain, graph, green, group, growth, higher, illustration, increase, isolated, motion, moving, moving up, path, prediction, progress, red, series, shape, sign, success, symbol, target, turn, twisted, up, upload, upward, way, white, win. The prominent colors used in the PowerPoint template are Blue, Gray, White. PowerPoint presentation experts tell us our arrow diverging 12 steps with globe flow chart Circular PowerPoint Slides are Energetic. PowerPoint presentation experts tell us our career PowerPoint templates and PPT Slides are Delightful. Presenters tell us our arrow diverging 12 steps with globe flow chart Circular PowerPoint Slides have awesome images to get your point across. Presenters tell us our background PowerPoint templates and PPT Slides are Clever. You can be sure our arrow diverging 12 steps with globe flow chart Circular PowerPoint Slides are Enchanting. We assure you our chart PowerPoint templates and PPT Slides are Bold. Exhibit your erudition on our Arrow Diverging 12 Steps With Globe Flow Chart Circular PowerPoint Slides. Give the audience a taste of your profound knowledge.
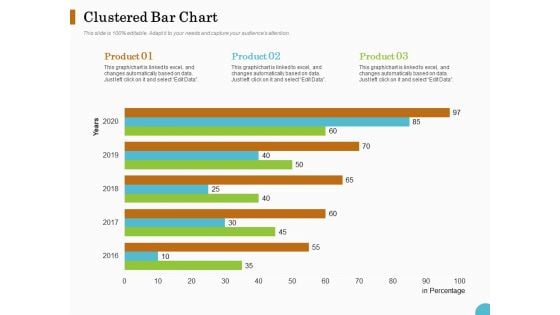
Lead Ranking Sales Methodology Model Clustered Bar Chart Ppt PowerPoint Presentation Styles Introduction PDF
Presenting this set of slides with name lead ranking sales methodology model clustered bar chart ppt powerpoint presentation styles introduction pdf. The topics discussed in these slide is clustered bar chart. This is a completely editable PowerPoint presentation and is available for immediate download. Download now and impress your audience.
Sustainable Energy Resources Column Chart Ppt PowerPoint Presentation Icon Infographic Template PDF
This graph or chart is linked to excel, and changes automatically based on data. Just left click on it and select Edit Data. Deliver and pitch your topic in the best possible manner with this Sustainable Energy Resources Column Chart Ppt PowerPoint Presentation Icon Infographic Template PDF. Use them to share invaluable insights on Column Chart, 2017 To 2022 and impress your audience. This template can be altered and modified as per your expectations. So, grab it now.
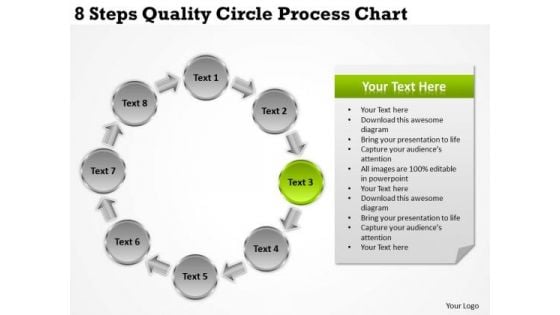
Business Policy And Strategy Steps Quality Circle Process Chart Innovative Marketing Concepts
We present our business policy and strategy steps quality circle process chart innovative marketing concepts.Use our Flow Charts PowerPoint Templates because It can Bubble and burst with your ideas. Use our Business PowerPoint Templates because You can Be the puppeteer with our PowerPoint Templates and Slides as your strings. Lead your team through the steps of your script. Present our Process and Flows PowerPoint Templates because You should Press the right buttons with our PowerPoint Templates and Slides. They will take your ideas down the perfect channel. Download and present our Circle Charts PowerPoint Templates because You can Connect the dots. Fan expectations as the whole picture emerges. Present our Shapes PowerPoint Templates because you should Experience excellence with our PowerPoint Templates and Slides. They will take your breath away.Use these PowerPoint slides for presentations relating to Act, arrow, blue, business, chart, check, circle, concept, control, cycle, design, development, diagram, do, engineering, evaluate, flow, flow-chart, flowchart, graphic, green, idea, info graphic, iterative, life-cycle, lifecycle, management, method, model, process, quality, research, schema, software, spiral, step, strategy, success, system, vector, white, work, workflow. The prominent colors used in the PowerPoint template are Green, Gray, Black. Hand your team the perfect strategy with our Business Policy And Strategy Steps Quality Circle Process Chart Innovative Marketing Concepts. Try us out and see what a difference our templates make.

Data Interpretation Pie Chart Marketing PowerPoint Templates Ppt Backgrounds For Slides 0313
We present our Data Interpretation Pie Chart Marketing PowerPoint Templates PPT Backgrounds For Slides 0313.Use our Business PowerPoint Templates because you should Whip up a frenzy with our PowerPoint Templates and Slides. They will fuel the excitement of your team. Use our Marketing PowerPoint Templates because You can Double your output with our PowerPoint Templates and Slides. They make beating deadlines a piece of cake. Download our Pie Charts PowerPoint Templates because It will Raise the bar of your Thoughts. They are programmed to take you to the next level. Download and present our Circle Charts PowerPoint Templates because Timeline crunches are a fact of life. Meet all deadlines using our PowerPoint Templates and Slides. Use our Shapes PowerPoint Templates because you should Experience excellence with our PowerPoint Templates and Slides. They will take your breath away.Use these PowerPoint slides for presentations relating to Pie chart resolution marketing, business, marketing, pie charts, shapes, circle charts. The prominent colors used in the PowerPoint template are Yellow, Green, White. Attract attention with our Data Interpretation Pie Chart Marketing PowerPoint Templates Ppt Backgrounds For Slides 0313. You will come out on top.
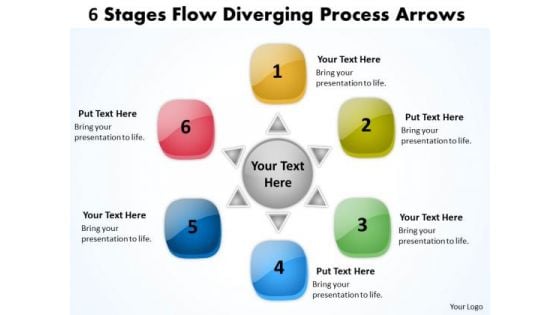
6 Stages Flow Diverging Process Arrows Relative Cycle Chart PowerPoint Slides
We present our 6 stages flow diverging process arrows Relative Cycle Chart PowerPoint Slides.Download and present our Boxes PowerPoint Templates because you understand the ailment and how to fight it. Download our Business PowerPoint Templates because this template can project the path to sucess that you have charted. Download our Arrows PowerPoint Templates because so that you can Lead the way to spread good cheer to one and all. Download and present our Circle Charts PowerPoint Templates because Our PowerPoint Templates and Slides offer you the widest possible range of options. Download our Flow Charts PowerPoint Templates because your group can behave steady in the top bracket.Use these PowerPoint slides for presentations relating to 3d, abstract, arrow, art, background, blank, business, chart, circle, concept, connection, cycle, development, diagram, direction, element, environment, exchange, finance, financial, flow, graph, graphic, graphic presentation, group, icon, illustration, investment, isolated, isometric, market, motion, movement, organization, passive income, perspective, process, process chart, recycle, report, ring, sign, step, stock, success, symbol, teamwork, text, vector. The prominent colors used in the PowerPoint template are Blue, Red, Yellow. Presenters tell us our 6 stages flow diverging process arrows Relative Cycle Chart PowerPoint Slides will save the presenter time. You can be sure our arrow PowerPoint templates and PPT Slides are Excellent. Professionals tell us our 6 stages flow diverging process arrows Relative Cycle Chart PowerPoint Slides are Handsome. People tell us our art PowerPoint templates and PPT Slides are Youthful. People tell us our 6 stages flow diverging process arrows Relative Cycle Chart PowerPoint Slides will make the presenter look like a pro even if they are not computer savvy. Professionals tell us our arrow PowerPoint templates and PPT Slides provide great value for your money. Be assured of finding the best projection to highlight your words. Attack doubts with our 6 Stages Flow Diverging Process Arrows Relative Cycle Chart PowerPoint Slides. You will come out on top.
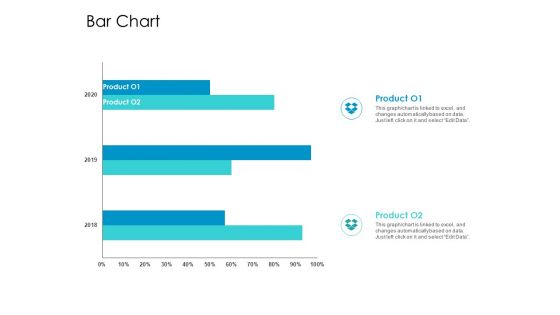
Developing New Sales And Marketing Strategic Approach Bar Chart Ppt PowerPoint Presentation Show Samples PDF
Presenting this set of slides with name developing new sales and marketing strategic approach bar chart ppt powerpoint presentation show samples pdf. The topics discussed in these slide is bar chart. This is a completely editable PowerPoint presentation and is available for immediate download. Download now and impress your audience.
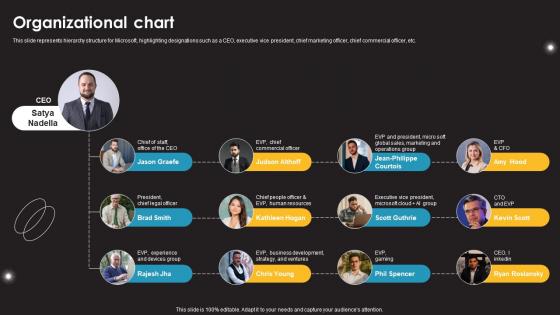
Organizational Chart Information Technology Services Provider Company Profile CP SS V
This slide represents hierarchy structure for Microsoft, highlighting designations such as a CEO, executive vice president, chief marketing officer, chief commercial officer, etc.Coming up with a presentation necessitates that the majority of the effort goes into the content and the message you intend to convey. The visuals of a PowerPoint presentation can only be effective if it supplements and supports the story that is being told. Keeping this in mind our experts created Organizational Chart Information Technology Services Provider Company Profile CP SS V to reduce the time that goes into designing the presentation. This way, you can concentrate on the message while our designers take care of providing you with the right template for the situation. This slide represents hierarchy structure for Microsoft, highlighting designations such as a CEO, executive vice president, chief marketing officer, chief commercial officer, etc.

A Comprehensive Guide On Growth Marketing Flow Chart Process Model MKT SS V
Slidegeeks is here to make your presentations a breeze with A Comprehensive Guide On Growth Marketing Flow Chart Process Model MKT SS V With our easy-to-use and customizable templates, you can focus on delivering your ideas rather than worrying about formatting. With a variety of designs to choose from, you are sure to find one that suits your needs. And with animations and unique photos, illustrations, and fonts, you can make your presentation pop. So whether you are giving a sales pitch or presenting to the board, make sure to check out Slidegeeks first Our A Comprehensive Guide On Growth Marketing Flow Chart Process Model MKT SS V are topically designed to provide an attractive backdrop to any subject. Use them to look like a presentation pro.
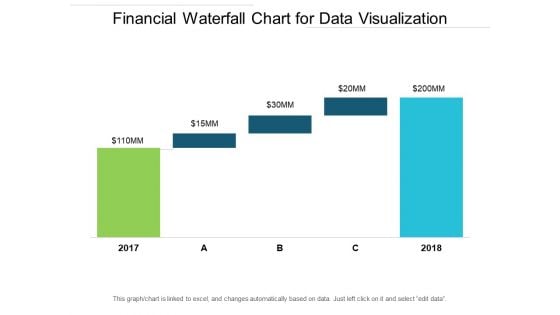
Financial Waterfall Chart For Data Visualization Ppt PowerPoint Presentation Ideas Elements
This is a financial waterfall chart for data visualization ppt powerpoint presentation ideas elements. This is a five stage process. The stages in this process are sales waterfall, waterfall chart, business.
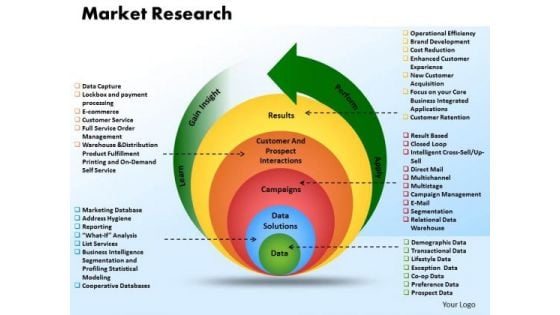
Business Circle Chart PowerPoint Templates Business Market Research Data Ppt Slides
Business Circle Chart PowerPoint Templates Business market research data PPT Slides-\nThis PowerPoint diagram slide shows a circular process withan arrow. Useful to represent process slides-Business Circle Chart PowerPoint Templates Business market research data PPT Slides-This template can be used for presentations relating to 3d, Abstract, Around, Arrow, Background, Bright, Business, Card, Chart, Circle, Circular, Circulation, Collection, Colorful, Communication, Concept, Cycle, Cyclic, Design, Direction, Element, Flow, Glass, Glossy, Graphic, Icon, Illustration, Modern, Motion, Network Crown yourself with our Business Circle Chart PowerPoint Templates Business Market Research Data Ppt Slides. You will acquire the feel of a champion.
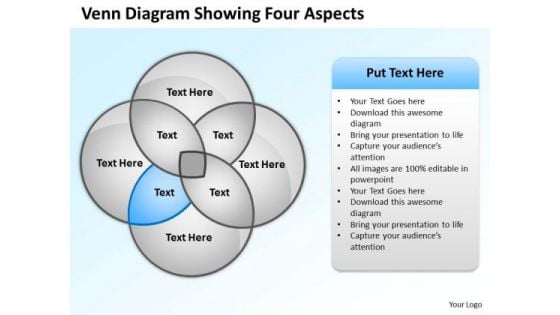
Business Organizational Chart Template Venn Diagram Showing Four Aspects PowerPoint Slides
We present our business organizational chart template venn diagram showing four aspects PowerPoint Slides.Use our Ring Charts PowerPoint Templates because Your audience will believe you are the cats whiskers. Download our Circle Charts PowerPoint Templates because You are well armed with penetrative ideas. Our PowerPoint Templates and Slides will provide the gunpowder you need. Download and present our Process and Flows PowerPoint Templates because They will Put your wonderful verbal artistry on display. Our PowerPoint Templates and Slides will provide you the necessary glam and glitter. Download and present our Flow Charts PowerPoint Templates because Our PowerPoint Templates and Slides help you meet the demand of the Market. Just browse and pick the slides that appeal to your intuitive senses. Download our Business PowerPoint Templates because Our PowerPoint Templates and Slides will let you Illuminate the road ahead to Pinpoint the important landmarks along the way.Use these PowerPoint slides for presentations relating to Business, button, catalog, chart, circle, company, cross, data, design, diagram, direction, document, financial, four, glossy, goals, graph, junction, management, market, marketing, model, multicolored, multiple, navigation, network, options, plan, presentation, process, purple, results, shiny, sphere, statistics. The prominent colors used in the PowerPoint template are Blue light, White, Gray. People tell us our business organizational chart template venn diagram showing four aspects PowerPoint Slides are effectively colour coded to prioritise your plans They automatically highlight the sequence of events you desire. PowerPoint presentation experts tell us our data PowerPoint templates and PPT Slides will impress their bosses and teams. Presenters tell us our business organizational chart template venn diagram showing four aspects PowerPoint Slides will generate and maintain the level of interest you desire. They will create the impression you want to imprint on your audience. Use our data PowerPoint templates and PPT Slides are effectively colour coded to prioritise your plans They automatically highlight the sequence of events you desire. Customers tell us our business organizational chart template venn diagram showing four aspects PowerPoint Slides are specially created by a professional team with vast experience. They diligently strive to come up with the right vehicle for your brilliant Ideas. People tell us our chart PowerPoint templates and PPT Slides are incredible easy to use. Make instructive presentations with our Business Organizational Chart Template Venn Diagram Showing Four Aspects PowerPoint Slides. Dont waste time struggling with PowerPoint. Let us do it for you.
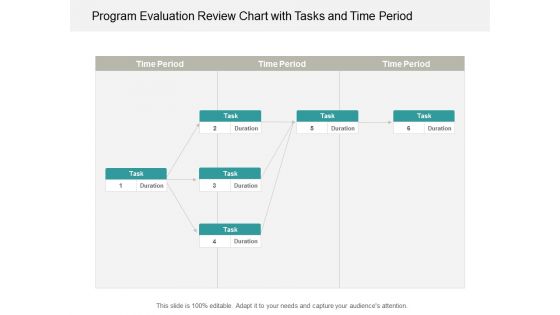
Program Evaluation Review Chart With Tasks And Time Period Ppt Powerpoint Presentation Portfolio Infographic Template
This is a program evaluation review chart with tasks and time period ppt powerpoint presentation portfolio infographic template. This is a six stage process. The stages in this process are pert chart, program evaluation and review technique, pert graph.
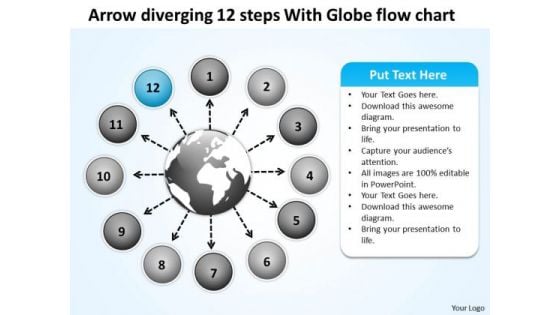
Arrow Diverging 12 Steps With Globe Flow Chart Circular PowerPoint Templates
We present our arrow diverging 12 steps with globe flow chart Circular PowerPoint templates.Download and present our Circle Charts PowerPoint Templates because you can Trigger audience minds with your interesting ideas. Download our Arrows PowerPoint Templates because the majestic tiger lord of all it surveys.It exudes power even when it is in repose. Use our Globe PowerPoint Templates because with the help of our Slides you can Illustrate how each element flows seamlessly onto the next stage. Present our Business PowerPoint Templates because you have analysed many global markets and come up with possibilities. Highlight the pros and cons of other likely business oppurtunities. Present our Flow Charts PowerPoint Templates because this Layout helps you to expand your plans to overcome obstacles and reassure the team that they shall continue to roll along merrily.Use these PowerPoint slides for presentations relating to 3d, abstract, aim, arrow, background, business, career, chart, circle, color, concept, creative, curve, design, development, direction, financial, flowing, gain, graph, green, group, growth, higher, illustration, increase, isolated, motion, moving, moving up, path, prediction, progress, red, series, shape, sign, success, symbol, target, turn, twisted, up, upload, upward, way, white, win. The prominent colors used in the PowerPoint template are Blue, Gray, White. PowerPoint presentation experts tell us our arrow diverging 12 steps with globe flow chart Circular PowerPoint templates are visually appealing. PowerPoint presentation experts tell us our background PowerPoint templates and PPT Slides are Ritzy. Presenters tell us our arrow diverging 12 steps with globe flow chart Circular PowerPoint templates are Amazing. Presenters tell us our aim PowerPoint templates and PPT Slides are Striking. You can be sure our arrow diverging 12 steps with globe flow chart Circular PowerPoint templates are Fun. We assure you our chart PowerPoint templates and PPT Slides are Swanky. Make the greatest presentation ever with our Arrow Diverging 12 Steps With Globe Flow Chart Circular PowerPoint Templates. Dont waste time struggling with PowerPoint. Let us do it for you.
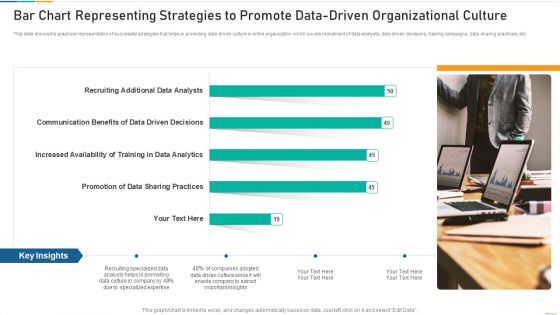
Bar Chart Representing Strategies To Promote Data Driven Organizational Culture Diagrams PDF
Showcasing this set of slides titled bar chart representing strategies to promote data driven organizational culture diagrams pdf. The topics addressed in these templates are bar chart representing strategies to promote data driven organizational culture. All the content presented in this PPT design is completely editable. Download it and make adjustments in color, background, font etc. as per your unique business setting.
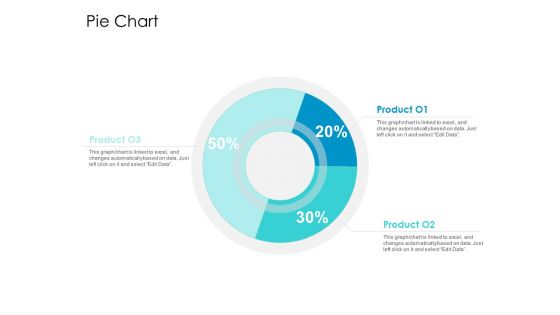
Developing New Sales And Marketing Strategic Approach Pie Chart Ppt PowerPoint Presentation Professional Example PDF
Presenting this set of slides with name developing new sales and marketing strategic approach pie chart ppt powerpoint presentation professional example pdf. The topics discussed in these slide is pie chart. This is a completely editable PowerPoint presentation and is available for immediate download. Download now and impress your audience.
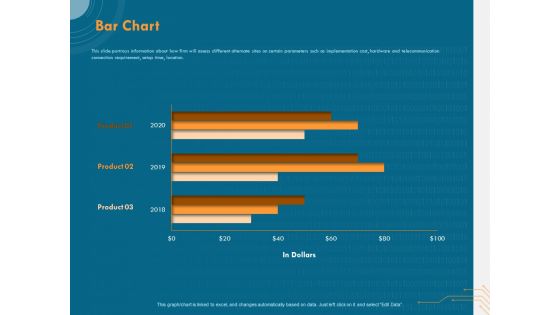
Cyber Security Implementation Framework Bar Chart Ppt PowerPoint Presentation Slides PDF
Presenting this set of slides with name cyber security implementation framework bar chart ppt powerpoint presentation slides pdf. The topics discussed in these slide is bar chart. This is a completely editable PowerPoint presentation and is available for immediate download. Download now and impress your audience.
Project Task Planning And Evaluation Chart Ppt Powerpoint Presentation Icon Slide
This is a project task planning and evaluation chart ppt powerpoint presentation icon slide. This is a nine stage process. The stages in this process are pert chart, program evaluation and review technique, pert graph.
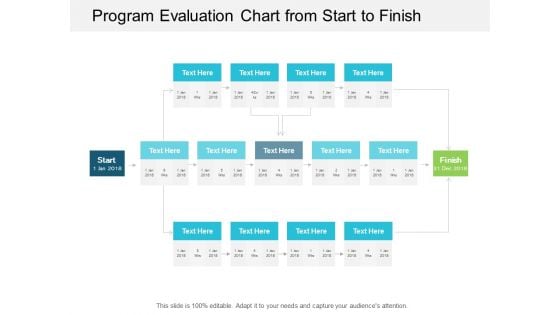
Program Evaluation Chart From Start To Finish Ppt Powerpoint Presentation Professional Examples
This is a program evaluation chart from start to finish ppt powerpoint presentation professional examples. This is a three stage process. The stages in this process are pert chart, program evaluation and review technique, pert graph.


 Continue with Email

 Home
Home


