Checkmark Icon

Identified Dimensions For Digital Enablement E Sales Generation Checklist Slides PDF
This slide provides information regarding the areas in which firm can initiate digital enablement such as operation and processes, resources and organization and workflow. Firm can choose any or all the dimensions as per requirement at a time. Are you in need of a template that can accommodate all of your creative concepts This one is crafted professionally and can be altered to fit any style. Use it with Google Slides or PowerPoint. Include striking photographs, symbols, depictions, and other visuals. Fill, move around, or remove text boxes as desired. Test out color palettes and font mixtures. Edit and save your work, or work with colleagues. Download Identified Dimensions For Digital Enablement E Sales Generation Checklist Slides PDF and observe how to make your presentation outstanding. Give an impeccable presentation to your group and make your presentation unforgettable. This slide provides information regarding the areas in which firm can initiate digital enablement such as operation and processes, resources and organization and workflow. Firm can choose any or all the dimensions as per requirement at a time.
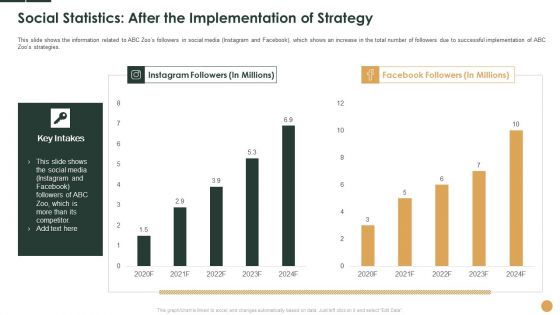
Social Statistics After The Implementation Of Strategy 2020 To 2024 Ppt Inspiration Designs Download PDF
This slide shows the information related to ABC Zoos followers in social media Instagram and Facebook, which shows an increase in the total number of followers due to successful implementation of ABC Zoos strategies.Deliver an awe-inspiring pitch with this creative social statistics after the implementation of strategy 2020 to 2024 ppt inspiration designs download pdf. bundle. Topics like instagram followers, 2020 to 2024 can be discussed with this completely editable template. It is available for immediate download depending on the needs and requirements of the user.
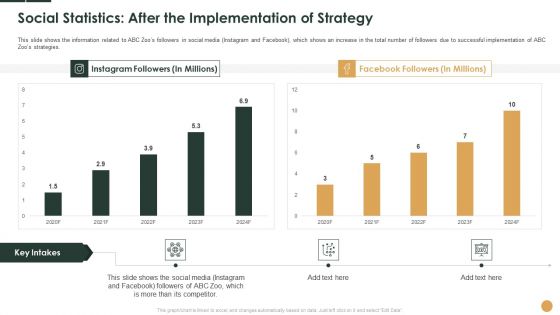
Social Statistics After The Implementation Of Strategy Ppt Infographics Smartart PDF
This slide shows the information related to ABC Zoos followers in social media Instagram and Facebook, which shows an increase in the total number of followers due to successful implementation of ABC Zoos strategies.Deliver and pitch your topic in the best possible manner with this social statistics after the implementation of strategy ppt infographics smartart pdf. Use them to share invaluable insights on instagram followers, 2020 to 2024 and impress your audience. This template can be altered and modified as per your expectations. So, grab it now.
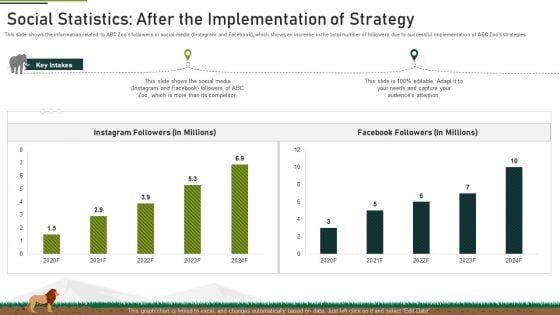
Social Statistics After The Implementation Of Strategy Ppt Infographic Template Styles PDF
This slide shows the information related to ABC Zoos followers in social media Instagram and Facebook, which shows an increase in the total number of followers due to successful implementation of ABC Zoos strategies. Deliver and pitch your topic in the best possible manner with this social statistics after the implementation of strategy ppt infographic template styles pdf. Use them to share invaluable insights on instagram followers, facebook followers and impress your audience. This template can be altered and modified as per your expectations. So, grab it now.
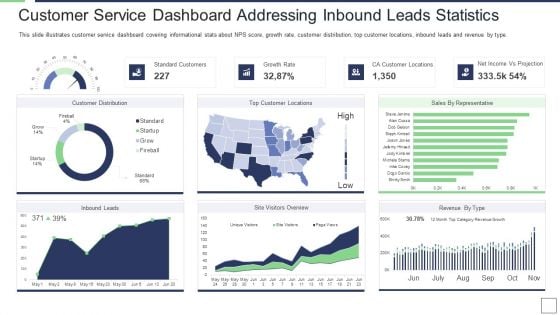
IT Service Incorporation And Administration Customer Service Dashboard Addressing Inbound Leads Statistics Clipart PDF
This slide illustrates customer service dashboard covering informational stats about NPS score, growth rate, customer distribution, top customer locations, inbound leads and revenue by type. Deliver an awe inspiring pitch with this creative it service incorporation and administration customer service dashboard addressing inbound leads statistics clipart pdf bundle. Topics like standard customers, growth rate, net income vs projection, ca customer locations can be discussed with this completely editable template. It is available for immediate download depending on the needs and requirements of the user.
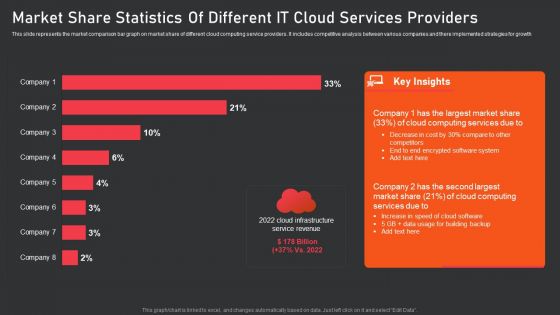
Market Share Statistics Of Different IT Cloud Services Providers Topics PDF
This slide represents the market comparison bar graph on market share of different cloud computing service providers. It includes competitive analysis between various companies and there implemented strategies for growth. Showcasing this set of slides titled market share statistics of different it cloud services providers topics pdf. The topics addressed in these templates are largest market share, cloud computing services. All the content presented in this PPT design is completely editable. Download it and make adjustments in color, background, font etc. as per your unique business setting.
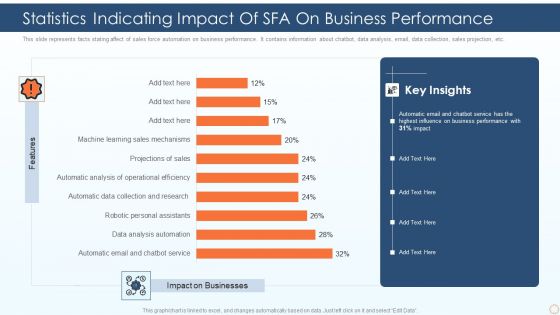
Statistics Indicating Impact Of SFA On Business Performance Ppt PowerPoint Presentation Gallery Outfit PDF
This slide represents facts stating affect of sales force automation on business performance. It contains information about chatbot, data analysis, email, data collection, sales projection, etc. Pitch your topic with ease and precision using this statistics indicating impact of sfa on business performance ppt powerpoint presentation gallery outfit pdf. This layout presents information on automatic email and chatbot service, data analysis automation, robotic personal assistants. It is also available for immediate download and adjustment. So, changes can be made in the color, design, graphics or any other component to create a unique layout.
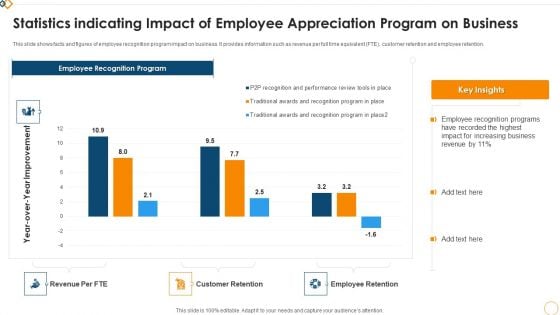
Statistics Indicating Impact Of Employee Appreciation Program On Business Graphics PDF
This slide shows facts and figures of employee recognition program impact on business. It provides information such as revenue per full time equivalent FTE, customer retention and employee retention. Showcasing this set of slides titled Statistics Indicating Impact Of Employee Appreciation Program On Business Graphics PDF. The topics addressed in these templates are Employee Recognition Program, Revenue Per FTE, Customer Retention. All the content presented in this PPT design is completely editable. Download it and make adjustments in color, background, font etc. as per your unique business setting.
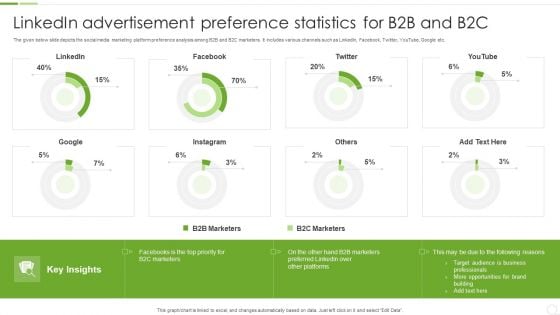
Linkedin Advertisement Preference Statistics For B2B And B2C Ppt Visual Aids Professional PDF
The given below slide depicts the social media marketing platform preference analysis among B2B and B2C marketers. It includes various channels such as LinkedIn, Facebook, Twitter, YouTube, Google etc. Pitch your topic with ease and precision using this Linkedin Advertisement Preference Statistics For B2B And B2C Ppt Visual Aids Professional PDF. This layout presents information on B2B Marketers, B2C Marketers, Target Audience. It is also available for immediate download and adjustment. So, changes can be made in the color, design, graphics or any other component to create a unique layout.
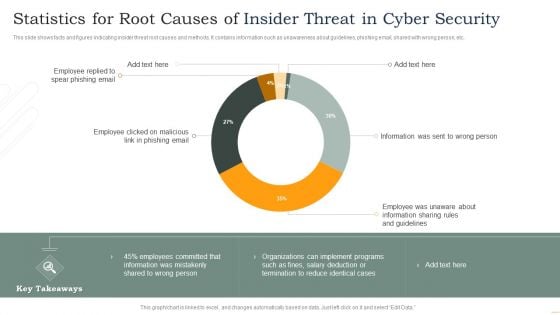
Statistics For Root Causes Of Insider Threat In Cyber Security Inspiration PDF
This slide shows facts and figures indicating insider threat root causes and methods. It contains information such as unawareness about guidelines, phishing email, shared with wrong person, etc. Showcasing this set of slides titled Statistics For Root Causes Of Insider Threat In Cyber Security Inspiration PDF. The topics addressed in these templates are Employee Replied, Spear Phishing Email, Employee Clicked, Phishing Email. All the content presented in this PPT design is completely editable. Download it and make adjustments in color, background, font etc. as per your unique business setting.
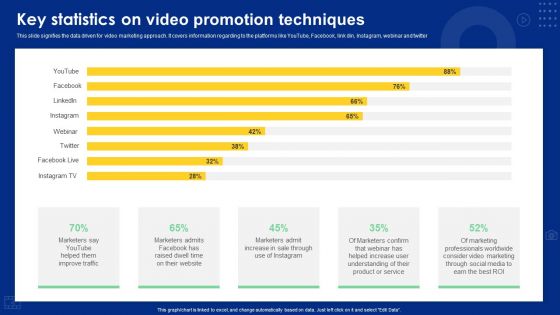
Key Statistics On Video Promotion Techniques Ppt Slides Example Introduction PDF
This slide signifies the data driven for video marketing approach. It covers information regarding to the platforms like YouTube, Facebook, link din, Instagram, webinar and twitter. Showcasing this set of slides titled Key Statistics On Video Promotion Techniques Ppt Slides Example Introduction PDF. The topics addressed in these templates are Marketers Say Youtube, Sale Through, Product Or Service. All the content presented in this PPT design is completely editable. Download it and make adjustments in color, background, font etc. as per your unique business setting.
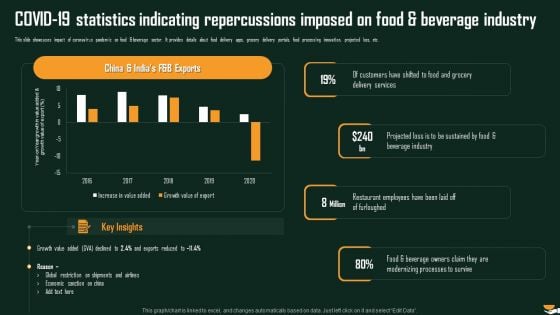
COVID 19 Statistics Indicating Repercussions Imposed On Food And Beverage Industry Demonstration PDF
This slide showcases impact of coronavirus pandemic on food beverage sector. It provides details about food delivery apps, grocery delivery portals, food processing innovation, projected loss, etc. Deliver and pitch your topic in the best possible manner with this COVID 19 Statistics Indicating Repercussions Imposed On Food And Beverage Industry Demonstration PDF. Use them to share invaluable insights on Delivery Services, Beverage Industry, Sustained Food and impress your audience. This template can be altered and modified as per your expectations. So, grab it now.
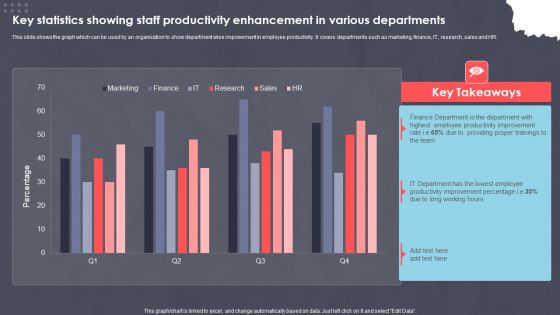
Key Statistics Showing Staff Productivity Enhancement In Various Departments Ppt PowerPoint Presentation Slides Portrait PDF
This slide shows the graph which can be used by an organization to show department wise improvement in employee productivity. It covers departments such as marketing, finance, IT, research, sales and HR. Pitch your topic with ease and precision using this Key Statistics Showing Staff Productivity Enhancement In Various Departments Ppt PowerPoint Presentation Slides Portrait PDF. This layout presents information on XXXXXXXXXXXXXXXXXXXXXXXXX. It is also available for immediate download and adjustment. So, changes can be made in the color, design, graphics or any other component to create a unique layout.
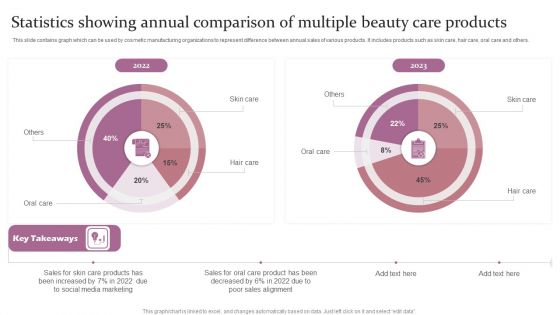
Statistics Showing Annual Comparison Of Multiple Beauty Care Products Ppt Infographics Objects PDF
This slide contains graph which can be used by cosmetic manufacturing organizations to represent difference between annual sales of various products. It includes products such as skin care, hair care, oral care and others. Showcasing this set of slides titled Statistics Showing Annual Comparison Of Multiple Beauty Care Products Ppt Infographics Objects PDF. The topics addressed in these templates are Skin Care, Hair Care, 2022 To 2023. All the content presented in this PPT design is completely editable. Download it and make adjustments in color, background, font etc. as per your unique business setting.
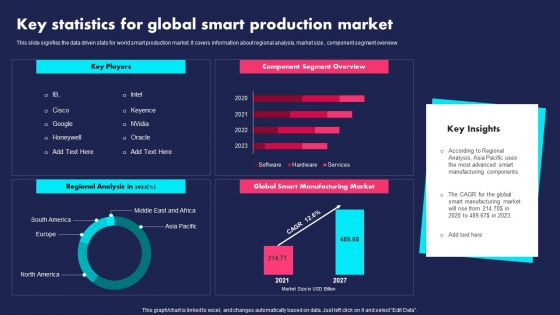
Key Statistics For Global Smart Production Market Ppt PowerPoint Presentation File Slides PDF
This slide signifies the data driven stats for world smart production market. It covers information about regional analysis, market size, component segment overview. Pitch your topic with ease and precision using this Key Statistics For Global Smart Production Market Ppt PowerPoint Presentation File Slides PDF. This layout presents information on Key Players, Component Segment Overview, Regional Analysis. It is also available for immediate download and adjustment. So, changes can be made in the color, design, graphics or any other component to create a unique layout.
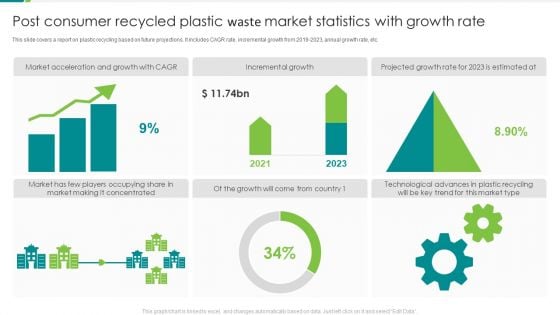
Post Consumer Recycled Plastic Waste Market Statistics With Growth Rate Elements PDF
This slide covers a report on plastic recycling based on future projections. It includes CAGR rate, incremental growth from 2019-2023, annual growth rate, etc. Showcasing this set of slides titled Post Consumer Recycled Plastic Waste Market Statistics With Growth Rate Elements PDF. The topics addressed in these templates are Market Acceleration, Growth CAGR, Incremental Growth, 2021 To 2023. All the content presented in this PPT design is completely editable. Download it and make adjustments in color, background, font etc. as per your unique business setting.
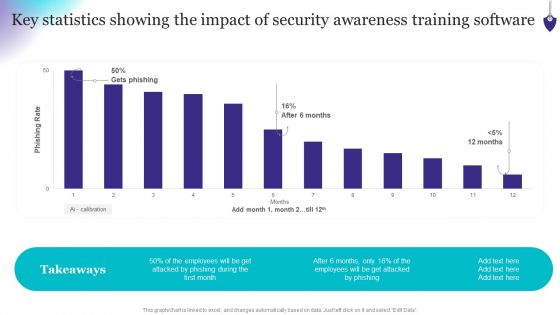
Organizing Security Awareness Key Statistics Showing The Impact Of Security Awareness Clipart PDF
Coming up with a presentation necessitates that the majority of the effort goes into the content and the message you intend to convey. The visuals of a PowerPoint presentation can only be effective if it supplements and supports the story that is being told. Keeping this in mind our experts created Organizing Security Awareness Key Statistics Showing The Impact Of Security Awareness Clipart PDF to reduce the time that goes into designing the presentation. This way, you can concentrate on the message while our designers take care of providing you with the right template for the situation.
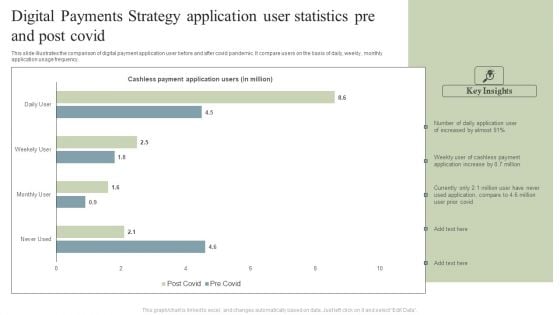
Digital Payments Strategy Application User Statistics Pre And Post Covid Pictures PDF
This slide illustrates the comparison of digital payment application user before and after covid pandemic. It compare users on the basis of daily, weekly, monthly application usage frequency. Pitch your topic with ease and precision using this Digital Payments Strategy Application User Statistics Pre And Post Covid Pictures PDF. This layout presents information on Cashless Payment, Application Users, Cashless Payment, Application Increase. It is also available for immediate download and adjustment. So, changes can be made in the color, design, graphics or any other component to create a unique layout.
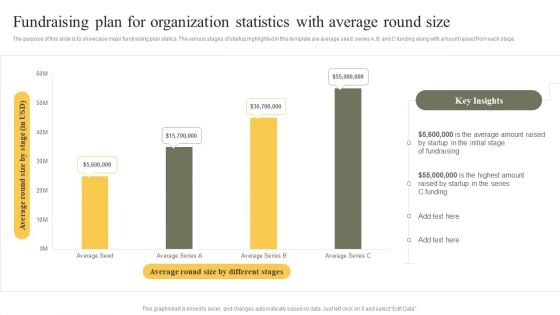
Fundraising Plan For Organization Statistics With Average Round Size Topics PDF
The purpose of this slide is to showcase major fundraising plan statics. The various stages of startup highlighted in this template are average seed, series A, B and C funding along with amount raised from each stage. Pitch your topic with ease and precision using this Fundraising Plan For Organization Statistics With Average Round Size Topics PDF. This layout presents information on Key Insights, Fundraising, Average. It is also available for immediate download and adjustment. So, changes can be made in the color, design, graphics or any other component to create a unique layout.
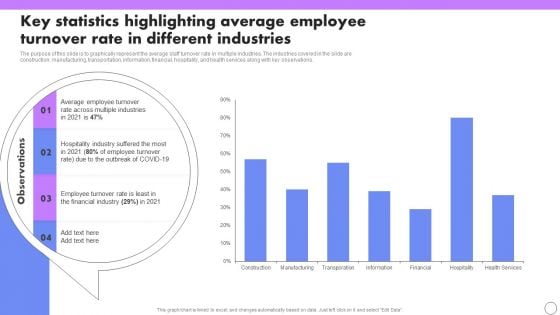
Key Statistics Highlighting Average Employee Turnover Rate In Different Industries Formats PDF
The purpose of this slide is to graphically represent the average staff turnover rate in multiple industries. The industries covered in the slide are construction, manufacturing, transportation, information, financial, hospitality, and health services along with key observations. Want to ace your presentation in front of a live audience Our Key Statistics Highlighting Average Employee Turnover Rate In Different Industries Formats PDF can help you do that by engaging all the users towards you. Slidegeeks experts have put their efforts and expertise into creating these impeccable powerpoint presentations so that you can communicate your ideas clearly. Moreover, all the templates are customizable, and easy-to-edit and downloadable. Use these for both personal and commercial use.
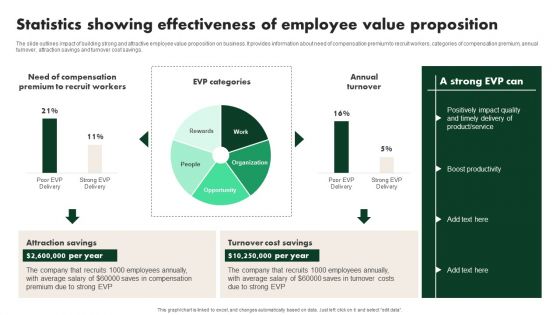
Creating Employee Value Proposition Statistics Showing Effectiveness Of Employee Value Ideas PDF
The slide outlines impact of building strong and attractive employee value proposition on business. It provides information about need of compensation premium to recruit workers, categories of compensation premium, annual turnover, attraction savings and turnover cost savings. There are so many reasons you need a Creating Employee Value Proposition Statistics Showing Effectiveness Of Employee Value Ideas PDF. The first reason is you cant spend time making everything from scratch, Thus, Slidegeeks has made presentation templates for you too. You can easily download these templates from our website easily.

Implementing Cybersecurity Awareness Program To Prevent Attacks Key Statistics Showing The Impact Of Security Clipart PDF
This modern and well arranged Implementing Cybersecurity Awareness Program To Prevent Attacks Key Statistics Showing The Impact Of Security Clipart PDF provides lots of creative possibilities. It is very simple to customize and edit with the Powerpoint Software. Just drag and drop your pictures into the shapes. All facets of this template can be edited with Powerpoint no extra software is necessary. Add your own material, put your images in the places assigned for them, adjust the colors, and then you can show your slides to the world, with an animated slide included.
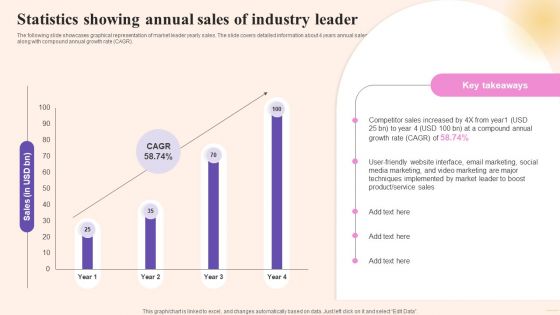
Comprehensive Guide To Build Marketing Statistics Showing Annual Sales Of Industry Portrait PDF
The following slide showcases graphical representation of market leader yearly sales. The slide covers detailed information about 4 years annual sales along with compound annual growth rate CAGR. Make sure to capture your audiences attention in your business displays with our gratis customizable Comprehensive Guide To Build Marketing Statistics Showing Annual Sales Of Industry Portrait PDF. These are great for business strategies, office conferences, capital raising or task suggestions. If you desire to acquire more customers for your tech business and ensure they stay satisfied, create your own sales presentation with these plain slides.
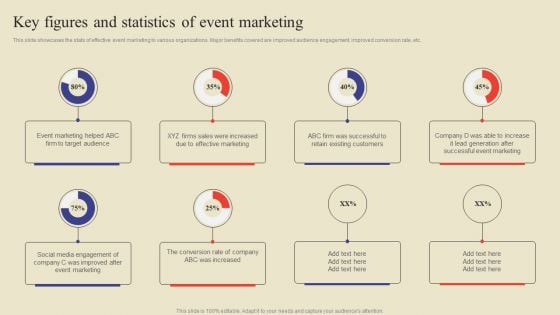
Key Figures And Statistics Of Event Marketing Ppt Summary Background Image PDF
This slide showcases the stats of effective event marketing to various organizations. Major benefits covered are improved audience engagement, improved conversion rate, etc. Boost your pitch with our creative Key Figures And Statistics Of Event Marketing Ppt Summary Background Image PDF. Deliver an awe inspiring pitch that will mesmerize everyone. Using these presentation templates you will surely catch everyones attention. You can browse the ppts collection on our website. We have researchers who are experts at creating the right content for the templates. So you do not have to invest time in any additional work. Just grab the template now and use them.
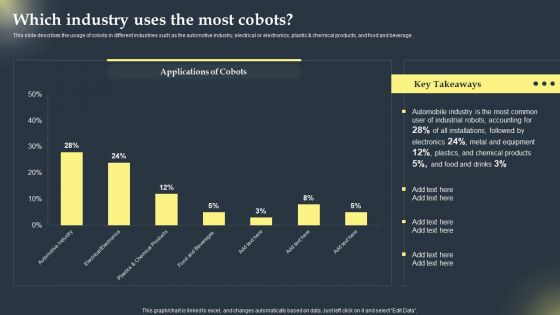
Cobots Global Statistics Which Industry Uses The Most Cobots Rules PDF
This slide describes the usage of cobots in different industries such as the automotive industry, electrical or electronics, plastic and chemical products, and food and beverage. Slidegeeks has constructed Cobots Global Statistics Which Industry Uses The Most Cobots Rules PDF after conducting extensive research and examination. These presentation templates are constantly being generated and modified based on user preferences and critiques from editors. Here, you will find the most attractive templates for a range of purposes while taking into account ratings and remarks from users regarding the content. This is an excellent jumping off point to explore our content and will give new users an insight into our top notch PowerPoint Templates.
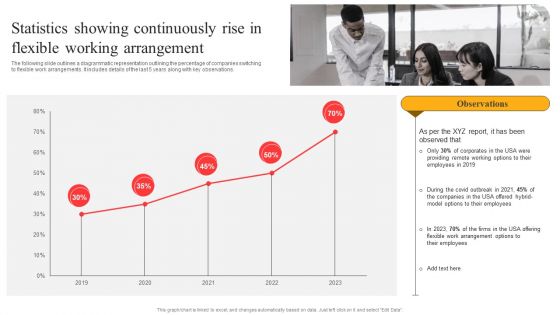
Flexible Working Policies And Guidelines Statistics Showing Continuously Rise In Flexible Working Mockup PDF
The following slide outlines a diagrammatic representation outlining the percentage of companies switching to flexible work arrangements. It includes details of the last 5 years along with key observations. Want to ace your presentation in front of a live audience Our Flexible Working Policies And Guidelines Statistics Showing Continuously Rise In Flexible Working Mockup PDF can help you do that by engaging all the users towards you. Slidegeeks experts have put their efforts and expertise into creating these impeccable powerpoint presentations so that you can communicate your ideas clearly. Moreover, all the templates are customizable, and easy to edit and downloadable. Use these for both personal and commercial use.
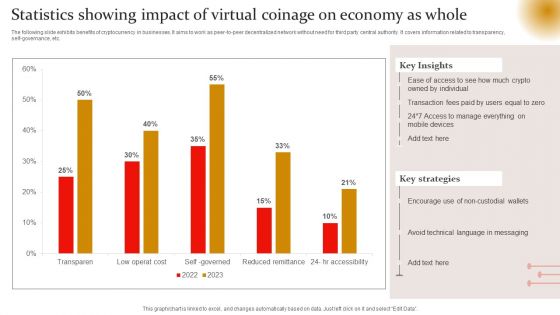
Statistics Showing Impact Of Virtual Coinage On Economy As Whole Graphics PDF
The following slide exhibits benefits of cryptocurrency in businesses. It aims to work as peer-to-peer decentralized network without need for third party central authority. It covers information related to transparency, self-governance, etc. Showcasing this set of slides titled Statistics Showing Impact Of Virtual Coinage On Economy As Whole Graphics PDF. The topics addressed in these templates are Key Insights, Key Strategies, Technical Language. All the content presented in this PPT design is completely editable. Download it and make adjustments in color, background, font etc. as per your unique business setting.
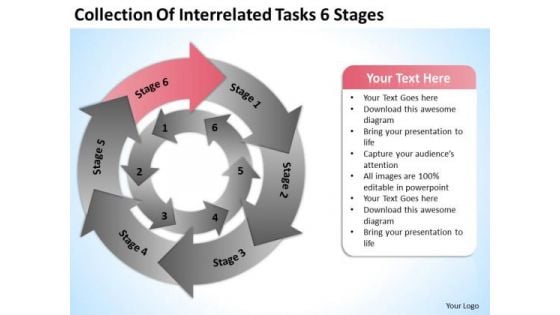
Collection Of Interrelated Tasks 6 Stages Ppt Web Design Business Plan PowerPoint Templates
We present our collection of interrelated tasks 6 stages ppt web design business plan PowerPoint templates.Use our Arrows PowerPoint Templates because Our PowerPoint Templates and Slides will let you Hit the target. Go the full distance with ease and elan. Present our Circle Charts PowerPoint Templates because Our PowerPoint Templates and Slides offer you the needful to organise your thoughts. Use them to list out your views in a logical sequence. Present our Shapes PowerPoint Templates because Our PowerPoint Templates and Slides help you meet the demand of the Market. Just browse and pick the slides that appeal to your intuitive senses. Use our Business PowerPoint Templates because Our PowerPoint Templates and Slides are focused like a searchlight beam. They highlight your ideas for your target audience. Download our Process and Flows PowerPoint Templates because You can Be the puppeteer with our PowerPoint Templates and Slides as your strings. Lead your team through the steps of your script.Use these PowerPoint slides for presentations relating to arrow, circular, process, round, flow, business, vector, graphic, part, green, red, concept, yellow, presentation, symbol, circle, orange, repeat, cycle, illustration, icon, pink, six, purple, blue, repetitive. The prominent colors used in the PowerPoint template are Red, Gray, Black. Bash on ahead with bold conviction. Have no fear with our Collection Of Interrelated Tasks 6 Stages Ppt Web Design Business Plan PowerPoint Templates.
Group Of Network Global PowerPoint Templates Ppt Backgrounds For Slides 0113
We present our Group Of Network Global PowerPoint Templates PPT Backgrounds For Slides 0113.Present our People PowerPoint Templates because Our PowerPoint Templates and Slides are conceived by a dedicated team. Use them and give form to your wondrous ideas. Use our Network diagrams PowerPoint Templates because Our PowerPoint Templates and Slides will steer your racing mind. Hit the right buttons and spur on your audience. Use our Leadership PowerPoint Templates because Our PowerPoint Templates and Slides will give good value for money. They also have respect for the value of your time. Download our Marketing PowerPoint Templates because Our PowerPoint Templates and Slides has conjured up a web of all you need with the help of our great team. Use them to string together your glistening ideas. Use our Business PowerPoint Templates because Our PowerPoint Templates and Slides offer you the needful to organise your thoughts. Use them to list out your views in a logical sequence.Use these PowerPoint slides for presentations relating to Social Network, people, network diagrams, leadership, marketing, business. The prominent colors used in the PowerPoint template are Gray, White, Black. Use our Group Of Network Global PowerPoint Templates PPT Backgrounds For Slides 0113 are incredible easy to use. The feedback we get is that our people PowerPoint templates and PPT Slides will make the presenter look like a pro even if they are not computer savvy. Customers tell us our Group Of Network Global PowerPoint Templates PPT Backgrounds For Slides 0113 effectively help you save your valuable time. Customers tell us our business PowerPoint templates and PPT Slides will help them to explain complicated concepts. Presenters tell us our Group Of Network Global PowerPoint Templates PPT Backgrounds For Slides 0113 are designed by professionals Presenters tell us our PowerPoint templates and PPT Slides have awesome images to get your point across. Give your audience whatever they fancy. Our Group Of Network Global PowerPoint Templates Ppt Backgrounds For Slides 0113 cater for many a delight.
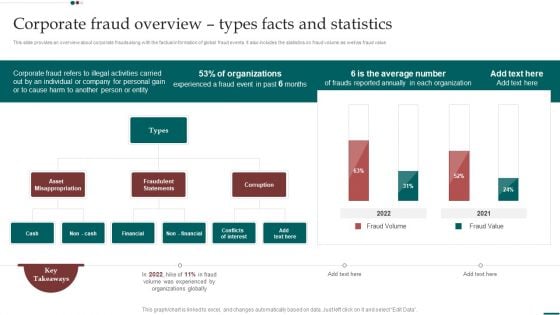
Scam Inquiry And Response Playbook Corporate Fraud Overview Types Facts And Statistics Structure PDF
This slide provides an overview about corporate frauds along with the factual information of global fraud events. It also includes the statistics on fraud volume as well as fraud value. Formulating a presentation can take up a lot of effort and time, so the content and message should always be the primary focus. The visuals of the PowerPoint can enhance the presenters message, so our Scam Inquiry And Response Playbook Corporate Fraud Overview Types Facts And Statistics Structure PDF was created to help save time. Instead of worrying about the design, the presenter can concentrate on the message while our designers work on creating the ideal templates for whatever situation is needed. Slidegeeks has experts for everything from amazing designs to valuable content, we have put everything into Scam Inquiry And Response Playbook Corporate Fraud Overview Types Facts And Statistics Structure PDF.
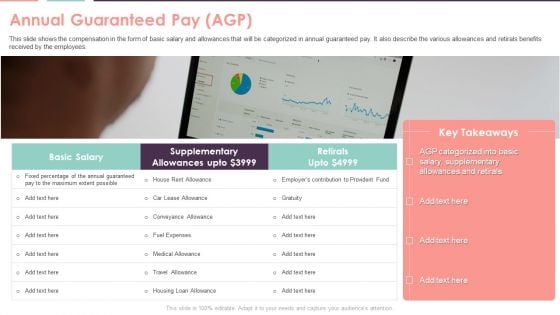
Compensation Survey Sheet Annual Guaranteed Pay AGP Mockup PDF
This slide shows the compensation in the form of basic salary and allowances that will be categorized in annual guaranteed pay. It also describe the various allowances and retirals benefits received by the employees. This is a Compensation Survey Sheet Annual Guaranteed Pay AGP Mockup PDF template with various stages. Focus and dispense information on three stages using this creative set, that comes with editable features. It contains large content boxes to add your information on topics like Supplementary Allowances, Retirals. You can also showcase facts, figures, and other relevant content using this PPT layout. Grab it now.
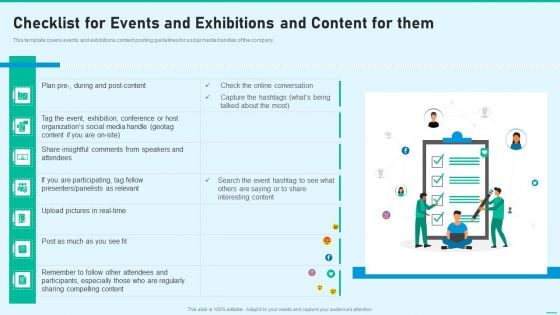
Social Network Playbook Checklist For Events And Exhibitions And Content For Them Ppt Professional Design Templates PDF
This template covers events and exhibitions content posting guidelines for social media handles of the company. Presenting social network playbook checklist for events and exhibitions and content for them ppt professional design templates pdf to provide visual cues and insights. Share and navigate important information on seven stages that need your due attention. This template can be used to pitch topics like checklist for events and exhibitions and content for them. In addtion, this PPT design contains high resolution images, graphics, etc, that are easily editable and available for immediate download.
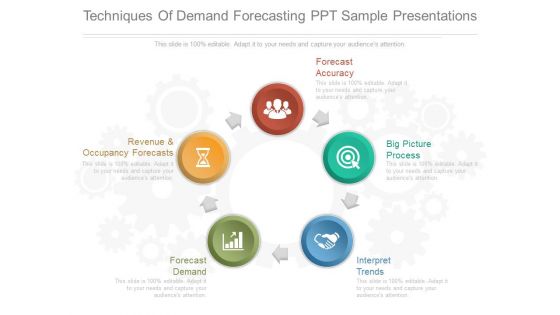
Techniques Of Demand Forecasting Ppt Sample Presentations
This is a techniques of demand forecasting ppt sample presentations. This is a five stage process. The stages in this process are revenue and occupancy forecasts, forecast accuracy, big picture process, interpret trends, forecast demand.

Global Cyber Terrorism Incidents On The Rise IT Checklist To Deal With Cyber Terrorism Threats Key Template PDF
This slide represents the checklist to deal with cyber-terrorism threats which involve 24 7 monitoring, employee training, keeping software updated. Presenting global cyber terrorism incidents on the rise it checklist to deal with cyber terrorism threats key template pdf to provide visual cues and insights. Share and navigate important information on nine stages that need your due attention. This template can be used to pitch topics like employee training, monitoring, cyber security assessment, incident response plan, limited access privileges. In addtion, this PPT design contains high resolution images, graphics, etc, that are easily editable and available for immediate download.
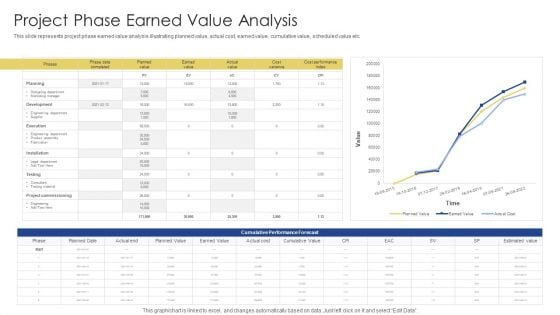
Project Phase Earned Value Analysis Ppt PowerPoint Presentation Gallery Infographics PDF
This slide represents project phase earned value analysis illustrating planned value, actual cost, earned value, cumulative value, scheduled value etc. Showcasing this set of slides titled Project Phase Earned Value Analysis Ppt PowerPoint Presentation Gallery Infographics PDF. The topics addressed in these templates are Cumulative Performance Forecast, Planning, Development. All the content presented in this PPT design is completely editable. Download it and make adjustments in color, background, font etc. as per your unique business setting.
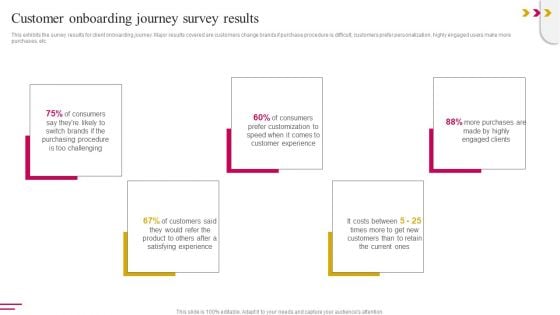
Customer Onboarding Journey Survey Results Clipart PDF
This exhibits the survey results for client onboarding journey. Major results covered are customers change brands if purchase procedure is difficult, customers prefer personalization, highly engaged users make more purchases, etc. Crafting an eye-catching presentation has never been more straightforward. Let your presentation shine with this tasteful yet straightforward Customer Onboarding Journey Survey Results Clipart PDF template. It offers a minimalistic and classy look that is great for making a statement. The colors have been employed intelligently to add a bit of playfulness while still remaining professional. Construct the ideal Customer Onboarding Journey Survey Results Clipart PDF that effortlessly grabs the attention of your audience Begin now and be certain to wow your customers

Ppt Theme Work Flow In PowerPoint 2010 Loop Six Phase Enterprise Plan 7 Design
We present our PPT Theme work flow in power point 2010 loop six phase enterprise plan 7 designs. Use our Arrows PowerPoint Templates because, to strive to give true form to your great dream. Use our Shapes PowerPoint Templates because, you have a great plan to put the pieces together, getting all the various contributors to gel for a successful completion. Use our Business PowerPoint Templates because; enlighten others on your team with your views. Use our Signs PowerPoint Templates because; now put it up there for all to see. Use our Process and Flows PowerPoint Templates because, this business power point template helps expound on the logic of your detailed thought process to take your company forward. Use these PowerPoint slides for presentations relating to abstract, algorithm, arrow, business, chart, connection, design, development, diagram, direction, element, flow, graph, linear, linear diagram, management, organization, plan, process, section, segment, set, sign, solution, strategy, symbol, vector. The prominent colors used in the PowerPoint template are Pink, Gray, and Black Our Ppt Theme Work Flow In PowerPoint 2010 Loop Six Phase Enterprise Plan 7 Design will generate and maintain excitement in your audience. They will create the impression you want to imprint on your audience.
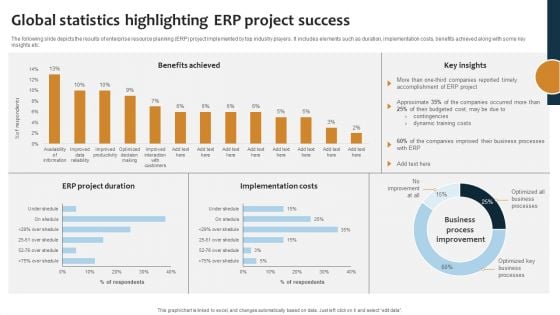
Improving Business Procedures Enterprise Resource Planning System Global Statistics Highlighting ERP Project Background PDF
The following slide depicts the results of enterprise resource planning ERP project implemented by top industry players. It includes elements such as duration, implementation costs, benefits achieved along with some key insights etc. The Improving Business Procedures Enterprise Resource Planning System Global Statistics Highlighting ERP Project Background PDF is a compilation of the most recent design trends as a series of slides. It is suitable for any subject or industry presentation, containing attractive visuals and photo spots for businesses to clearly express their messages. This template contains a variety of slides for the user to input data, such as structures to contrast two elements, bullet points, and slides for written information. Slidegeeks is prepared to create an impression.
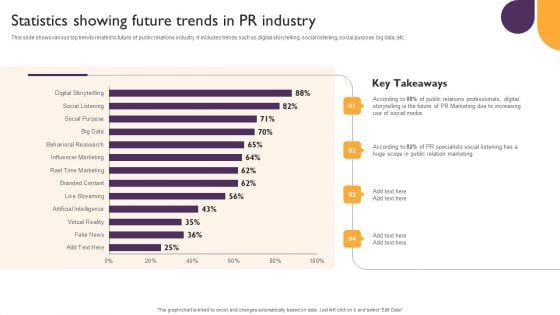
Public Relations Guide To Enhance Brand Credibility Statistics Showing Future Trends In PR Industry Ideas PDF
This slide shows various top trends related to future of public relations industry, It includes trends such as digital story telling, social listening, social purpose, big data, etc. This Public Relations Guide To Enhance Brand Credibility Statistics Showing Future Trends In PR Industry Ideas PDF from Slidegeeks makes it easy to present information on your topic with precision. It provides customization options, so you can make changes to the colors, design, graphics, or any other component to create a unique layout. It is also available for immediate download, so you can begin using it right away. Slidegeeks has done good research to ensure that you have everything you need to make your presentation stand out. Make a name out there for a brilliant performance.
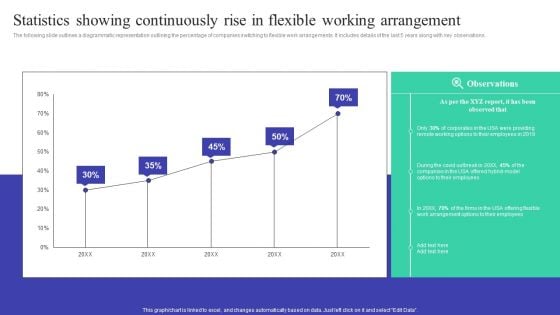
Implementing Adaptive Work Arrangements Statistics Showing Continuously Rise In Flexible Working Arrangement Information PDF
The following slide outlines a diagrammatic representation outlining the percentage of companies switching to flexible work arrangements. It includes details of the last 5 years along with key observations. This Implementing Adaptive Work Arrangements Statistics Showing Continuously Rise In Flexible Working Arrangement Information PDF from Slidegeeks makes it easy to present information on your topic with precision. It provides customization options, so you can make changes to the colors, design, graphics, or any other component to create a unique layout. It is also available for immediate download, so you can begin using it right away. Slidegeeks has done good research to ensure that you have everything you need to make your presentation stand out. Make a name out there for a brilliant performance.
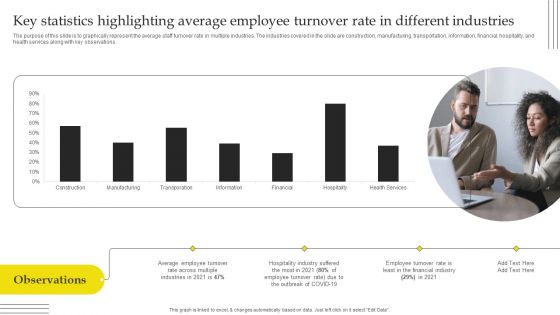
Effective Strategies For Retaining Healthcare Staff Key Statistics Highlighting Average Employee Turnover Rate Brochure PDF
The purpose of this slide is to graphically represent the average staff turnover rate in multiple industries. The industries covered in the slide are construction, manufacturing, transportation, information, financial, hospitality, and health services along with key observations. Want to ace your presentation in front of a live audience Our Effective Strategies For Retaining Healthcare Staff Key Statistics Highlighting Average Employee Turnover Rate Brochure PDF can help you do that by engaging all the users towards you. Slidegeeks experts have put their efforts and expertise into creating these impeccable powerpoint presentations so that you can communicate your ideas clearly. Moreover, all the templates are customizable, and easy to edit and downloadable. Use these for both personal and commercial use.
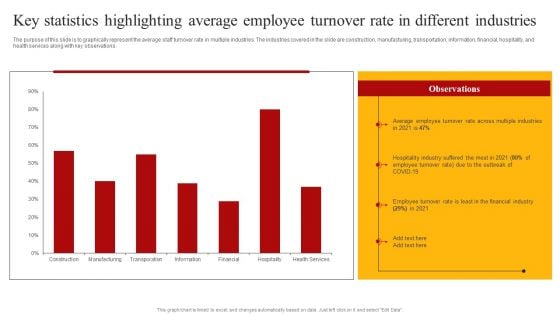
Staff Retention Techniques To Minimize Hiring Expenses Key Statistics Highlighting Average Employee Turnover Clipart PDF
The purpose of this slide is to graphically represent the average staff turnover rate in multiple industries. The industries covered in the slide are construction, manufacturing, transportation, information, financial, hospitality, and health services along with key observations. Want to ace your presentation in front of a live audience Our Staff Retention Techniques To Minimize Hiring Expenses Key Statistics Highlighting Average Employee Turnover Clipart PDF can help you do that by engaging all the users towards you. Slidegeeks experts have put their efforts and expertise into creating these impeccable powerpoint presentations so that you can communicate your ideas clearly. Moreover, all the templates are customizable, and easy to edit and downloadable. Use these for both personal and commercial use.
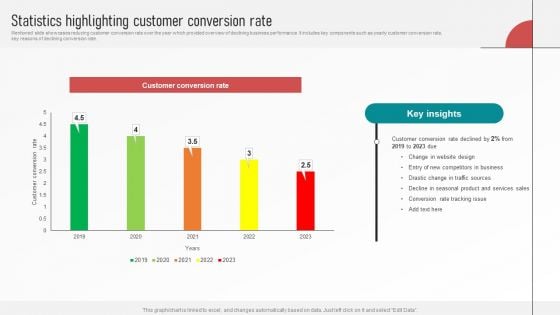
Customer Retention With Email Advertising Campaign Plan Statistics Highlighting Customer Conversion Rate Demonstration PDF
Mentioned slide showcases reducing customer conversion rate over the year which provided overview of declining business performance. It includes key components such as yearly customer conversion rate, key reasons of declining conversion rate. This modern and well arranged Customer Retention With Email Advertising Campaign Plan Statistics Highlighting Customer Conversion Rate Demonstration PDF provides lots of creative possibilities. It is very simple to customize and edit with the Powerpoint Software. Just drag and drop your pictures into the shapes. All facets of this template can be edited with Powerpoint no extra software is necessary. Add your own material, put your images in the places assigned for them, adjust the colors, and then you can show your slides to the world, with an animated slide included.
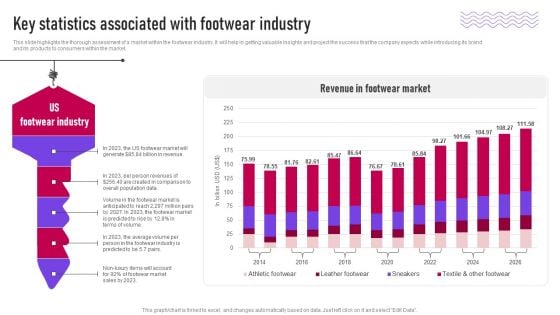
Key Statistics Associated With Footwear Industry Ppt Pictures Graphic Tips PDF
This slide highlights the thorough assessment of a market within the footwear industry. It will help in getting valuable insights and project the success that the company expects while introducing its brand and its products to consumers within the market. Present like a pro with Key Statistics Associated With Footwear Industry Ppt Pictures Graphic Tips PDF Create beautiful presentations together with your team, using our easy to use presentation slides. Share your ideas in real time and make changes on the fly by downloading our templates. So whether you are in the office, on the go, or in a remote location, you can stay in sync with your team and present your ideas with confidence. With Slidegeeks presentation got a whole lot easier. Grab these presentations today.
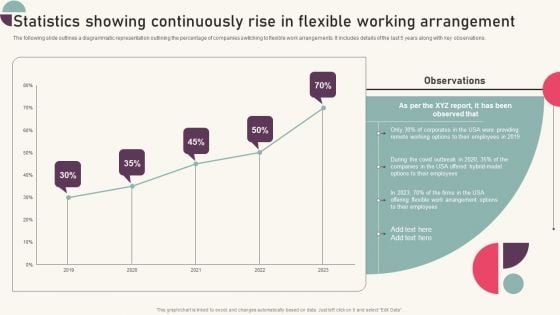
Tactics For Establishing Sustainable Hybrid Work Environment Statistics Showing Continuously Rise In Flexible Formats PDF
The following slide outlines a diagrammatic representation outlining the percentage of companies switching to flexible work arrangements. It includes details of the last 5 years along with key observations. Slidegeeks is one of the best resources for PowerPoint templates. You can download easily and regulate Tactics For Establishing Sustainable Hybrid Work Environment Statistics Showing Continuously Rise In Flexible Formats PDF for your personal presentations from our wonderful collection. A few clicks is all it takes to discover and get the most relevant and appropriate templates. Use our Templates to add a unique zing and appeal to your presentation and meetings. All the slides are easy to edit and you can use them even for advertisement purposes.
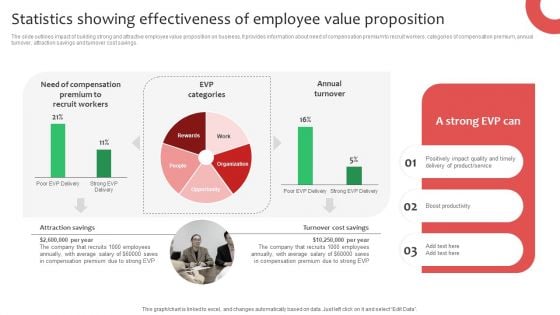
Statistics Showing Effectiveness Of Employee Value Proposition Ppt Layouts Example Introduction PDF
The slide outlines impact of building strong and attractive employee value proposition on business. It provides information about need of compensation premium to recruit workers, categories of compensation premium, annual turnover, attraction savings and turnover cost savings. Slidegeeks is here to make your presentations a breeze with Statistics Showing Effectiveness Of Employee Value Proposition Ppt Layouts Example Introduction PDF With our easy to use and customizable templates, you can focus on delivering your ideas rather than worrying about formatting. With a variety of designs to choose from, you are sure to find one that suits your needs. And with animations and unique photos, illustrations, and fonts, you can make your presentation pop. So whether you are giving a sales pitch or presenting to the board, make sure to check out Slidegeeks first.
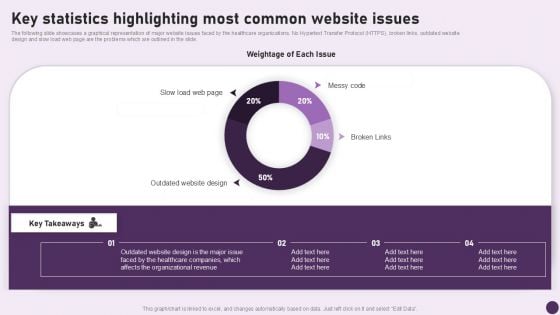
Guide To Healthcare Services Administration Key Statistics Highlighting Most Common Website Issues Introduction PDF
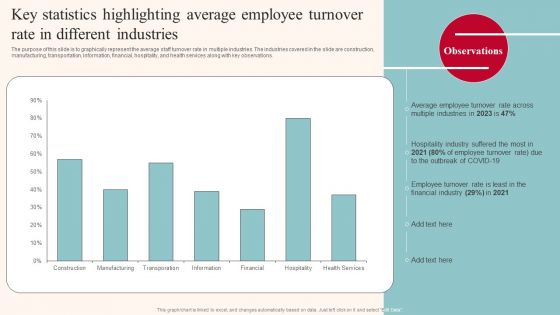
Key Statistics Highlighting Average Employee Turnover Rate In Different Industries Infographics PDF
The purpose of this slide is to graphically represent the average staff turnover rate in multiple industries. The industries covered in the slide are construction, manufacturing, transportation, information, financial, hospitality, and health services along with key observations. Want to ace your presentation in front of a live audience Our Key Statistics Highlighting Average Employee Turnover Rate In Different Industries Infographics PDF can help you do that by engaging all the users towards you. Slidegeeks experts have put their efforts and expertise into creating these impeccable powerpoint presentations so that you can communicate your ideas clearly. Moreover, all the templates are customizable, and easy to edit and downloadable. Use these for both personal and commercial use.
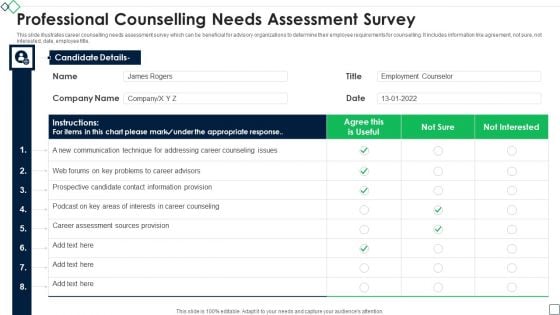
Professional Counselling Needs Assessment Survey Background PDF
This slide illustrates career counselling needs assessment survey which can be beneficial for advisory organizations to determine their employee requirements for counselling. It includes information like agreement, not sure, not interested, date, employee title. Pitch your topic with ease and precision using this Professional Counselling Needs Assessment Survey Background PDF. This layout presents information on Communication Technique, Career Advisors, Career Assessment Sources. It is also available for immediate download and adjustment. So, changes can be made in the color, design, graphics or any other component to create a unique layout.

Market Survey Evaluation Tools Comparison Summary PDF
This slide present a comparison between various tools used for analyzing results from market survey questionnaire. It highlights various tools, features, free trial period, pricing and rating. Pitch your topic with ease and precision using this Market Survey Evaluation Tools Comparison Summary PDF. This layout presents information on Various Tools, Features, Free Trial Period, Pricing And Rating. It is also available for immediate download and adjustment. So, changes can be made in the color, design, graphics or any other component to create a unique layout.
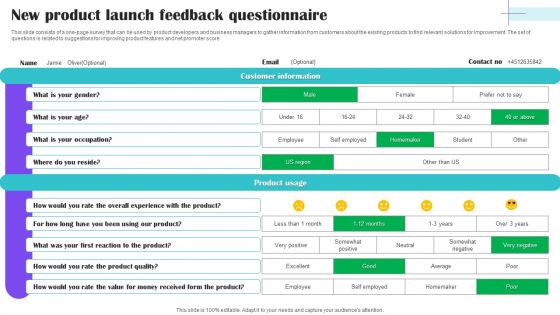
New Product Launch Feedback Questionnaire Survey SS
This slide consists of a one-page survey that can be used by product developers and business managers to gather information from customers about the existing products to find relevant solutions for improvement. The set of questions is related to suggestions for improving product features and net promoter score. Showcasing this set of slides titled New Product Launch Feedback Questionnaire Survey SS. The topics addressed in these templates are Customer Information, Product Usage, Occupation, Value For Money, Overall Experience. All the content presented in this PPT design is completely editable. Download it and make adjustments in color, background, font etc. as per your unique business setting.

Pie Chart Circular 8 Stages Process Cleaning Service Business Plan PowerPoint Slides
We present our pie chart circular 8 stages process cleaning service business plan PowerPoint Slides.Use our Circle Charts PowerPoint Templates because You can Stir your ideas in the cauldron of our PowerPoint Templates and Slides. Cast a magic spell on your audience. Download and present our Signs PowerPoint Templates because It will Strengthen your hand with your thoughts. They have all the aces you need to win the day. Present our Shapes PowerPoint Templates because Our PowerPoint Templates and Slides will provide you a launch platform. Give a lift off to your ideas and send them into orbit. Download our Process and Flows PowerPoint Templates because Our PowerPoint Templates and Slides will provide weight to your words. They will bring out the depth of your thought process. Use our Business PowerPoint Templates because Our PowerPoint Templates and Slides will let Your superior ideas hit the target always and everytime.Use these PowerPoint slides for presentations relating to sign, overview, chart, market, statistics, sales, forecasting, slice, economy, display, corporate, business, concept, presentation, symbol, diagram, percentage, graphic, finance, data, bank, report, marketing, analyzing, trading, accounting, management, graph, icon, earnings, piece, circular, strategy, growth, company, control, competition, progress, account, profit, part, information, investment, banking, index, financial, results, portion, performance, exchange. The prominent colors used in the PowerPoint template are Green, Blue, White. Fall back on our Pie Chart Circular 8 Stages Process Cleaning Service Business Plan PowerPoint Slides at anytime. They are always ready and able to answer your call.
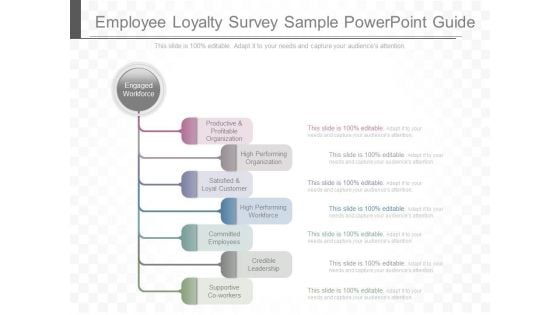
Employee Loyalty Survey Sample Powerpoint Guide
This is a employee loyalty survey sample powerpoint guide. This is a seven stage process. The stages in this process are engaged workforce, productive and profitable organization, high performing organization, satisfied and loyal customer, high performing workforce, committed employees, credible leadership, supportive co workers.
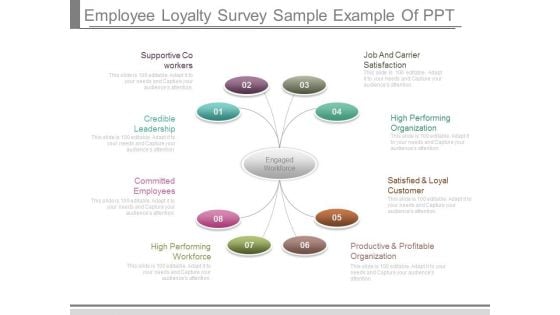
Employee Loyalty Survey Sample Example Of Ppt
This is a employee loyalty survey sample example of ppt. This is a eight stage process. The stages in this process are supportive co workers, credible leadership, committed employees, high performing workforce, productive and profitable organization, satisfied and loyal customer, high performing organization, job and carrier satisfaction, engaged workforce.
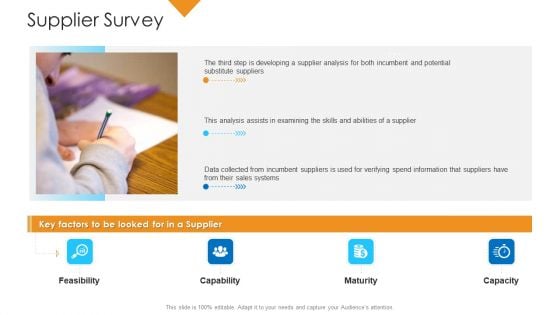
Logistics Management Framework Supplier Survey Infographics PDF
Presenting logistics management framework supplier survey infographics pdf to provide visual cues and insights. Share and navigate important information on four stages that need your due attention. This template can be used to pitch topics like feasibility, capability, maturity, capacity. In addtion, this PPT design contains high resolution images, graphics, etc, that are easily editable and available for immediate download.
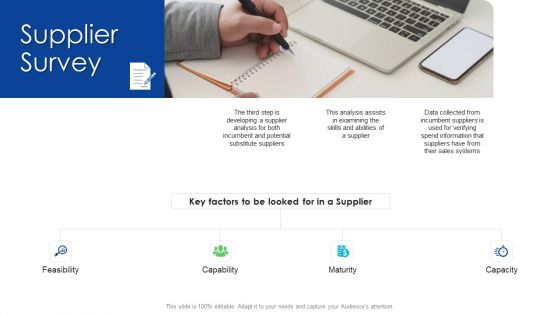
Logistics Management Services Supplier Survey Graphics PDF
Presenting logistics management services supplier survey graphics pdf to provide visual cues and insights. Share and navigate important information on four stages that need your due attention. This template can be used to pitch topics like feasibility, capability, maturity. In addtion, this PPT design contains high resolution images, graphics, etc, that are easily editable and available for immediate download.
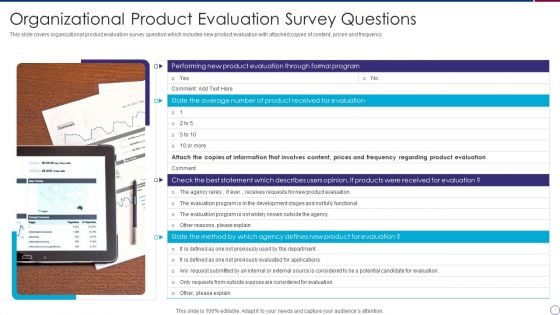
Organizational Product Evaluation Survey Questions Information PDF
Persuade your audience using this Organizational Product Evaluation Survey Questions Information PDF. This PPT design covers one stage, thus making it a great tool to use. It also caters to a variety of topics including Product Received, Received Evaluation, Product For Evaluation. Download this PPT design now to present a convincing pitch that not only emphasizes the topic but also showcases your presentation skills.
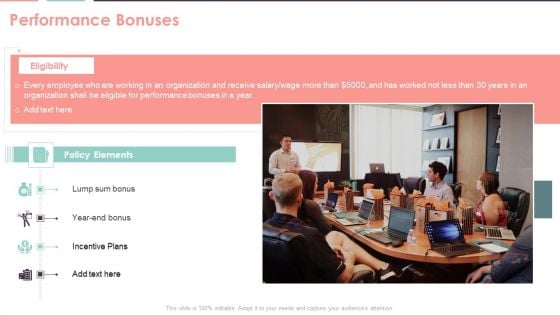
Compensation Survey Sheet Performance Bonuses Mockup PDF
Deliver an awe inspiring pitch with this creative Compensation Survey Sheet Performance Bonuses Mockup PDF bundle. Topics like Incentive Plans, Bonus Amount, Lump Sum Bonus can be discussed with this completely editable template. It is available for immediate download depending on the needs and requirements of the user.
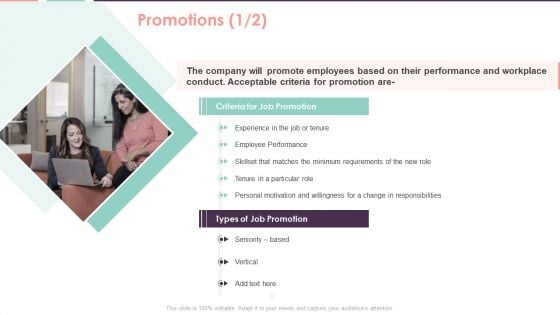
Compensation Survey Sheet Promotions Microsoft PDF
Presenting Compensation Survey Sheet Promotions Microsoft PDF to provide visual cues and insights. Share and navigate important information on two stages that need your due attention. This template can be used to pitch topics like Minimum Requirements, Employee Performance. In addtion, this PPT design contains high resolution images, graphics, etc, that are easily editable and available for immediate download.
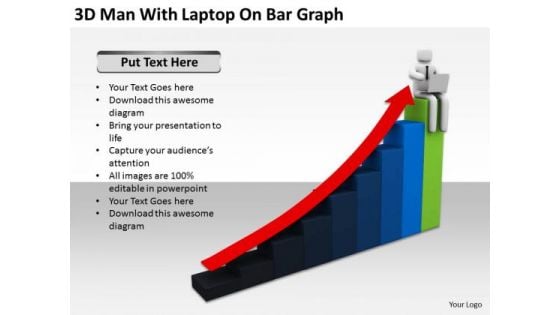
Business People Pictures 3d Man With Laptop On Bar Graph PowerPoint Slides
We present our business people pictures 3d man with laptop on bar graph PowerPoint Slides.Use our Arrows PowerPoint Templates because Our PowerPoint Templates and Slides are created by a hardworking bunch of busybees. Always flitting around with solutions gauranteed to please. Download our Business PowerPoint Templates because Our PowerPoint Templates and Slides are created with admirable insight. Use them and give your group a sense of your logical mind. Download and present our Success PowerPoint Templates because our PowerPoint Templates and Slides will give your ideas the shape. Use our Shapes PowerPoint Templates because Our PowerPoint Templates and Slides will let Your superior ideas hit the target always and everytime. Present our Technology PowerPoint Templates because Our PowerPoint Templates and Slides offer you the needful to organise your thoughts. Use them to list out your views in a logical sequence.Use these PowerPoint slides for presentations relating to 3d, Achievement, Analyst, Arrow, Background, Bar, Business, Businessman, Chart, Communication, Computer, Comunication, Concept, Diagram, Equipment, Finance, Financial, Future, Graph, Graphic, Grow, Growth, Human, Icon, Improve, Income, Increase, Internet, Isolated, Laptop, Man, Market, Measure, People, Professional, Profit, Progress, Rate, Sales, Sign, Siting, Statistic, Success, Symbol, Technology, Up, Win, Winner, Work, Worker. The prominent colors used in the PowerPoint template are Red, Green, Gray. Increase productivity with our Business People Pictures 3d Man With Laptop On Bar Graph PowerPoint Slides. You will come out on top.


 Continue with Email

 Home
Home


