Client Presentation
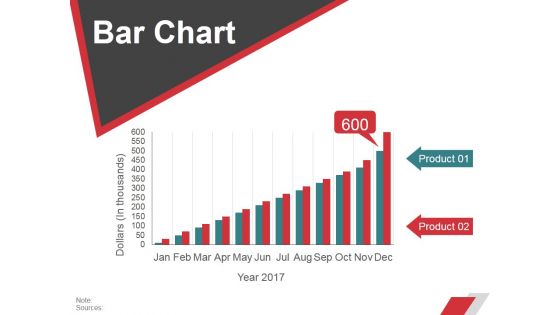
Bar Chart Ppt PowerPoint Presentation Layouts Visuals
This is a bar chart ppt powerpoint presentation layouts visuals. This is a two stage process. The stages in this process are business, strategy, marketing, planning, chart and graph.
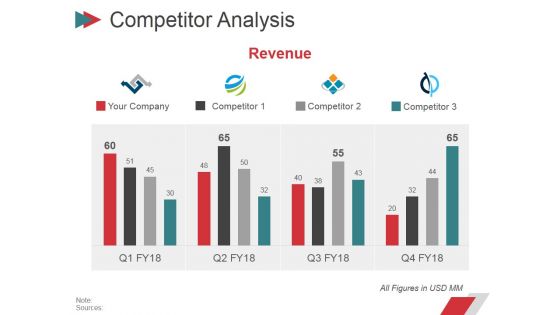
Competitor Analysis Ppt PowerPoint Presentation File Layout
This is a competitor analysis ppt powerpoint presentation file layout. This is a four stage process. The stages in this process are business, strategy, marketing, planning, market share, competitor.
Silhouettes Ppt PowerPoint Presentation Outline Information
This is a silhouettes ppt powerpoint presentation outline information. This is a five stage process. The stages in this process are business, strategy, marketing, analysis, silhouettes, work management, teamwork.
Mind Map Ppt PowerPoint Presentation Portfolio Backgrounds
This is a mind map ppt powerpoint presentation portfolio backgrounds. This is a one stage process. The stages in this process are business, computer, mind map, memory, success, technology.
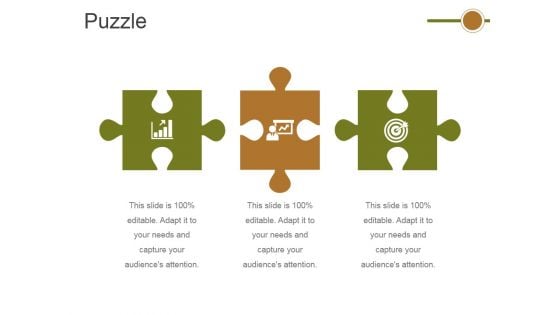
Puzzle Ppt PowerPoint Presentation Layouts Example Introduction
This is a puzzle ppt powerpoint presentation layouts example introduction. This is a three stage process. The stages in this process are puzzle, icons, marketing, strategy, problem, solution, business.
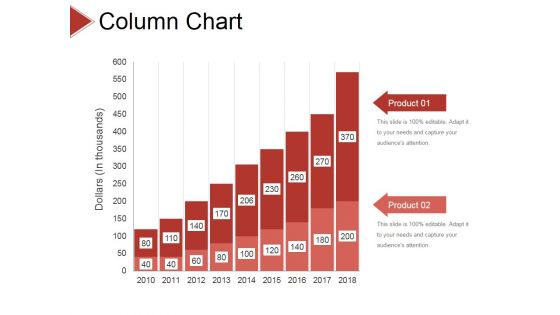
Column Chart Ppt PowerPoint Presentation Gallery Layouts
This is a column chart ppt powerpoint presentation gallery layouts. This is a two stage process. The stages in this process are business, strategy, analysis, pretention, chart and graph, growth.
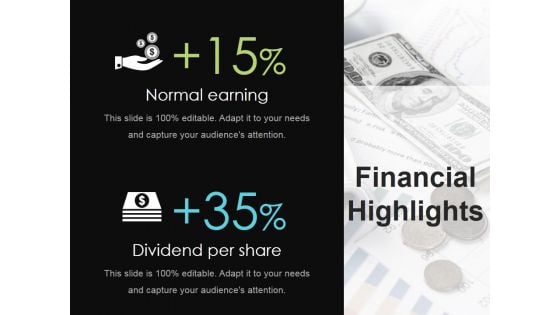
Financial Highlights Ppt Powerpoint Presentation Model Outfit
This is a financial highlights ppt powerpoint presentation model outfit. This is a two stage process. The stages in this process are dividend per share, normal earning, strategy, marketing, business.
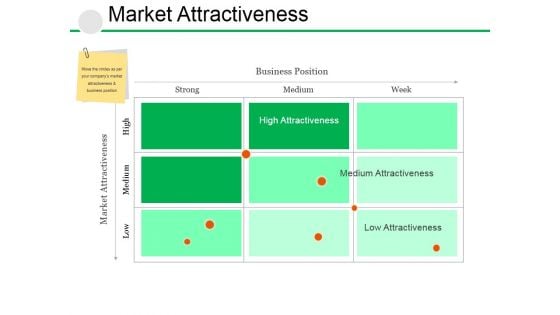
Market Attractiveness Ppt PowerPoint Presentation Layouts Guide
This is a market attractiveness ppt powerpoint presentation layouts guide. This is a three stage process. The stages in this process are business position, medium, strong, weak, medium attractiveness, low attractiveness.

Timeline Ppt PowerPoint Presentation Ideas Background Image
This is a timeline ppt powerpoint presentation ideas background image. This is a five stage process. The stages in this process are business, strategy, analysis, marketing, time line, time management.
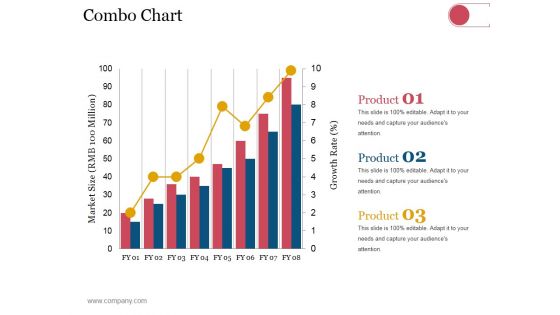
Combo Chart Ppt PowerPoint Presentation Inspiration Information
This is a combo chart ppt powerpoint presentation inspiration information. This is a eight stage process. The stages in this process are business, strategy, analysis, planning, combo chart, market size, growth rate.
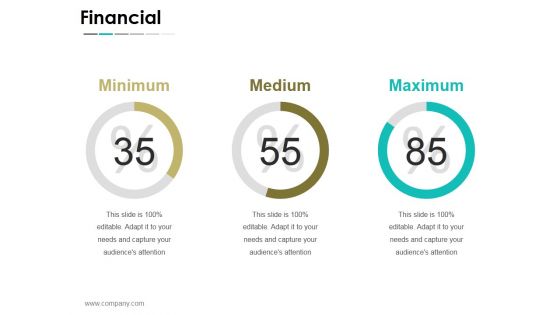
Financial Ppt PowerPoint Presentation Summary Clipart Images
This is a financial ppt powerpoint presentation summary clipart images. This is a three stage process. The stages in this process are business, strategy, analysis, planning, minimum, medium, maximum.

Case Study Ppt PowerPoint Presentation Infographics Maker
This is a case study ppt powerpoint presentation infographics maker. This is a three stage process. The stages in this process are business, case study, finance, marketing, strategy, success.
Scatter Chart Ppt PowerPoint Presentation Icon Elements
This is a scatter chart ppt powerpoint presentation icon elements. This is a nine stage process. The stages in this process are dollar in billions, sales in percentage, business, success.
Bar Chart Ppt PowerPoint Presentation Portfolio Icons
This is a bar chart ppt powerpoint presentation portfolio icons. This is a seven stage process. The stages in this process are in years, in percentage, finance, business marketing.
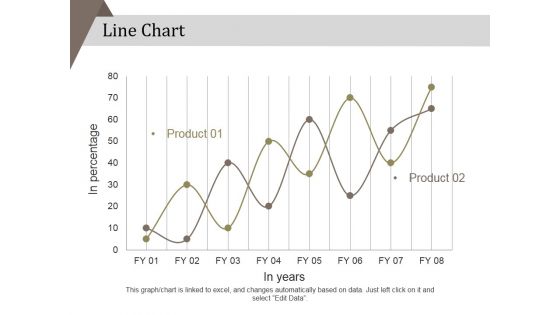
Line Chart Ppt PowerPoint Presentation Layouts Professional
This is a line chart ppt powerpoint presentation layouts professional. This is a two stage process. The stages in this process are in percentage, product, in years, strategy, marketing, business.
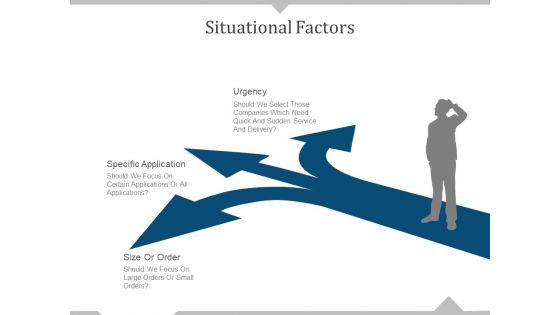
Situational Factors Ppt PowerPoint Presentation Infographics Aids
This is a situational factors ppt powerpoint presentation infographics aids. This is a three stage process. The stages in this process are urgency, specific application, size or order, business, planning, management.
Distribution Growth Ppt PowerPoint Presentation Slides Icons
This is a distribution growth ppt powerpoint presentation slides icons. This is a six stage process. The stages in this process are business, bar graph, finance, marketing, strategy, growth.

Evaluation Or Results Ppt PowerPoint Presentation Templates
This is a evaluation or results ppt powerpoint presentation templates. This is a one stage process. The stages in this process are our goal, arrow, competition, marketing, strategy, business.
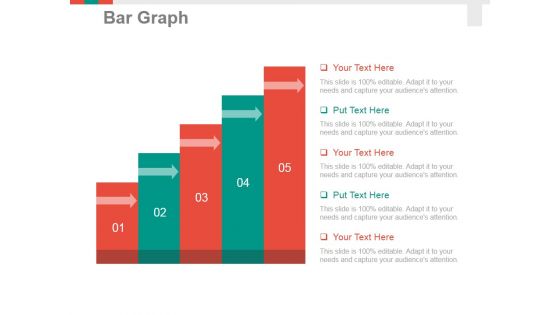
Bar Graph Ppt PowerPoint Presentation Pictures Tips
This is a bar graph ppt powerpoint presentation pictures tips. This is a five stage process. The stages in this process are bar graph, finance, marketing, strategy, analysis, business.
Post It Ppt PowerPoint Presentation Ideas Introduction
This is a post it ppt powerpoint presentation ideas introduction. This is a four stage process. The stages in this process are post it, education, knowledge, icons, marketing, business.
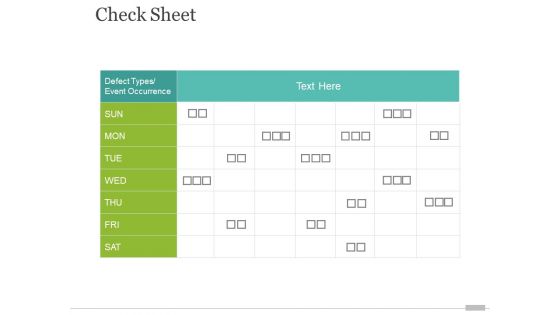
Check Sheet Ppt PowerPoint Presentation Ideas Slides
This is a check sheet ppt powerpoint presentation ideas slides. This is a two stage process. The stages in this process are defect types event occurrence, business, analysis, strategy, marketing.
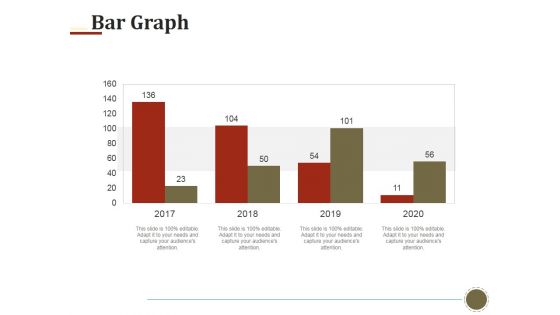
Bar Graph Ppt PowerPoint Presentation Styles Model
This is a bar graph ppt powerpoint presentation styles model. This is a four stage process. The stages in this process are bar graph, finance, marketing, analysis, investment, business.
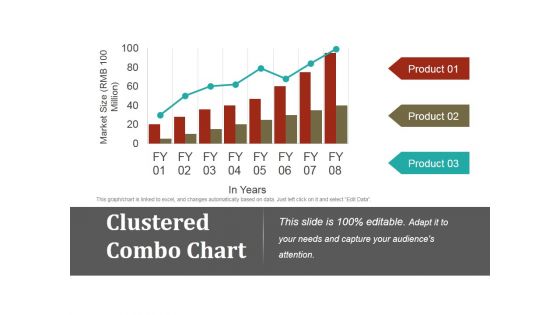
Clustered Combo Chart Ppt PowerPoint Presentation Show
This is a clustered combo chart ppt powerpoint presentation show. This is a eigth stage process. The stages in this process are clustered combo chart, finance, marketing, strategy, investment, business.
Target Ppt PowerPoint Presentation Pictures Visual Aids
This is a target ppt powerpoint presentation pictures visual aids. This is a four stage process. The stages in this process are target, arrow, marketing, strategy, business, competition, success.
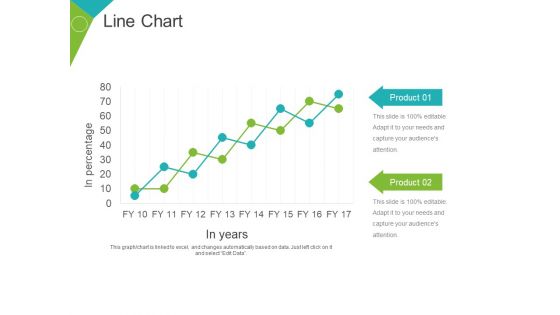
Line Chart Ppt PowerPoint Presentation Gallery Objects
This is a line chart ppt powerpoint presentation gallery objects. This is a two stage process. The stages in this process are product, business, marketing, growth, in years, in percentage.
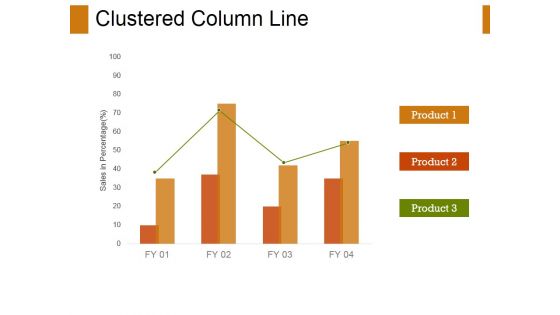
Clustered Column-Line Ppt PowerPoint Presentation Ideas Diagrams
This is a clustered column-line ppt powerpoint presentation ideas diagrams. This is a three stage process. The stages in this process are clustered column line, business, finance, marketing, strategy.
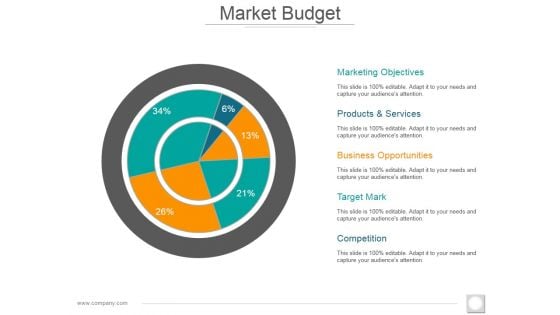
Market Budget Ppt PowerPoint Presentation Outline Backgrounds
This is a market budget ppt powerpoint presentation outline backgrounds. This is a five stage process. The stages in this process are marketing objectives, products and services, business opportunities, target mark, competition.
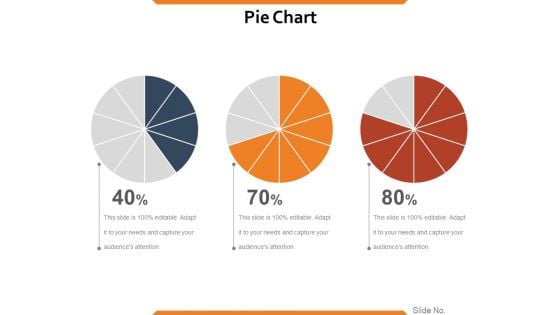
Pie Chart Ppt PowerPoint Presentation Infographics Show
This is a pie chart ppt powerpoint presentation infographics show. This is a three stage process. The stages in this process are process, percentage, business, marketing, success, pie chart.
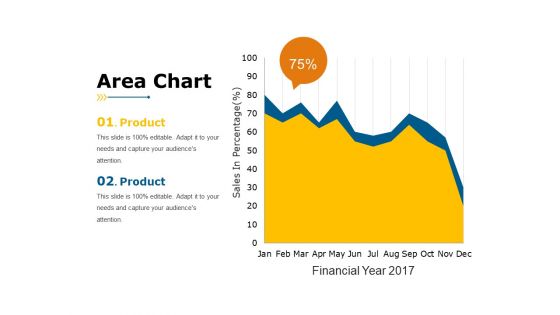
Area Chart Ppt PowerPoint Presentation Slides Rules
This is a area chart ppt powerpoint presentation slides rules. This is a two stage process. The stages in this process are sales in percentage, business, marketing, product, finance.
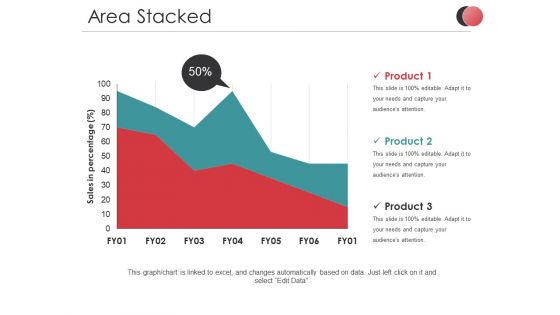
Area Stacked Ppt PowerPoint Presentation Diagram Images
This is a area stacked ppt powerpoint presentation diagram images. This is a two stage process. The stages in this process are sales in percentage, product, business, marketing, finance.
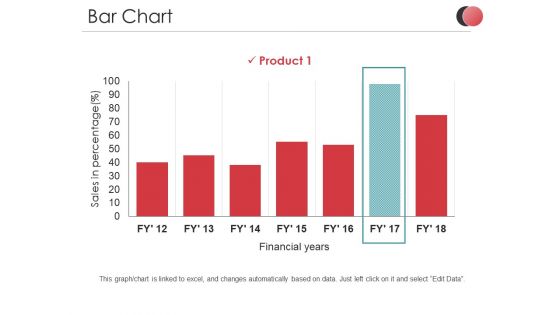
Bar Chart Ppt PowerPoint Presentation Outline Introduction
This is a bar chart ppt powerpoint presentation outline introduction. This is a one stage process. The stages in this process are sales in percentage, product, business, financial years, graph.
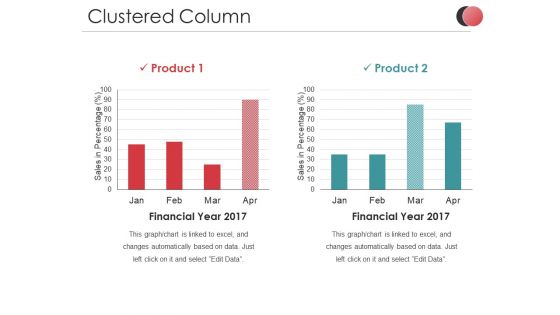
Clustered Column Ppt PowerPoint Presentation Slides Ideas
This is a clustered column ppt powerpoint presentation slides ideas. This is a two stage process. The stages in this process are sales in percentage, business, marketing, finance, graph.
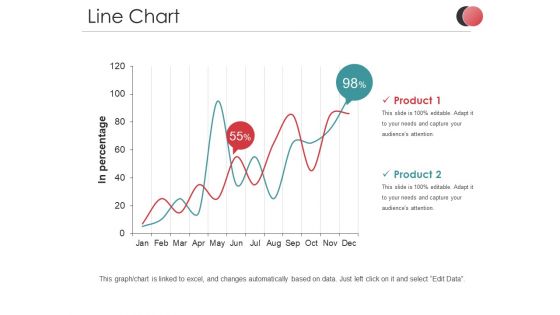
Line Chart Ppt PowerPoint Presentation Professional Ideas
This is a line chart ppt powerpoint presentation professional ideas. This is a two stage process. The stages in this process are in percentage, product, business, marketing, finance, percentage.
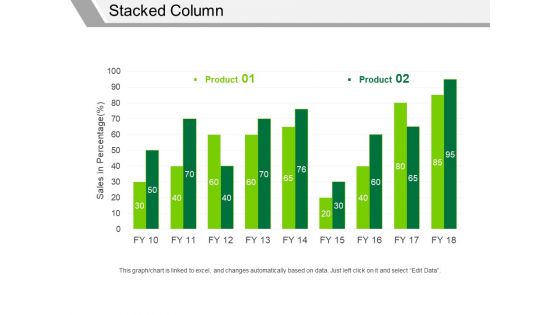
Stacked Column Ppt PowerPoint Presentation Infographics Samples
This is a stacked column ppt powerpoint presentation infographics samples. This is a two stage process. The stages in this process are product, sales in percentage, business, marketing, graph.
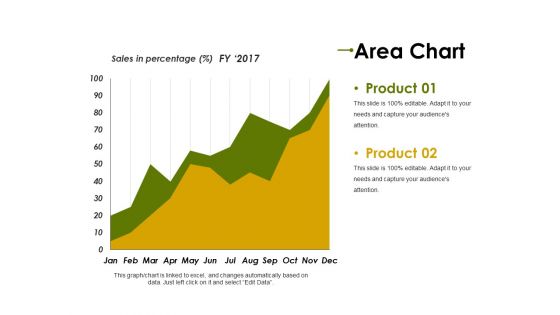
Area Chart Ppt PowerPoint Presentation Summary Objects
This is a area chart ppt powerpoint presentation summary objects. This is a two stage process. The stages in this process are product, sales in percentage, finance, business, marketing.

Column Chart Ppt PowerPoint Presentation Layouts Ideas
This is a column chart ppt powerpoint presentation layouts ideas. This is a two stage process. The stages in this process are dollars in thousands, strategy, business, graph, product.
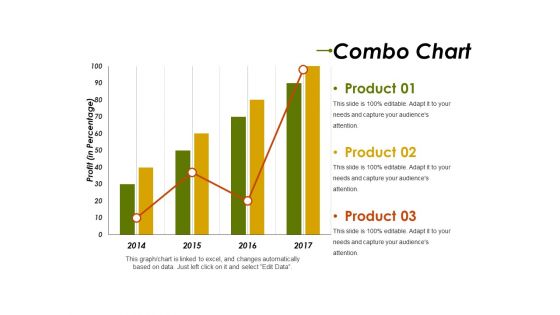
Combo Chart Ppt PowerPoint Presentation Infographics Introduction
This is a combo chart ppt powerpoint presentation infographics introduction. This is a three stage process. The stages in this process are profit in percentage, business, graph, strategy, product.
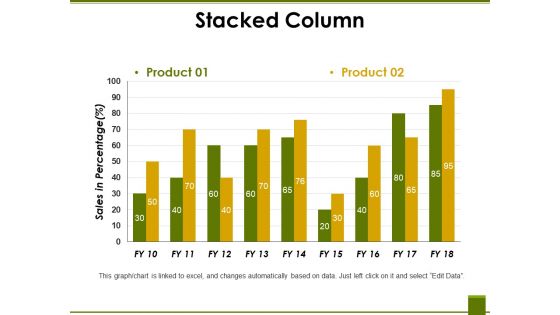
Stacked Column Ppt PowerPoint Presentation Professional Vector
This is a stacked column ppt powerpoint presentation professional vector. This is a two stage process. The stages in this process are product, sales in percentage, business, marketing, graph.
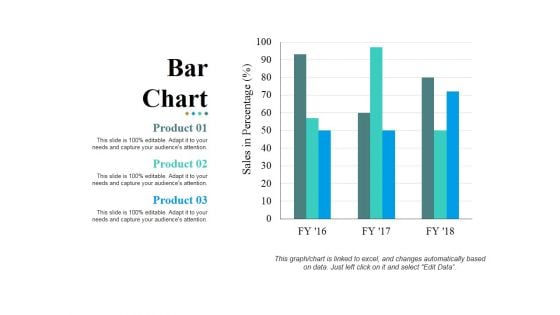
Bar Chart Ppt PowerPoint Presentation Layouts Pictures
This is a bar chart ppt powerpoint presentation layouts pictures. This is a three stage process. The stages in this process are bar graph, product, sales in percentage, business, marketing.
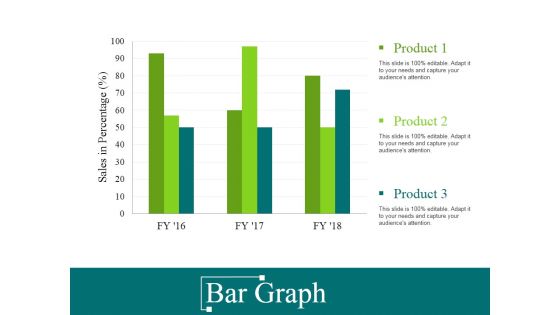
Bar Graph Ppt PowerPoint Presentation Gallery Grid
This is a bar graph ppt powerpoint presentation gallery grid. This is a three stage process. The stages in this process are sales in percentage, product, finance, business, marketing.
Scatter Chart Ppt PowerPoint Presentation Professional Icons
This is a scatter chart ppt powerpoint presentation professional icons. This is a six stage process. The stages in this process are in dollars, in percentage, graph, business, marketing.
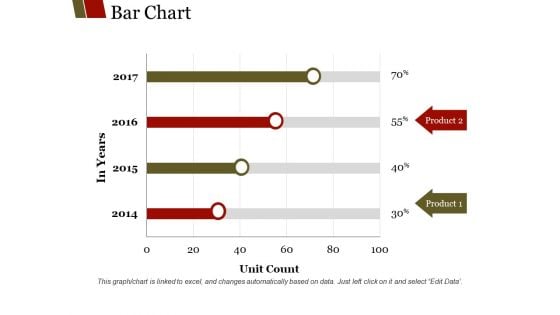
Bar Chart Ppt PowerPoint Presentation Outline Guidelines
This is a bar chart ppt powerpoint presentation outline guidelines. This is a four stage process. The stages in this process are product, unit count, in years, graph, finance, business.
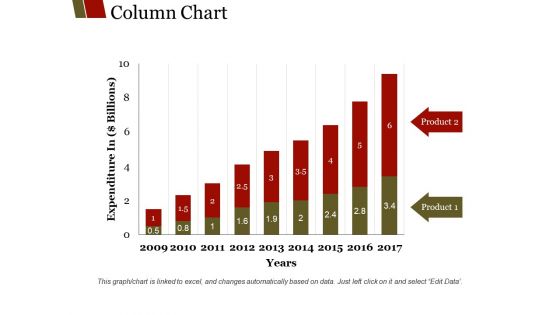
Column Chart Ppt PowerPoint Presentation Summary Graphics
This is a column chart ppt powerpoint presentation summary graphics. This is a nine stage process. The stages in this process are product, years, expenditure in billions, graph, business.
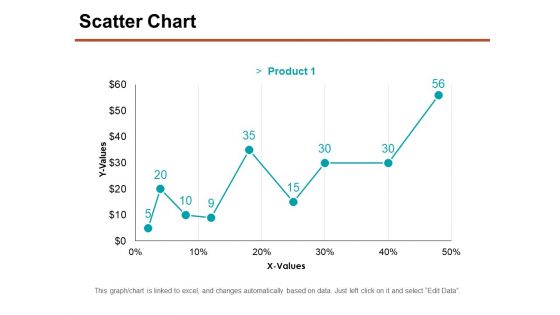
Scatter Chart Ppt PowerPoint Presentation Ideas Templates
This is a scatter chart ppt powerpoint presentation ideas templates. This is a nine stage process. The stages in this process are y values, x values, product, graph, business.
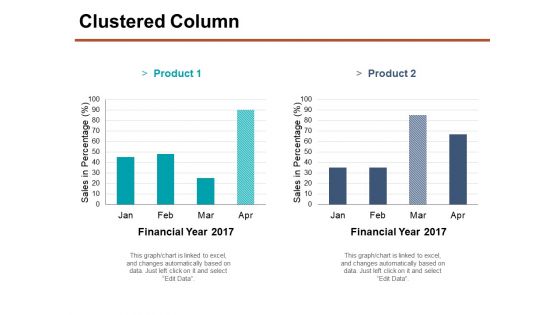
Clustered Column Ppt PowerPoint Presentation Portfolio Smartart
This is a clustered column ppt powerpoint presentation portfolio smartart. This is a two stage process. The stages in this process are financial year, product, sales in percentage, finance, business, graph.
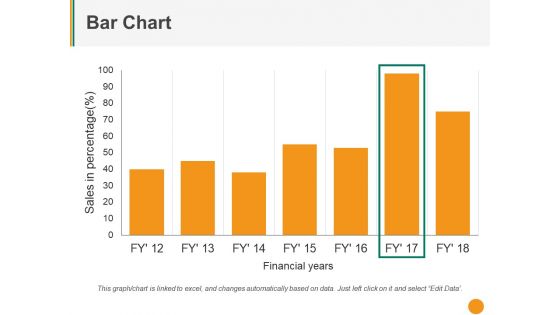
Bar Chart Ppt PowerPoint Presentation Styles Outfit
This is a bar chart ppt powerpoint presentation styles outfit. This is a Seven stage process. The stages in this process are sales in percentage, financial years, graph, business.
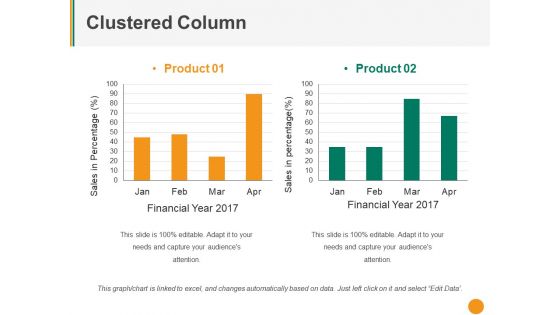
Clustered Column Ppt PowerPoint Presentation Pictures Mockup
This is a clustered column ppt powerpoint presentation pictures mockup. This is a two stage process. The stages in this process are product, sales in percentage, financial year, graph, business.
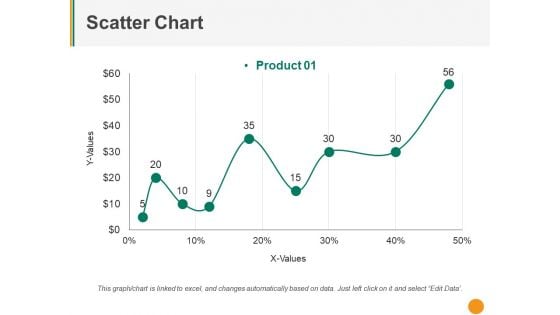
Scatter Chart Ppt PowerPoint Presentation Summary Smartart
This is a scatter chart ppt powerpoint presentation summary smartart. This is a nine stage process. The stages in this process are y values, x values, product, business, graph.
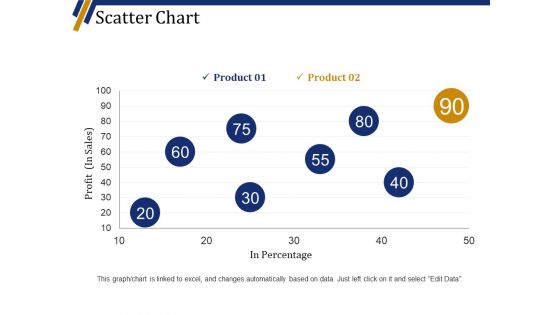
Scatter Chart Ppt PowerPoint Presentation Summary Visuals
This is a scatter chart ppt powerpoint presentation summary visuals. This is a eight stage process. The stages in this process are product, profit in sales, in percentage, finance, business.
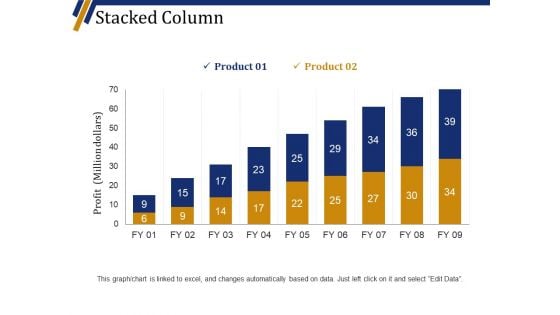
Stacked Column Ppt PowerPoint Presentation Professional Template
This is a stacked column ppt powerpoint presentation professional template. This is a nine stage process. The stages in this process are product, profit million dollars, business, marketing, graph.
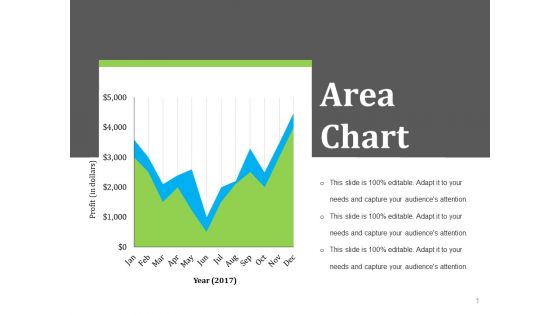
Area Chart Ppt PowerPoint Presentation Model Examples
This is a area chart ppt powerpoint presentation model examples. This is a two stage process. The stages in this process are year profit in dollars, business, strategy, growth.

Key Management Ppt PowerPoint Presentation Model Professional
This is a key management ppt powerpoint presentation model professional. This is a three stage process. The stages in this process are john carter, peter clark, elisabeth smith, team, business.
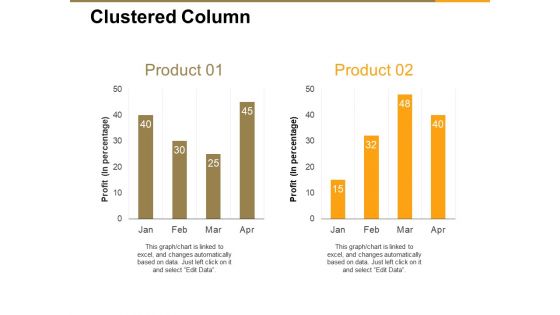
Clustered Column Ppt PowerPoint Presentation Inspiration Shapes
This is a clustered column ppt powerpoint presentation inspiration shapes. This is a two stage process. The stages in this process are profit in percentage, business, marketing, graph, finance.

Key Management Ppt PowerPoint Presentation Layouts Brochure
This is a key management ppt powerpoint presentation layouts brochure. This is a three stage process. The stages in this process are john carter, peter clark, elisabeth smith, management, business, team.
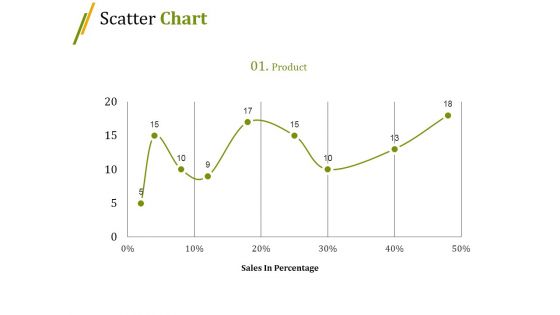
Scatter Chart Ppt PowerPoint Presentation Slides Summary
This is a scatter chart ppt powerpoint presentation slides summary. This is a nine stage process. The stages in this process are sales in percentage, growth, graph, business, marketing.
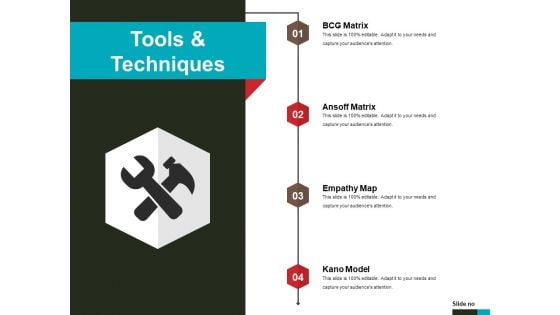
Tools And Techniques Ppt PowerPoint Presentation Ideas
This is a tools and techniques ppt powerpoint presentation ideas. This is a four stage process. The stages in this process are bcg matrix, ansoff matrix, empathy map, kano model, business.
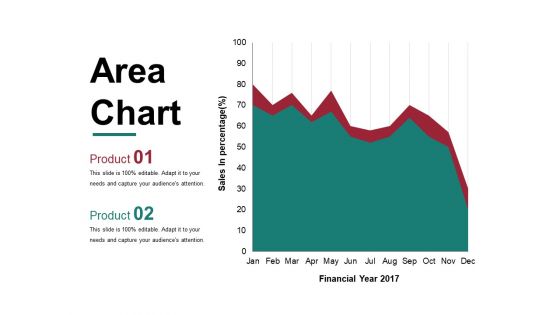
Area Chart Ppt PowerPoint Presentation Layouts Maker
This is a area chart ppt powerpoint presentation layouts maker. This is a two stage process. The stages in this process are financial year, sales in percentage, graph, business, marketing.
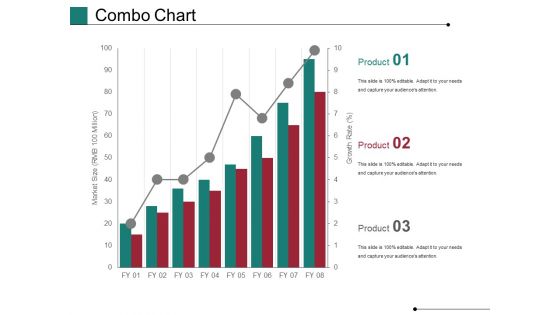
Combo Chart Ppt PowerPoint Presentation Styles Objects
This is a combo chart ppt powerpoint presentation styles objects. This is a three stage process. The stages in this process are market size growth rate, growth, business, marketing, graph.
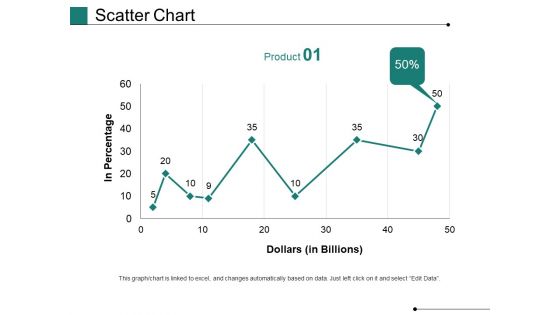
Scatter Chart Ppt PowerPoint Presentation Gallery Show
This is a scatter chart ppt powerpoint presentation gallery show. This is a one stage process. The stages in this process are in percentage, dollars, business, marketing, growth, graph.
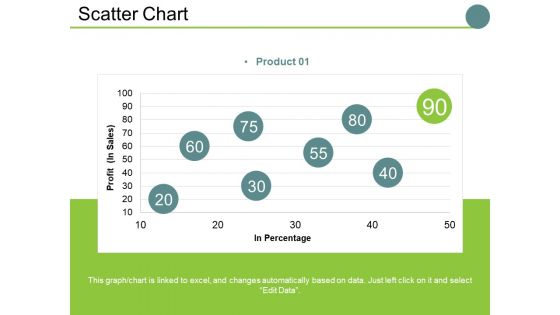
Scatter Chart Ppt PowerPoint Presentation Slides Examples
This is a scatter chart ppt powerpoint presentation slides examples. This is a one stage process. The stages in this process are profit , in percentage, business, marketing, finance, graph.


 Continue with Email

 Home
Home


