Client Presentation
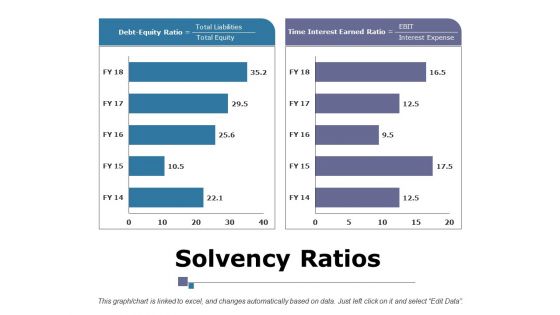
Solvency Ratios Ppt PowerPoint Presentation Summary Layouts
This is a solvency ratios ppt powerpoint presentation summary layouts. This is a two stage process. The stages in this process are business, marketing, strategy, debt equity ratio, time interest earned ratio, finance.
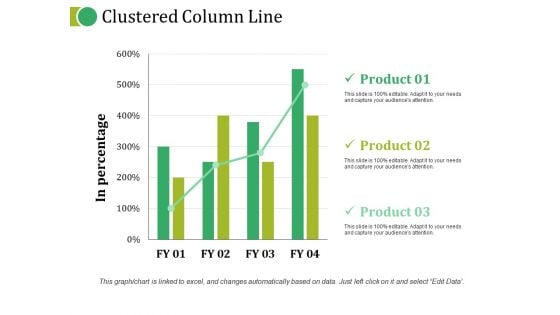
Clustered Column Line Ppt PowerPoint Presentation Topics
This is a clustered column line ppt powerpoint presentation topics. This is a three stage process. The stages in this process are product, in percentage, growth, bar graph, business.
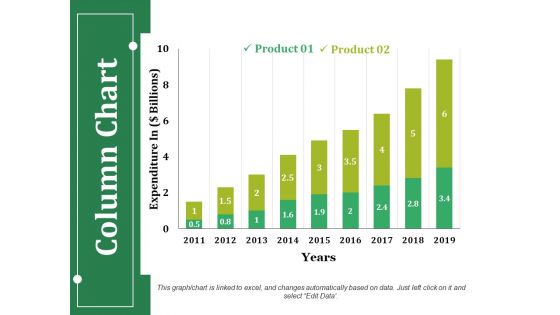
Column Chart Ppt PowerPoint Presentation Infographics Guidelines
This is a column chart ppt powerpoint presentation infographics guidelines. This is a two stage process. The stages in this process are product, expenditure in, years, business, bar graph.
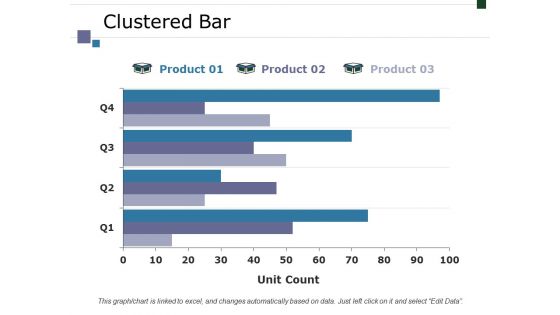
Clustered Bar Ppt PowerPoint Presentation Styles Graphics
This is a clustered bar ppt powerpoint presentation styles graphics. This is a three stage process. The stages in this process are business, marketing, finance, graph, strategy, unit count.
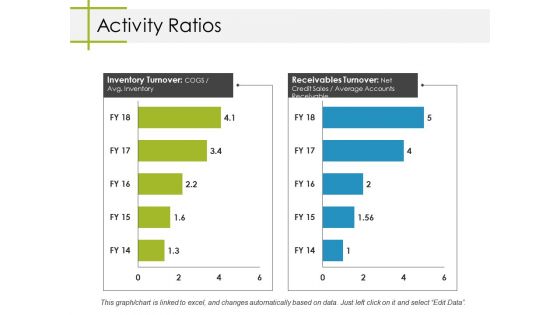
Activity Ratios Ppt PowerPoint Presentation Summary Mockup
This is a activity ratios ppt powerpoint presentation summary mockup. This is a two stage process. The stages in this process are business, inventory turnover, receivables turnover, marketing, finance.
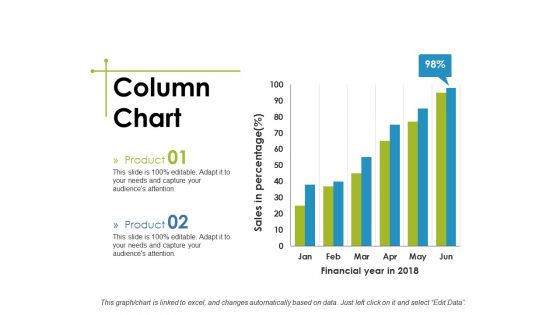
Column Chart Ppt PowerPoint Presentation Show Structure
This is a column chart ppt powerpoint presentation show structure. This is a two stage process. The stages in this process are business, financial year in, sales in percentage, marketing, graph.
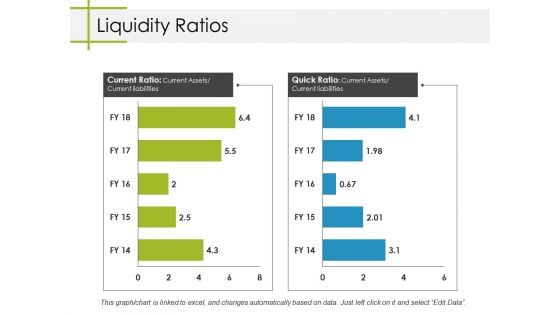
Liquidity Ratios Ppt PowerPoint Presentation Layouts Gridlines
This is a liquidity ratios ppt powerpoint presentation layouts gridlines. This is a two stage process. The stages in this process are business, marketing, current ratio, quick ratio, finance.
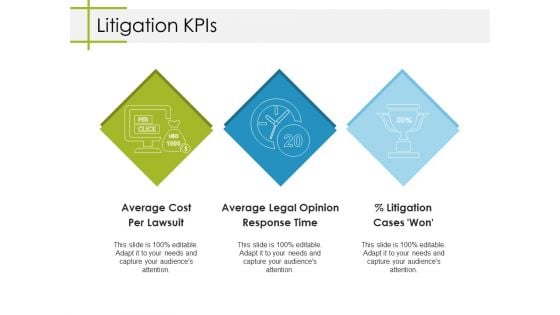
Litigation Kpis Ppt PowerPoint Presentation Model Aids
This is a litigation kpis ppt powerpoint presentation model aids. This is a three stage process. The stages in this process are average cost per lawsuit, average legal opinion response time, litigation cases won, business, marketing.
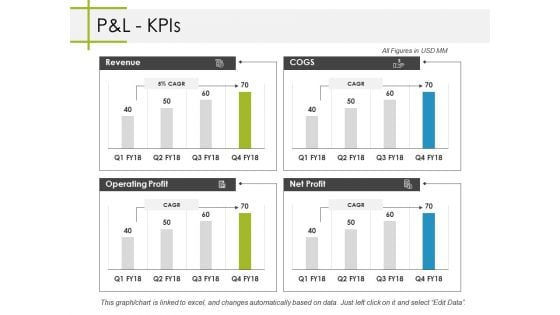
Pandl Kpis Ppt PowerPoint Presentation Professional Backgrounds
This is a pandl kpis ppt powerpoint presentation professional backgrounds. This is a four stage process. The stages in this process are business, revenue, operating profit, cogs, net profit.
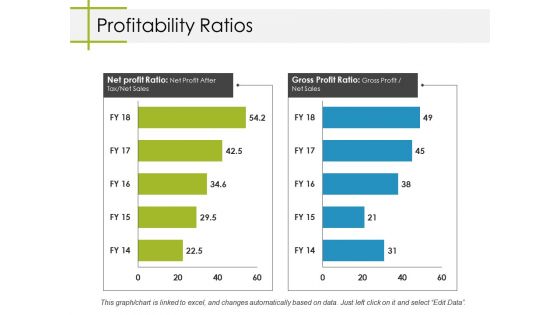
Profitability Ratios Ppt PowerPoint Presentation Inspiration Information
This is a profitability ratios ppt powerpoint presentation inspiration information. This is a two stage process. The stages in this process are business, net profit ratio, gross profit ratio, marketing, graph.
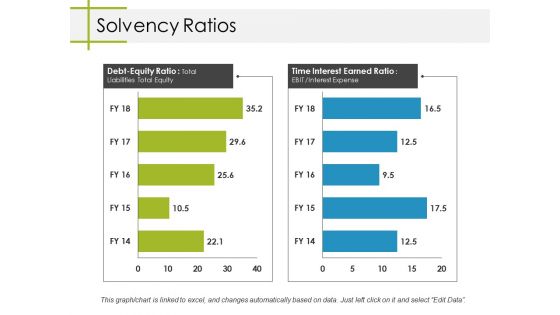
Solvency Ratios Ppt PowerPoint Presentation Professional Rules
This is a solvency ratios ppt powerpoint presentation professional rules. This is a two stage process. The stages in this process are business, marketing, debt equity ratio, time interest earned ratio, graph.
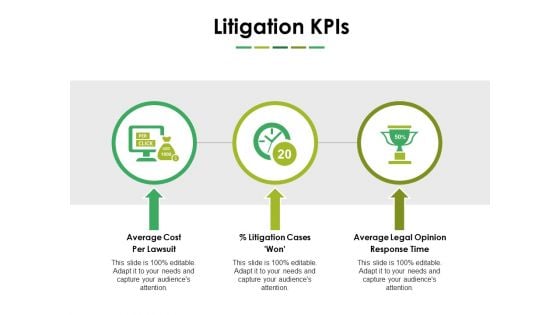
Litigation Kpis Ppt PowerPoint Presentation Model Portrait
This is a litigation kpis ppt powerpoint presentation model portrait. This is a three stage process. The stages in this process are average cost per lawsuit, litigation cases won, average legal opinion response time, business, marketing.
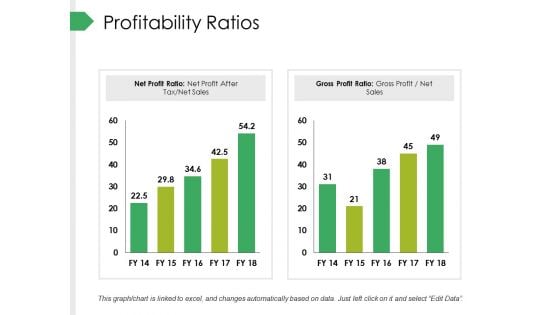
Profitability Ratios Ppt PowerPoint Presentation Summary Outline
This is a profitability ratios ppt powerpoint presentation summary outline. This is a two stage process. The stages in this process are business, net profit ratio, gross profit ratio, marketing, graph.
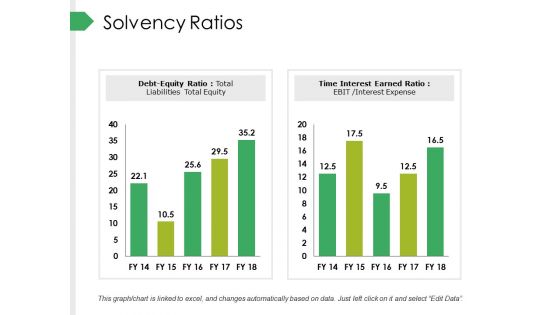
Solvency Ratios Ppt PowerPoint Presentation Outline Ideas
This is a solvency ratios ppt powerpoint presentation outline ideas. This is a two stage process. The stages in this process are business, marketing, debt equity ratio, time interest earned ratio, finance.

Our Goal Ppt PowerPoint Presentation Inspiration Outfit
This is a our goal ppt powerpoint presentation inspiration outfit. This is a three stage process. The stages in this process are business, marketing, awareness, quality, success, our goal.
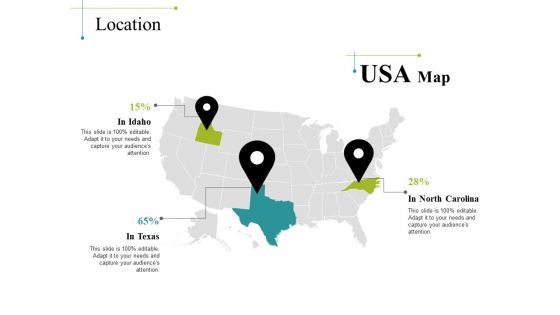
Location Ppt PowerPoint Presentation Infographic Template Images
This is a location ppt powerpoint presentation infographic template images. This is a three stage process. The stages in this process are business, in idaho, in texas, in north carolina, location.
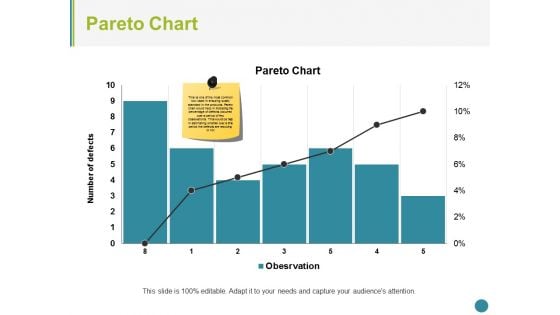
Pareto Chart Ppt PowerPoint Presentation Summary Structure
This is a pareto chart ppt powerpoint presentation summary structure. This is a seven stage process. The stages in this process are pareto chart, finance, marketing, strategy, analysis, business.
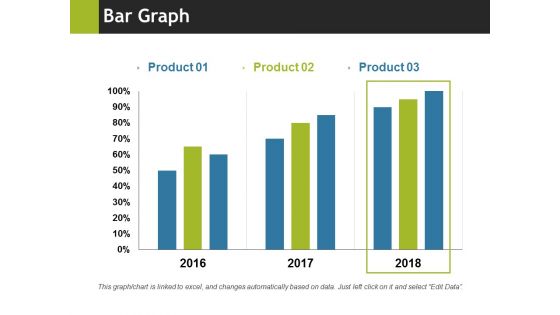
Bar Graph Ppt PowerPoint Presentation Summary Format
This is a bar graph ppt powerpoint presentation summary format. This is a three stage process. The stages in this process are bar graph, business, marketing, years, percentage, finance.
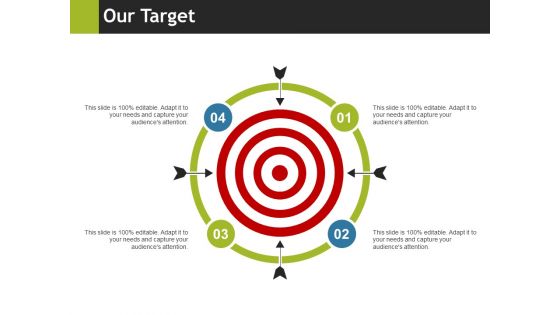
Our Target Ppt PowerPoint Presentation Outline Show
This is a our target ppt powerpoint presentation outline show. This is a four stage process. The stages in this process are business, marketing, our goal, competition, our target.
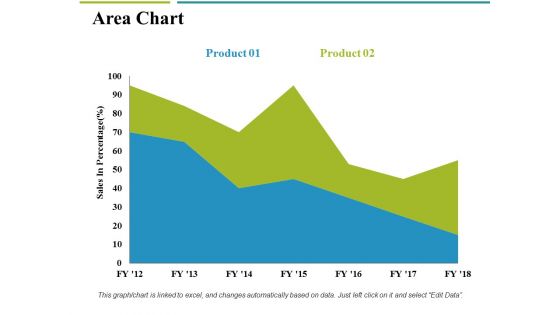
Area Chart Ppt PowerPoint Presentation Ideas Professional
This is a area chart ppt powerpoint presentation ideas professional. This is a two stage process. The stages in this process are business, sales in percentage, area chart, marketing, finance.
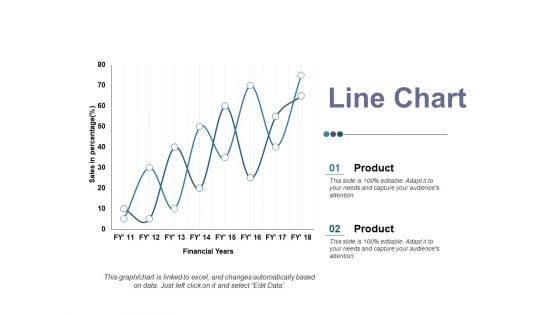
Line Chart Ppt PowerPoint Presentation Ideas Elements
This is a line chart ppt powerpoint presentation ideas elements. This is a two stage process. The stages in this process are product, sales in percentage, financial year, business, line chart.
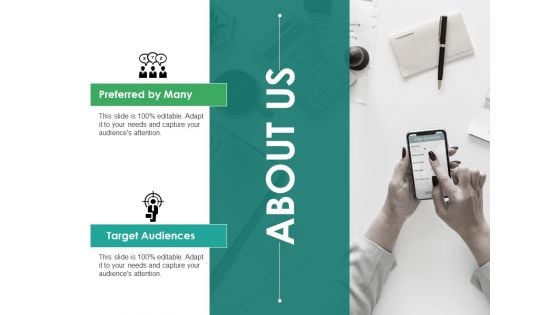
About Us Ppt PowerPoint Presentation Portfolio Inspiration
This is a about us ppt powerpoint presentation portfolio inspiration. This is a two stage process. The stages in this process are preferred by many, target audiences, about us, business, management, marketing.
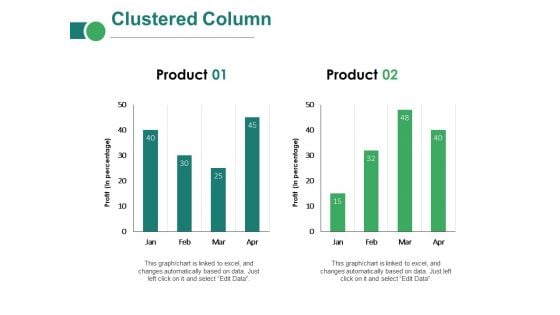
Clustered Column Ppt PowerPoint Presentation Inspiration Introduction
This is a clustered column ppt powerpoint presentation inspiration introduction. This is a two stage process. The stages in this process are business, marketing, in percentage, finance, graph, strategy.
Area Chart Ppt PowerPoint Presentation Icon Aids
This is a area chart ppt powerpoint presentation icon aids. This is a three stage process. The stages in this process are financial years, sales in percentage, business, marketing, graph.
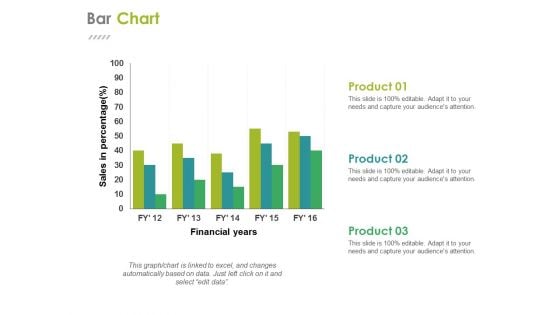
Bar Chart Ppt PowerPoint Presentation Summary Themes
This is a bar chart ppt powerpoint presentation summary themes. This is a three stage process. The stages in this process are financial years, sales in percentage, business, marketing, graph.
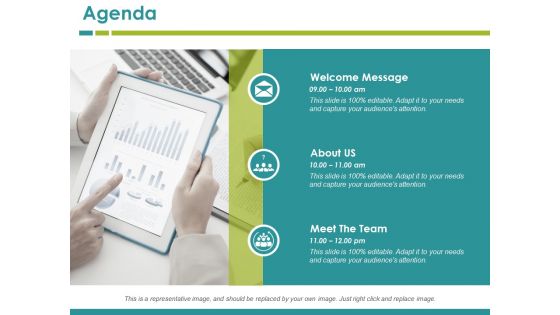
Agenda Ppt PowerPoint Presentation Outline Sample
This is a agenda ppt powerpoint presentation outline sample. This is a three stage process. The stages in this process are business, welcome message, about us, meet the team, agenda.
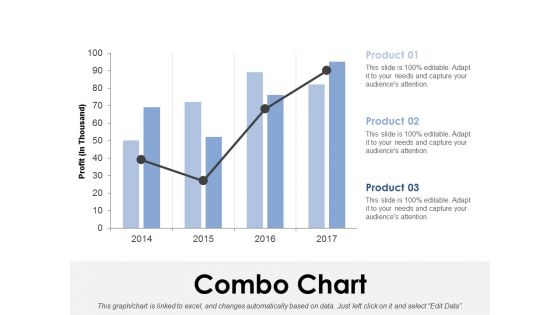
Combo Chart Ppt PowerPoint Presentation Infographics Sample
This is a combo chart ppt powerpoint presentation infographics sample. This is a three stage process. The stages in this process are combo chart, finance, analysis, marketing, strategy, business.
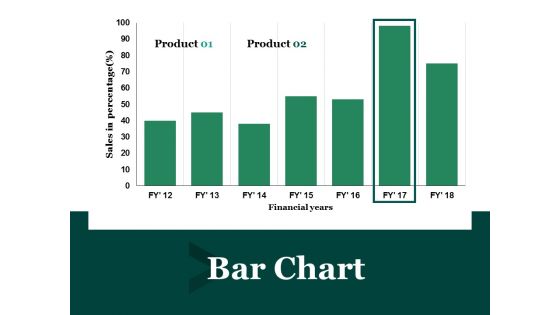
Bar Chart Ppt PowerPoint Presentation Layouts Template
This is a bar chart ppt powerpoint presentation layouts template. This is a two stage process. The stages in this process are financial year, sales in percentage, business, marketing, finance.
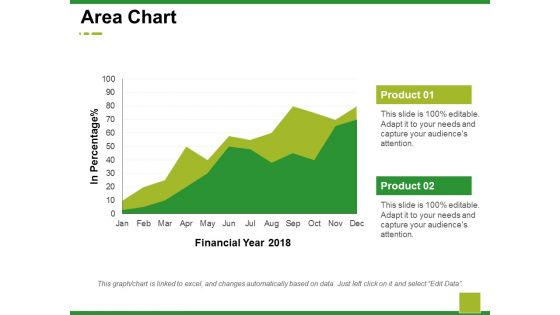
Area Chart Ppt PowerPoint Presentation Model Demonstration
This is a area chart ppt powerpoint presentation model demonstration. This is a two stage process. The stages in this process are business, marketing, financial year, in percentage, graph.
Bar Graph Ppt PowerPoint Presentation Infographics Icon
This is a bar graph ppt powerpoint presentation infographics icon. This is a two stage process. The stages in this process are business, marketing, financial year, in percentage, graph.

Our Target Ppt PowerPoint Presentation Infographics Portrait
This is a our target ppt powerpoint presentation infographics portrait. This is a three stage process. The stages in this process are our target, business, marketing, our goal, planning.
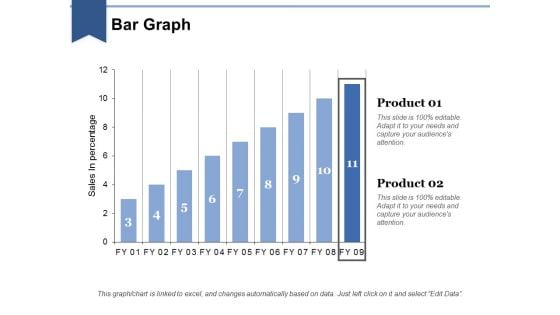
Bar Graph Ppt PowerPoint Presentation Layouts Influencers
This is a bar graph ppt powerpoint presentation layouts influencers. This is a two stage process. The stages in this process are business, marketing, in bar graph, sales in percentage, finance.

About Us Ppt PowerPoint Presentation Show Format
This is a about us ppt powerpoint presentation show format. This is a three stage process. The stages in this process are about us, we are professional, we are talented, we are successful, business.
Clustered Bar Ppt PowerPoint Presentation Icon Professional
This is a clustered bar ppt powerpoint presentation icon professional. This is a two stage process. The stages in this process are business, marketing, profit, clustered bar, finance, strategy.
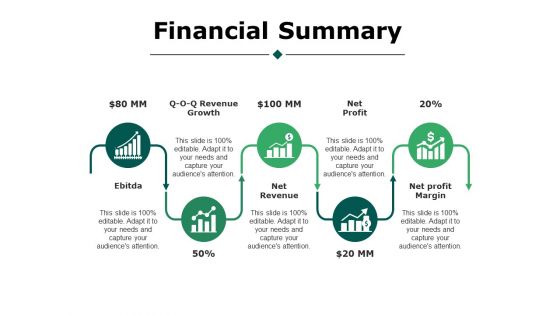
Financial Summary Ppt PowerPoint Presentation Styles Portfolio
This is a financial summary ppt powerpoint presentation styles portfolio. This is a five stage process. The stages in this process are business, ebitda, revenue growth, net revenue, net profit, net profit margin.
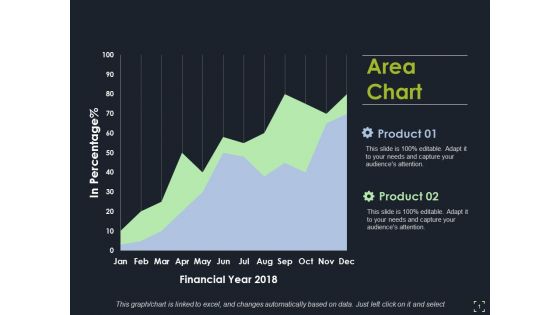
Area Chart Ppt PowerPoint Presentation Infographics Images
This is a area chart ppt powerpoint presentation infographics images. This is a two stage process. The stages in this process are area chart, finance, marketing, analysis, strategy, business.

About Us Ppt PowerPoint Presentation Ideas Topics
This is a about us ppt powerpoint presentation ideas topics. This is a three stage process. The stages in this process are we are professional, we are creative, we are talented, about us, business.
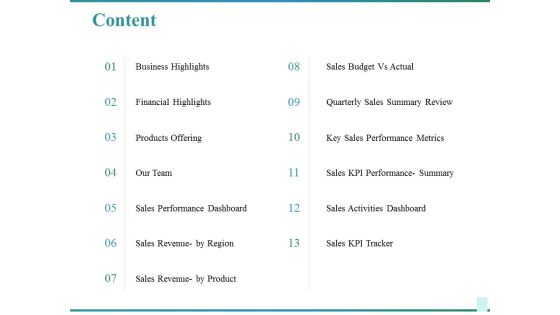
Content Ppt PowerPoint Presentation Infographics Diagrams
This is a content ppt powerpoint presentation infographics diagrams. This is a thirteen stage process. The stages in this process are business highlights, financial highlights, products offering, sales performance dashboard, sales revenue by region.

Our Mission Ppt PowerPoint Presentation Pictures Objects
This is a our mission ppt powerpoint presentation pictures objects. This is a one stage process. The stages in this process are business, our mission, our vision, management, planning.
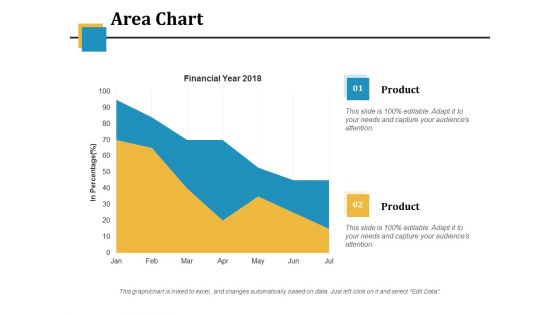
Area Chart Ppt PowerPoint Presentation Model Inspiration
This is a area chart ppt powerpoint presentation model inspiration. This is a two stage process. The stages in this process are financial year, in percentage, area chart, business, marketing.
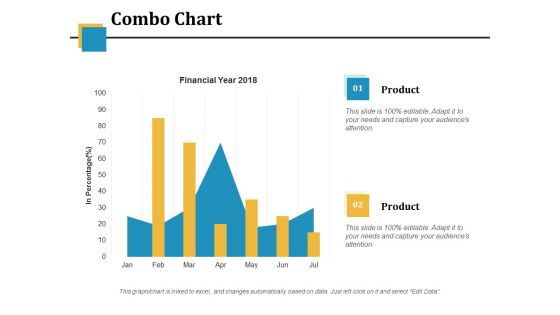
Combo Chart Ppt PowerPoint Presentation Model Vector
This is a combo chart ppt powerpoint presentation model vector. This is a two stage process. The stages in this process are financial year, in percentage, business, marketing, combo chart.
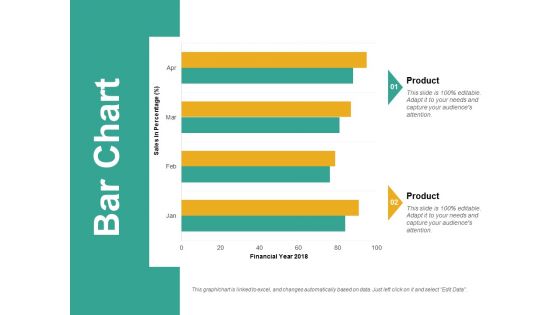
Bar Chart Ppt PowerPoint Presentation Slides Model
This is a bar chart ppt powerpoint presentation slides model. This is a two stage process. The stages in this process are bar chart, analysis, business, marketing, strategy, finance.
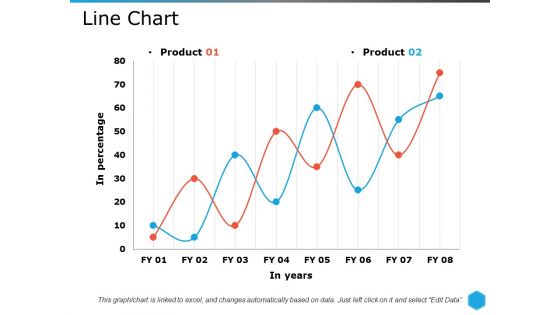
Line Chart Ppt PowerPoint Presentation Pictures Themes
This is a line chart ppt powerpoint presentation pictures themes. This is a two stage process. The stages in this process are line chart, growth, strategy, marketing, strategy, business.
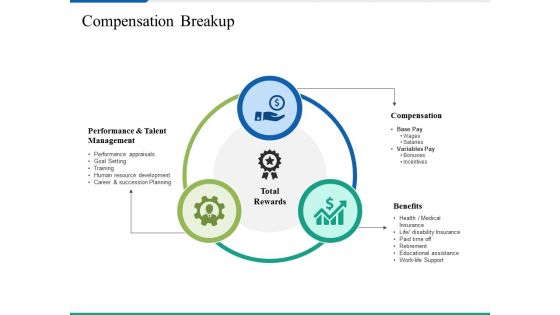
Compensation Breakup Ppt PowerPoint Presentation Pictures Aids
This is a compensation breakup ppt powerpoint presentation pictures aids. This is a three stage process. The stages in this process are business, marketing, performance and talent management, compensation, benefits, total rewards.
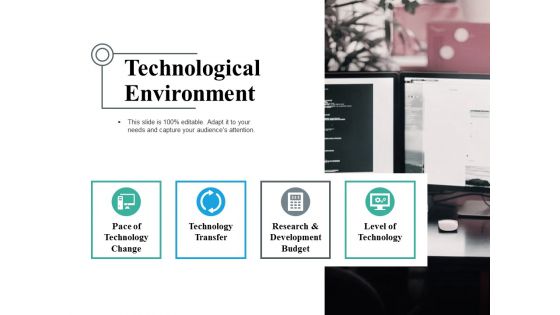
Technological Environment Ppt PowerPoint Presentation Portfolio Show
This is a technological environment ppt powerpoint presentation portfolio show. This is a four stage process. The stages in this process are business, pace of technology change, technology transfer, research and development budget, level of technology.
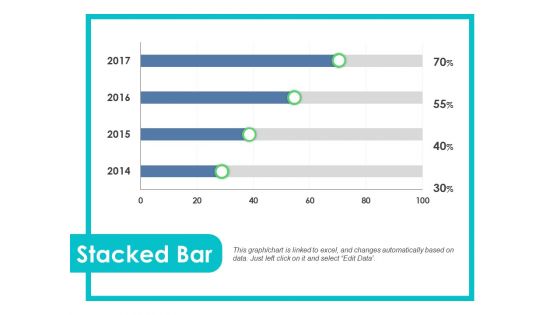
Stacked Bar Ppt PowerPoint Presentation Infographics Elements
This is a stacked bar ppt powerpoint presentation infographics elements. This is a four stages process. The stages in this process are stacked bar, finance, planning, management, strategy, business.
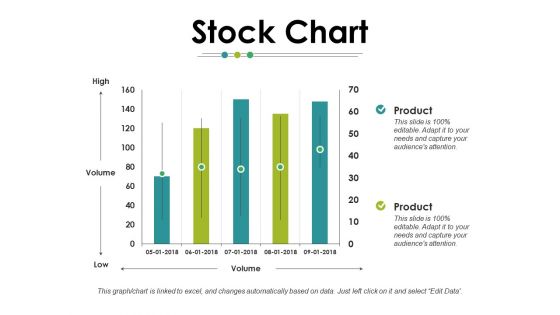
Stock Chart Ppt PowerPoint Presentation Infographics Smartart
This is a stock chart ppt powerpoint presentation infographics smartart. This is a two stages process. The stages in this process are stock chart, finance, business, planning, marketing, management.
Scatter Chart Ppt PowerPoint Presentation Icon Smartart
This is a scatter chart ppt powerpoint presentation icon smartart. This is a one stage process. The stages in this process are scatter chart, finance, business, planning, marketing, management.
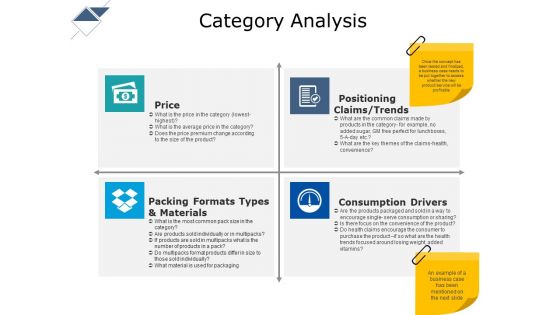
Category Analysis Ppt PowerPoint Presentation Inspiration Templates
This is a category analysis ppt powerpoint presentation inspiration templates. This is a four stage process. The stages in this process are price, positioning claims, consumption drivers, business, management.
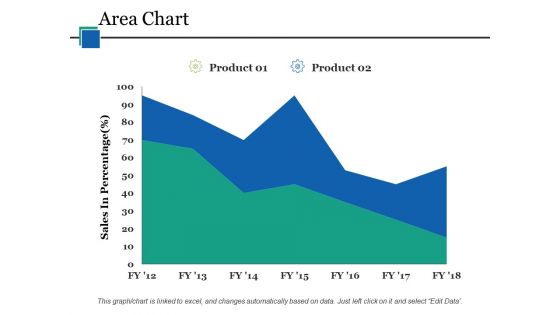
Area Chart Ppt PowerPoint Presentation Infographics Guide
This is a area chart ppt powerpoint presentation infographics guide. This is a two stage process. The stages in this process are area chart, product, sales in percentage, finance, business.
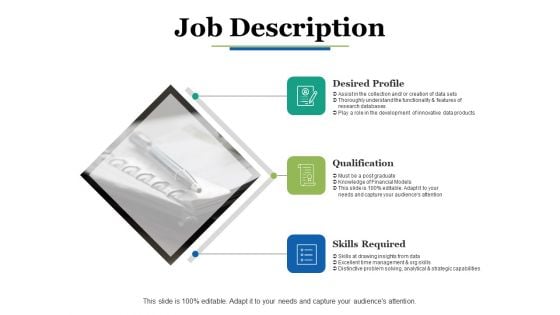
Job Description Ppt PowerPoint Presentation Portfolio Grid
This is a job description ppt powerpoint presentation portfolio grid. This is a three stage process. The stages in this process are job description, desired profile, qualification, skills required, business.
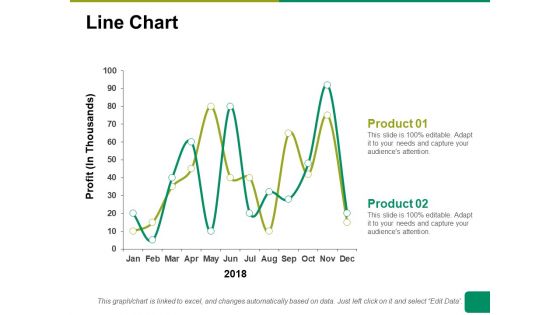
Line Chart Ppt PowerPoint Presentation Summary Ideas
This is a line chart ppt powerpoint presentation summary ideas. This is a two stage process. The stages in this process are line chart, profit, product, financial years, business.
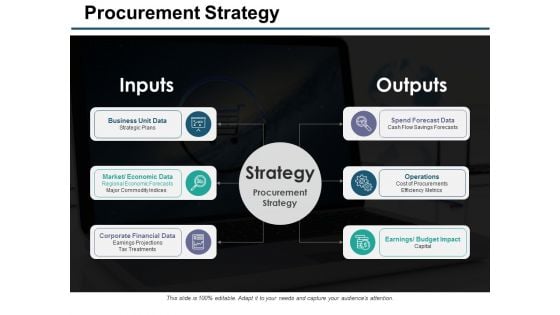
Procurement Strategy Ppt PowerPoint Presentation Ideas Guidelines
This is a procurement strategy ppt powerpoint presentation ideas guidelines. This is a six stage process. The stages in this process are business unit data, corporate financial data, operations, spend forecast data, earnings budget impact.
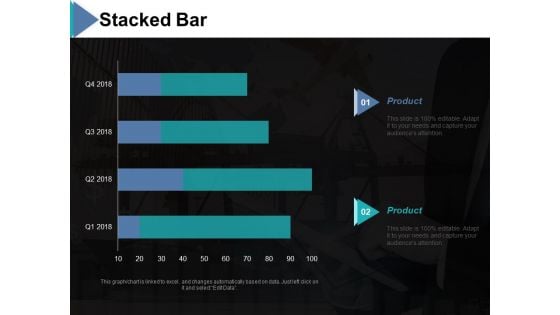
Stacked Bar Ppt PowerPoint Presentation Model Graphics
This is a stacked bar ppt powerpoint presentation model graphics. This is a two stage process. The stages in this process are stacked bar, product, chart and graph, finance, business.
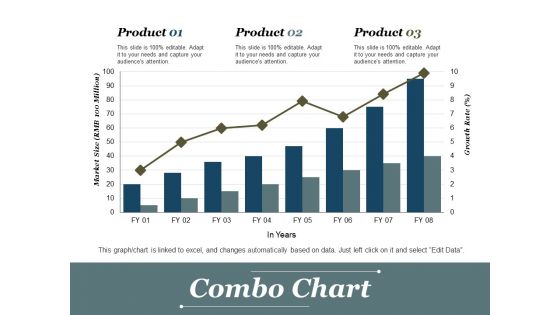
Combo Chart Ppt PowerPoint Presentation Slides Outline
This is a combo chart ppt powerpoint presentation slides outline. This is a three stage process. The stages in this process are combo chart, growth, product, financial year, business.
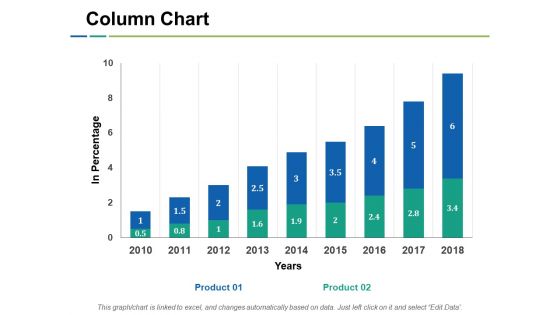
Column Chart Ppt PowerPoint Presentation Background Images
This is a column chart ppt powerpoint presentation background images. This is a two stage process. The stages in this process are column chart, financial, business, marketing, planning, strategy.
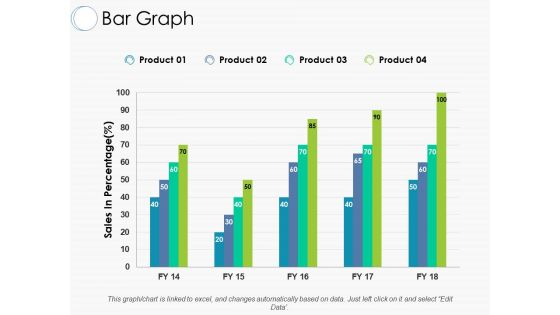
Bar Graph Ppt PowerPoint Presentation Summary Brochure
This is a bar graph ppt powerpoint presentation summary brochure. This is a four stage process. The stages in this process are business, market strategy, management, bar graph, product
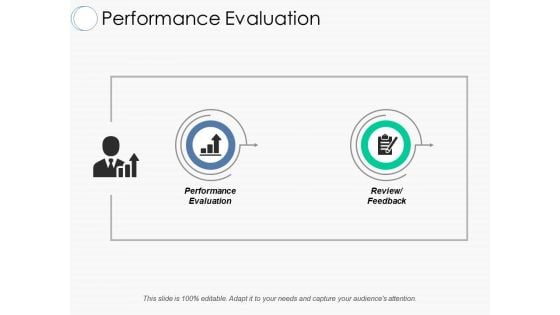
Performance Evaluation Ppt PowerPoint Presentation File Picture
This is a performance evaluation ppt powerpoint presentation file picture. This is a two stage process. The stages in this process are performance evaluation, review feedback, business planning, management, market strategy.
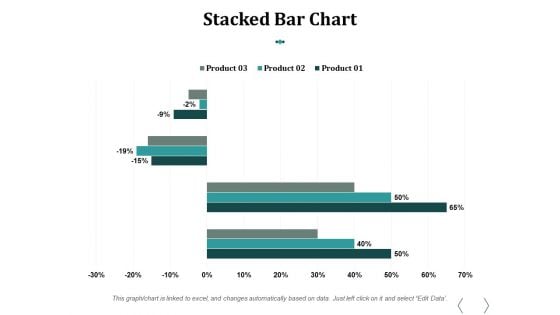
Stacked Bar Chart Ppt PowerPoint Presentation Influencers
This is a stacked bar chart ppt powerpoint presentation influencers. This is a three stage process. The stages in this process are stacked bar chart, product, percentage, finance, business.
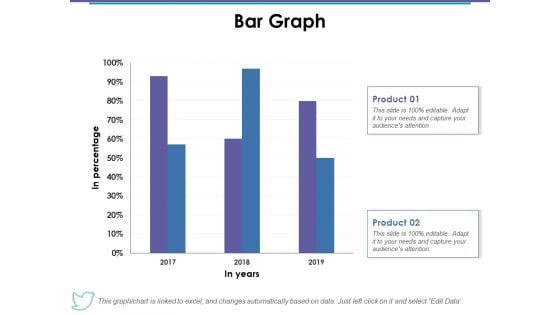
Bar Graph Ppt PowerPoint Presentation Styles Skills
This is a bar graph ppt powerpoint presentation styles skills. This is a two stage process. The stages in this process are bar graph, product, in year, in percentage, business.


 Continue with Email

 Home
Home


