Comparison Bar Graph
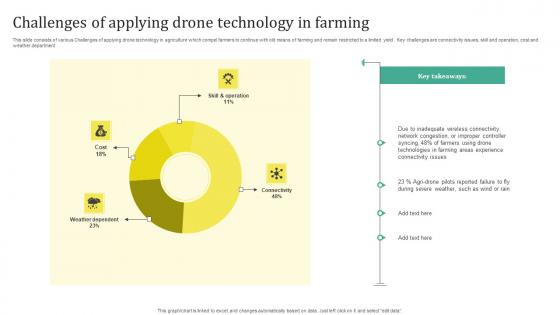
Challenges Of Applying Drone Technology In Farming Portrait Pdf
This slide consists of various Challenges of applying drone technology in agriculture which compel farmers to continue with old means of farming and remain restricted to a limited yield . Key challenges are connectivity issues, skill and operation, cost and weather department. Pitch your topic with ease and precision using this Challenges Of Applying Drone Technology In Farming Portrait Pdf. This layout presents information on Cost, Weather Dependent, Connectivity. It is also available for immediate download and adjustment. So, changes can be made in the color, design, graphics or any other component to create a unique layout. This slide consists of various Challenges of applying drone technology in agriculture which compel farmers to continue with old means of farming and remain restricted to a limited yield . Key challenges are connectivity issues, skill and operation, cost and weather department.
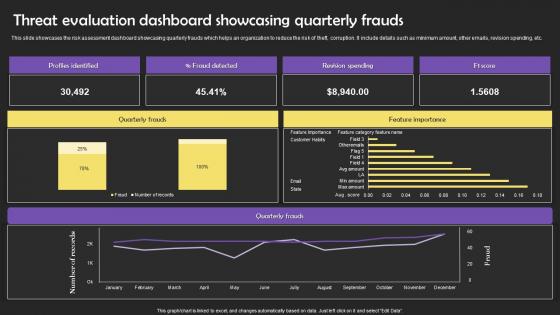
Threat Evaluation Dashboard Showcasing Quarterly Frauds Slides Pdf
This slide showcases the risk assessment dashboard showcasing quarterly frauds which helps an organization to reduce the risk of theft, corruption. It include details such as minimum amount, other emails, revision spending, etc. Pitch your topic with ease and precision using this Threat Evaluation Dashboard Showcasing Quarterly Frauds Slides Pdf This layout presents information on Threat Evaluation Dashboard Showcasing Quarterly Frauds Slides Pdf It is also available for immediate download and adjustment. So, changes can be made in the color, design, graphics or any other component to create a unique layout. This slide showcases the risk assessment dashboard showcasing quarterly frauds which helps an organization to reduce the risk of theft, corruption. It include details such as minimum amount, other emails, revision spending, etc.

Revenue Projections Analysis For Progress Report Information Pdf
This slide depicts progress report of sales analysis which helps manager to generate achievable sales goals and maximize utilization of resources. It include elements such as starting, monthly forecast and cumulative. Pitch your topic with ease and precision using this Revenue Projections Analysis For Progress Report Information Pdf This layout presents information on Cumulative, Forecast Analysis, Progress Report It is also available for immediate download and adjustment. So, changes can be made in the color, design, graphics or any other component to create a unique layout. This slide depicts progress report of sales analysis which helps manager to generate achievable sales goals and maximize utilization of resources. It include elements such as starting, monthly forecast and cumulative.
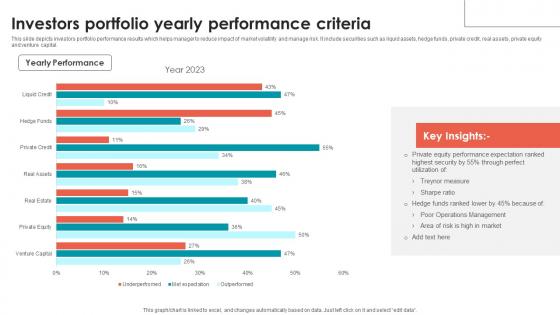
Investors Portfolio Yearly Performance Criteria Designs Pdf
This slide depicts investors portfolio performance results which helps manager to reduce impact of market volatility and manage risk. It include securities such as liquid assets, hedge funds, private credit, real assets, private equity and venture capital. Pitch your topic with ease and precision using this Investors Portfolio Yearly Performance Criteria Designs Pdf. This layout presents information on Key Insights, Highest Security, Equity Performance. It is also available for immediate download and adjustment. So, changes can be made in the color, design, graphics or any other component to create a unique layout. This slide depicts investors portfolio performance results which helps manager to reduce impact of market volatility and manage risk. It include securities such as liquid assets, hedge funds, private credit, real assets, private equity and venture capital.
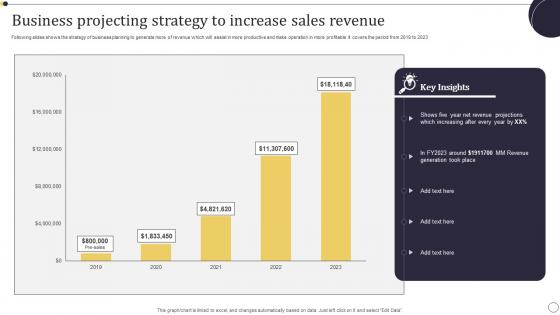
Business Projecting Strategy To Increase Sales Revenue Background Pdf
Following slides shows the strategy of business planning to generate more of revenue which will assist in more productive and make operation in more profitable .It covers the period from 2019 to 2023 Pitch your topic with ease and precision using this Business Projecting Strategy To Increase Sales Revenue Background Pdf. This layout presents information on Key Insights, Revenue Projections, Business Projecting Strategy. It is also available for immediate download and adjustment. So, changes can be made in the color, design, graphics or any other component to create a unique layout. Following slides shows the strategy of business planning to generate more of revenue which will assist in more productive and make operation in more profitable .It covers the period from 2019 to 2023
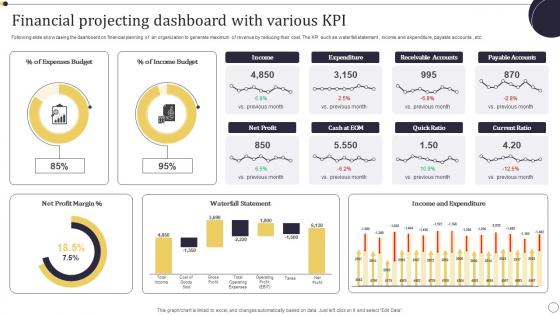
Financial Projecting Dashboard With Various KPI Themes Pdf
Following slide showcasing the dashboard on financial planning of an organization to generate maximum of revenue by reducing their cost. The KPI such as waterfall statement , income and expenditure, payable accounts , etc . Pitch your topic with ease and precision using this Financial Projecting Dashboard With Various KPI Themes Pdf. This layout presents information on Income Budget, Expenses Budget, Net Profit Margin. It is also available for immediate download and adjustment. So, changes can be made in the color, design, graphics or any other component to create a unique layout. Following slide showcasing the dashboard on financial planning of an organization to generate maximum of revenue by reducing their cost. The KPI such as waterfall statement , income and expenditure, payable accounts , etc .
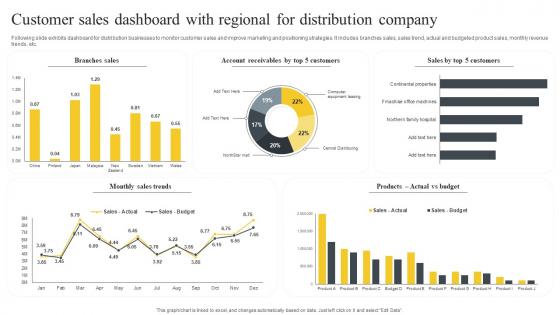
Customer Sales Dashboard With Regional For Distribution Company Brochure Pdf
Following slide exhibits dashboard for distribution businesses to monitor customer sales and improve marketing and positioning strategies. It includes branches sales, sales trend, actual and budgeted product sales, monthly revenue trends, etc. Pitch your topic with ease and precision using this Customer Sales Dashboard With Regional For Distribution Company Brochure Pdf. This layout presents information on Branches Sales, Monthly Sales Trends, Customers. It is also available for immediate download and adjustment. So, changes can be made in the color, design, graphics or any other component to create a unique layout. Following slide exhibits dashboard for distribution businesses to monitor customer sales and improve marketing and positioning strategies. It includes branches sales, sales trend, actual and budgeted product sales, monthly revenue trends, etc.
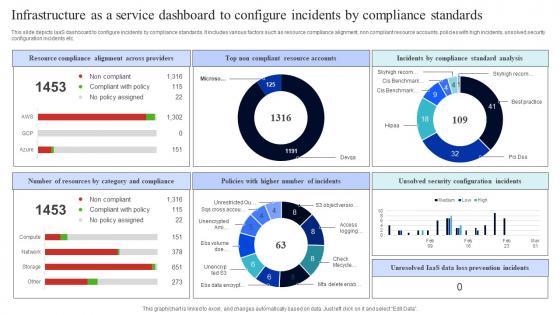
Infrastructure As A Service Dashboard To Configure Incidents By Compliance Standards Rules Pdf
This slide depicts IaaS dashboard to configure incidents by compliance standards. It includes various factors such as resource compliance alignment, non compliant resource accounts, policies with high incidents, unsolved security configuration incidents etc. Pitch your topic with ease and precision using this Infrastructure As A Service Dashboard To Configure Incidents By Compliance Standards Rules Pdf. This layout presents information on Resource Compliance Alignment, Across Providers, Top Non Compliant, Resource Accounts. It is also available for immediate download and adjustment. So, changes can be made in the color, design, graphics or any other component to create a unique layout. This slide depicts IaaS dashboard to configure incidents by compliance standards. It includes various factors such as resource compliance alignment, non compliant resource accounts, policies with high incidents, unsolved security configuration incidents etc.

Internet Banking B2B Client Journey Clipart Pdf
The following slide displays b2b customer journey and emotional experience while signing up for internet banking services. It further includes information about phase of journey, goal, touchpoints, etc. Pitch your topic with ease and precision using this Internet Banking B2B Client Journey Clipart Pdf. This layout presents information on Customer Decision, Internet Banking, Client Journey, Internet Banking Research. It is also available for immediate download and adjustment. So, changes can be made in the color, design, graphics or any other component to create a unique layout. The following slide displays b2b customer journey and emotional experience while signing up for internet banking services. It further includes information about phase of journey, goal, touchpoints, etc.
Dashboard For DEI Maturity Framework Icons Pdf
This slide illustrates facts and figures related to D and I that can help a business organization to track D and I maturity levels. It includes number of qualified leads, percent of supplier satisfaction value, etc. Pitch your topic with ease and precision using this Dashboard For DEI Maturity Framework Icons Pdf. This layout presents information on Dashboard For DEI, Maturity Framework, Supplier Satisfaction Value. It is also available for immediate download and adjustment. So, changes can be made in the color, design, graphics or any other component to create a unique layout. This slide illustrates facts and figures related to D and I that can help a business organization to track D and I maturity levels. It includes number of qualified leads, percent of supplier satisfaction value, etc.
Statistics For Tracking Policy Administration Activities Brochure Pdf
Following slide showcases statistics highlighting policy management activities by priority percentage which can be used by businesses to enhance organisation performance. It includes activities such as policy communication, compliance training, risk assessment, third party due diligence, etc. Pitch your topic with ease and precision using this Statistics For Tracking Policy Administration Activities Brochure Pdf. This layout presents information on Policy Communication, Compliance Training, Risk Assessment. It is also available for immediate download and adjustment. So, changes can be made in the color, design, graphics or any other component to create a unique layout. Following slide showcases statistics highlighting policy management activities by priority percentage which can be used by businesses to enhance organisation performance. It includes activities such as policy communication, compliance training, risk assessment, third party due diligence, etc.
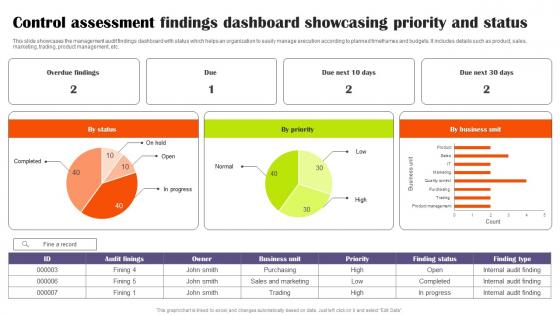
Control Assessment Findings Dashboard Showcasing Priority And Status Sample Pdf
This slide showcases the management audit findings dashboard with status which helps an organization to easily manage execution according to planned timeframes and budgets. It includes details such as product, sales, marketing, trading, product management, etc. Pitch your topic with ease and precision using this Control Assessment Findings Dashboard Showcasing Priority And Status Sample Pdf This layout presents information on Control Assessment, Findings Dashboard, Showcasing Priority It is also available for immediate download and adjustment. So, changes can be made in the color, design, graphics or any other component to create a unique layout. This slide showcases the management audit findings dashboard with status which helps an organization to easily manage execution according to planned timeframes and budgets. It includes details such as product, sales, marketing, trading, product management, etc.
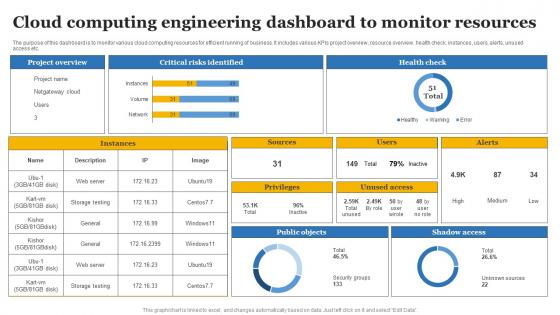
Cloud Computing Engineering Dashboard To Monitor Resources Rules Pdf
The purpose of this dashboard is to monitor various cloud computing resources for efficient running of business. It includes various KPIs project overview, resource overview, health check, instances, users, alerts, unused access etc. Pitch your topic with ease and precision using this Cloud Computing Engineering Dashboard To Monitor Resources Rules Pdf This layout presents information on Project Overview, Critical Risks Identified, Health Check It is also available for immediate download and adjustment. So, changes can be made in the color, design, graphics or any other component to create a unique layout. The purpose of this dashboard is to monitor various cloud computing resources for efficient running of business. It includes various KPIs project overview, resource overview, health check, instances, users, alerts, unused access etc.
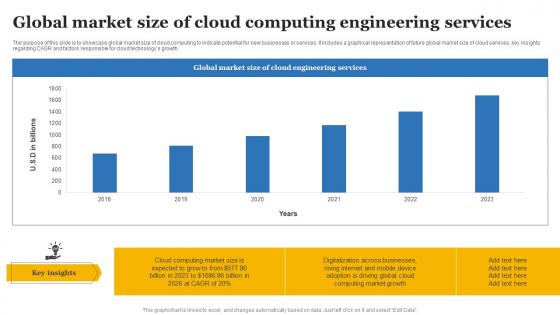
Global Market Size Of Cloud Computing Engineering Services Slides Pdf
The purpose of this slide is to showcase global market size of cloud computing to indicate potential for new businesses or services. It includes a graphical representation of future global market size of cloud services, key insights regarding CAGR and factors responsible for cloud technologys growth. Pitch your topic with ease and precision using this Global Market Size Of Cloud Computing Engineering Services Slides Pdf This layout presents information on Global Market Size, Cloud Computing, Engineering Services It is also available for immediate download and adjustment. So, changes can be made in the color, design, graphics or any other component to create a unique layout. The purpose of this slide is to showcase global market size of cloud computing to indicate potential for new businesses or services. It includes a graphical representation of future global market size of cloud services, key insights regarding CAGR and factors responsible for cloud technologys growth.
Global Robotic Process Automation In Life Science Industry Icons Pdf
This slide provides information about the robotic process automation implementation market size of the life science industry in different years. It includes yearly earnings and changing growth rate. Pitch your topic with ease and precision using this Global Robotic Process Automation In Life Science Industry Icons Pdf. This layout presents information on Global Robotic Process Automation In Life Science Industry. It is also available for immediate download and adjustment. So, changes can be made in the color, design, graphics or any other component to create a unique layout. This slide provides information about the robotic process automation implementation market size of the life science industry in different years. It includes yearly earnings and changing growth rate.
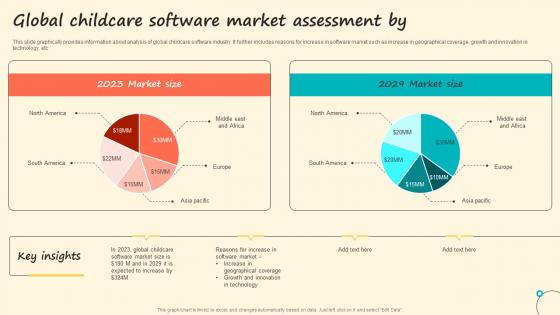
Global Childcare Software Market Assessment By Background Pdf
This slide graphically provides information about analysis of global childcare software industry. It further includes reasons for increase in software market such as increase in geographical coverage, growth and innovation in technology, etc Pitch your topic with ease and precision using this Global Childcare Software Market Assessment By Background Pdf This layout presents information on Global Childcare Software, Market Assessment It is also available for immediate download and adjustment. So, changes can be made in the color, design, graphics or any other component to create a unique layout. This slide graphically provides information about analysis of global childcare software industry. It further includes reasons for increase in software market such as increase in geographical coverage, growth and innovation in technology, etc
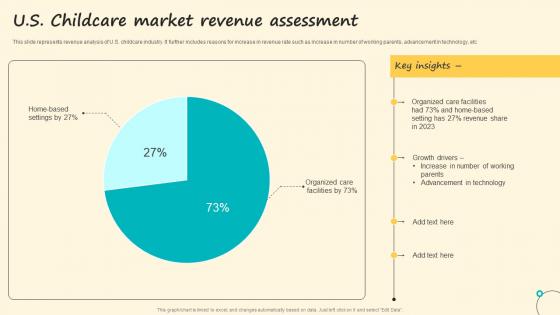
U S Childcare Market Revenue Assessment Microsoft Pdf
This slide represents revenue analysis of U.S. childcare industry. It further includes reasons for increase in revenue rate such as increase in number of working parents, advancement in technology, etc Pitch your topic with ease and precision using this U S Childcare Market Revenue Assessment Microsoft Pdf This layout presents information on U S Childcare, Market Revenue Assessment It is also available for immediate download and adjustment. So, changes can be made in the color, design, graphics or any other component to create a unique layout. This slide represents revenue analysis of U.S. childcare industry. It further includes reasons for increase in revenue rate such as increase in number of working parents, advancement in technology, etc

Evaluation Of Offline Business Event Campaign Return On Investment Diagrams Pdf
The slide displays companys offline event campaigns results over the course of a year to evaluate actual cost of an event campaign and earnings generated by them so that ROI and percentage can be calculated. Pitch your topic with ease and precision using this Evaluation Of Offline Business Event Campaign Return On Investment Diagrams Pdf This layout presents information on Evaluation Of Offline, Business Event, Return On Investment It is also available for immediate download and adjustment. So, changes can be made in the color, design, graphics or any other component to create a unique layout. The slide displays companys offline event campaigns results over the course of a year to evaluate actual cost of an event campaign and earnings generated by them so that ROI and percentage can be calculated.
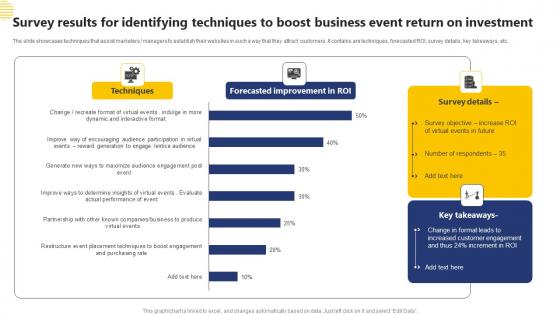
Survey Results For Identifying Techniques To Boost Business Event Return On Investment Introduction Pdf
The slide showcases techniques that assist marketers managers to establish their websites in such a way that they attract customers .It contains are techniques, forecasted ROI, survey details, key takeaways, etc. Pitch your topic with ease and precision using this Survey Results For Identifying Techniques To Boost Business Event Return On Investment Introduction Pdf This layout presents information on Survey Results, Identifying Techniques, Business Event It is also available for immediate download and adjustment. So, changes can be made in the color, design, graphics or any other component to create a unique layout. The slide showcases techniques that assist marketers managers to establish their websites in such a way that they attract customers .It contains are techniques, forecasted ROI, survey details, key takeaways, etc.
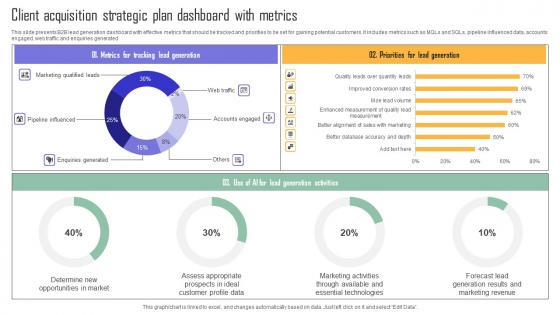
Client Acquisition Strategic Plan Dashboard With Metrics Clipart Pdf
This slide presents B2B lead generation dashboard with effective metrics that should be tracked and priorities to be set for gaining potential customers. It includes metrics such as MQLs and SQLs, pipeline influenced data, accounts engaged, web traffic and enquiries generated. Pitch your topic with ease and precision using this Client Acquisition Strategic Plan Dashboard With Metrics Clipart Pdf. This layout presents information on Priorities For Lead Generation, Tracking Lead Generation. It is also available for immediate download and adjustment. So, changes can be made in the color, design, graphics or any other component to create a unique layout. This slide presents B2B lead generation dashboard with effective metrics that should be tracked and priorities to be set for gaining potential customers. It includes metrics such as MQLs and SQLs, pipeline influenced data, accounts engaged, web traffic and enquiries generated.
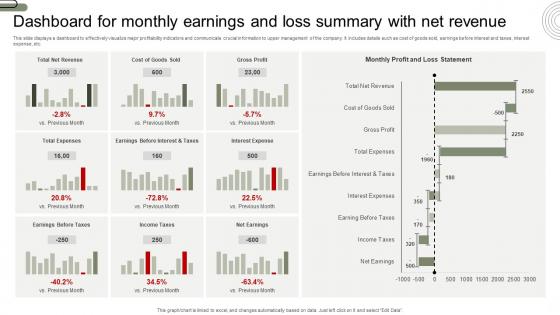
Dashboard For Monthly Earnings And Loss Summary With Net Revenue Background Pdf
This slide displays a dashboard to effectively visualize major profitability indicators and communicate crucial information to upper management of the company. It includes details such as cost of goods sold, earnings before interest and taxes, interest expense, etc. Pitch your topic with ease and precision using this Dashboard For Monthly Earnings And Loss Summary With Net Revenue Background Pdf. This layout presents information on Dashboard For Monthly Earnings, Loss Summary, Net Revenue. It is also available for immediate download and adjustment. So, changes can be made in the color, design, graphics or any other component to create a unique layout. This slide displays a dashboard to effectively visualize major profitability indicators and communicate crucial information to upper management of the company. It includes details such as cost of goods sold, earnings before interest and taxes, interest expense, etc.
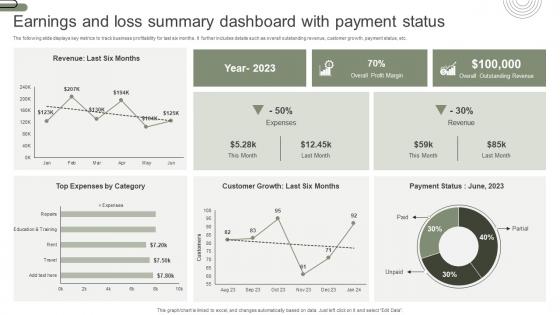
Earnings And Loss Summary Dashboard With Payment Status Elements Pdf
The following slide displays key metrics to track business profitability for last six months. It further includes details such as overall outstanding revenue, customer growth, payment status, etc. Pitch your topic with ease and precision using this Earnings And Loss Summary Dashboard With Payment Status Elements Pdf. This layout presents information on Earnings And Loss, Summary Dashboard, Payment Status. It is also available for immediate download and adjustment. So, changes can be made in the color, design, graphics or any other component to create a unique layout. The following slide displays key metrics to track business profitability for last six months. It further includes details such as overall outstanding revenue, customer growth, payment status, etc.
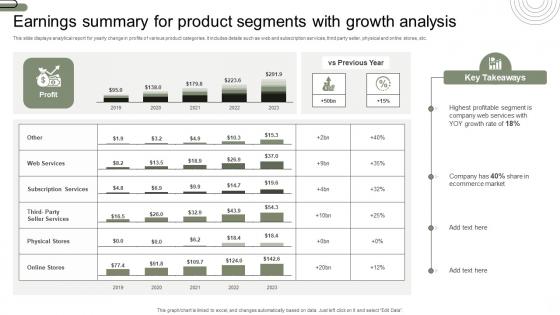
Earnings Summary For Product Segments With Growth Analysis Infographics Pdf
This slide displays analytical report for yearly change in profits of various product categories. It includes details such as web and subscription services, third party seller, physical and online stores, etc. Pitch your topic with ease and precision using this Earnings Summary For Product Segments With Growth Analysis Infographics Pdf. This layout presents information on Earnings Summary, Product Segments, Growth Analysis. It is also available for immediate download and adjustment. So, changes can be made in the color, design, graphics or any other component to create a unique layout. This slide displays analytical report for yearly change in profits of various product categories. It includes details such as web and subscription services, third party seller, physical and online stores, etc.
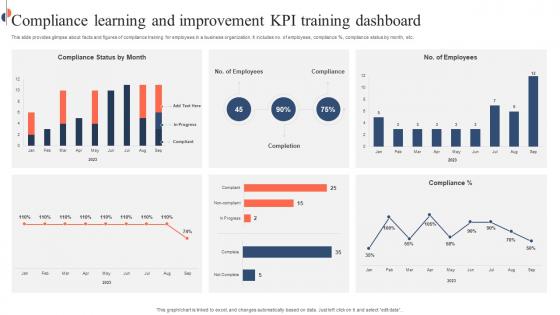
Compliance Learning And Improvement KPI Training Dashboard Sample Pdf
This slide provides glimpse about facts and figures of compliance training for employees in a business organization. It includes no. of employees, compliance percent, compliance status by month, etc. Pitch your topic with ease and precision using this Compliance Learning And Improvement KPI Training Dashboard Sample Pdf. This layout presents information on Compliance Learning, Improvement KPI, Training Dashboard, Compliance Training. It is also available for immediate download and adjustment. So, changes can be made in the color, design, graphics or any other component to create a unique layout. This slide provides glimpse about facts and figures of compliance training for employees in a business organization. It includes no. of employees, compliance percent, compliance status by month, etc.
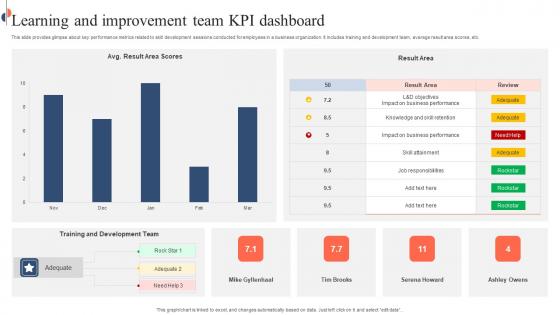
Learning And Improvement Team KPI Dashboard Slides Pdf
This slide provides glimpse about key performance metrics related to skill development sessions conducted for employees in a business organization. It includes training and development team, average result area scores, etc. Pitch your topic with ease and precision using this Learning And Improvement Team KPI Dashboard Slides Pdf. This layout presents information on Learning And Improvement Team, KPI Dashboard, Development Team. It is also available for immediate download and adjustment. So, changes can be made in the color, design, graphics or any other component to create a unique layout. This slide provides glimpse about key performance metrics related to skill development sessions conducted for employees in a business organization. It includes training and development team, average result area scores, etc.
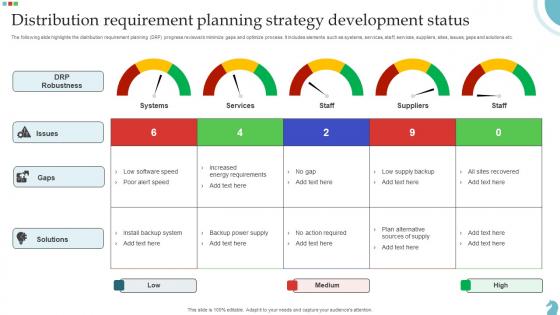
Distribution Requirement Planning Strategy Development Status Slides Pdf
The following slide highlights the distribution requirement planning DRP progress reviews to minimize gaps and optimize process. It includes elements such as systems, services, staff, services, suppliers, sites, issues, gaps and solutions etc. Pitch your topic with ease and precision using this Distribution Requirement Planning Strategy Development Status Slides Pdf. This layout presents information on Distribution Requirement, Planning Strategy, Development Status. It is also available for immediate download and adjustment. So, changes can be made in the color, design, graphics or any other component to create a unique layout. The following slide highlights the distribution requirement planning DRP progress reviews to minimize gaps and optimize process. It includes elements such as systems, services, staff, services, suppliers, sites, issues, gaps and solutions etc.
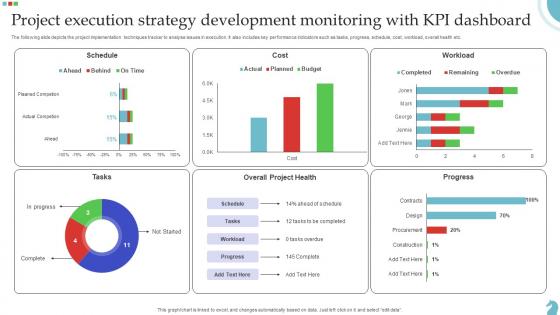
Project Execution Strategy Development Monitoring With Kpi Dashboard Download Pdf
The following slide depicts the project implementation techniques tracker to analyse issues in execution. It also includes key performance indicators such as tasks, progress, schedule, cost, workload, overall health etc. Pitch your topic with ease and precision using this Project Execution Strategy Development Monitoring With Kpi Dashboard Download Pdf. This layout presents information on Project Execution, Strategy Development, Monitoring Kpi Dashboard. It is also available for immediate download and adjustment. So, changes can be made in the color, design, graphics or any other component to create a unique layout. The following slide depicts the project implementation techniques tracker to analyse issues in execution. It also includes key performance indicators such as tasks, progress, schedule, cost, workload, overall health etc.
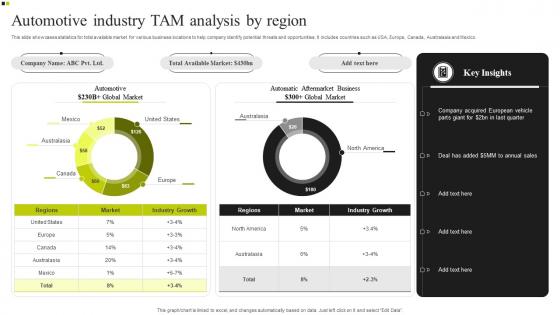
Automotive Industry Tam Analysis By Region Download Pdf
This slide showcases statistics for total available market for various business locations to help company identify potential threats and opportunities. It includes countries such as USA, Europe, Canada, Australasia and Mexico. Pitch your topic with ease and precision using this Automotive Industry Tam Analysis By Region Download Pdf. This layout presents information on Total Available Market, Business Locations, Threats And Opportunities, Automotive Industry. It is also available for immediate download and adjustment. So, changes can be made in the color, design, graphics or any other component to create a unique layout. This slide showcases statistics for total available market for various business locations to help company identify potential threats and opportunities. It includes countries such as USA, Europe, Canada, Australasia and Mexico.
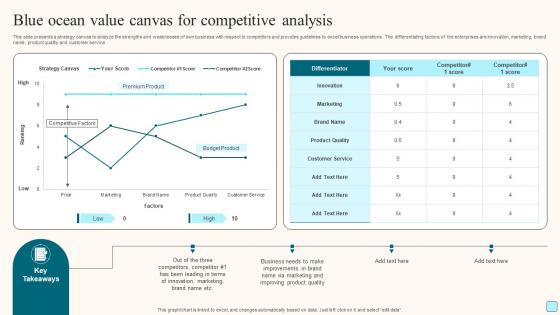
Blue Ocean Value Canvas For Competitive Analysis Mockup Pdf
This slide presents a strategy canvas to analyze the strengths and weaknesses of own business with respect to competitors and provides guidelines to excel business operations. The differentiating factors of the enterprises are innovation, marketing, brand name, product quality and customer service. Pitch your topic with ease and precision using this Blue Ocean Value Canvas For Competitive Analysis Mockup Pdf. This layout presents information on Blue Ocean Value Canvas, Competitive Analysis, Product Quality. It is also available for immediate download and adjustment. So, changes can be made in the color, design, graphics or any other component to create a unique layout. This slide presents a strategy canvas to analyze the strengths and weaknesses of own business with respect to competitors and provides guidelines to excel business operations. The differentiating factors of the enterprises are innovation, marketing, brand name, product quality and customer service.
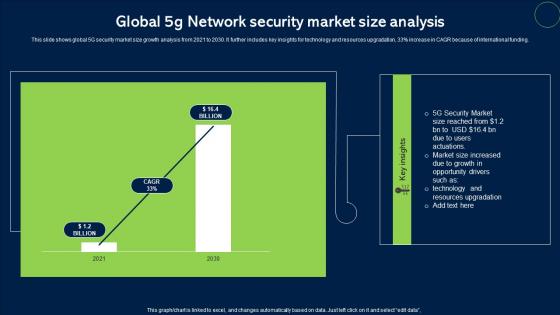
Global 5G Network Security Market Size Analysis Topics Pdf
This slide shows global 5G security market size growth analysis from 2021 to 2030. It further includes key insights for technology and resources upgradation, 33percent increase in CAGR because of international funding. Pitch your topic with ease and precision using this Global 5G Network Security Market Size Analysis Topics Pdf. This layout presents information on Network Security, Market Size. It is also available for immediate download and adjustment. So, changes can be made in the color, design, graphics or any other component to create a unique layout. This slide shows global 5G security market size growth analysis from 2021 to 2030. It further includes key insights for technology and resources upgradation, 33percent increase in CAGR because of international funding.
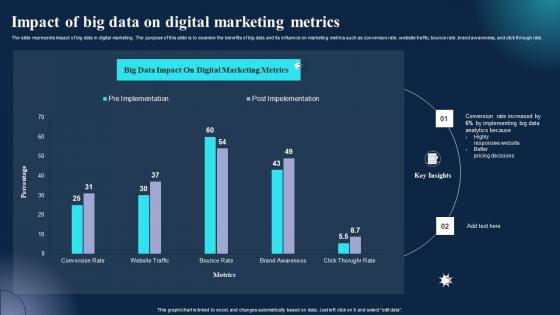
Impact Of Big Data On Digital Marketing Metrics Information Pdf
The slide represents impact of big data in digital marketing. The purpose of this slide is to examine the benefits of big data and its influence on marketing metrics such as conversion rate, website traffic, bounce rate, brand awareness, and click through rate. Pitch your topic with ease and precision using this Impact Of Big Data On Digital Marketing Metrics Information Pdf. This layout presents information on Marketing Metrics, Pricing Decisions, Impact. It is also available for immediate download and adjustment. So, changes can be made in the color, design, graphics or any other component to create a unique layout. The slide represents impact of big data in digital marketing. The purpose of this slide is to examine the benefits of big data and its influence on marketing metrics such as conversion rate, website traffic, bounce rate, brand awareness, and click through rate.
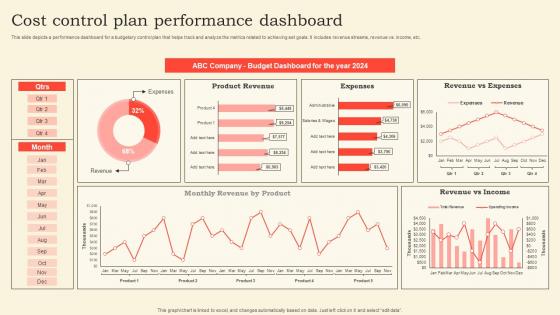
Cost Control Plan Performance Dashboard Pictures Pdf
This slide depicts a performance dashboard for a budgetary control plan that helps track and analyze the metrics related to achieving set goals. It includes revenue streams, revenue vs. income, etc. Pitch your topic with ease and precision using this Cost Control Plan Performance Dashboard Pictures Pdf. This layout presents information on Dashboard, Expenses, Income. It is also available for immediate download and adjustment. So, changes can be made in the color, design, graphics or any other component to create a unique layout. This slide depicts a performance dashboard for a budgetary control plan that helps track and analyze the metrics related to achieving set goals. It includes revenue streams, revenue vs. income, etc.
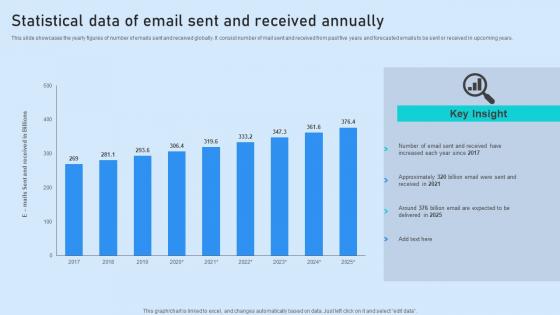
Statistical Data Of Email Sent And Received Annually Pictures Pdf
This slide showcases the yearly figures of number of emails sent and received globally. It consist number of mail sent and received from past five years and forecasted emails to be sent or received in upcoming years. Pitch your topic with ease and precision using this Statistical Data Of Email Sent And Received Annually Pictures Pdf. This layout presents information on Key Insight, Annually, Statistical. It is also available for immediate download and adjustment. So, changes can be made in the color, design, graphics or any other component to create a unique layout. This slide showcases the yearly figures of number of emails sent and received globally. It consist number of mail sent and received from past five years and forecasted emails to be sent or received in upcoming years.
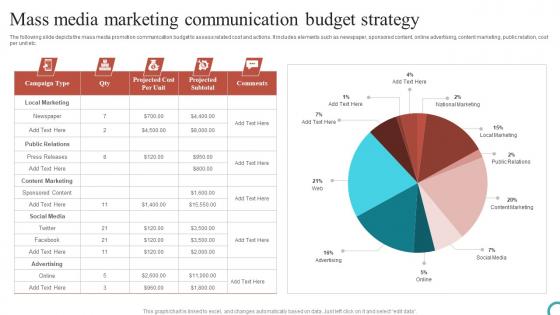
Mass Media Marketing Communication Budget Strategy Microsoft Pdf
The following slide depicts the mass media promotion communication budget to assess related cost and actions. It includes elements such as newspaper, sponsored content, online advertising, content marketing, public relation, cost per unit etc. Pitch your topic with ease and precision using this Mass Media Marketing Communication Budget Strategy Microsoft Pdf. This layout presents information on Budget Strategy, Mass, Marketing. It is also available for immediate download and adjustment. So, changes can be made in the color, design, graphics or any other component to create a unique layout. The following slide depicts the mass media promotion communication budget to assess related cost and actions. It includes elements such as newspaper, sponsored content, online advertising, content marketing, public relation, cost per unit etc.
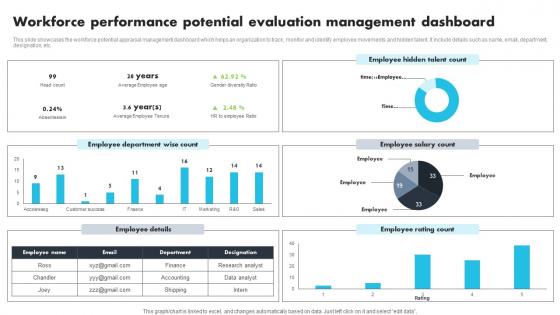
Workforce Performance Potential Evaluation Management Dashboard Clipart Pdf
This slide showcases the workforce potential appraisal management dashboard which helps an organization to track, monitor and identify employee movements and hidden talent. It include details such as name, email, department, designation, etc. Pitch your topic with ease and precision using this Workforce Performance Potential Evaluation Management Dashboard Clipart Pdf. This layout presents information on Employee Department, Employee Salary Count. It is also available for immediate download and adjustment. So, changes can be made in the color, design, graphics or any other component to create a unique layout. This slide showcases the workforce potential appraisal management dashboard which helps an organization to track, monitor and identify employee movements and hidden talent. It include details such as name, email, department, designation, etc.
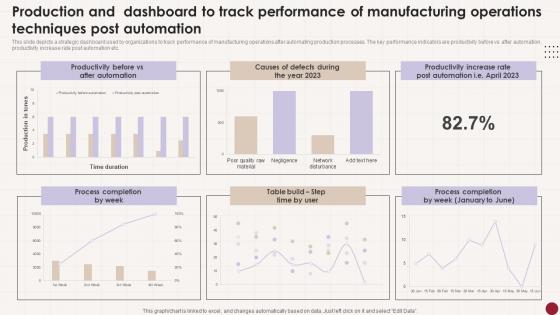
Production And Dashboard To Track Performance Of Manufacturing Operations Techniques Post Automation Tips Pdf
This slide depicts a strategic dashboard used by organizations to track performance of manufacturing operations after automating production processes. The key performance indicators are productivity before vs after automation, productivity increase rate post automation etc. Pitch your topic with ease and precision using this Production And Dashboard To Track Performance Of Manufacturing Operations Techniques Post Automation Tips Pdf This layout presents information on Productivity Before, After Automation, Process Completion It is also available for immediate download and adjustment. So, changes can be made in the color, design, graphics or any other component to create a unique layout. This slide depicts a strategic dashboard used by organizations to track performance of manufacturing operations after automating production processes. The key performance indicators are productivity before vs after automation, productivity increase rate post automation etc.
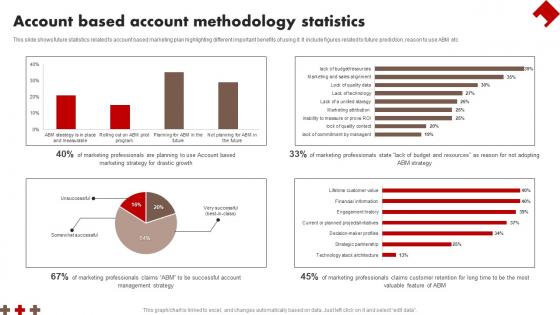
Account Based Account Methodology Statistics Demonstration Pdf
This slide shows future statistics related to account based marketing plan highlighting different important benefits of using it. It include figures related to future prediction, reason to use ABM etc Pitch your topic with ease and precision using this Account Based Account Methodology Statistics Demonstration Pdf This layout presents information on Account Based Account, Methodology Statistics It is also available for immediate download and adjustment. So, changes can be made in the color, design, graphics or any other component to create a unique layout. This slide shows future statistics related to account based marketing plan highlighting different important benefits of using it. It include figures related to future prediction, reason to use ABM etc
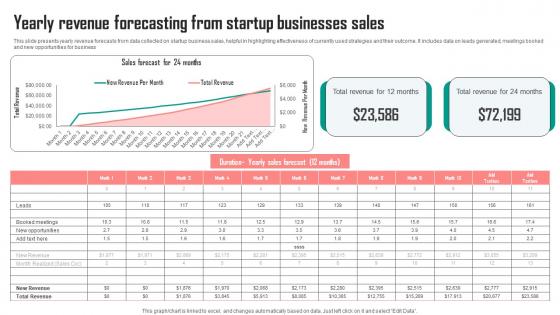
Yearly Revenue Forecasting From Startup Businesses Sales Graphics Pdf
This slide presents yearly revenue forecasts from data collected on startup business sales, helpful in highlighting effectiveness of currently used strategies and their outcome. It includes data on leads generated, meetings booked and new opportunities for business Pitch your topic with ease and precision using this Yearly Revenue Forecasting From Startup Businesses Sales Graphics Pdf. This layout presents information on Sales, Total Revenue, Months. It is also available for immediate download and adjustment. So, changes can be made in the color, design, graphics or any other component to create a unique layout. This slide presents yearly revenue forecasts from data collected on startup business sales, helpful in highlighting effectiveness of currently used strategies and their outcome. It includes data on leads generated, meetings booked and new opportunities for business
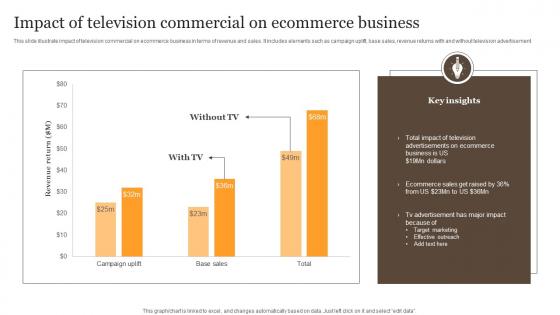
Impact Of Television Commercial On Ecommerce Business Diagrams Pdf
This slide illustrate impact of television commercial on ecommerce business in terms of revenue and sales. It includes elements such as campaign uplift, base sales, revenue returns with and without television advertisement Pitch your topic with ease and precision using this Impact Of Television Commercial On Ecommerce Business Diagrams Pdf. This layout presents information on Insights, Ecommerce, Business. It is also available for immediate download and adjustment. So, changes can be made in the color, design, graphics or any other component to create a unique layout. This slide illustrate impact of television commercial on ecommerce business in terms of revenue and sales. It includes elements such as campaign uplift, base sales, revenue returns with and without television advertisement
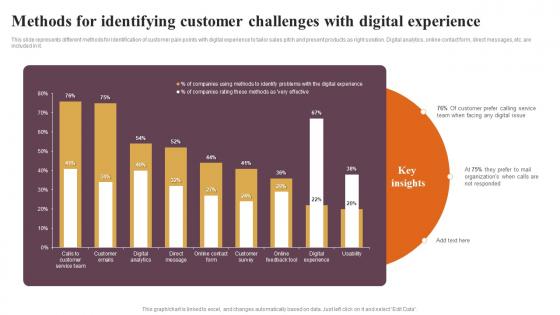
Methods For Identifying Customer Challenges With Digital Experience Introduction Pdf
This slide represents different methods for identification of customer pain points with digital experience to tailor sales pitch and present products as right solution. Digital analytics, online contact form, direct messages, etc. are included in it. Pitch your topic with ease and precision using this Methods For Identifying Customer Challenges With Digital Experience Introduction Pdf This layout presents information on Methods For Identifying, Customer Challenges, Digital Experience It is also available for immediate download and adjustment. So, changes can be made in the color, design, graphics or any other component to create a unique layout. This slide represents different methods for identification of customer pain points with digital experience to tailor sales pitch and present products as right solution. Digital analytics, online contact form, direct messages, etc. are included in it.
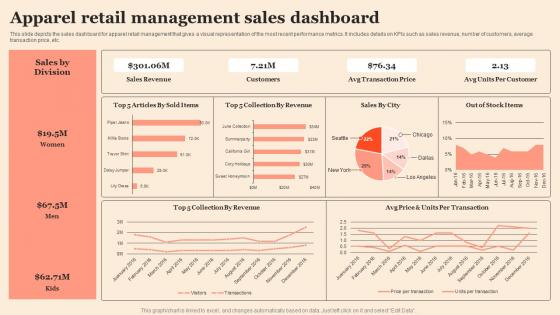
Apparel Retail Management Sales Dashboard Professional Pdf
This slide depicts the sales dashboard for apparel retail management that gives a visual representation of the most recent performance metrics. It includes details on KPIs such as sales revenue, number of customers, average transaction price, etc.Pitch your topic with ease and precision using this Apparel Retail Management Sales Dashboard Professional Pdf This layout presents information on Sales Revenue, Transaction Price, Units Per Customer It is also available for immediate download and adjustment. So, changes can be made in the color, design, graphics or any other component to create a unique layout. This slide depicts the sales dashboard for apparel retail management that gives a visual representation of the most recent performance metrics. It includes details on KPIs such as sales revenue, number of customers, average transaction price, etc.
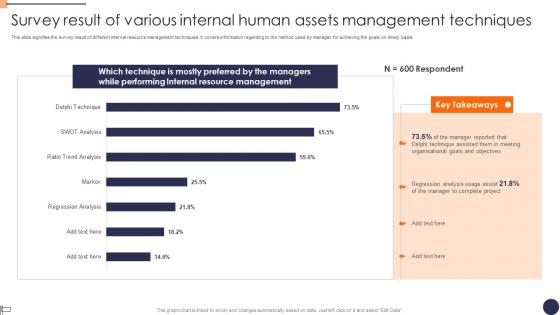
Survey Result Of Various Internal Human Assets Management Techniques Microsoft Pdf
This slide signifies the survey result of different internal resource management techniques. It covers information regarding to the method used by manager for achieving the goals on timely basis. Pitch your topic with ease and precision using this Survey Result Of Various Internal Human Assets Management Techniques Microsoft Pdf. This layout presents information on Regression Analysis, Goals And Objectives, Delphi Technique. It is also available for immediate download and adjustment. So, changes can be made in the color, design, graphics or any other component to create a unique layout. This slide signifies the survey result of different internal resource management techniques. It covers information regarding to the method used by manager for achieving the goals on timely basis.
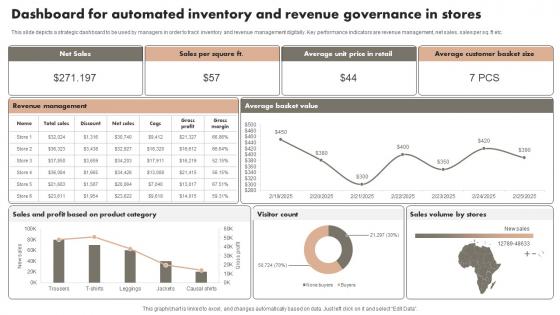
Dashboard For Automated Inventory And Revenue Governance In Stores Microsoft Pdf
This slide depicts a strategic dashboard to be used by managers in order to track inventory and revenue management digitally. Key performance indicators are revenue management, net sales, sales per sq. ft etc. Pitch your topic with ease and precision using this Dashboard For Automated Inventory And Revenue Governance In Stores Microsoft Pdf. This layout presents information on Net Sales, Stores, Category. It is also available for immediate download and adjustment. So, changes can be made in the color, design, graphics or any other component to create a unique layout. This slide depicts a strategic dashboard to be used by managers in order to track inventory and revenue management digitally. Key performance indicators are revenue management, net sales, sales per sq. ft etc.
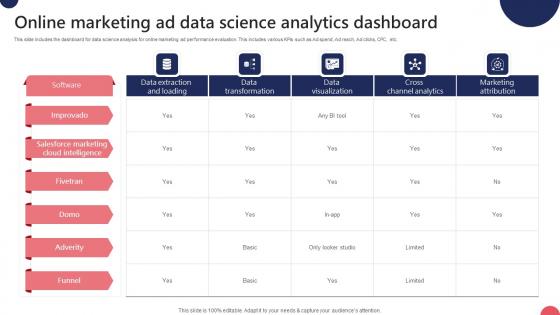
Online Marketing Ad Data Science Analytics Dashboard Ppt Inspiration Guidelines Pdf
This slide includes the dashboard for data science analysis for online marketing ad performance evaluation. This includes various KPIs such as Ad spend, Ad reach, Ad clicks, CPC, etc. Pitch your topic with ease and precision using this Online Marketing Ad Data Science Analytics Dashboard Ppt Inspiration Guidelines Pdf. This layout presents information on Ad Spend, Cost Per Thousand, Cost Per Click. It is also available for immediate download and adjustment. So, changes can be made in the color, design, graphics or any other component to create a unique layout. This slide includes the dashboard for data science analysis for online marketing ad performance evaluation. This includes various KPIs such as Ad spend, Ad reach, Ad clicks, CPC, etc.
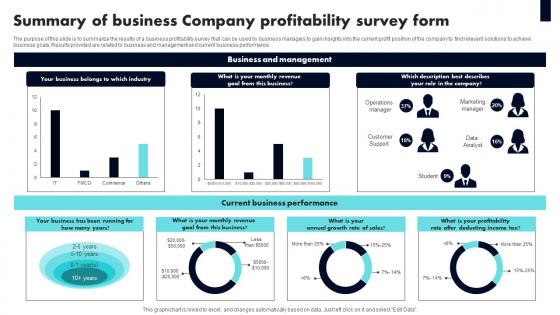
Summary Of Business Company Profitability Survey Form Survey Ss
The purpose of this slide is to summarize the results of a business profitability survey that can be used by business managers to gain insights into the current profit position of the company to find relevant solutions to achieve business goals. Results provided are related to business and management and current business performance Pitch your topic with ease and precision using this Summary Of Business Company Profitability Survey Form Survey Ss This layout presents information on Business Belongs, Revenue, Company It is also available for immediate download and adjustment. So, changes can be made in the color, design, graphics or any other component to create a unique layout. The purpose of this slide is to summarize the results of a business profitability survey that can be used by business managers to gain insights into the current profit position of the company to find relevant solutions to achieve business goals. Results provided are related to business and management and current business performance
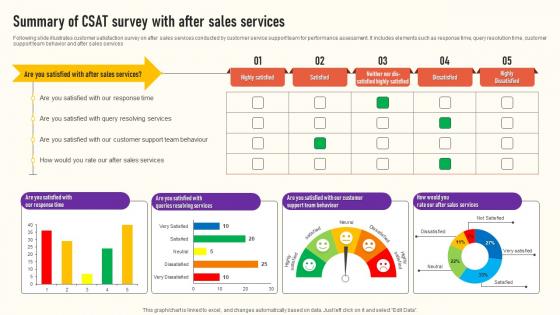
Summary Of CSAT Survey With After Sales Services Survey Ss
Following slide illustrates customer satisfaction survey on after sales services conducted by customer service support team for performance assessment. It includes elements such as response time, query resolution time, customer support team behavior and after sales services Pitch your topic with ease and precision using this Summary Of CSAT Survey With After Sales Services Survey Ss This layout presents information on Highly Satisfied, Dissatisfied, Highly Dissatisfied It is also available for immediate download and adjustment. So, changes can be made in the color, design, graphics or any other component to create a unique layout. Following slide illustrates customer satisfaction survey on after sales services conducted by customer service support team for performance assessment. It includes elements such as response time, query resolution time, customer support team behavior and after sales services
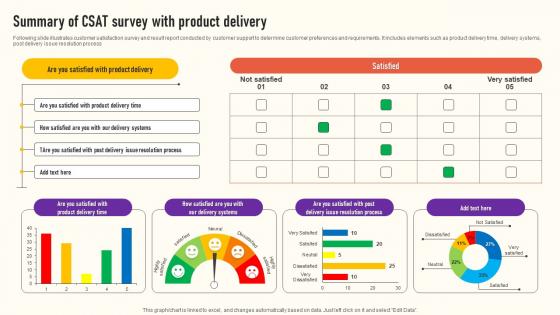
Summary Of CSAT Survey With Product Delivery Survey Ss
Following slide illustrates customer satisfaction survey and result report conducted by customer support to determine customer preferences and requirements. It includes elements such as product delivery time, delivery systems, post delivery issue resolution process Pitch your topic with ease and precision using this Summary Of CSAT Survey With Product Delivery Survey Ss This layout presents information on Delivery Systems, Resolution Process, Satisfied It is also available for immediate download and adjustment. So, changes can be made in the color, design, graphics or any other component to create a unique layout. Following slide illustrates customer satisfaction survey and result report conducted by customer support to determine customer preferences and requirements. It includes elements such as product delivery time, delivery systems, post delivery issue resolution process
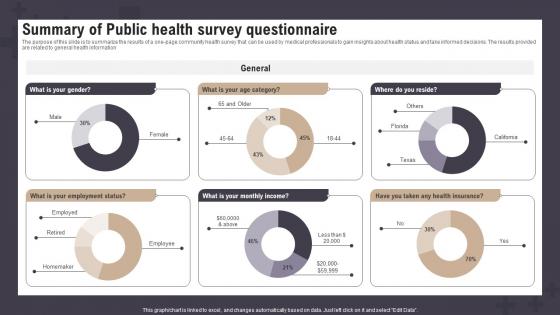
Summary Of Public Health Survey Questionnaire Survey Ss
The purpose of this slide is to summarize the results of a one-page community health survey that can be used by medical professionals to gain insights about health status and take informed decisions. The results provided are related to general health information Pitch your topic with ease and precision using this Summary Of Public Health Survey Questionnaire Survey Ss This layout presents information on Age Category, Health Insurance, Survey Questionnaire It is also available for immediate download and adjustment. So, changes can be made in the color, design, graphics or any other component to create a unique layout. The purpose of this slide is to summarize the results of a one-page community health survey that can be used by medical professionals to gain insights about health status and take informed decisions. The results provided are related to general health information
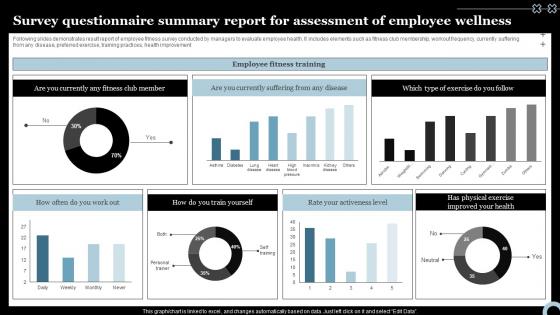
Survey Questionnaire Summary Report For Assessment Of Employee Wellness Survey Ss
Following slides demonstrates result report of employee fitness survey conducted by managers to evaluate employee health. It includes elements such as fitness club membership, workout frequency, currently suffering from any disease, preferred exercise, training practices, health improvement Pitch your topic with ease and precision using this Survey Questionnaire Summary Report For Assessment Of Employee Wellness Survey Ss This layout presents information on Currently Any Fitness, Physical Exercise, Survey Questionnaire It is also available for immediate download and adjustment. So, changes can be made in the color, design, graphics or any other component to create a unique layout. Following slides demonstrates result report of employee fitness survey conducted by managers to evaluate employee health. It includes elements such as fitness club membership, workout frequency, currently suffering from any disease, preferred exercise, training practices, health improvement
Tracking Working Of Employees In Software Companies Summary Pdf
Following slide shows tracking employees hours worked in software companies which assist in to check productivity of employee on daily basis. It includes various KPI such as email received, actual response , average working hours, etc. Pitch your topic with ease and precision using this Tracking Working Of Employees In Software Companies Summary Pdf This layout presents information on Tracking Traffic, Tracking Working, Software Companies It is also available for immediate download and adjustment. So, changes can be made in the color, design, graphics or any other component to create a unique layout. Following slide shows tracking employees hours worked in software companies which assist in to check productivity of employee on daily basis. It includes various KPI such as email received, actual response , average working hours, etc.

Cost Breakdown For Executing Effective Advertising Plan Diagrams Pdf
This slide graphically provides information about the promotional plan budget allocation that outline money business intends to spend on marketing related activities. It includes online marketing, direct marketing, personal selling, etc. Pitch your topic with ease and precision using this Cost Breakdown For Executing Effective Advertising Plan Diagrams Pdf. This layout presents information on Online Marketing, Budget Allocation. It is also available for immediate download and adjustment. So, changes can be made in the color, design, graphics or any other component to create a unique layout. This slide graphically provides information about the promotional plan budget allocation that outline money business intends to spend on marketing related activities. It includes online marketing, direct marketing, personal selling, etc.
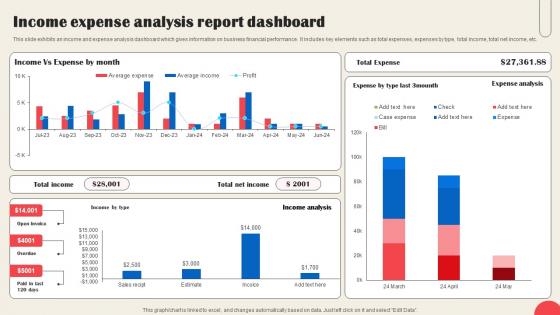
Income Expense Analysis Report Dashboard Sample Pdf
This slide exhibits an income and expense analysis dashboard which gives information on business financial performance. It includes key elements such as total expenses, expenses by type, total income, total net income, etc. Pitch your topic with ease and precision using this Income Expense Analysis Report Dashboard Sample Pdf This layout presents information on Income Expense, Analysis Report Dashboard It is also available for immediate download and adjustment. So, changes can be made in the color, design, graphics or any other component to create a unique layout. This slide exhibits an income and expense analysis dashboard which gives information on business financial performance. It includes key elements such as total expenses, expenses by type, total income, total net income, etc.
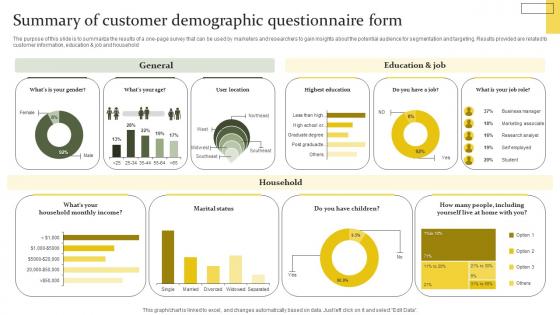
Summary Of Customer Demographic Questionnaire Form Microsoft Pdf
The purpose of this slide is to summarize the results of a one-page survey that can be used by marketers and researchers to gain insights about the potential audience for segmentation and targeting. Results provided are related to customer information, education and job and household Pitch your topic with ease and precision using this Summary Of Customer Demographic Questionnaire Form Microsoft Pdf This layout presents information on Household, Education And Job, General It is also available for immediate download and adjustment. So, changes can be made in the color, design, graphics or any other component to create a unique layout. The purpose of this slide is to summarize the results of a one-page survey that can be used by marketers and researchers to gain insights about the potential audience for segmentation and targeting. Results provided are related to customer information, education and job and household

Sales Outreach Challenges With Effective Solution Themes Pdf
Mentioned slide displays multiple challenges faced by business in sales communication with respective solution to achieve business milestones. It includes challenges such as lead generation, website management, low budget, developing targeting content and obsolete technology. Pitch your topic with ease and precision using this Sales Outreach Challenges With Effective Solution Themes Pdf. This layout presents information on Sales Outreach Challenges, Developing Targeting Content, Obsolete Technology. It is also available for immediate download and adjustment. So, changes can be made in the color, design, graphics or any other component to create a unique layout. Mentioned slide displays multiple challenges faced by business in sales communication with respective solution to achieve business milestones. It includes challenges such as lead generation, website management, low budget, developing targeting content and obsolete technology.
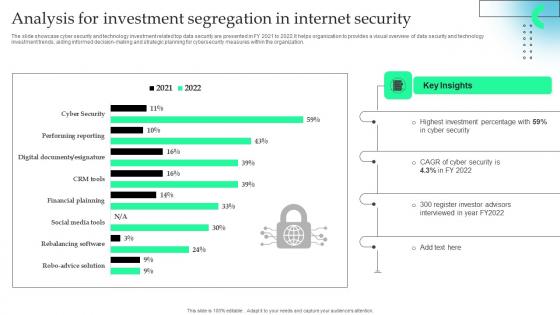
Analysis For Investment Segregation In Internet Security Formats Pdf
The slide showcase cyber security and technology investment related top data security are presented in FY 2021 to 2022.It helps organization to provides a visual overview of data security and technology investment trends, aiding informed decision making and strategic planning for cybersecurity measures within the organization.Pitch your topic with ease and precision using this Analysis For Investment Segregation In Internet Security Formats Pdf This layout presents information on Highest Investment, Register Investor Advisors, Key Insights It is also available for immediate download and adjustment. So, changes can be made in the color, design, graphics or any other component to create a unique layout. The slide showcase cyber security and technology investment related top data security are presented in FY 2021 to 2022.It helps organization to provides a visual overview of data security and technology investment trends, aiding informed decision making and strategic planning for cybersecurity measures within the organization.
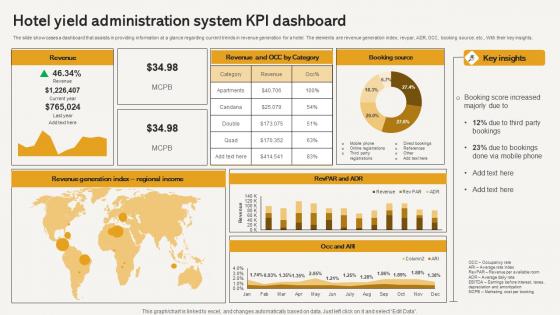
Hotel Yield Administration System Kpi Dashboard Elements Pdf
The slide showcases a dashboard that assists in providing information at a glance regarding current trends in revenue generation for a hotel. The elements are revenue generation index, revpar, ADR, OCC, booking source, etc., With their key insights. Pitch your topic with ease and precision using this Hotel Yield Administration System Kpi Dashboard Elements Pdf This layout presents information on Revenue, Booking Source, Regional Income, Key Insights It is also available for immediate download and adjustment. So, changes can be made in the color, design, graphics or any other component to create a unique layout. The slide showcases a dashboard that assists in providing information at a glance regarding current trends in revenue generation for a hotel. The elements are revenue generation index, revpar, ADR, OCC, booking source, etc., With their key insights.
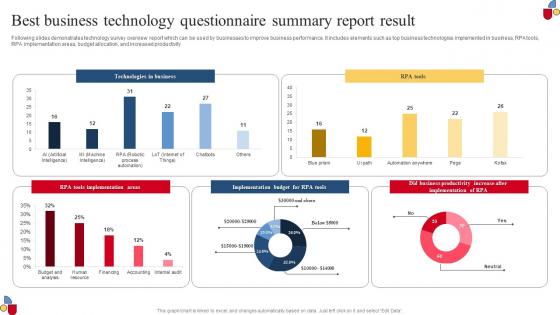
Best Business Technology Questionnaire Summary Report Result Summary Pdf
Following slides demonstrates technology survey overview report which can be used by businesses to improve business performance. It includes elements such as top business technologies implemented in business, RPA tools, RPA implementation areas, budget allocation, and increased productivity Pitch your topic with ease and precision using this Best Business Technology Questionnaire Summary Report Result Summary Pdf This layout presents information on Technologies In Business, Implementation Areas, Business Productivity It is also available for immediate download and adjustment. So, changes can be made in the color, design, graphics or any other component to create a unique layout. Following slides demonstrates technology survey overview report which can be used by businesses to improve business performance. It includes elements such as top business technologies implemented in business, RPA tools, RPA implementation areas, budget allocation, and increased productivity
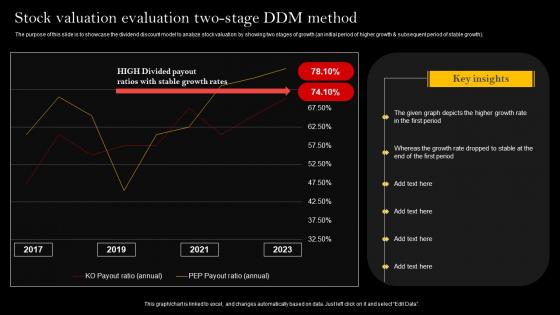
Stock Valuation Evaluation Two Stage DDM Method Sample Pdf
The purpose of this slide is to showcase the dividend discount model to analyze stock valuation by showing two stages of growth an initial period of higher growth and subsequent period of stable growth. Pitch your topic with ease and precision using this Stock Valuation Evaluation Two Stage DDM Method Sample Pdf This layout presents information on Stock Valuation, Evaluation Two Stage, DDM Method It is also available for immediate download and adjustment. So, changes can be made in the color, design, graphics or any other component to create a unique layout. The purpose of this slide is to showcase the dividend discount model to analyze stock valuation by showing two stages of growth an initial period of higher growth and subsequent period of stable growth.
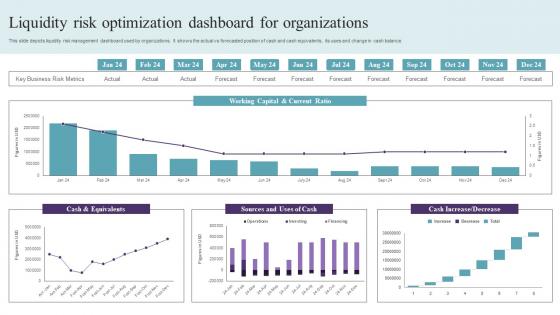
Liquidity Risk Optimization Dashboard For Organizations Graphics Pdf
This slide depicts liquidity risk management dashboard used by organizations. It shows the actual vs forecasted position of cash and cash equivalents, its uses and change in cash balance. Pitch your topic with ease and precision using this Liquidity Risk Optimization Dashboard For Organizations Graphics Pdf. This layout presents information on Cash And Equivalents, Working Capital, Current Ratio. It is also available for immediate download and adjustment. So, changes can be made in the color, design, graphics or any other component to create a unique layout. This slide depicts liquidity risk management dashboard used by organizations. It shows the actual vs forecasted position of cash and cash equivalents, its uses and change in cash balance.
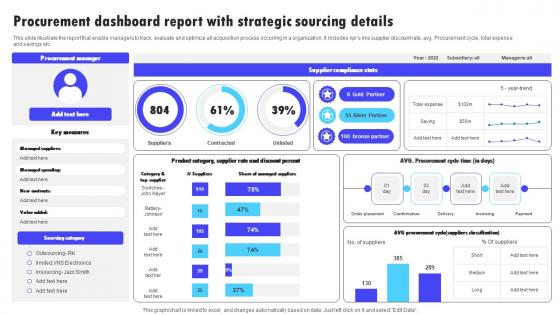
Procurement Dashboard Report With Strategic Sourcing Details Information Pdf
This slide illustrate the report that enable managers to track, evaluate and optimize all acquisition process occurring in a organization. It includes kpis like supplier discount rate, avg. Procurement cycle, total expense and savings etc. Pitch your topic with ease and precision using this Procurement Dashboard Report With Strategic Sourcing Details Information Pdf. This layout presents information on Supplier Compliance Stats, Procurement Manager, Sourcing Category. It is also available for immediate download and adjustment. So, changes can be made in the color, design, graphics or any other component to create a unique layout. This slide illustrate the report that enable managers to track, evaluate and optimize all acquisition process occurring in a organization. It includes kpis like supplier discount rate, avg. Procurement cycle, total expense and savings etc.


 Continue with Email

 Home
Home


