Comparison Chart
Business Project Problems Management Report With Status Ppt PowerPoint Presentation Icon Professional PDF
Pitch your topic with ease and precision using this business project problems management report with status ppt powerpoint presentation icon professional pdf. This layout presents information on business project problems management report with status. It is also available for immediate download and adjustment. So, changes can be made in the color, design, graphics or any other component to create a unique layout.
Stock And Inventory Dashboard With Employee Hours Ppt PowerPoint Presentation File Icon PDF
Pitch your topic with ease and precision using this stock and inventory dashboard with employee hours ppt powerpoint presentation file icon pdf. This layout presents information on performance, employee, inventory value, inventory turnover. It is also available for immediate download and adjustment. So, changes can be made in the color, design, graphics or any other component to create a unique layout.
Cloud Security KPI Dashboard With Key Statistics Ppt Icon Examples PDF
Pitch your topic with ease and precision using this Cloud Security KPI Dashboard With Key Statistics Ppt Icon Examples PDF. This layout presents information on Compliance Trend, Risk Status, Risk Severity. It is also available for immediate download and adjustment. So, changes can be made in the color, design, graphics or any other component to create a unique layout.
Social Media Tracking Dashboard With Channel Views Statistics Ppt Icon Gallery PDF
Pitch your topic with ease and precision using this Social Media Tracking Dashboard With Channel Views Statistics Ppt Icon Gallery PDF. This layout presents information on Social Media, Tracking Dashboard, Channel Views Statistics. It is also available for immediate download and adjustment. So, changes can be made in the color, design, graphics or any other component to create a unique layout.
Customer Media Preference For Advertisement By Different Age Categories Icons PDF
Pitch your topic with ease and precision using this Customer Media Preference For Advertisement By Different Age Categories Icons PDF. This layout presents information on Customer Media, Preference For Advertisement, Different Age Categories. It is also available for immediate download and adjustment. So, changes can be made in the color, design, graphics or any other component to create a unique layout.
Metrics Icon For Real Time Tracking And Monitoring Of Organizational Change Topics PDF
Pitch your topic with ease and precision using this Metrics Icon For Real Time Tracking And Monitoring Of Organizational Change Topics PDF This layout presents information on Metrics, Real Time, Tracking. It is also available for immediate download and adjustment. So, changes can be made in the color, design, graphics or any other component to create a unique layout.
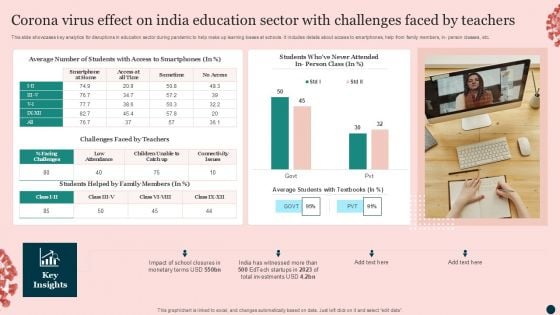
Corona Virus Effect On India Education Sector With Challenges Faced By Teachers Icons PDF
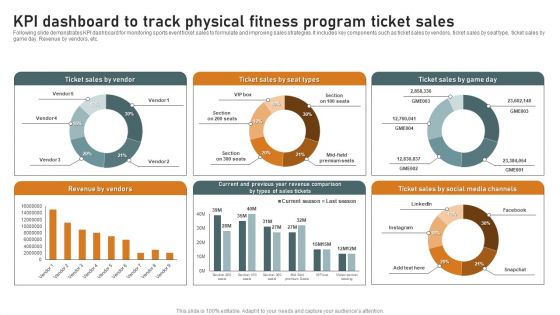
KPI Dashboard To Track Physical Fitness Program Ticket Sales Summary PDF
Following slide demonstrates KPI dashboard for monitoring sports event ticket sales to formulate and improving sales strategies. It includes key components such as ticket sales by vendors, ticket sales by seat type, ticket sales by game day. Revenue by vendors, etc. Showcasing this set of slides titled KPI Dashboard To Track Physical Fitness Program Ticket Sales Summary PDF. The topics addressed in these templates are Revenue By Vendors, Sales By Vendor, Social Media Channels. All the content presented in this PPT design is completely editable. Download it and make adjustments in color, background, font etc. as per your unique business setting.
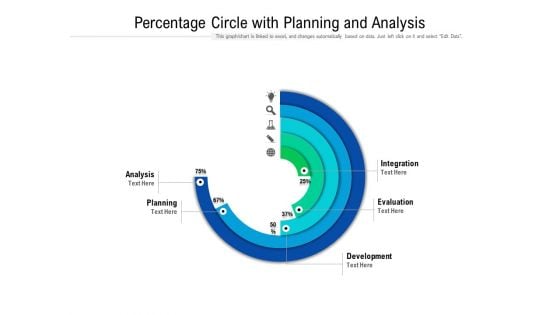
Percentage Circle With Planning And Analysis Ppt PowerPoint Presentation File Background PDF
Pitch your topic with ease and precision using this percentage circle with planning and analysis ppt powerpoint presentation file background pdf. This layout presents information on development, evaluation, integration. It is also available for immediate download and adjustment. So, changes can be made in the color, design, graphics or any other component to create a unique layout.
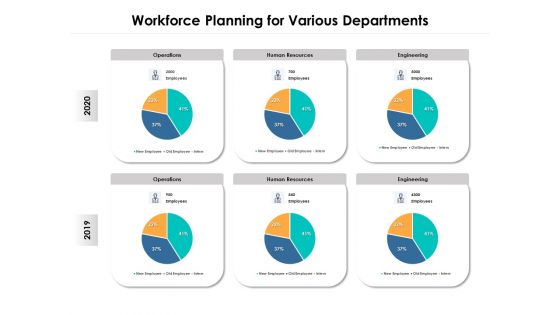
Workforce Planning For Various Departments Ppt PowerPoint Presentation Outline Design Inspiration PDF
Pitch your topic with ease and precision using this workforce planning for various departments ppt powerpoint presentation outline design inspiration pdf. This layout presents information on operations, human resources, engineering, operations, human resources, engineering. It is also available for immediate download and adjustment. So, changes can be made in the color, design, graphics or any other component to create a unique layout.
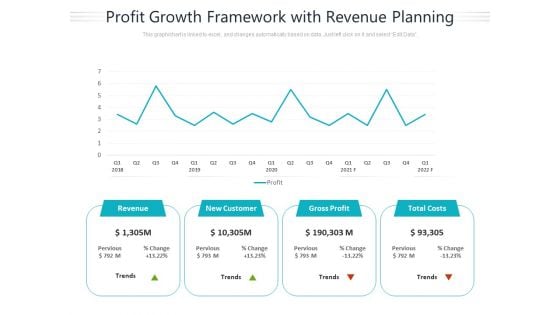
Profit Growth Framework With Revenue Planning Ppt PowerPoint Presentation Portfolio Design Inspiration PDF
Pitch your topic with ease and precision using this profit growth framework with revenue planning ppt powerpoint presentation portfolio design inspiration pdf. This layout presents information on revenue, gross profit, total costs. It is also available for immediate download and adjustment. So, changes can be made in the color, design, graphics or any other component to create a unique layout.
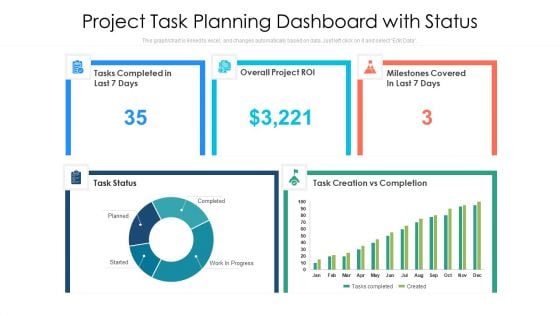
Project Task Planning Dashboard With Status Ppt PowerPoint Presentation Gallery Visual Aids PDF
Pitch your topic with ease and precision using this project task planning dashboard with status ppt powerpoint presentation gallery visual aids pdf. This layout presents information on task creation vs completion, milestones covered, overall project. It is also available for immediate download and adjustment. So, changes can be made in the color, design, graphics or any other component to create a unique layout.
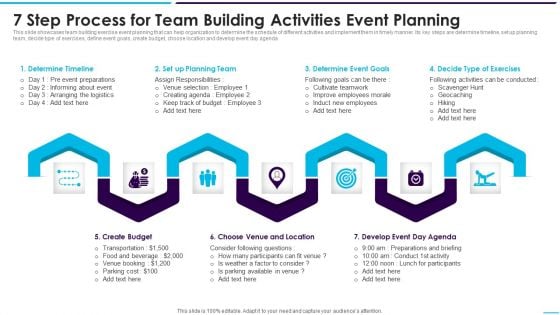
7 Step Process For Team Building Activities Event Planning Background PDF
Pitch your topic with ease and precision using this 7 Step Process For Team Building Activities Event Planning Background PDF This layout presents information on Determine Timeline, Determine Event, Create Budget It is also available for immediate download and adjustment. So, changes can be made in the color, design, graphics or any other component to create a unique layout.
Application Performance Dashboard Ppt Icon Template PDF
This slide covers application performance in market KPIs and metrics such as impressions, clicks, searches for app, conversion rate etc. This Application Performance Dashboard Ppt Icon Template PDF from Slidegeeks makes it easy to present information on your topic with precision. It provides customization options, so you can make changes to the colors, design, graphics, or any other component to create a unique layout. It is also available for immediate download, so you can begin using it right away. Slidegeeks has done good research to ensure that you have everything you need to make your presentation stand out. Make a name out there for a brilliant performance.
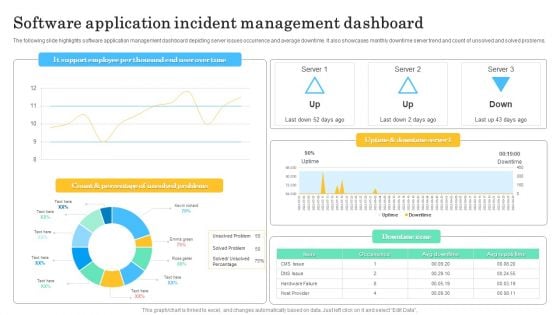
Software Application Incident Management Dashboard Template PDF
The following slide highlights software application management dashboard depicting server issues occurrence and average downtime. It also showcases monthly downtime server trend and count of unsolved and solved problems. Pitch your topic with ease and precision using this Software Application Incident Management Dashboard Template PDF. This layout presents information on Count And Percentage, Unsolved Problems. It is also available for immediate download and adjustment. So, changes can be made in the color, design, graphics or any other component to create a unique layout.
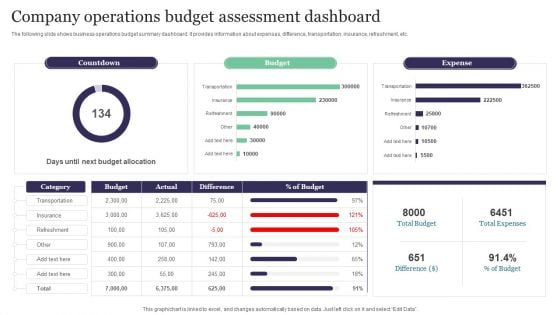
Company Operations Budget Assessment Dashboard Template PDF
The following slide shows business operations budget summary dashboard. It provides information about expenses, difference, transportation, insurance, refreshment, etc. Pitch your topic with ease and precision using this Company Operations Budget Assessment Dashboard Template PDF. This layout presents information on Countdown, Budget, Expense. It is also available for immediate download and adjustment. So, changes can be made in the color, design, graphics or any other component to create a unique layout.
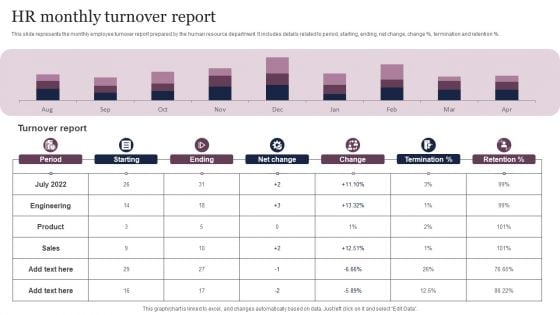
HR Monthly Turnover Report Template PDF
This slide represents the monthly employee turnover report prepared by the human resource department. It includes details related to period, starting, ending, net change, change percent, termination and retention percent. Pitch your topic with ease and precision using this HR Monthly Turnover Report Template PDF. This layout presents information on Product, Sales, Turnover Report. It is also available for immediate download and adjustment. So, changes can be made in the color, design, graphics or any other component to create a unique layout.
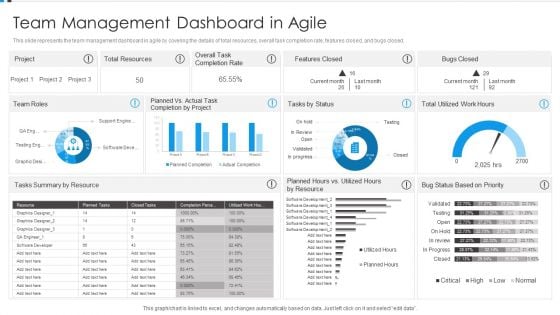
Agile Development Approach IT Team Management Dashboard In Agile Sample PDF
This slide represents the team management dashboard in agile by covering the details of total resources, overall task completion rate, features closed, and bugs closed. Deliver an awe inspiring pitch with this creative Agile Development Approach IT Team Management Dashboard In Agile Sample PDF bundle. Topics like Total Resources, Project, Features Closed, Bugs Closed, Team Roles can be discussed with this completely editable template. It is available for immediate download depending on the needs and requirements of the user.
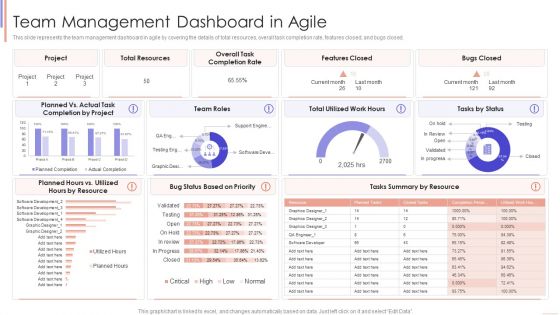
Agile Sprint Technique In Software Team Management Dashboard In Agile Guidelines PDF
This slide represents the team management dashboard in agile by covering the details of total resources, overall task completion rate, features closed, and bugs closed.Deliver and pitch your topic in the best possible manner with this Agile Sprint Technique In Software Team Management Dashboard In Agile Guidelines PDF. Use them to share invaluable insights on Total Resources, Completion Rate, Features Closed and impress your audience. This template can be altered and modified as per your expectations. So, grab it now.
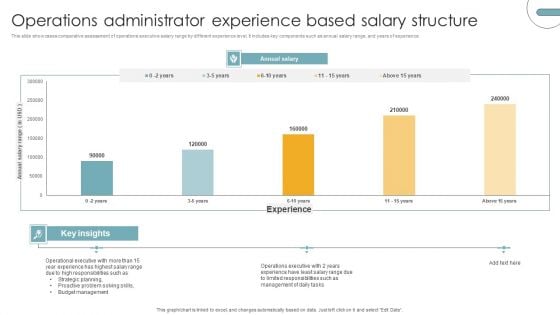
Operations Administrator Experience Based Salary Structure Structure PDF
This slide showcases comparative assessment of operations executive salary range by different experience level. It includes key components such as annual salary range, and years of experience. Pitch your topic with ease and precision using this Operations Administrator Experience Based Salary Structure Structure PDF. This layout presents information on Budget Management, Strategic Planning, Management, Operations Executive, Responsibilities. It is also available for immediate download and adjustment. So, changes can be made in the color, design, graphics or any other component to create a unique layout.
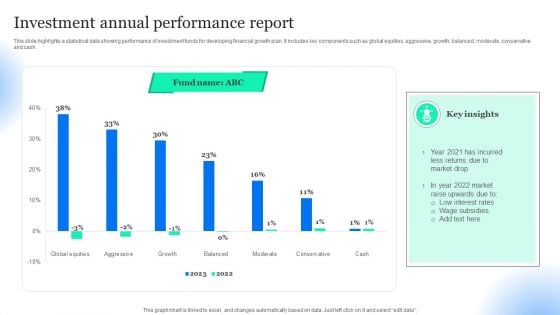
Investment Annual Performance Report Pictures PDF
This slide highlights a statistical data showing performance of investment funds for developing financial growth plan. It includes key components such as global equities, aggressive, growth, balanced, moderate, conservative and cash. Pitch your topic with ease and precision using this Investment Annual Performance Report Pictures PDF. This layout presents information on Low Interest Rates, Wage Subsidies, Returns Due Market Drop. It is also available for immediate download and adjustment. So, changes can be made in the color, design, graphics or any other component to create a unique layout.
Tracking Expenditure Incurred On Cloud Deployment Dashboard Download PDF
The following slide highlights cloud implementation expenditure dashboard to determine overspend, unused resources, plan future costs, available discounts, customization options etc. It includes components such as cloud native, software, departments, cost centre etc. Pitch your topic with ease and precision using this Tracking Expenditure Incurred On Cloud Deployment Dashboard Download PDF. This layout presents information on Dashboard, Tracking, Deployment. It is also available for immediate download and adjustment. So, changes can be made in the color, design, graphics or any other component to create a unique layout.
Building Construction Project Progress Report Map Icon Professional PDF
This slide defines the dashboard for analyzing the status of a building constructing project. It includes information related to progress, cost breakdown, budget and work schedule. Pitch your topic with ease and precision using this Building Construction Project Progress Report Map Icon Professional PDF. This layout presents information on Design Build, Project Start, Project End. It is also available for immediate download and adjustment. So, changes can be made in the color, design, graphics or any other component to create a unique layout.
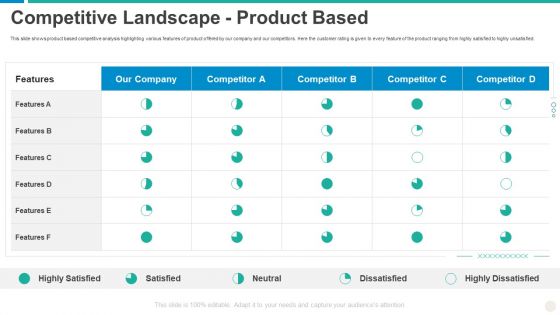
Establishing Successful Brand Strategy To Captivate Consumers Competitive Landscape Product Based Themes PDF
This slide shows product based competitive analysis highlighting various features of product offered by our company and our competitors. Here the customer rating is given to every feature of the product ranging from highly satisfied to highly unsatisfied. Deliver an awe inspiring pitch with this creative establishing successful brand strategy to captivate consumers competitive landscape product based themes pdf bundle. Topics like competitive landscape product based can be discussed with this completely editable template. It is available for immediate download depending on the needs and requirements of the user.
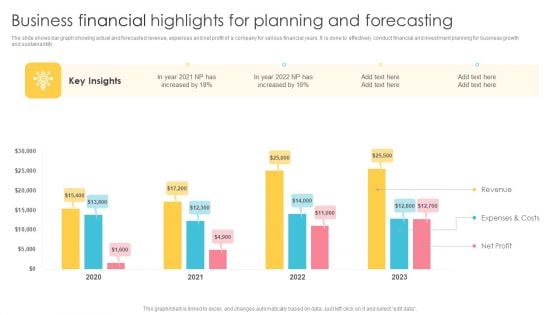
Business Financial Highlights For Planning And Forecasting Background PDF
The slide shows bar graph showing actual and forecasted revenue, expenses and net profit of a company for various financial years. It is done to effectively conduct financial and investment planning for business growth and sustainability. Pitch your topic with ease and precision using this Business Financial Highlights For Planning And Forecasting Background PDF. This layout presents information on Revenue, Expenses And Costs, Net Profit. It is also available for immediate download and adjustment. So, changes can be made in the color, design, graphics or any other component to create a unique layout.
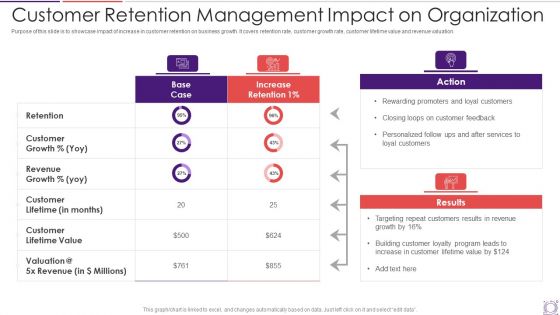
Customer Retention Management Impact On Organization Template PDF
Purpose of this slide is to showcase impact of increase in customer retention on business growth. It covers retention rate, customer growth rate, customer lifetime value and revenue valuation. Pitch your topic with ease and precision using this customer retention management impact on organization template pdf. This layout presents information on customers, services, rewarding promoters. It is also available for immediate download and adjustment. So, changes can be made in the color, design, graphics or any other component to create a unique layout.
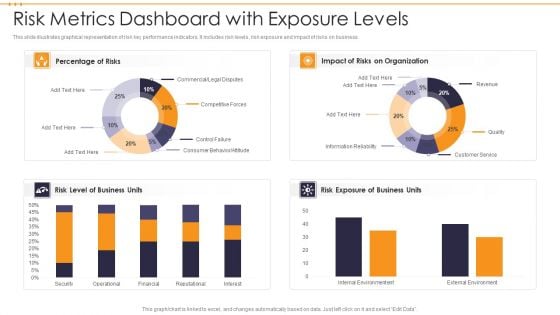
Risk Metrics Dashboard With Exposure Levels Template PDF
This slide illustrates graphical representation of risk key performance indicators. It includes risk levels, risk exposure and impact of risks on business. Pitch your topic with ease and precision using this Risk Metrics Dashboard With Exposure Levels Template PDF. This layout presents information on Risk Metrics Dashboard With Exposure Levels. It is also available for immediate download and adjustment. So, changes can be made in the color, design, graphics or any other component to create a unique layout.

Financial Us Equity Market Ownership Summary Analysis Template PDF
The following slide highlights the USA market report of equity Market which includes households, mutual funds, and foreign investors. Pitch your topic with ease and precision using this Financial Us Equity Market Ownership Summary Analysis Template PDF. This layout presents information on Equity, Investors, Market. It is also available for immediate download and adjustment. So, changes can be made in the color, design, graphics or any other component to create a unique layout.
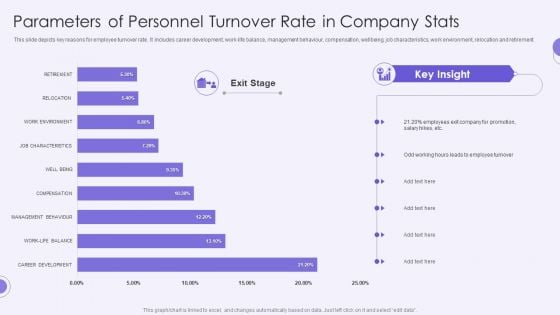
Parameters Of Personnel Turnover Rate In Company Stats Template PDF
This slide depicts key reasons for employee turnover rate. It includes career development, work-life balance, management behaviour, compensation, wellbeing, job characteristics, work environment, relocation and retirement.Pitch your topic with ease and precision using this Parameters Of Personnel Turnover Rate In Company Stats Template PDF. This layout presents information on Career Development, Management Behavior, Compensation. It is also available for immediate download and adjustment. So, changes can be made in the color, design, graphics or any other component to create a unique layout.
Education Dashboard For Tracking Gender Based Retention Metrics Template PDF
This slide illustrates student retention analysis dashboard. It include metrics based on gender, campus, ethnicity, and age group. Pitch your topic with ease and precision using this Education Dashboard For Tracking Gender Based Retention Metrics Template PDF. This layout presents information on Gender Based, Retention Rates, Age Group, Campus Wise. It is also available for immediate download and adjustment. So, changes can be made in the color, design, graphics or any other component to create a unique layout.
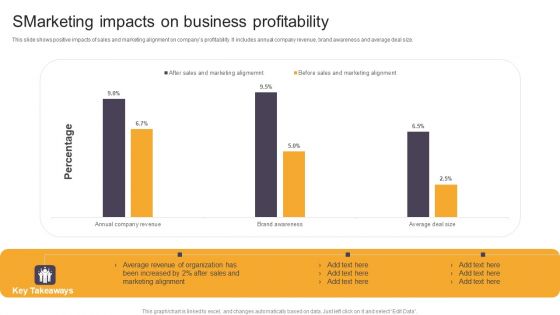
Smarketing Impacts On Business Profitability Ppt Outline Graphics Template PDF
This slide shows positive impacts of sales and marketing alignment on companys profitability. It includes annual company revenue, brand awareness and average deal size. Pitch your topic with ease and precision using this Smarketing Impacts On Business Profitability Ppt Outline Graphics Template PDF. This layout presents information on Sales And Marketing, Average Revenue, Organization. It is also available for immediate download and adjustment. So, changes can be made in the color, design, graphics or any other component to create a unique layout.
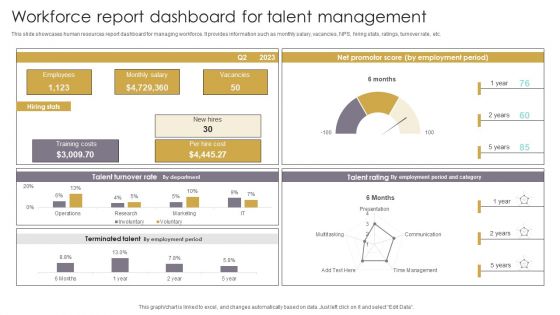
Workforce Report Dashboard For Talent Management Template PDF
This slide showcases human resources report dashboard for managing workforce. It provides information such as monthly salary, vacancies, NPS, hiring stats, ratings, turnover rate, etc. Pitch your topic with ease and precision using this Workforce Report Dashboard For Talent Management Template PDF. This layout presents information on Employees, Training Costs, Talent Turnover Rate. It is also available for immediate download and adjustment. So, changes can be made in the color, design, graphics or any other component to create a unique layout.

Action Plan To Optimize Hiring Process Dashboard To Analyze Application Sources And Days To Hire Themes PDF
This slide showcases dashboard that can help organization to evaluate average days taken to hire a candidate and major sources of application. It also showcases various other components which are open positions, candidates place, avg commission rate, reasons for candidate and client decline.Deliver and pitch your topic in the best possible manner with this Action Plan To Optimize Hiring Process Dashboard To Analyze Application Sources And Days To Hire Themes PDF Use them to share invaluable insights on Open Positions, Recruitment Funnel, Total Commission and impress your audience. This template can be altered and modified as per your expectations. So, grab it now.
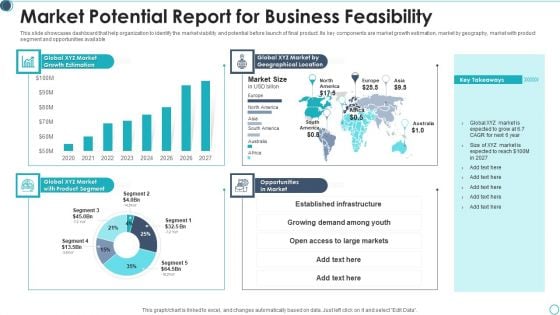
Market Potential Report For Business Feasibility Pictures PDF
This slide showcases dashboard that help organization to identify the market viability and potential before launch of final product. Its key components are market growth estimation, market by geography, market with product segment and opportunities available Pitch your topic with ease and precision using this market potential report for business feasibility pictures pdf This layout presents information on geographical location, opportunities in market, growth estimation It is also available for immediate download and adjustment. So, changes can be made in the color, design, graphics or any other component to create a unique layout.
OEM Spare Parts Sales Tracking Dashboard Ppt PowerPoint Presentation Gallery Inspiration PDF
This slide showcases dashboard that can help organization to keep track of aftermarket components sales. Its key elements are sold quantity per spare part and deviation of sold units. Pitch your topic with ease and precision using this oem spare parts sales tracking dashboard ppt powerpoint presentation gallery inspiration pdf. This layout presents information on sold quantity, budgeted quantity, quantity ytd ly. It is also available for immediate download and adjustment. So, changes can be made in the color, design, graphics or any other component to create a unique layout.
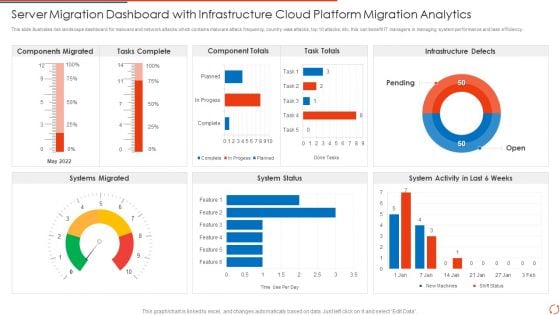
Server Migration Dashboard With Infrastructure Cloud Platform Migration Analytics Elements PDF Portrait PDF
This slide illustrates risk landscape dashboard for malware and network attacks which contains malware attack frequency, country wise attacks, top 10 attacks, etc. this can benefit IT managers in managing system performance and task efficiency Pitch your topic with ease and precision using this Server Migration Dashboard With Infrastructure Cloud Platform Migration Analytics Elements PDF Portrait PDF. This layout presents information on Tasks Complete, Component Totals, Task Totals. It is also available for immediate download and adjustment. So, changes can be made in the color, design, graphics or any other component to create a unique layout.
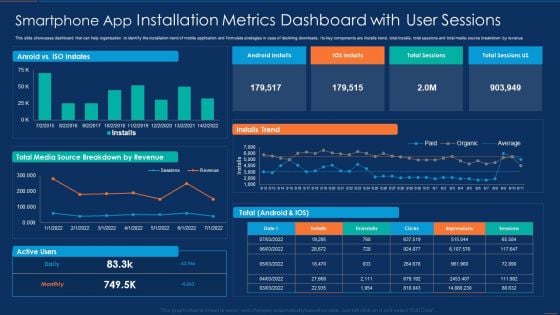
Smartphone App Installation Metrics Dashboard With User Sessions Microsoft PDF
This slide showcases dashboard that can help organization to identify the installation trend of mobile application and formulate strategies in case of declining downloads. Its key components are installs trend, total installs, total sessions and total media source breakdown by revenue. Pitch your topic with ease and precision using this Smartphone App Installation Metrics Dashboard With User Sessions Microsoft PDF. This layout presents information on Smartphone App Installation Metrics Dashboard With User Sessions. It is also available for immediate download and adjustment. So, changes can be made in the color, design, graphics or any other component to create a unique layout.
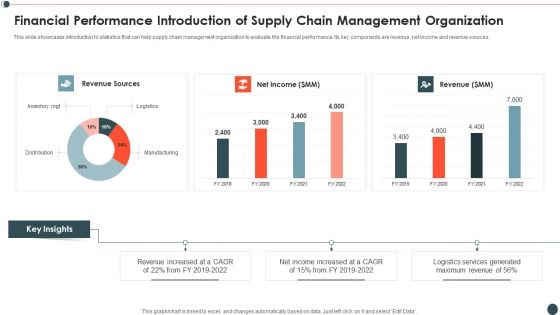
Financial Performance Introduction Of Supply Chain Management Organization Infographics PDF
This slide showcases introduction to statistics that can help supply chain management organization to evaluate the financial performance. Its key components are revenue, net income and revenue sources.Pitch your topic with ease and precision using this Financial Performance Introduction Of Supply Chain Management Organization Infographics PDF This layout presents information on Revenue Sources, Revenue Increased, Income Increased It is also available for immediate download and adjustment. So, changes can be made in the color, design, graphics or any other component to create a unique layout.
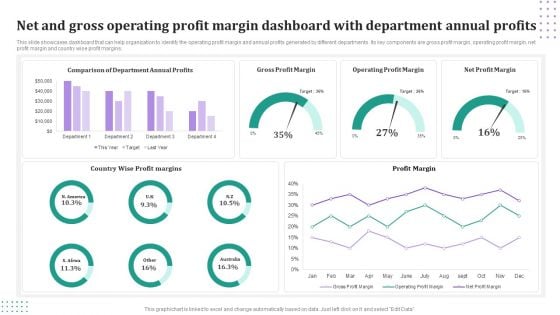
Net And Gross Operating Profit Margin Dashboard With Department Annual Profits Mockup PDF
This slide showcases dashboard that can help organization to identify the operating profit margin and annual profits generated by different departments. Its key components are gross profit margin, operating profit margin, net profit margin and country wise profit margins. Pitch your topic with ease and precision using this Net And Gross Operating Profit Margin Dashboard With Department Annual Profits Mockup PDF. This layout presents information on Gross Profit Margin, Operating Profit Margin, Net Profit Margin. It is also available for immediate download and adjustment. So, changes can be made in the color, design, graphics or any other component to create a unique layout.
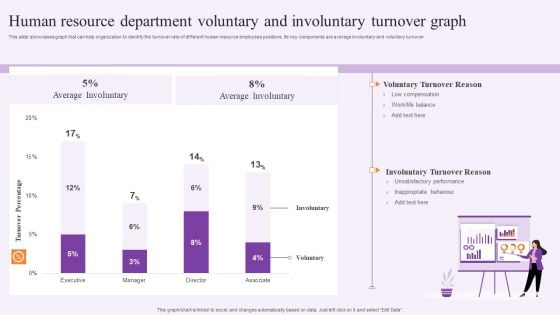
Human Resource Department Voluntary And Involuntary Turnover Graph Summary PDF
This slide showcases graph that can help organization to identify the turnover rate of different human resource employees positions. Its key components are average involuntary and voluntary turnover. Pitch your topic with ease and precision using this Human Resource Department Voluntary And Involuntary Turnover Graph Summary PDF. This layout presents information on Executive, Voluntary Turnover Reason, Average Involuntary. It is also available for immediate download and adjustment. So, changes can be made in the color, design, graphics or any other component to create a unique layout.
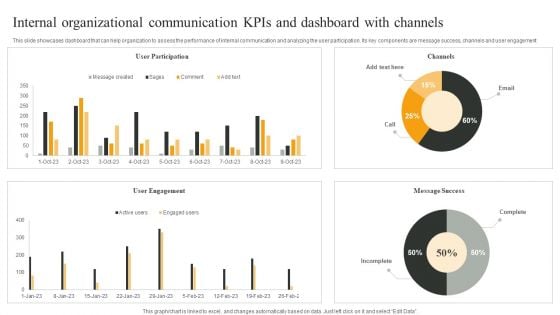
Internal Organizational Communication Kpis And Dashboard With Channels Infographics PDF
This slide showcases dashboard that can help organization to assess the performance of internal communication and analyzing the user participation. Its key components are message success, channels and user engagement. Pitch your topic with ease and precision using this Internal Organizational Communication Kpis And Dashboard With Channels Infographics PDF. This layout presents information on User Participation, User Engagement, Message Success. It is also available for immediate download and adjustment. So, changes can be made in the color, design, graphics or any other component to create a unique layout.
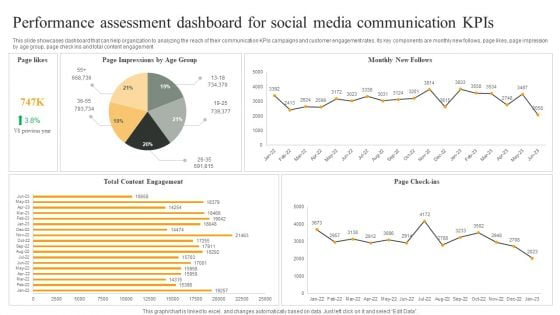
Performance Assessment Dashboard For Social Media Communication Kpis Graphics PDF
This slide showcases dashboard that can help organization to analyzing the reach of their communication KPIs campaigns and customer engagement rates. Its key components are monthly new follows, page likes, page impression by age group, page check ins and total content engagement. Pitch your topic with ease and precision using this Performance Assessment Dashboard For Social Media Communication Kpis Graphics PDF. This layout presents information on Monthly New Follows, Page Check ins, Total Content Engagement. It is also available for immediate download and adjustment. So, changes can be made in the color, design, graphics or any other component to create a unique layout.
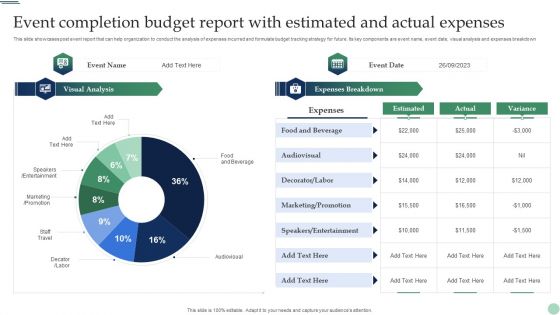
Event Completion Budget Report With Estimated And Actual Expenses Pictures PDF
This slide showcases post event report that can help organization to conduct the analysis of expenses incurred and formulate budget tracking strategy for future. Its key components are event name, event date, visual analysis and expenses breakdown. Pitch your topic with ease and precision using this Event Completion Budget Report With Estimated And Actual Expenses Pictures PDF. This layout presents information on Food And Beverage, Audiovisual, Marketing, Entertainment. It is also available for immediate download and adjustment. So, changes can be made in the color, design, graphics or any other component to create a unique layout.
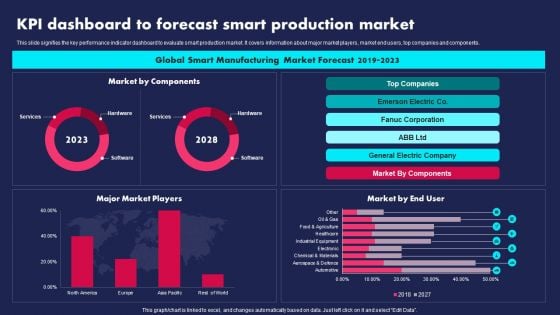
KPI Dashboard To Forecast Smart Production Market Ppt PowerPoint Presentation Gallery Visual Aids PDF
This slide signifies the key performance indicator dashboard to evaluate smart production market. It covers information about major market players, market end users, top companies and components. Pitch your topic with ease and precision using this KPI Dashboard To Forecast Smart Production Market Ppt PowerPoint Presentation Gallery Visual Aids PDF. This layout presents information on Global Smart Manufacturing, Market Forecast, 2019 To 2023. It is also available for immediate download and adjustment. So, changes can be made in the color, design, graphics or any other component to create a unique layout.
Implementation Challenges For Tracking And Assessment Framework Slides PDF
The slide displays statistical report for potential failures in effective implementation of monitoring and evaluation framework. It includes key components such as insufficient funds, employee resistance, poor communication, etc. Pitch your topic with ease and precision using this Implementation Challenges For Tracking And Assessment Framework Slides PDF. This layout presents information on Budget Allocated, Monitoring, Framework. It is also available for immediate download and adjustment. So, changes can be made in the color, design, graphics or any other component to create a unique layout.
Report On Cost Of High Restaurant Attrition Tracking With Key Insights Topics PDF
This slide depicts breakdown of cost incurred due to restaurant employees turnover. It includes components such as productivity loss, recruitment costs, selection costs, pre-departure costs, orientation and training costs, along with turnover rates, cost per churned employee, total annual cost. Pitch your topic with ease and precision using this Report On Cost Of High Restaurant Attrition Tracking With Key Insights Topics PDF. This layout presents information on Average Turnover Cost, Employee, Productivity. It is also available for immediate download and adjustment. So, changes can be made in the color, design, graphics or any other component to create a unique layout.

Cash Management Dashboard With Sales Outstanding And Liquidity Ratio Analysis Information PDF
This showcases dashboard that can help organization in cash management and track KPIs to evaluate the financial performance of company. It key components are liquidity ratios, cash balance. days sales outstanding, days inventory outstanding and days payable outstanding. Pitch your topic with ease and precision using this Cash Management Dashboard With Sales Outstanding And Liquidity Ratio Analysis Information PDF. This layout presents information on Cash Conversion, Working Capital, Cash Balance. It is also available for immediate download and adjustment. So, changes can be made in the color, design, graphics or any other component to create a unique layout.
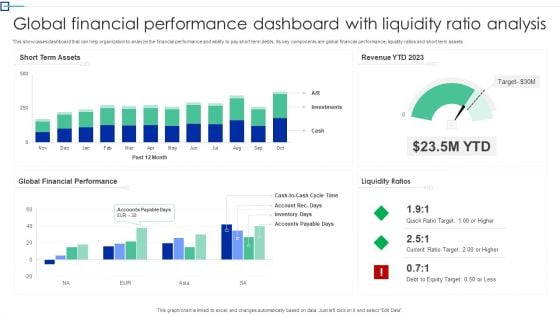
Global Financial Performance Dashboard With Liquidity Ratio Analysis Information PDF
This showcases dashboard that can help organization to analyze the financial performance and ability to pay short term debts. Its key components are global financial performance, liquidity ratios and short term assets. Pitch your topic with ease and precision using this Global Financial Performance Dashboard With Liquidity Ratio Analysis Information PDF. This layout presents information on Short Term Assets, Global Financial Performance, Liquidity Ratios. It is also available for immediate download and adjustment. So, changes can be made in the color, design, graphics or any other component to create a unique layout.
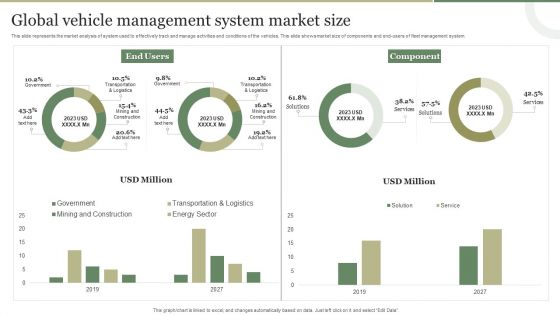
Global Vehicle Management System Market Size Guidelines PDF
This slide represents the market analysis of system used to effectively track and manage activities and conditions of the vehicles. This slide shows market size of components and end-users of fleet management system. Pitch your topic with ease and precision using this Global Vehicle Management System Market Size Guidelines PDF. This layout presents information on Global Vehicle, Management System, Market Size. It is also available for immediate download and adjustment. So, changes can be made in the color, design, graphics or any other component to create a unique layout.
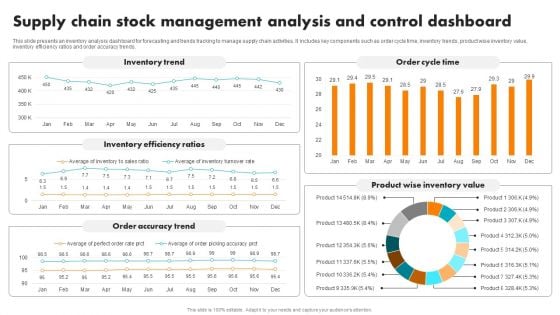
Supply Chain Stock Management Analysis And Control Dashboard Brochure PDF
This slide presents an inventory analysis dashboard for forecasting and trends tracking to manage supply chain activities. It includes key components such as order cycle time, inventory trends, product wise inventory value, inventory efficiency ratios and order accuracy trends. Pitch your topic with ease and precision using this Supply Chain Stock Management Analysis And Control Dashboard Brochure PDF. This layout presents information on Inventory Trend, Inventory Efficiency Ratios, Order Accuracy Trend, Order Cycle Time, Product Wise Inventory Value. It is also available for immediate download and adjustment. So, changes can be made in the color, design, graphics or any other component to create a unique layout.
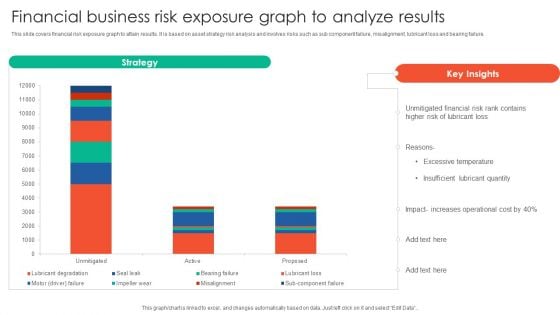
Financial Business Risk Exposure Graph To Analyze Results Elements PDF
This slide covers financial risk exposure graph to attain results. It is based on asset strategy risk analysis and involves risks such as sub component failure, misalignment, lubricant loss and bearing failure. Pitch your topic with ease and precision using this Financial Business Risk Exposure Graph To Analyze Results Elements PDF. This layout presents information on Strategy, Unmitigated Financial, Risk Rank Contains. It is also available for immediate download and adjustment. So, changes can be made in the color, design, graphics or any other component to create a unique layout.
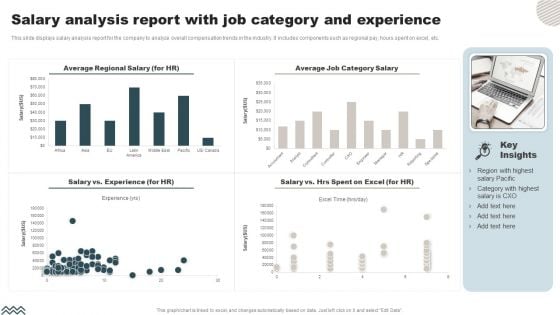
Salary Analysis Report With Job Category And Experience Microsoft PDF
This slide displays salary analysis report for the company to analyze overall compensation trends in the industry. It includes components such as regional pay, hours spent on excel, etc. Pitch your topic with ease and precision using this Salary Analysis Report With Job Category And Experience Microsoft PDF. This layout presents information on Average Regional Salary, Average Job Category Salary . It is also available for immediate download and adjustment. So, changes can be made in the color, design, graphics or any other component to create a unique layout.
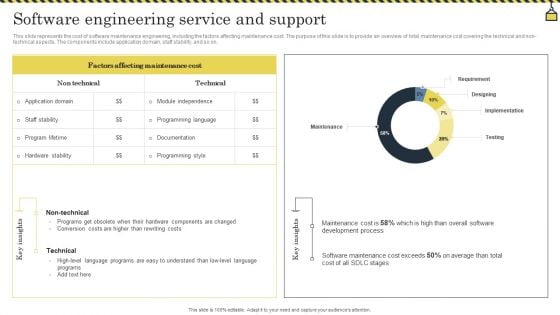
Software Engineering Service And Support Information PDF
This slide represents the cost of software maintenance engineering, including the factors affecting maintenance cost. The purpose of this slide is to provide an overview of total maintenance cost covering the technical and non technical aspects. The components include application domain, staff stability, and so on. Pitch your topic with ease and precision using this Software Engineering Service And Support Information PDF. This layout presents information on Rewriting Costs, Conversion Costs, Development Process. It is also available for immediate download and adjustment. So, changes can be made in the color, design, graphics or any other component to create a unique layout.
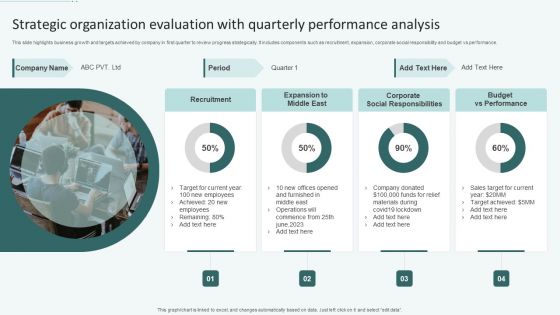
Strategic Organization Evaluation With Quarterly Performance Analysis Ppt Model Portfolio PDF
This slide highlights business growth and targets achieved by company in first quarter to review progress strategically. It includes components such as recruitment, expansion, corporate social responsibility and budget vs performance. Pitch your topic with ease and precision using this Strategic Organization Evaluation With Quarterly Performance Analysis Ppt Model Portfolio PDF. This layout presents information on Recruitment, Expansion Middle East, Corporate Social Responsibilities, Budget Vs Performance. It is also available for immediate download and adjustment. So, changes can be made in the color, design, graphics or any other component to create a unique layout.
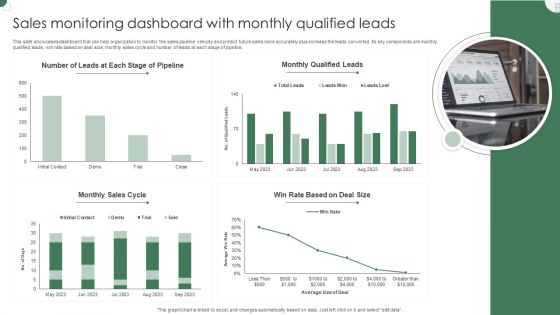
Sales Monitoring Dashboard With Monthly Qualified Leads Guidelines PDF
This slide showcases dashboard that can help organization to monitor the sales pipeline velocity and predict future sales more accurately plus increase the leads converted. Its key components are monthly qualified leads, win rate based on deal size, monthly sales cycle and number of leads at each stage of pipeline. Pitch your topic with ease and precision using this Sales Monitoring Dashboard With Monthly Qualified Leads Guidelines PDF. This layout presents information on Monthly Qualified, Monthly Sales Cycle, Deal Size. It is also available for immediate download and adjustment. So, changes can be made in the color, design, graphics or any other component to create a unique layout.
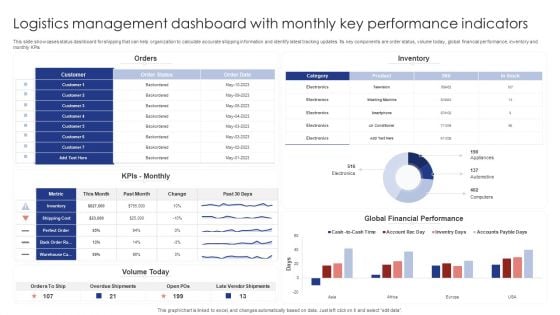
Logistics Management Dashboard With Monthly Key Performance Indicators Rules PDF
This slide showcases status dashboard for shipping that can help organization to calculate accurate shipping information and identify latest tracking updates. Its key components are order status, volume today, global financial performance, inventory and monthly KPIs. Pitch your topic with ease and precision using this Logistics Management Dashboard With Monthly Key Performance Indicators Rules PDF. This layout presents information on Orders, Inventory, Kpis Monthly. It is also available for immediate download and adjustment. So, changes can be made in the color, design, graphics or any other component to create a unique layout.
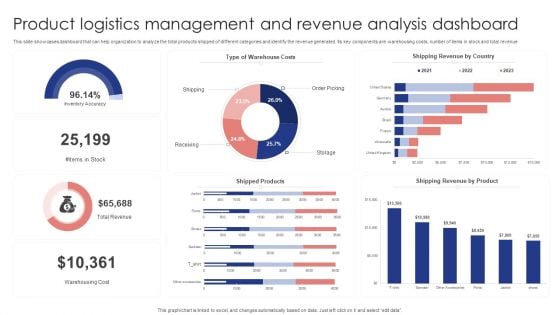
Product Logistics Management And Revenue Analysis Dashboard Demonstration PDF
This slide showcases dashboard that can help organization to analyze the total products shipped of different categories and identify the revenue generated. Its key components are warehousing costs, number of items in stock and total revenue. Pitch your topic with ease and precision using this Product Logistics Management And Revenue Analysis Dashboard Demonstration PDF. This layout presents information on Warehouse Costs, Shipping Revenue Country, Shipped Products . It is also available for immediate download and adjustment. So, changes can be made in the color, design, graphics or any other component to create a unique layout.
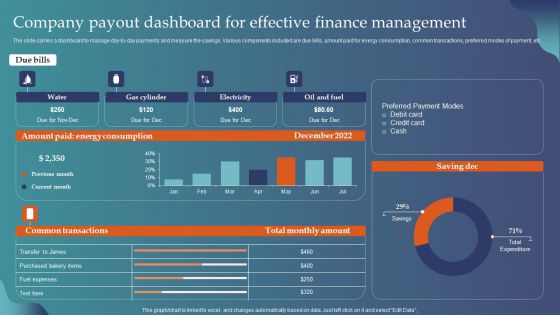
Company Payout Dashboard For Effective Finance Management Introduction PDF
The slide carries a dashboard to manage day-to-day payments and measure the savings. Various components included are due bills, amount paid for energy consumption, common transactions, preferred modes of payment, etc. Pitch your topic with ease and precision using this Company Payout Dashboard For Effective Finance Management Introduction PDF. This layout presents information on Electricity, Oil And Fuel, Gas Cylinder. It is also available for immediate download and adjustment. So, changes can be made in the color, design, graphics or any other component to create a unique layout.
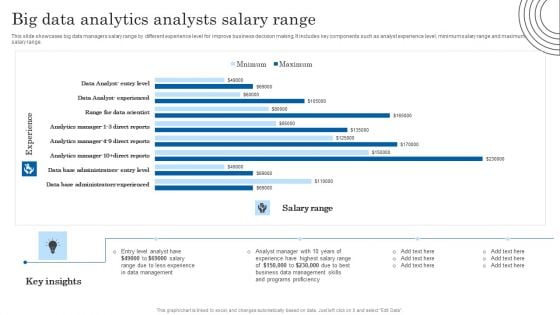
Big Data Analytics Analysts Salary Range Structure PDF
This slide showcases big data managers salary range by different experience level for improve business decision making. It includes key components such as analyst experience level, minimum salary range and maximum salary range. Pitch your topic with ease and precision using this Big Data Analytics Analysts Salary Range Structure PDF. This layout presents information on Analyst Manager, Data Management, Management Skills. It is also available for immediate download and adjustment. So, changes can be made in the color, design, graphics or any other component to create a unique layout.
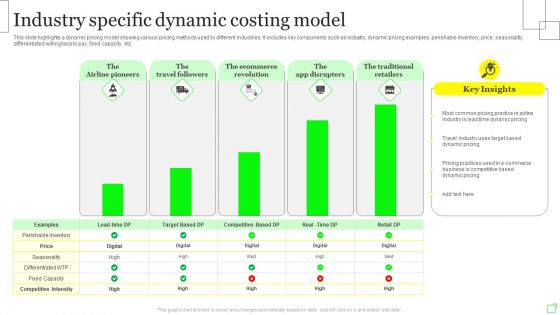
Industry Specific Dynamic Costing Model Demonstration PDF
This slide highlights a dynamic pricing model showing various pricing methods used by different industries. It includes key components such as industry, dynamic pricing examples, perishable inventory, price, seasonality, differentiated willingness to pay, fixed capacity, etc. Pitch your topic with ease and precision using this Industry Specific Dynamic Costing Model Demonstration PDF. This layout presents information on Dynamic Pricing, E Commerce, Target. It is also available for immediate download and adjustment. So, changes can be made in the color, design, graphics or any other component to create a unique layout.


 Continue with Email

 Home
Home


