Comparison Dashboard

Project Conclusion Report Open Issues Ppt PowerPoint Presentation Background Designs
This is a project conclusion report open issues ppt powerpoint presentation background designs. This is a three stage process. The stages in this process are project name, table, cost, data, management.
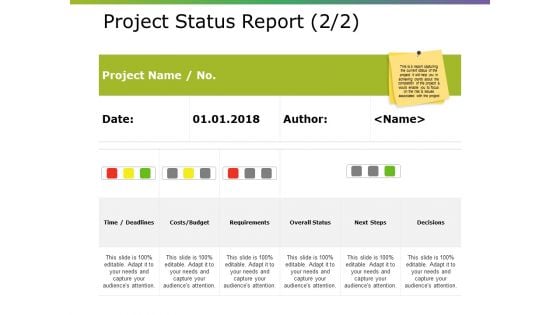
Project Status Report Template Ppt PowerPoint Presentation Layouts Background
This is a project status report template ppt powerpoint presentation layouts background. This is a four stage process. The stages in this process are project name, table, cost, data, management.
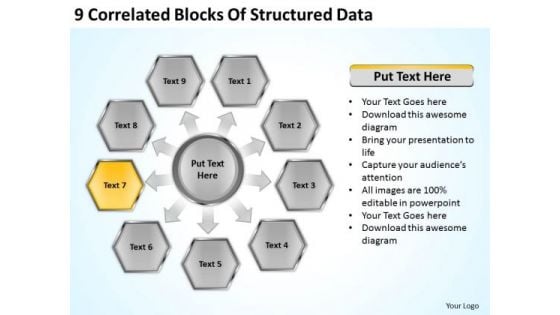
9 Correlated Blocks Of Structured Data Business Financial Planning PowerPoint Templates
We present our 9 correlated blocks of structured data business financial planning PowerPoint templates.Download our Marketing PowerPoint Templates because Our PowerPoint Templates and Slides will fulfill your every need. Use them and effectively satisfy the desires of your audience. Present our Business PowerPoint Templates because Our PowerPoint Templates and Slides team portray an attitude of elegance. Personify this quality by using them regularly. Use our Finance PowerPoint Templates because you can Break through with our PowerPoint Templates and Slides. Bring down the mental barriers of your audience. Use our Process and Flows PowerPoint Templates because Our PowerPoint Templates and Slides will effectively help you save your valuable time. They are readymade to fit into any presentation structure. Present our Arrows PowerPoint Templates because You should Kick up a storm with our PowerPoint Templates and Slides. The heads of your listeners will swirl with your ideas.Use these PowerPoint slides for presentations relating to Diagram, Chart, Business, Background, Vector, Pie, Brown, Abstract, Wheel, Options, Board, Website, Cross, Statistics, Model, Item, Document, Media, Beehives, Red, Hive, Concept, Presentation, Template, Matt, Brochure, Orange, Guide, Description, Multicolor, Marketing, Gray, Development, Title, Management, Honeycomb, Illustration, Six, Catalog, Direction, Plans, Blue, Text, Reports, Financial, Workplace, Navigation, Parts. The prominent colors used in the PowerPoint template are Yellow, Gray, Black. Illustrate the essential elements of the project. Delve into the basic nature with our 9 Correlated Blocks Of Structured Data Business Financial Planning PowerPoint Templates.
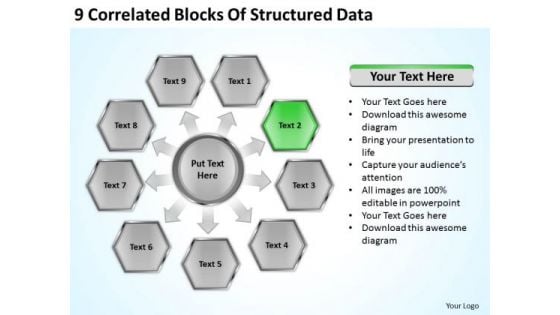
9 Correlated Blocks Of Structured Data Business Plans That Work PowerPoint Templates
We present our 9 correlated blocks of structured data business plans that work PowerPoint templates.Download and present our Marketing PowerPoint Templates because Our PowerPoint Templates and Slides will let you meet your Deadlines. Use our Business PowerPoint Templates because You can Hit the nail on the head with our PowerPoint Templates and Slides. Embed your ideas in the minds of your audience. Present our Finance PowerPoint Templates because Our PowerPoint Templates and Slides are aesthetically designed to attract attention. We gaurantee that they will grab all the eyeballs you need. Use our Process and Flows PowerPoint Templates because You can Be the puppeteer with our PowerPoint Templates and Slides as your strings. Lead your team through the steps of your script. Download and present our Arrows PowerPoint Templates because You canTake a leap off the starting blocks with our PowerPoint Templates and Slides. They will put you ahead of the competition in quick time.Use these PowerPoint slides for presentations relating to Diagram, Chart, Business, Background, Vector, Pie, Brown, Abstract, Wheel, Options, Board, Website, Cross, Statistics, Model, Item, Document, Media, Beehives, Red, Hive, Concept, Presentation, Template, Matt, Brochure, Orange, Guide, Description, Multicolor, Marketing, Gray, Development, Title, Management, Honeycomb, Illustration, Six, Catalog, Direction, Plans, Blue, Text, Reports, Financial, Workplace, Navigation, Parts. The prominent colors used in the PowerPoint template are Green, Gray, Black. Our 9 Correlated Blocks Of Structured Data Business Plans That Work PowerPoint Templates have a feel for it. They automatically create an ambience.
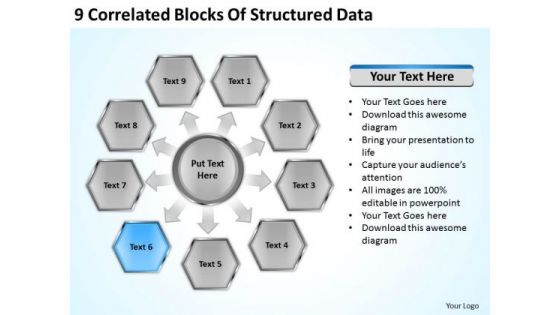
9 Correlated Blocks Of Structured Data Download Business Plans PowerPoint Templates
We present our 9 correlated blocks of structured data download business plans PowerPoint templates.Download our Marketing PowerPoint Templates because Our PowerPoint Templates and Slides are conceived by a dedicated team. Use them and give form to your wondrous ideas. Download our Business PowerPoint Templates because It can Bubble and burst with your ideas. Present our Finance PowerPoint Templates because Our PowerPoint Templates and Slides will let you Hit the right notes. Watch your audience start singing to your tune. Present our Process and Flows PowerPoint Templates because Our PowerPoint Templates and Slides will give good value for money. They also have respect for the value of your time. Download our Arrows PowerPoint Templates because It will let you Set new benchmarks with our PowerPoint Templates and Slides. They will keep your prospects well above par.Use these PowerPoint slides for presentations relating to Diagram, Chart, Business, Background, Vector, Pie, Brown, Abstract, Wheel, Options, Board, Website, Cross, Statistics, Model, Item, Document, Media, Beehives, Red, Hive, Concept, Presentation, Template, Matt, Brochure, Orange, Guide, Description, Multicolor, Marketing, Gray, Development, Title, Management, Honeycomb, Illustration, Six, Catalog, Direction, Plans, Blue, Text, Reports, Financial, Workplace, Navigation, Parts. The prominent colors used in the PowerPoint template are Blue, Gray, Black. Decrease wastage with our 9 Correlated Blocks Of Structured Data Download Business Plans PowerPoint Templates. Download without worries with our money back guaranteee.
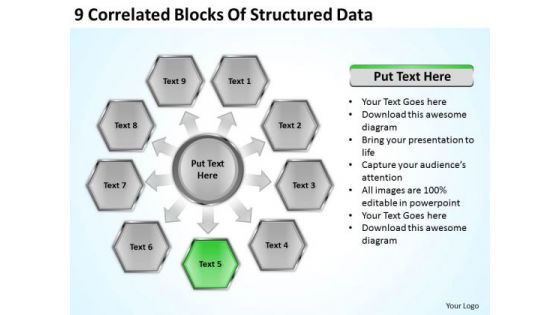
9 Correlated Blocks Of Structured Data How To Present Business Plan PowerPoint Slides
We present our 9 correlated blocks of structured data how to present business plan PowerPoint Slides.Download our Marketing PowerPoint Templates because Our PowerPoint Templates and Slides are focused like a searchlight beam. They highlight your ideas for your target audience. Use our Business PowerPoint Templates because You can Stir your ideas in the cauldron of our PowerPoint Templates and Slides. Cast a magic spell on your audience. Use our Finance PowerPoint Templates because You can Rise to the occasion with our PowerPoint Templates and Slides. You will bring your audience on their feet in no time. Present our Process and Flows PowerPoint Templates because Our PowerPoint Templates and Slides are innately eco-friendly. Their high recall value negate the need for paper handouts. Use our Arrows PowerPoint Templates because our PowerPoint Templates and Slides will give your ideas the shape.Use these PowerPoint slides for presentations relating to Diagram, Chart, Business, Background, Vector, Pie, Brown, Abstract, Wheel, Options, Board, Website, Cross, Statistics, Model, Item, Document, Media, Beehives, Red, Hive, Concept, Presentation, Template, Matt, Brochure, Orange, Guide, Description, Multicolor, Marketing, Gray, Development, Title, Management, Honeycomb, Illustration, Six, Catalog, Direction, Plans, Blue, Text, Reports, Financial, Workplace, Navigation, Parts. The prominent colors used in the PowerPoint template are Green, Gray, Black. Begin with a bang with our 9 Correlated Blocks Of Structured Data How To Present Business Plan PowerPoint Slides. Explode off the blocks with your thoughts.
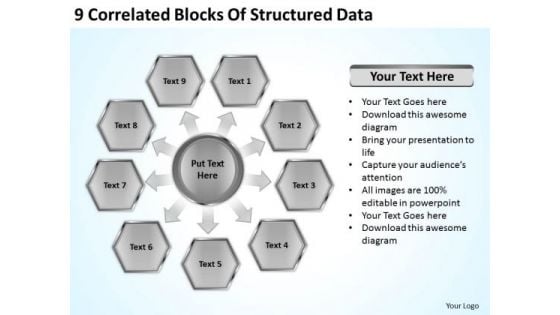
9 Correlated Blocks Of Structured Data Outline Business Plan PowerPoint Slides
We present our 9 correlated blocks of structured data outline business plan PowerPoint Slides.Download and present our Marketing PowerPoint Templates because Our PowerPoint Templates and Slides are conceived by a dedicated team. Use them and give form to your wondrous ideas. Download our Business PowerPoint Templates because Our PowerPoint Templates and Slides will provide weight to your words. They will bring out the depth of your thought process. Download our Finance PowerPoint Templates because Our PowerPoint Templates and Slides are Clear and concise. Use them and dispel any doubts your team may have. Present our Process and Flows PowerPoint Templates because It will mark the footprints of your journey. Illustrate how they will lead you to your desired destination. Download and present our Arrows PowerPoint Templates because Our PowerPoint Templates and Slides will fulfill your every need. Use them and effectively satisfy the desires of your audience.Use these PowerPoint slides for presentations relating to Diagram, Chart, Business, Background, Vector, Pie, Brown, Abstract, Wheel, Options, Board, Website, Cross, Statistics, Model, Item, Document, Media, Beehives, Red, Hive, Concept, Presentation, Template, Matt, Brochure, Orange, Guide, Description, Multicolor, Marketing, Gray, Development, Title, Management, Honeycomb, Illustration, Six, Catalog, Direction, Plans, Blue, Text, Reports, Financial, Workplace, Navigation, Parts. The prominent colors used in the PowerPoint template are White, Gray, Black. Our 9 Correlated Blocks Of Structured Data Outline Business Plan PowerPoint Slides have amazing characteristics. They educate and entertain on your command.
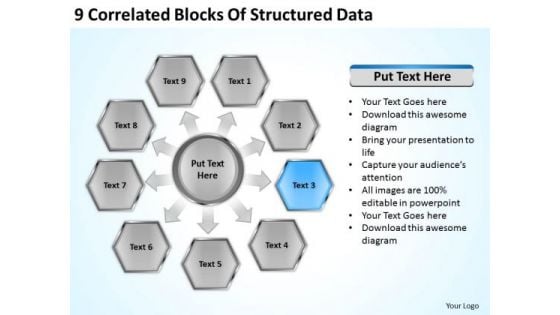
9 Correlated Blocks Of Structured Data Ppt Business Plan PowerPoint Slides
We present our 9 correlated blocks of structured data ppt business plan PowerPoint Slides.Download our Marketing PowerPoint Templates because You aspire to touch the sky with glory. Let our PowerPoint Templates and Slides provide the fuel for your ascent. Download our Business PowerPoint Templates because our PowerPoint Templates and Slides will give your ideas the shape. Download our Finance PowerPoint Templates because Our PowerPoint Templates and Slides offer you the widest possible range of options. Present our Process and Flows PowerPoint Templates because our PowerPoint Templates and Slides will give your ideas the shape. Download our Arrows PowerPoint Templates because you can Break through with our PowerPoint Templates and Slides. Bring down the mental barriers of your audience.Use these PowerPoint slides for presentations relating to Diagram, Chart, Business, Background, Vector, Pie, Brown, Abstract, Wheel, Options, Board, Website, Cross, Statistics, Model, Item, Document, Media, Beehives, Red, Hive, Concept, Presentation, Template, Matt, Brochure, Orange, Guide, Description, Multicolor, Marketing, Gray, Development, Title, Management, Honeycomb, Illustration, Six, Catalog, Direction, Plans, Blue, Text, Reports, Financial, Workplace, Navigation, Parts. The prominent colors used in the PowerPoint template are Blue, Gray, Black. Get rid of the fat with our 9 Correlated Blocks Of Structured Data Ppt Business Plan PowerPoint Slides. Get to the meat with your thoughts.
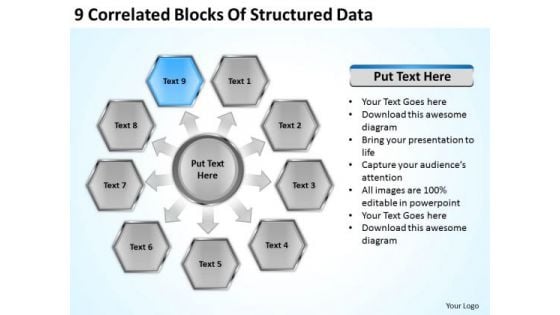
9 Correlated Blocks Of Structured Data Ppt Business Plan PowerPoint Templates
We present our 9 correlated blocks of structured data ppt business plan PowerPoint templates.Use our Marketing PowerPoint Templates because Our PowerPoint Templates and Slides provide you with a vast range of viable options. Select the appropriate ones and just fill in your text. Download our Business PowerPoint Templates because It is Aesthetically crafted by artistic young minds. Our PowerPoint Templates and Slides are designed to display your dexterity. Download and present our Finance PowerPoint Templates because Our PowerPoint Templates and Slides will definately Enhance the stature of your presentation. Adorn the beauty of your thoughts with their colourful backgrounds. Present our Process and Flows PowerPoint Templates because Our PowerPoint Templates and Slides come in all colours, shades and hues. They help highlight every nuance of your views. Download and present our Arrows PowerPoint Templates because Our PowerPoint Templates and Slides will effectively help you save your valuable time. They are readymade to fit into any presentation structure. Use these PowerPoint slides for presentations relating to Diagram, Chart, Business, Background, Vector, Pie, Brown, Abstract, Wheel, Options, Board, Website, Cross, Statistics, Model, Item, Document, Media, Beehives, Red, Hive, Concept, Presentation, Template, Matt, Brochure, Orange, Guide, Description, Multicolor, Marketing, Gray, Development, Title, Management, Honeycomb, Illustration, Six, Catalog, Direction, Plans, Blue, Text, Reports, Financial, Workplace, Navigation, Parts. The prominent colors used in the PowerPoint template are Blue, Gray, Black. Our 9 Correlated Blocks Of Structured Data Ppt Business Plan PowerPoint Templates stay away from farce. They treat every event correctly.
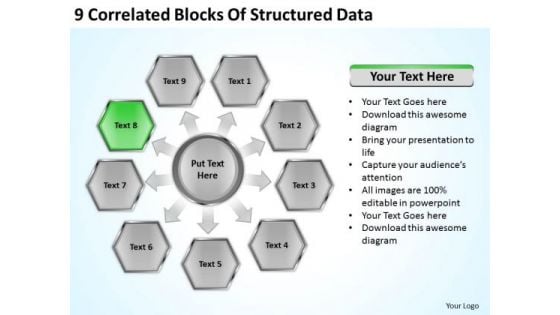
9 Correlated Blocks Of Structured Data Ppt Hotel Business Plan Example PowerPoint Slides
We present our 9 correlated blocks of structured data ppt hotel business plan example PowerPoint Slides.Present our Marketing PowerPoint Templates because Your ideas provide food for thought. Our PowerPoint Templates and Slides will help you create a dish to tickle the most discerning palate. Download our Business PowerPoint Templates because You can Stir your ideas in the cauldron of our PowerPoint Templates and Slides. Cast a magic spell on your audience. Present our Finance PowerPoint Templates because You can Create a matrix with our PowerPoint Templates and Slides. Feel the strength of your ideas click into place. Use our Process and Flows PowerPoint Templates because It can be used to Set your controls for the heart of the sun. Our PowerPoint Templates and Slides will be the propellant to get you there. Present our Arrows PowerPoint Templates because You canTake a leap off the starting blocks with our PowerPoint Templates and Slides. They will put you ahead of the competition in quick time.Use these PowerPoint slides for presentations relating to Diagram, Chart, Business, Background, Vector, Pie, Brown, Abstract, Wheel, Options, Board, Website, Cross, Statistics, Model, Item, Document, Media, Beehives, Red, Hive, Concept, Presentation, Template, Matt, Brochure, Orange, Guide, Description, Multicolor, Marketing, Gray, Development, Title, Management, Honeycomb, Illustration, Six, Catalog, Direction, Plans, Blue, Text, Reports, Financial, Workplace, Navigation, Parts. The prominent colors used in the PowerPoint template are Green, Gray, Black. Burst through the ceiling with our 9 Correlated Blocks Of Structured Data Ppt Hotel Business Plan Example PowerPoint Slides. Rise strongly above created barriers.
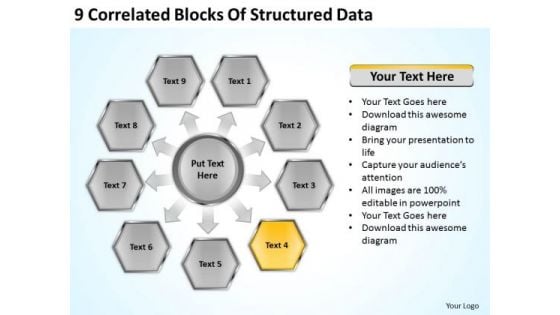
9 Correlated Blocks Of Structured Data Ppt Sales Business Plan Outline PowerPoint Templates
We present our 9 correlated blocks of structured data ppt sales business plan outline PowerPoint templates.Download our Marketing PowerPoint Templates because Our PowerPoint Templates and Slides will let you meet your Deadlines. Download and present our Business PowerPoint Templates because You can Hit the nail on the head with our PowerPoint Templates and Slides. Embed your ideas in the minds of your audience. Download and present our Finance PowerPoint Templates because Our PowerPoint Templates and Slides are a sure bet. Gauranteed to win against all odds. Download and present our Process and Flows PowerPoint Templates because Our PowerPoint Templates and Slides will bullet point your ideas. See them fall into place one by one. Use our Arrows PowerPoint Templates because Our PowerPoint Templates and Slides will let your ideas bloom. Create a bed of roses for your audience.Use these PowerPoint slides for presentations relating to Diagram, Chart, Business, Background, Vector, Pie, Brown, Abstract, Wheel, Options, Board, Website, Cross, Statistics, Model, Item, Document, Media, Beehives, Red, Hive, Concept, Presentation, Template, Matt, Brochure, Orange, Guide, Description, Multicolor, Marketing, Gray, Development, Title, Management, Honeycomb, Illustration, Six, Catalog, Direction, Plans, Blue, Text, Reports, Financial, Workplace, Navigation, Parts. The prominent colors used in the PowerPoint template are Yellow, Gray, Black. Color your presentation with success with our 9 Correlated Blocks Of Structured Data Ppt Sales Business Plan Outline PowerPoint Templates. You will come out on top.
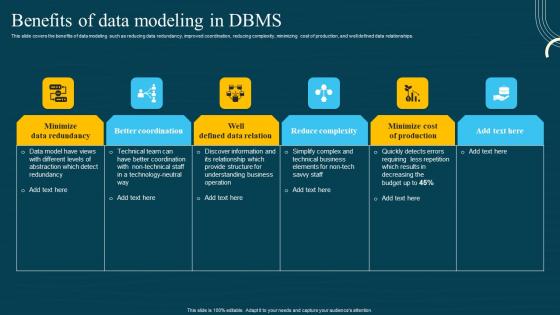
Database Modeling Structures Benefits Of Data Modeling In DBMS Mockup PDF
This slide covers the benefits of data modeling such as reducing data redundancy, improved coordination, reducing complexity, minimizing cost of production, and well defined data relationships. Find highly impressive Database Modeling Structures Benefits Of Data Modeling In DBMS Mockup PDF on Slidegeeks to deliver a meaningful presentation. You can save an ample amount of time using these presentation templates. No need to worry to prepare everything from scratch because Slidegeeks experts have already done a huge research and work for you. You need to download Database Modeling Structures Benefits Of Data Modeling In DBMS Mockup PDF for your upcoming presentation. All the presentation templates are 100 percent editable and you can change the color and personalize the content accordingly. Download now This slide covers the benefits of data modeling such as reducing data redundancy, improved coordination, reducing complexity, minimizing cost of production, and well defined data relationships.
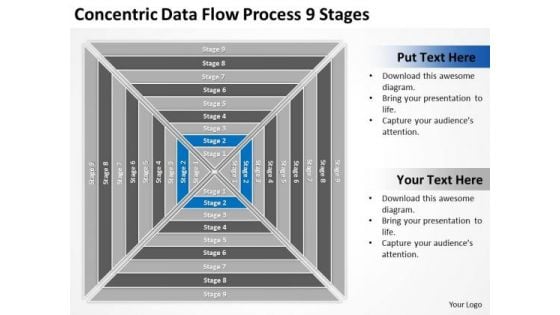
Concentric Data Flow Process 9 Stages Business Plan PowerPoint Templates
We present our concentric data flow process 9 stages business plan PowerPoint templates.Download and present our Process and Flows PowerPoint Templates because Our PowerPoint Templates and Slides will let Your superior ideas hit the target always and everytime. Download our Flow Charts PowerPoint Templates because You can safely bank on our PowerPoint Templates and Slides. They will provide a growth factor to your valuable thoughts. Download and present our Success PowerPoint Templates because It will get your audience in sync. Download and present our Marketing PowerPoint Templates because Our PowerPoint Templates and Slides will provide the perfect balance. Your weighty ideas will get the ideal impetus. Download our Business PowerPoint Templates because Your success is our commitment. Our PowerPoint Templates and Slides will ensure you reach your goal.Use these PowerPoint slides for presentations relating to Flow, network, platform, diagram, connection, connect, business, flowchart, function, organization, coordinates, molecular, square, plan, interrelations, scheme, graphic, technology, graph, molecule, arrangement, comparison, scientific, variable, project, relationships, lines,attached, segments, interconnected, solution, organize, device, analyze, draft, pattern, construction, structure, nine, steps. The prominent colors used in the PowerPoint template are Blue, White, Gray. Holster your thoughts in our Concentric Data Flow Process 9 Stages Business Plan PowerPoint Templates. You'll be faster on the draw.
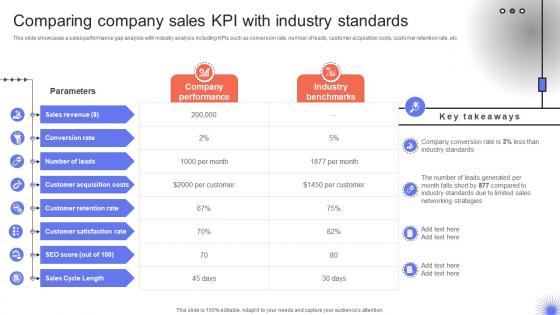
Trade Event Tactics To Boost Comparing Company Sales KPI With Industry Standards SA SS V
This slide showcases a sales performance gap analysis with industry analysis including KPIs such as conversion rate, number of leads, customer acquisition costs, customer retention rate, etc. From laying roadmaps to briefing everything in detail, our templates are perfect for you. You can set the stage with your presentation slides. All you have to do is download these easy-to-edit and customizable templates. Trade Event Tactics To Boost Comparing Company Sales KPI With Industry Standards SA SS V will help you deliver an outstanding performance that everyone would remember and praise you for. Do download this presentation today. This slide showcases a sales performance gap analysis with industry analysis including KPIs such as conversion rate, number of leads, customer acquisition costs, customer retention rate, etc.
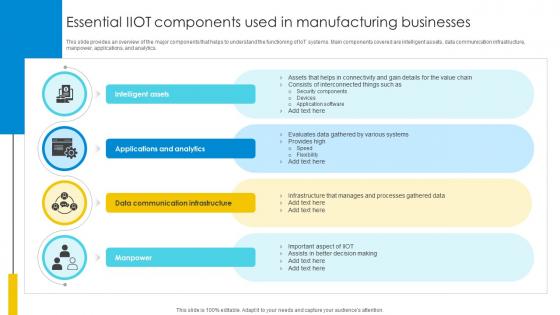
Essential IIoT Components Used In Manufacturing Businesses Optimizing Inventory Management IoT SS V
This slide provides an overview of the major components that helps to understand the functioning of IoT systems. Main components covered are intelligent assets, data communication infrastructure, manpower, applications, and analytics. Retrieve professionally designed Essential IIoT Components Used In Manufacturing Businesses Optimizing Inventory Management IoT SS V to effectively convey your message and captivate your listeners. Save time by selecting pre-made slideshows that are appropriate for various topics, from business to educational purposes. These themes come in many different styles, from creative to corporate, and all of them are easily adjustable and can be edited quickly. Access them as PowerPoint templates or as Google Slides themes. You do not have to go on a hunt for the perfect presentation because Slidegeeks got you covered from everywhere. This slide provides an overview of the major components that helps to understand the functioning of IoT systems. Main components covered are intelligent assets, data communication infrastructure, manpower, applications, and analytics.
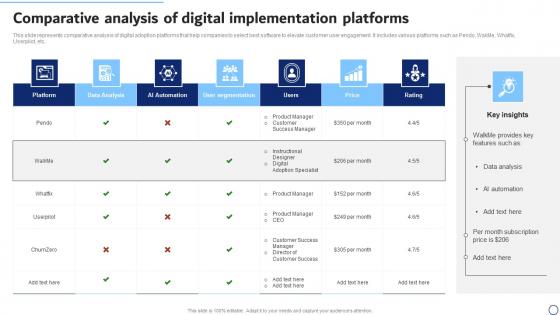
Comparative Analysis Of Digital Implementation Platforms Professional Pdf
This slide represents comparative analysis of digital adoption platforms that help companies to select best software to elevate customer user engagement. It includes various platforms such as Pendo, WakMe, Whatfix, Userpilot, etc. Showcasing this set of slides titled Comparative Analysis Of Digital Implementation Platforms Professional Pdf. The topics addressed in these templates are Platform, Data Analysis, User Segmentation. All the content presented in this PPT design is completely editable. Download it and make adjustments in color, background, font etc. as per your unique business setting. This slide represents comparative analysis of digital adoption platforms that help companies to select best software to elevate customer user engagement. It includes various platforms such as Pendo, WakMe, Whatfix, Userpilot, etc.
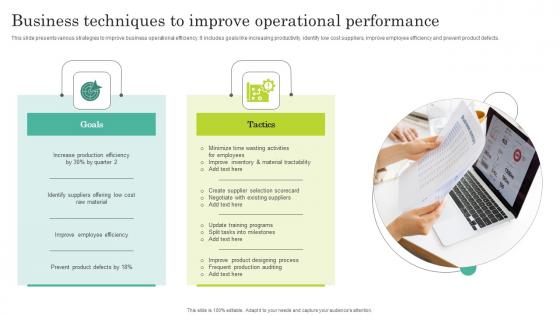
Business Techniques To Improve Operational Performance Infographics Pdf
This slide presents various strategies to improve business operational efficiency. It includes goals like increasing productivity, identify low cost suppliers, improve employee efficiency and prevent product defects. Pitch your topic with ease and precision using this Business Techniques To Improve Operational Performance Infographics Pdf. This layout presents information on Goals, Tactics, Minimize Time Wasting Activities. It is also available for immediate download and adjustment. So, changes can be made in the color, design, graphics or any other component to create a unique layout. This slide presents various strategies to improve business operational efficiency. It includes goals like increasing productivity, identify low cost suppliers, improve employee efficiency and prevent product defects.
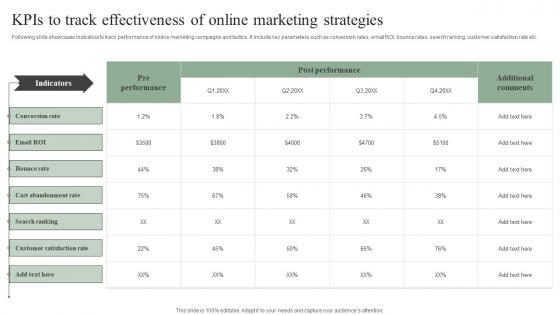
Kpis To Track Effectiveness Of Online Marketing Efficient Marketing Tactics Inspiration Pdf
Following slide showcases indicators to track performance of online marketing campaigns and tactics. It include key parameters such as conversion rates, email ROI, bounce rates, search ranking, customer satisfaction rate etc. The Kpis To Track Effectiveness Of Online Marketing Efficient Marketing Tactics Inspiration Pdf is a compilation of the most recent design trends as a series of slides. It is suitable for any subject or industry presentation, containing attractive visuals and photo spots for businesses to clearly express their messages. This template contains a variety of slides for the user to input data, such as structures to contrast two elements, bullet points, and slides for written information. Slidegeeks is prepared to create an impression. Following slide showcases indicators to track performance of online marketing campaigns and tactics. It include key parameters such as conversion rates, email ROI, bounce rates, search ranking, customer satisfaction rate etc.
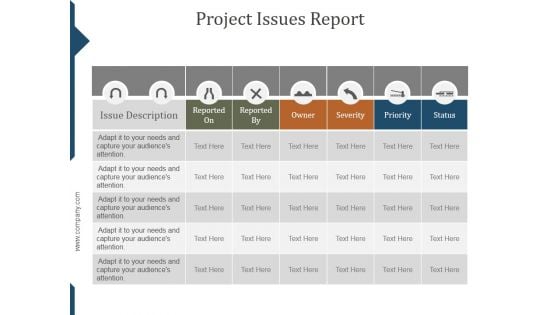
Project Issues Report Ppt PowerPoint Presentation Slide Download
This is a project issues report ppt powerpoint presentation slide download. This is a six stage process. The stages in this process are issue description, reported on, reported by, owner, severity, priority, status.
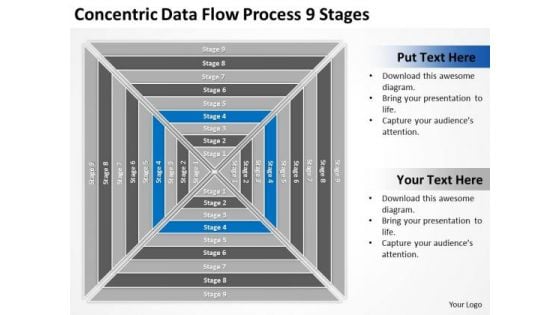
Concentric Data Flow Process 9 Stages Business Plans PowerPoint Slides
We present our concentric data flow process 9 stages business plans PowerPoint Slides.Use our Process and Flows PowerPoint Templates because Our PowerPoint Templates and Slides will provide the perfect balance. Your weighty ideas will get the ideal impetus. Use our Marketing PowerPoint Templates because Our PowerPoint Templates and Slides will provide you a launch platform. Give a lift off to your ideas and send them into orbit. Download and present our Flow Charts PowerPoint Templates because You will get more than you ever bargained for. Download and present our Shapes PowerPoint Templates because You will get more than you ever bargained for. Present our Success PowerPoint Templates because Our PowerPoint Templates and Slides come in all colours, shades and hues. They help highlight every nuance of your views.Use these PowerPoint slides for presentations relating to Flow, network, platform, diagram, connection, connect, business, flowchart, function, organization, coordinates, molecular, square, plan, interrelations, scheme, graphic, technology, graph, molecule, arrangement, comparison, scientific, variable, project, relationships, lines,attached, segments, interconnected, solution, organize, device, analyze, draft, pattern, construction, structure, nine, steps. The prominent colors used in the PowerPoint template are Blue, White, Gray. Join an elite group of presenters with our Concentric Data Flow Process 9 Stages Business Plans PowerPoint Slides. Make sure your presentation gets the attention it deserves.
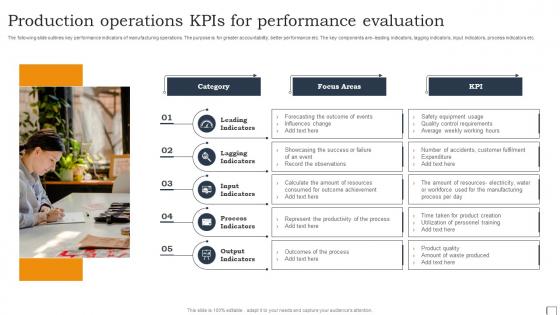
Production Operations KPIs For Performance Evaluation Structure Pdf
The following slide outlines key performance indicators of manufacturing operations. The purpose is for greater accountability, better performance etc. The key components are- leading indicators, lagging indicators, input indicators, process indicators etc. Pitch your topic with ease and precision using this Production Operations KPIs For Performance Evaluation Structure Pdf. This layout presents information on Leading Indicators, Lagging Indicators, Input Indicators. It is also available for immediate download and adjustment. So, changes can be made in the color, design, graphics or any other component to create a unique layout. The following slide outlines key performance indicators of manufacturing operations. The purpose is for greater accountability, better performance etc. The key components are- leading indicators, lagging indicators, input indicators, process indicators etc.
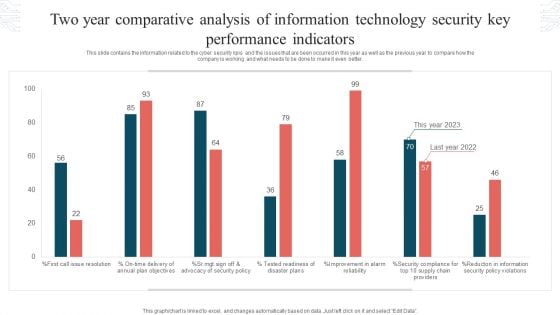
Two Year Comparative Analysis Of Information Technology Security Key Performance Indicators Graphics PDF
This slide contains the information related to the cyber security kpis and the issues that are been occurred in this year as well as the previous year to compare how the company is working and what needs to be done to make it even better. Showcasing this set of slides titled Two Year Comparative Analysis Of Information Technology Security Key Performance Indicators Graphics PDF. The topics addressed in these templates are Tested Readiness, Disaster Plans, Security Policy Violations. All the content presented in this PPT design is completely editable. Download it and make adjustments in color, background, font etc. as per your unique business setting.
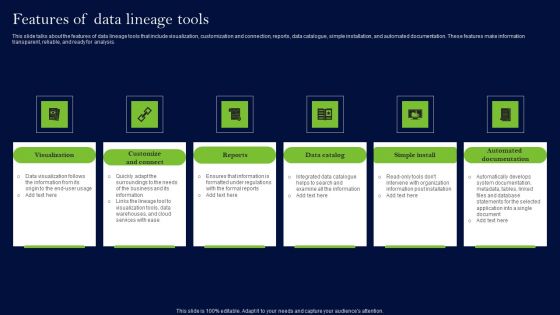
Data Lineage Methods Features Of Data Lineage Tools Sample PDF
This slide talks about the features of data lineage tools that include visualization, customization and connection, reports, data catalogue, simple installation, and automated documentation. These features make information transparent, reliable, and ready for analysis. Slidegeeks is here to make your presentations a breeze with Data Lineage Methods Features Of Data Lineage Tools Sample PDF With our easy-to-use and customizable templates, you can focus on delivering your ideas rather than worrying about formatting. With a variety of designs to choose from, you are sure to find one that suits your needs. And with animations and unique photos, illustrations, and fonts, you can make your presentation pop. So whether you are giving a sales pitch or presenting to the board, make sure to check out Slidegeeks first
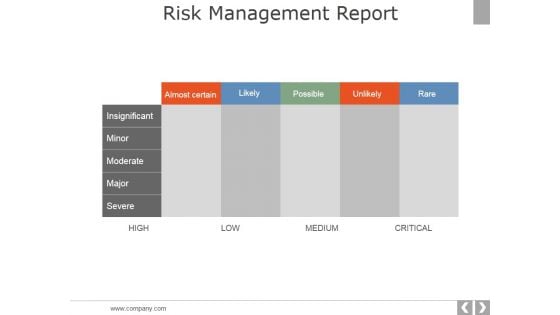
Risk Management Report Template 2 Ppt PowerPoint Presentation Infographics Brochure
This is a risk management report template 2 ppt powerpoint presentation infographics brochure. This is a five stage process. The stages in this process are insignificant, minor, moderate, major, severe.
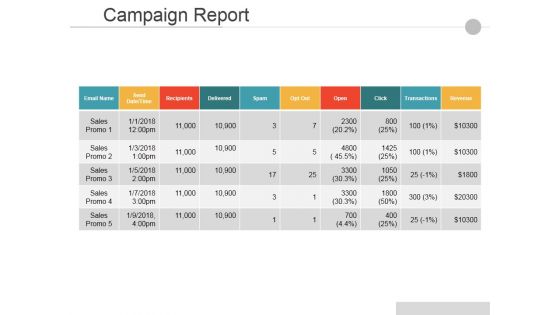
Campaign Report Ppt PowerPoint Presentation Show Graphic Tips
This is a campaign report ppt powerpoint presentation show graphic tips. This is a ten stage process. The stages in this process are email name, send date time, recipients, delivered, spam.
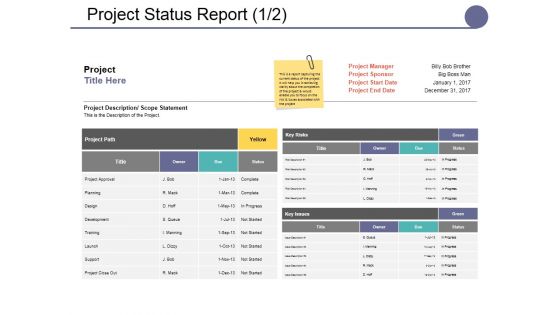
Project Status Report Ppt PowerPoint Presentation Slides Format Ideas
This is a project status report ppt powerpoint presentation slides format ideas. This is a six stage process. The stages in this process are deadlines, budget, requirements, overall status, next steps.
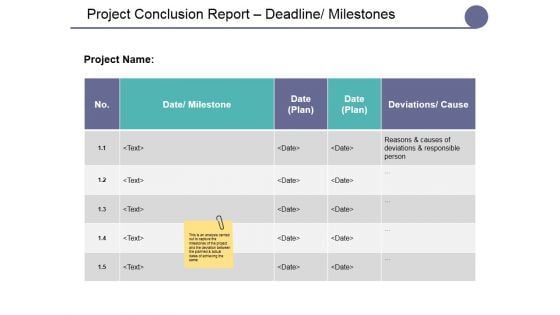
Project Conclusion Report Deadline Milestones Ppt PowerPoint Presentation Outline Guidelines
This is a project conclusion report deadline milestones ppt powerpoint presentation outline guidelines. This is a four stage process. The stages in this process are staff costs, material, travel expenses, advertising expenses, hardware.
Project Conclusion Report Budget Costs Ppt PowerPoint Presentation Icon Graphics
This is a project conclusion report budget costs ppt powerpoint presentation icon graphics. This is a four stage process. The stages in this process are type of cost, planned costs, actual costs, equipment.
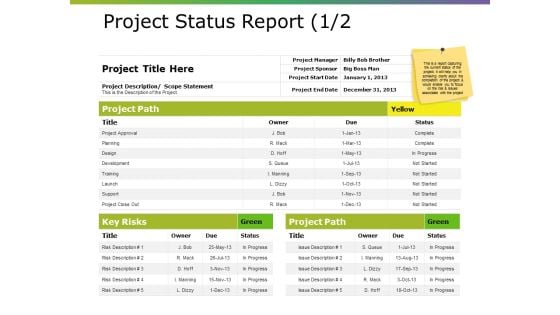
Project Status Report Ppt PowerPoint Presentation Portfolio Structure
This is a project status report ppt powerpoint presentation portfolio structure. This is a three stage process. The stages in this process are project path, key risks, project approval, planning, design.

Project Conclusion Report Deadline Milestones Ppt PowerPoint Presentation File Examples
This is a project conclusion report deadline milestones ppt powerpoint presentation file examples. This is a four stage process. The stages in this process are date, milestone, deviations, cause.
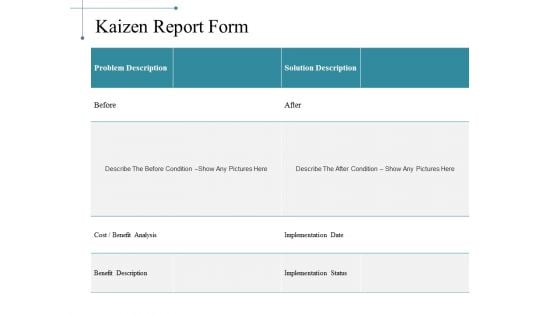
Kaizen Report Form Ppt PowerPoint Presentation Styles Samples
This is a kaizen report form ppt powerpoint presentation styles samples. This is a four stage process. The stages in this process are problem description, solution description, before, after, implementation date.
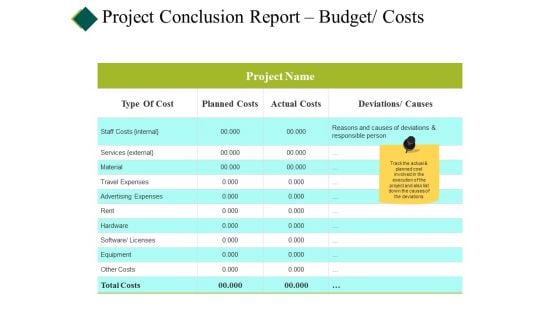
Project Conclusion Report Budget Costs Ppt PowerPoint Presentation Show Picture
This is a project conclusion report budget costs ppt powerpoint presentation show picture. This is a four stage process. The stages in this process are type of cost, planned costs, actual costs, deviations.

Key Components Market Intelligence Marketing Intelligence Guide Data Gathering Pictures Pdf
This slide showcases various components of market intelligence which are competitor intelligence, customer understanding, market understanding and product intelligence. Its purpose is to formulate customer centric strategies, boost upselling opportunities, capture higher market shares and gain competitive advantage. This modern and well arranged Key Components Market Intelligence Marketing Intelligence Guide Data Gathering Pictures Pdf provides lots of creative possibilities. It is very simple to customize and edit with the Powerpoint Software. Just drag and drop your pictures into the shapes. All facets of this template can be edited with Powerpoint, no extra software is necessary. Add your own material, put your images in the places assigned for them, adjust the colors, and then you can show your slides to the world, with an animated slide included. This slide showcases various components of market intelligence which are competitor intelligence, customer understanding, market understanding and product intelligence. Its purpose is to formulate customer centric strategies, boost upselling opportunities, capture higher market shares and gain competitive advantage.
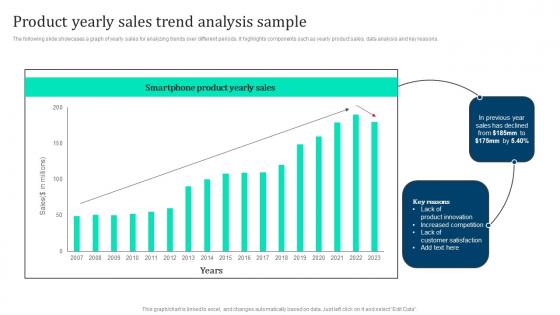
Product Yearly Sales Trend Analysis Marketing Intelligence Guide Data Gathering Introduction Pdf
The following slide showcases a graph of yearly sales for analyzing trends over different periods. It highlights components such as yearly product sales, data analysis and key reasons. Create an editable Product Yearly Sales Trend Analysis Marketing Intelligence Guide Data Gathering Introduction Pdf that communicates your idea and engages your audience. Whether you are presenting a business or an educational presentation, pre designed presentation templates help save time. Product Yearly Sales Trend Analysis Marketing Intelligence Guide Data Gathering Introduction Pdf is highly customizable and very easy to edit, covering many different styles from creative to business presentations. Slidegeeks has creative team members who have crafted amazing templates. So, go and get them without any delay. The following slide showcases a graph of yearly sales for analyzing trends over different periods. It highlights components such as yearly product sales, data analysis and key reasons.
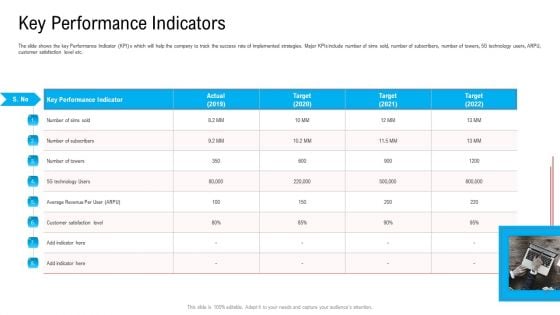
Key Performance Indicators Ppt Infographics Mockup PDF
The slide shows the key Performance Indicator KPI s which will help the company to track the success rate of implemented strategies. Major KPIs include number of sims sold, number of subscribers, number of towers, 5G technology users, ARPU, customer satisfaction level etc. This is a key performance indicators ppt infographics mockup pdf template with various stages. Focus and dispense information on one stage using this creative set, that comes with editable features. It contains large content boxes to add your information on topics like key performance indicator, technology, customer satisfaction level, target, 2019 to 2022. You can also showcase facts, figures, and other relevant content using this PPT layout. Grab it now.
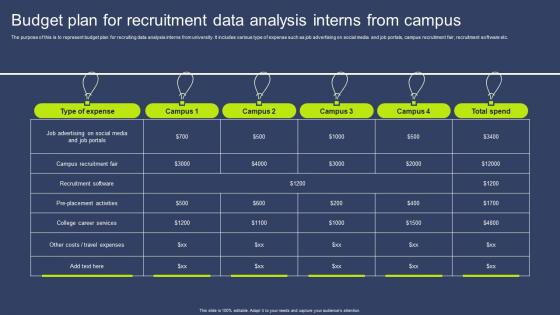
Budget Plan For Recruitment Data Analysis Interns From Campus Mockup Pdf
The purpose of this is to represent budget plan for recruiting data analysis interns from university. It includes various type of expense such as job advertising on social media and job portals, campus recruitment fair, recruitment software etc. Pitch your topic with ease and precision using this Budget Plan For Recruitment Data Analysis Interns From Campus Mockup Pdf. This layout presents information on Type Expense, Campus Recruitment Fair, Recruitment Software. It is also available for immediate download and adjustment. So, changes can be made in the color, design, graphics or any other component to create a unique layout. The purpose of this is to represent budget plan for recruiting data analysis interns from university. It includes various type of expense such as job advertising on social media and job portals, campus recruitment fair, recruitment software etc.
Determining Least Effective Website Feature Driving Business Success Integrating Product
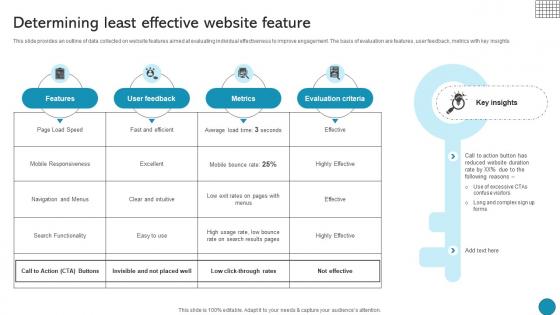
This slide provides an outline of data collected on website features aimed at evaluating individual effectiveness to improve engagement. The basis of evaluation are features, user feedback, metrics with key insights Make sure to capture your audiences attention in your business displays with our gratis customizable Determining Least Effective Website Feature Driving Business Success Integrating Product. These are great for business strategies, office conferences, capital raising or task suggestions. If you desire to acquire more customers for your tech business and ensure they stay satisfied, create your own sales presentation with these plain slides. This slide provides an outline of data collected on website features aimed at evaluating individual effectiveness to improve engagement. The basis of evaluation are features, user feedback, metrics with key insights
Data Evaluation Sample With Conjoint Marketing Intelligence Guide Data Gathering Sample Pdf
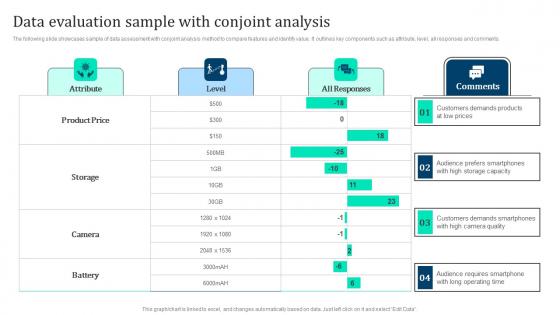
The following slide showcases sample of data assessment with conjoint analysis method to compare features and identify value. It outlines key components such as attribute, level, all responses and comments. Slidegeeks is here to make your presentations a breeze with Data Evaluation Sample With Conjoint Marketing Intelligence Guide Data Gathering Sample Pdf With our easy to use and customizable templates, you can focus on delivering your ideas rather than worrying about formatting. With a variety of designs to choose from, you are sure to find one that suits your needs. And with animations and unique photos, illustrations, and fonts, you can make your presentation pop. So whether you are giving a sales pitch or presenting to the board, make sure to check out Slidegeeks first The following slide showcases sample of data assessment with conjoint analysis method to compare features and identify value. It outlines key components such as attribute, level, all responses and comments.
Concentric Data Flow Process 9 Stages Business Plans For PowerPoint Templates
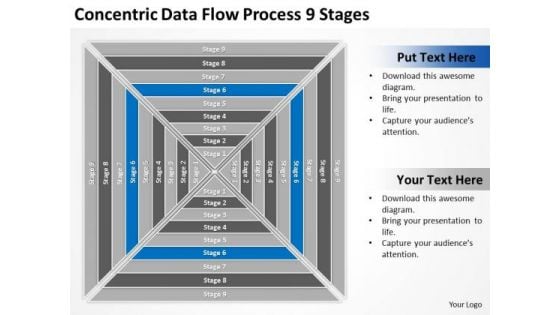
We present our concentric data flow process 9 stages business plans for PowerPoint templates.Download and present our Flow Charts PowerPoint Templates because They will Put the wind in your sails. Skim smoothly over the choppy waters of the market. Use our Business PowerPoint Templates because You can Hit the nail on the head with our PowerPoint Templates and Slides. Embed your ideas in the minds of your audience. Download our Marketing PowerPoint Templates because Our PowerPoint Templates and Slides help you meet the demand of the Market. Just browse and pick the slides that appeal to your intuitive senses. Download our Process and Flow PowerPoint Templates because Our PowerPoint Templates and Slides will let Your superior ideas hit the target always and everytime. Present our Shapes PowerPoint Templates because Our PowerPoint Templates and Slides will let you Illuminate the road ahead to Pinpoint the important landmarks along the way.Use these PowerPoint slides for presentations relating to Flow, network, platform, diagram, connection, connect, business, flowchart, function, organization, coordinates, molecular, square, plan, interrelations, scheme, graphic, technology, graph, molecule, arrangement, comparison, scientific, variable, project, relationships, lines,attached, segments, interconnected, solution, organize, device, analyze, draft, pattern, construction, structure, nine, steps. The prominent colors used in the PowerPoint template are Gray, Blue, White. Bury differences with our Concentric Data Flow Process 9 Stages Business Plans For PowerPoint Templates. You will come out on top.
Concentric Data Flow Process 9 Stages Ppt Business Plan PowerPoint Templates
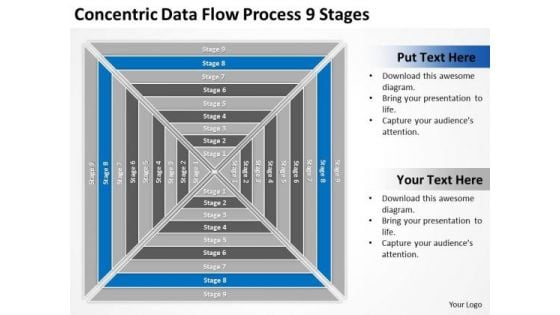
We present our concentric data flow process 9 stages ppt business plan PowerPoint templates.Download our Business PowerPoint Templates because It will get your audience in sync. Present our Flow Charts PowerPoint Templates because Watching this your Audience will Grab their eyeballs, they wont even blink. Use our Process and Flows PowerPoint Templates because Our PowerPoint Templates and Slides will fulfill your every need. Use them and effectively satisfy the desires of your audience. Download and present our Marketing PowerPoint Templates because Our PowerPoint Templates and Slides will let you meet your Deadlines. Use our Shapes PowerPoint Templates because Our PowerPoint Templates and Slides will bullet point your ideas. See them fall into place one by one.Use these PowerPoint slides for presentations relating to Flow, network, platform, diagram, connection, connect, business, flowchart, function, organization, coordinates, molecular, square, plan, interrelations, scheme, graphic, technology, graph, molecule, arrangement, comparison, scientific, variable, project, relationships, lines,attached, segments, interconnected, solution, organize, device, analyze, draft, pattern, construction, structure, nine, steps. The prominent colors used in the PowerPoint template are White, Gray, Blue. Enthuse your audience with your ideas. Our Concentric Data Flow Process 9 Stages Ppt Business Plan PowerPoint Templates will generate keenness.
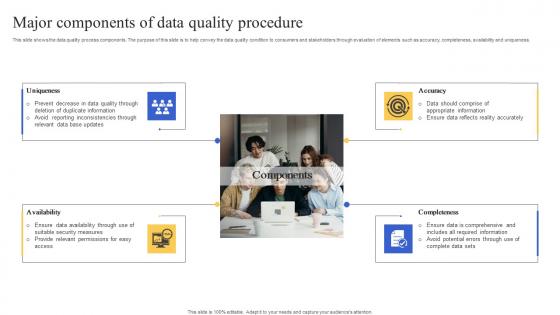
Major Components Of Data Quality Procedure Guidelines Pdf
This slide shows the data quality process components. The purpose of this slide is to help convey the data quality condition to consumers and stakeholders through evaluation of elements such as accuracy, completeness, availability and uniqueness. Showcasing this set of slides titled Major Components Of Data Quality Procedure Guidelines Pdf. The topics addressed in these templates are Uniqueness, Accuracy, Completeness, Data Quality Procedure. All the content presented in this PPT design is completely editable. Download it and make adjustments in color, background, font etc. as per your unique business setting. This slide shows the data quality process components. The purpose of this slide is to help convey the data quality condition to consumers and stakeholders through evaluation of elements such as accuracy, completeness, availability and uniqueness.
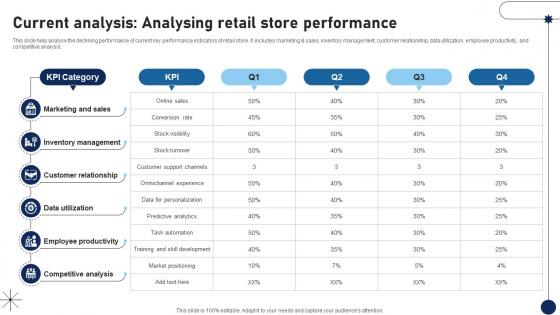
Current Analysis Analysing Retail Store Performance DT SS V
This slide help analyse the declining performance of current key performance indicators of retail store. It includes marketing and sales, inventory management, customer relationship, data utilization, employee productivity, and competitive analysis.Whether you have daily or monthly meetings, a brilliant presentation is necessary. Current Analysis Analysing Retail Store Performance DT SS V can be your best option for delivering a presentation. Represent everything in detail using Current Analysis Analysing Retail Store Performance DT SS V and make yourself stand out in meetings. The template is versatile and follows a structure that will cater to your requirements. All the templates prepared by Slidegeeks are easy to download and edit. Our research experts have taken care of the corporate themes as well. So, give it a try and see the results. This slide help analyse the declining performance of current key performance indicators of retail store. It includes marketing and sales, inventory management, customer relationship, data utilization, employee productivity, and competitive analysis.
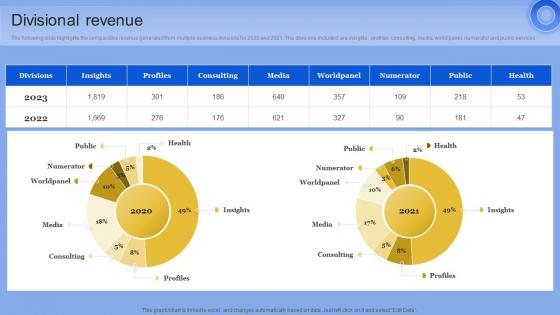
Divisional Revenue Data Analytics Company Outline Pictures PDF
The following slide highlights the comparative revenue generated from multiple business divisions for 2020 and 2021. The divisions included are insights, profiles, consulting, media, world panel, numerator and public services From laying roadmaps to briefing everything in detail, our templates are perfect for you. You can set the stage with your presentation slides. All you have to do is download these easy-to-edit and customizable templates. Divisional Revenue Data Analytics Company Outline Pictures PDF will help you deliver an outstanding performance that everyone would remember and praise you for. Do download this presentation today. The following slide highlights the comparative revenue generated from multiple business divisions for 2020 and 2021. The divisions included are insights, profiles, consulting, media, world panel, numerator and public services
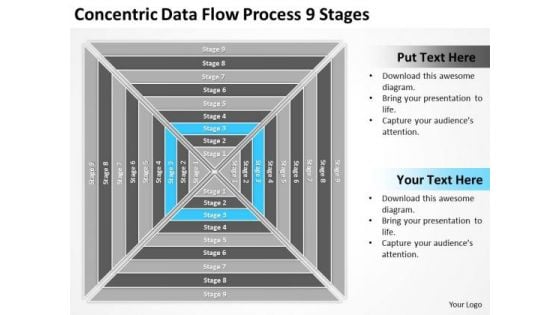
Concentric Data Flow Process 9 Stages Ppt Business Plan PowerPoint Slides
We present our concentric data flow process 9 stages ppt business plan PowerPoint Slides.Download our Flow Charts PowerPoint Templates because our PowerPoint Templates and Slides are the string of your bow. Fire of your ideas and conquer the podium. Use our Process and Flows PowerPoint Templates because You should Kick up a storm with our PowerPoint Templates and Slides. The heads of your listeners will swirl with your ideas. Download our Marketing PowerPoint Templates because You are working at that stage with an air of royalty. Let our PowerPoint Templates and Slides be the jewels in your crown. Download our Business PowerPoint Templates because You should Bet on your luck with our PowerPoint Templates and Slides. Be assured that you will hit the jackpot. Present our Shapes PowerPoint Templates because You have the co-ordinates for your destination of success. Let our PowerPoint Templates and Slides map out your journey.Use these PowerPoint slides for presentations relating to Flow, network, platform, diagram, connection, connect, business, flowchart, function, organization, coordinates, molecular, square, plan, interrelations, scheme, graphic, technology, graph, molecule, arrangement, comparison, scientific, variable, project, relationships, lines,attached, segments, interconnected, solution, organize, device, analyze, draft, pattern, construction, structure, nine, steps. The prominent colors used in the PowerPoint template are Blue light, White, Gray. Resolve the feud with our Concentric Data Flow Process 9 Stages Ppt Business Plan PowerPoint Slides. Take all different approaches into consideration.
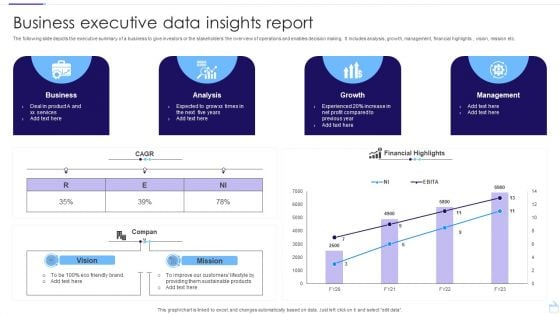
Business Executive Data Insights Report Pictures PDF
The following slide depicts the executive summary of a business to give investors or the stakeholders the overview of operations and enables decision making. It includes analysis, growth, management, financial highlights , vision, mission etc. Pitch your topic with ease and precision using this Business Executive Data Insights Report Pictures PDF. This layout presents information on Business, Analysis, Growth. It is also available for immediate download and adjustment. So, changes can be made in the color, design, graphics or any other component to create a unique layout.
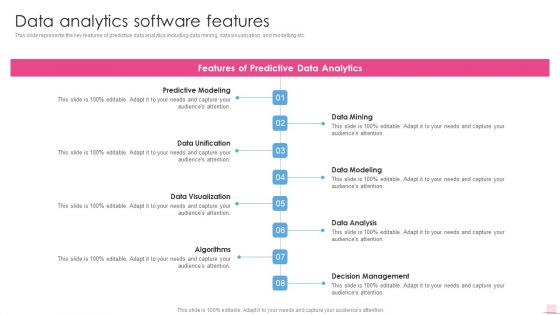
Data Analytics Software Features Business Analysis Modification Toolkit Formats PDF
This slide represents the key features of predictive data analytics including data mining, data visualization, and modelling etc.Presenting Data Analytics Software Features Business Analysis Modification Toolkit Formats PDF to provide visual cues and insights. Share and navigate important information on eight stages that need your due attention. This template can be used to pitch topics like Predictive Modeling, Data Unification, Data Visualization. In addtion, this PPT design contains high resolution images, graphics, etc, that are easily editable and available for immediate download.
Icon For Big Data Analytics In Digital Marketing Introduction Pdf
Pitch your topic with ease and precision using this Icon For Big Data Analytics In Digital Marketing Introduction Pdf. This layout presents information on Big Data, Analytics, Digital Marketing. It is also available for immediate download and adjustment. So, changes can be made in the color, design, graphics or any other component to create a unique layout. Our Icon For Big Data Analytics In Digital Marketing Introduction Pdf are topically designed to provide an attractive backdrop to any subject. Use them to look like a presentation pro.
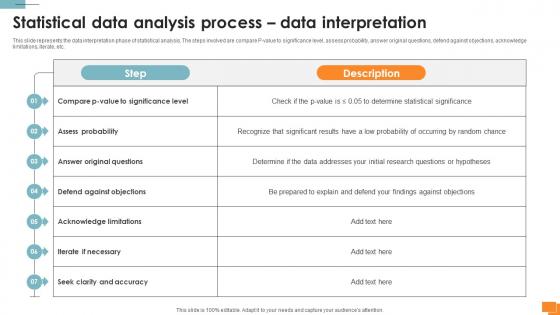
A133 Statistical Tools For Evidence Statistical Data Analysis Process Data Interpretation
This slide represents the data interpretation phase of statistical analysis. The steps involved are compare P-value to significance level, assess probability, answer original questions, defend against objections, acknowledge limitations, iterate, etc. Boost your pitch with our creative A133 Statistical Tools For Evidence Statistical Data Analysis Process Data Interpretation. Deliver an awe-inspiring pitch that will mesmerize everyone. Using these presentation templates you will surely catch everyones attention. You can browse the ppts collection on our website. We have researchers who are experts at creating the right content for the templates. So you do not have to invest time in any additional work. Just grab the template now and use them. This slide represents the data interpretation phase of statistical analysis. The steps involved are compare P-value to significance level, assess probability, answer original questions, defend against objections, acknowledge limitations, iterate, etc.
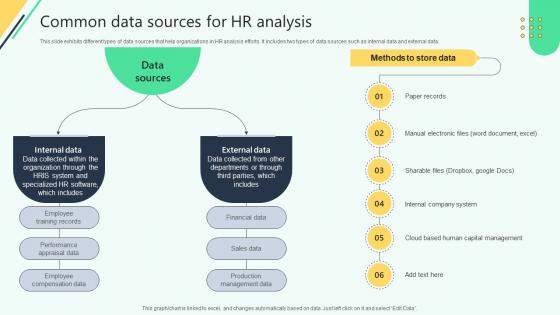
Common Data Sources For Hr Analysis Analysing Hr Data For Effective Decision Making
This slide exhibits different types of data sources that help organizations in HR analysis efforts. It includes two types of data sources such as internal data and external data. From laying roadmaps to briefing everything in detail, our templates are perfect for you. You can set the stage with your presentation slides. All you have to do is download these easy-to-edit and customizable templates. Common Data Sources For Hr Analysis Analysing Hr Data For Effective Decision Making will help you deliver an outstanding performance that everyone would remember and praise you for. Do download this presentation today. This slide exhibits different types of data sources that help organizations in HR analysis efforts. It includes two types of data sources such as internal data and external data.
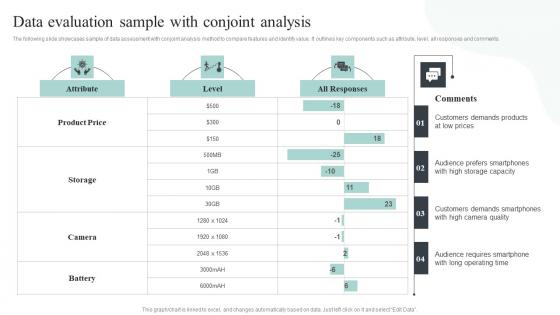
Competitive Intelligence Guide To Determine Market Data Evaluation Sample With Conjoint Information Pdf
The following slide showcases sample of data assessment with conjoint analysis method to compare features and identify value. It outlines key components such as attribute, level, all responses and comments. From laying roadmaps to briefing everything in detail, our templates are perfect for you. You can set the stage with your presentation slides. All you have to do is download these easy-to-edit and customizable templates. Competitive Intelligence Guide To Determine Market Data Evaluation Sample With Conjoint Information Pdf will help you deliver an outstanding performance that everyone would remember and praise you for. Do download this presentation today. The following slide showcases sample of data assessment with conjoint analysis method to compare features and identify value. It outlines key components such as attribute, level, all responses and comments.

Data Warehousing And Data Mining Vs Machine Learning Comparative Analysis AI SS V
This slide showcases comparative analysis of data mining and machine learning, helping researchers finalize which methods or blend is best for their operations. It provides information about meaning, human intervention, purpose and use cases. Create an editable Data Warehousing And Data Mining Vs Machine Learning Comparative Analysis AI SS V that communicates your idea and engages your audience. Whether you are presenting a business or an educational presentation, pre-designed presentation templates help save time. Data Warehousing And Data Mining Vs Machine Learning Comparative Analysis AI SS V is highly customizable and very easy to edit, covering many different styles from creative to business presentations. Slidegeeks has creative team members who have crafted amazing templates. So, go and get them without any delay. This slide showcases comparative analysis of data mining and machine learning, helping researchers finalize which methods or blend is best for their operations. It provides information about meaning, human intervention, purpose and use cases.

Impact Of Blockchain Integration On Key Metrics Supply Chain Evolution Harnessing The Power BCT SS V
This slide depicts the positive impact integration of blockchain has on various metrics within supply chain ecosystem of an organization. It includes before and after analysis with relevant key insights. Create an editable Impact Of Blockchain Integration On Key Metrics Supply Chain Evolution Harnessing The Power BCT SS V that communicates your idea and engages your audience. Whether you are presenting a business or an educational presentation, pre-designed presentation templates help save time. Impact Of Blockchain Integration On Key Metrics Supply Chain Evolution Harnessing The Power BCT SS V is highly customizable and very easy to edit, covering many different styles from creative to business presentations. Slidegeeks has creative team members who have crafted amazing templates. So, go and get them without any delay. This slide depicts the positive impact integration of blockchain has on various metrics within supply chain ecosystem of an organization. It includes before and after analysis with relevant key insights.

Data Analysis Excel Bar Graph To Compare PowerPoint Templates
Get The Domestics Right With Our data analysis excel bar graph to compare Powerpoint Templates. Create The Base For Thoughts To Grow.
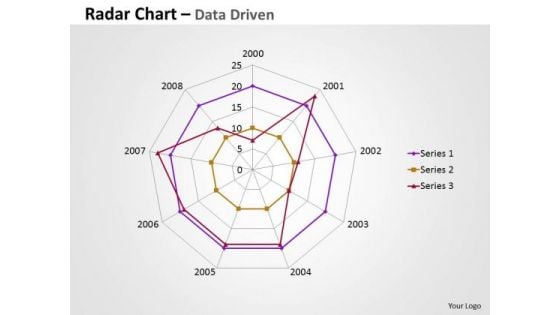
Business Data Analysis Chart Comparing Multiple Entities PowerPoint Templates
Analyze Ailments On Our business data analysis chart comparing multiple entities Powerpoint Templates. Bring Out The Thinking Doctor In You. Dock Your Thoughts With Our Financial Analysis . They Will Launch Them Into Orbit.
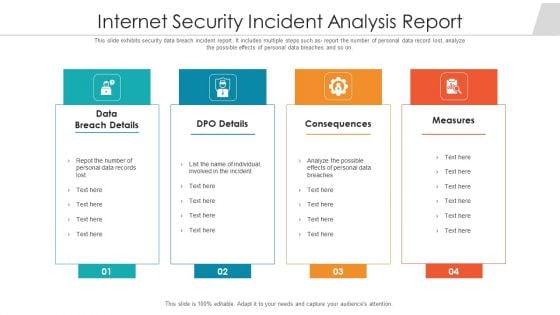
Internet Security Incident Analysis Report Template PDF
This slide exhibits security data breach incident report. It includes multiple steps such as- report the number of personal data record lost, analyze the possible effects of personal data breaches and so on. Showcasing this set of slides titled internet security incident analysis report template pdf. The topics addressed in these templates are data breach details, consequences, measures. All the content presented in this PPT design is completely editable. Download it and make adjustments in color, background, font etc. as per your unique business setting.
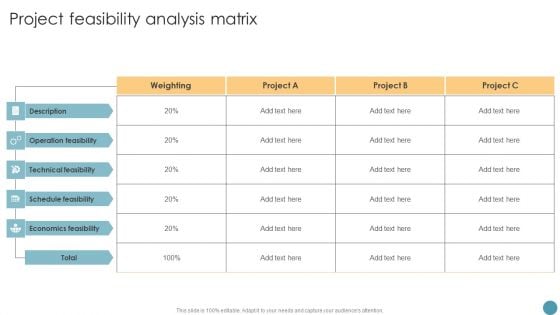
Project Feasibility Analysis Matrix Feasibility Analysis Report For Construction Project Designs PDF
The Project Feasibility Analysis Matrix Feasibility Analysis Report For Construction Project Designs PDF is a compilation of the most recent design trends as a series of slides. It is suitable for any subject or industry presentation, containing attractive visuals and photo spots for businesses to clearly express their messages. This template contains a variety of slides for the user to input data, such as structures to contrast two elements, bullet points, and slides for written information. Slidegeeks is prepared to create an impression.
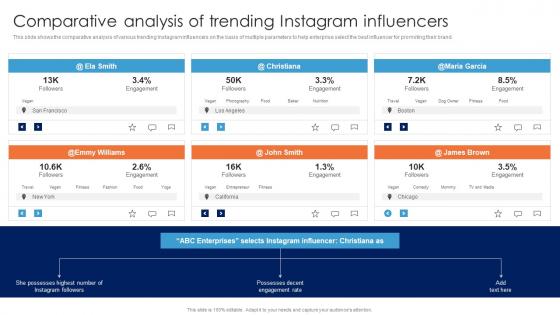
Comparative Analysis Of Trending Instagram Guide For Data Driven Advertising Themes Pdf
This slide shows the comparative analysis of various trending Instagram influencers on the basis of multiple parameters to help enterprise select the best influencer for promoting their brand.This modern and well-arranged Comparative Analysis Of Trending Instagram Guide For Data Driven Advertising Themes Pdf provides lots of creative possibilities. It is very simple to customize and edit with the Powerpoint Software. Just drag and drop your pictures into the shapes. All facets of this template can be edited with Powerpoint no extra software is necessary. Add your own material, put your images in the places assigned for them, adjust the colors, and then you can show your slides to the world, with an animated slide included. This slide shows the comparative analysis of various trending Instagram influencers on the basis of multiple parameters to help enterprise select the best influencer for promoting their brand.
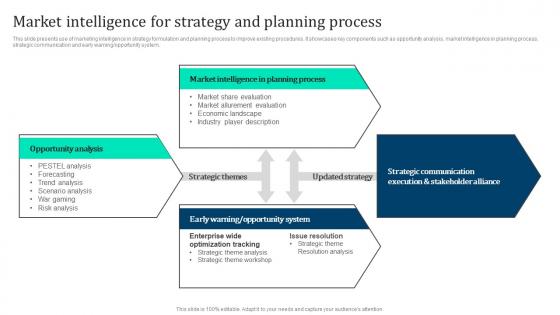
Market Intelligence Strategy Marketing Intelligence Guide Data Gathering Summary Pdf
This slide presents use of marketing intelligence in strategy formulation and planning process to improve existing procedures. It showcases key components such as opportunity analysis, market intelligence in planning process, strategic communication and early warning opportunity system. The Market Intelligence Strategy Marketing Intelligence Guide Data Gathering Summary Pdf is a compilation of the most recent design trends as a series of slides. It is suitable for any subject or industry presentation, containing attractive visuals and photo spots for businesses to clearly express their messages. This template contains a variety of slides for the user to input data, such as structures to contrast two elements, bullet points, and slides for written information. Slidegeeks is prepared to create an impression. This slide presents use of marketing intelligence in strategy formulation and planning process to improve existing procedures. It showcases key components such as opportunity analysis, market intelligence in planning process, strategic communication and early warning opportunity system.
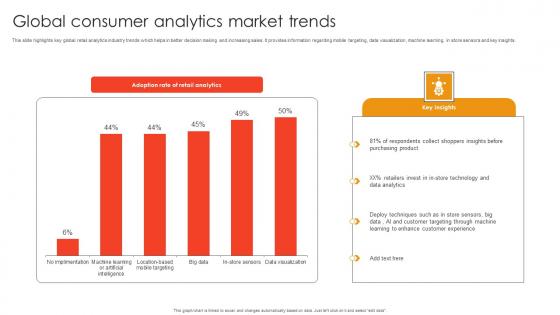
Global Consumer Analytics Market Trends Template Pdf
This slide highlights key global retail analytics industry trends which helps in better decision making and increasing sales. It provides information regarding mobile targeting, data visualization, machine learning, in store sensors and key insights. Pitch your topic with ease and precision using this Global Consumer Analytics Market Trends Template Pdf. This layout presents information on Respondents Collect Shoppers, Retailers Invest Store, Deploy Techniques Store Sensors. It is also available for immediate download and adjustment. So, changes can be made in the color, design, graphics or any other component to create a unique layout. This slide highlights key global retail analytics industry trends which helps in better decision making and increasing sales. It provides information regarding mobile targeting, data visualization, machine learning, in store sensors and key insights.
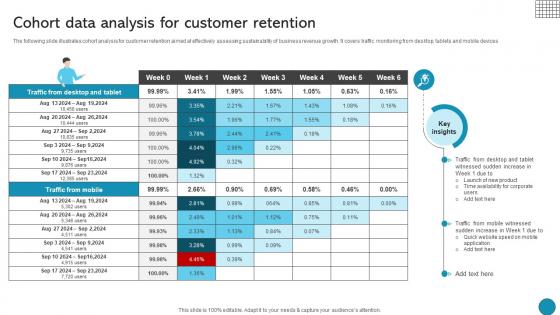
Cohort Data Analysis For Customer Retention Driving Business Success Integrating Product
The following slide illustrates cohort analysis for customer retention aimed at effectively assessing sustainability of business revenue growth. It covers traffic monitoring from desktop, tablets and mobile devicesFind highly impressive Cohort Data Analysis For Customer Retention Driving Business Success Integrating Product on Slidegeeks to deliver a meaningful presentation. You can save an ample amount of time using these presentation templates. No need to worry to prepare everything from scratch because Slidegeeks experts have already done a huge research and work for you. You need to download Cohort Data Analysis For Customer Retention Driving Business Success Integrating Product for your upcoming presentation. All the presentation templates are 100 percent editable and you can change the color and personalize the content accordingly. Download now The following slide illustrates cohort analysis for customer retention aimed at effectively assessing sustainability of business revenue growth. It covers traffic monitoring from desktop, tablets and mobile devices


 Continue with Email

 Home
Home


