Comparison Infographic
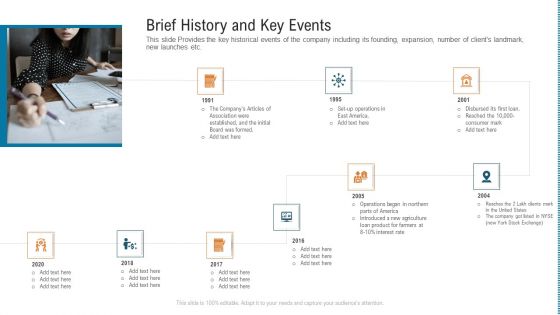
Brief History And Key Events Infographics PDF
This slide Provides the key historical events of the company including its founding, expansion, number of clients landmark, new launches etc. This is a brief history and key events infographics pdf. template with various stages. Focus and dispense information on one stages using this creative set, that comes with editable features. It contains large content boxes to add your information on topics like brief history and key events. You can also showcase facts, figures, and other relevant content using this PPT layout. Grab it now.
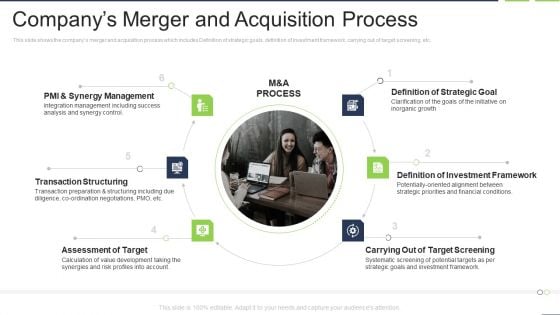
Companys Merger And Acquisition Process Infographics PDF
This slide shows the companys merger and acquisition process which includes Definition of strategic goals, definition of investment framework, carrying out of target screening, etc.This is a companys merger and acquisition process infographics pdf template with various stages. Focus and dispense information on six stages using this creative set, that comes with editable features. It contains large content boxes to add your information on topics like carrying out of target screening, definition of investment framework, definition of strategic goal. You can also showcase facts, figures, and other relevant content using this PPT layout. Grab it now.
Competitive Advantage Ppt Infographics Icon PDF
This slide provides the glimpse about the competitive advantage of our company such as great management, competitive culture, strong career progression, and better compensation. This is a competitive advantage ppt infographics icon pdf template with various stages. Focus and dispense information on four stages using this creative set, that comes with editable features. It contains large content boxes to add your information on topics like competitive advantage. You can also showcase facts, figures, and other relevant content using this PPT layout. Grab it now.
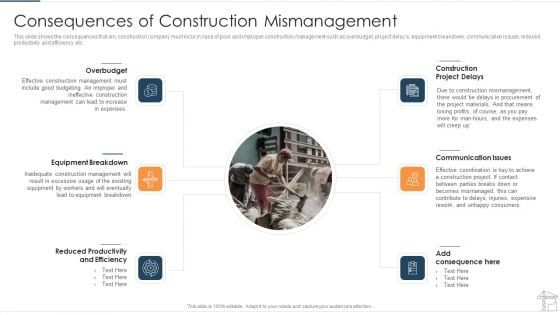
Consequences Of Construction Mismanagement Infographics PDF
This slide shows the consequences that any construction company must incur in case of poor and improper construction management such as overbudget, project delays, equipment breakdown, communication issues, reduced productivity and efficiency etc. This is a consequences of construction mismanagement infographics pdf template with various stages. Focus and dispense information on six stages using this creative set, that comes with editable features. It contains large content boxes to add your information on topics like equipment breakdown, reduced productivity and efficiency, construction project delays. You can also showcase facts, figures, and other relevant content using this PPT layout. Grab it now.

Test Devops Robotization Model Infographics PDF
This slide provides the glimpse about the devops test automation model which focuses on requirement verification, business and technology facing issues and function validation. This is a test devops robotization model infographics pdf template with various stages. Focus and dispense information on four stages using this creative set, that comes with editable features. It contains large content boxes to add your information on topics like functional, usability, acceptance, non-functional, integration. You can also showcase facts, figures, and other relevant content using this PPT layout. Grab it now.
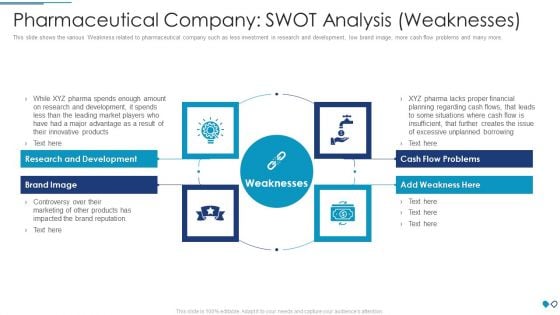
Pharmaceutical Company SWOT Analysis Weaknesses Infographics PDF
This slide shows the various Weakness related to pharmaceutical company such as less investment in research and development, low brand image, more cash flow problems and many more.This is a pharmaceutical company swot analysis weaknesses infographics pdf template with various stages. Focus and dispense information on four stages using this creative set, that comes with editable features. It contains large content boxes to add your information on topics like research and development, cash flow problems, brand image You can also showcase facts, figures, and other relevant content using this PPT layout. Grab it now.
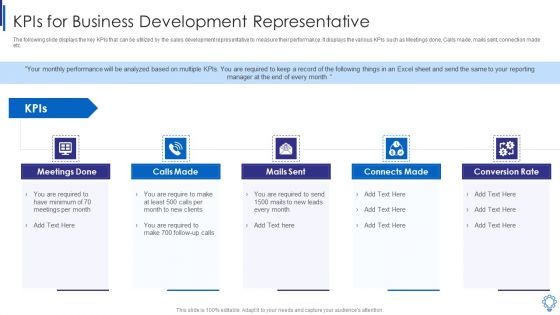
Kpis For Business Development Representative Infographics PDF
The following slide displays the key KPIs that can be utilized by the sales development representative to measure their performance. It displays the various KPIs such as Meetings done, Calls made, mails sent, connection made etc. This is a kpis for business development representative infographics pdf template with various stages. Focus and dispense information on five stages using this creative set, that comes with editable features. It contains large content boxes to add your information on topics like meetings done, mails sent, connects made, conversion rate, calls made. You can also showcase facts, figures, and other relevant content using this PPT layout. Grab it now.
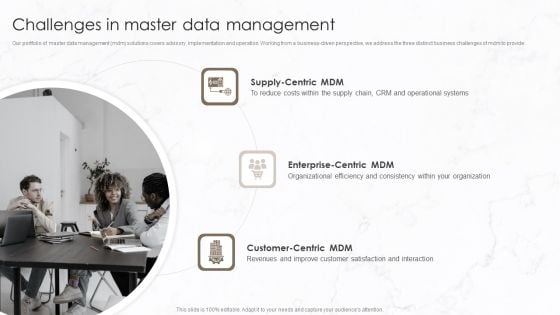
Challenges In Master Data Management Infographics PDF
Our portfolio of master data management mdm solutions covers advisory, implementation and operation. Working from a business-driven perspective, we address the three distinct business challenges of mdm to provide.This is a Challenges In Master Data Management Infographics PDF template with various stages. Focus and dispense information on three stages using this creative set, that comes with editable features. It contains large content boxes to add your information on topics like Enterprise Centric, Organizational Efficiency, Revenues And Improve. You can also showcase facts, figures, and other relevant content using this PPT layout. Grab it now.

Benefits Of Conversational Marketing Infographics PDF
Purpose of the following slide is to display benefits of conversational marketing. These benefits can be increase in customer satisfaction rate, better insight into customer behavior, reduction in cost, short sales cycle, increase in lead quality etc. This is a Benefits Of Conversational Marketing Infographics PDF template with various stages. Focus and dispense information on eight stages using this creative set, that comes with editable features. It contains large content boxes to add your information on topics like Customer Satisfaction Rate, Quality, Sales Cycle. You can also showcase facts, figures, and other relevant content using this PPT layout. Grab it now.

Various Ways For Managing Pipeline Infographics PDF
This slide provides information regarding various through which sales pipeline is managed such as tactical outbound messaging, automating email marketing, etc. This is a Various Ways For Managing Pipeline Infographics PDF template with various stages. Focus and dispense information on three stages using this creative set, that comes with editable features. It contains large content boxes to add your information on topics like Automating Email Marketing, Qualified Lead Delivery, Tactical Outbound Messaging. You can also showcase facts, figures, and other relevant content using this PPT layout. Grab it now.
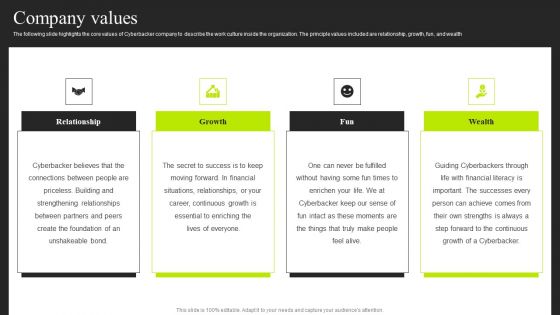
Cyberbacker Company Summary Company Values Infographics PDF
The following slide highlights the core values of Cyberbacker company to describe the work culture inside the organization. The principle values included are relationship, growth, fun, and wealth. This is a Cyberbacker Company Summary Company Values Infographics PDF template with various stages. Focus and dispense information on four stages using this creative set, that comes with editable features. It contains large content boxes to add your information on topics like Growth, Wealth, Relationship. You can also showcase facts, figures, and other relevant content using this PPT layout. Grab it now.
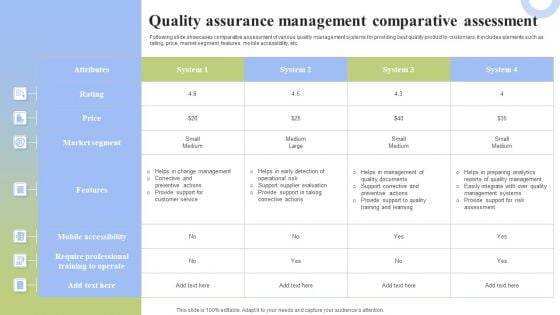
Quality Assurance Management Comparative Assessment Infographics PDF
Following slide showcases comparative assessment of various quality management systems for providing best quality product to customers. It includes elements such as rating, price, market segment, features, mobile accessibility, etc. Showcasing this set of slides titled Quality Assurance Management Comparative Assessment Infographics PDF. The topics addressed in these templates are Helps Change Management, Corrective Preventive Actions, Provide Support Customer. All the content presented in this PPT design is completely editable. Download it and make adjustments in color, background, font etc. as per your unique business setting.
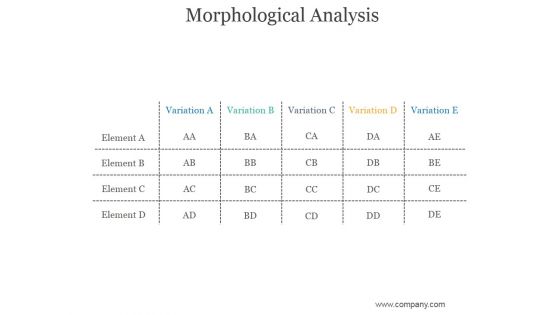
Morphological Analysis Ppt PowerPoint Presentation Infographics
This is a morphological analysis ppt powerpoint presentation infographics. This is a five stage process. The stages in this process are variation, element, business, marketing, success.
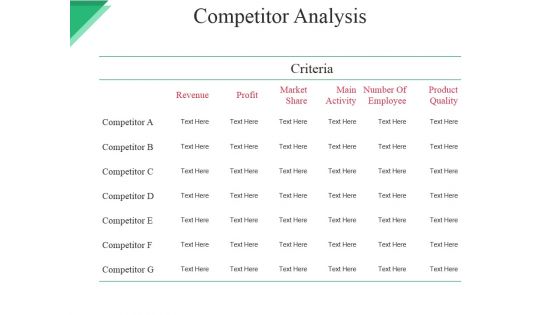
Competitor Analysis Ppt PowerPoint Presentation Show Infographics
This is a competitor analysis ppt powerpoint presentation show infographics. This is a seven stage process. The stages in this process are revenue, profit, market, share, main activity, number of employee.
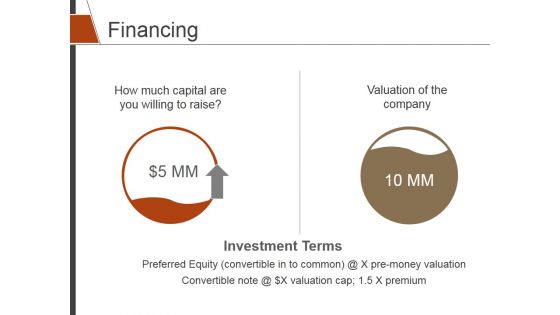
Financing Ppt PowerPoint Presentation Summary Infographics
This is a financing ppt powerpoint presentation summary infographics. This is a two stage process. The stages in this process are investment terms, finance, analysis, investment, business.
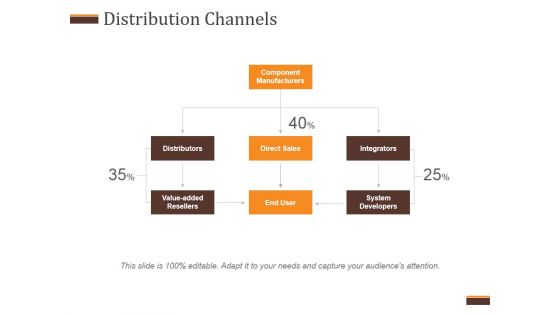
Distribution Channels Ppt PowerPoint Presentation Infographics
This is a distribution channels ppt powerpoint presentation infographics. This is a three stage process. The stages in this process are component manufacturers, distributors, direct sales, integrators, value added resellers, end user, system developers.
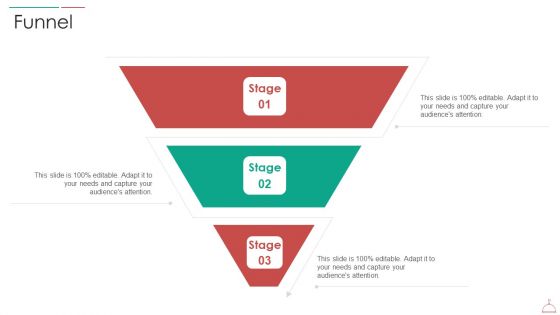
Hotel Cafe Business Plan Funnel Infographics PDF
This is a hotel cafe business plan financial slides pdf template with various stages. Focus and dispense information on three stages using this creative set, that comes with editable features. It contains large content boxes to add your information on topics like funnel. You can also showcase facts, figures, and other relevant content using this PPT layout. Grab it now.
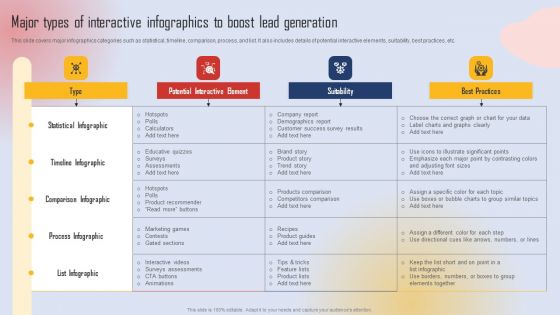
Effective Lead Generation For Higher Conversion Rates Major Types Of Interactive Infographics To Boost Mockup PDF
This slide covers major infographics categories such as statistical, timeline, comparison, process, and list. It also includes details of potential interactive elements, suitability, best practices, etc. From laying roadmaps to briefing everything in detail, our templates are perfect for you. You can set the stage with your presentation slides. All you have to do is download these easy to edit and customizable templates. Effective Lead Generation For Higher Conversion Rates Major Types Of Interactive Infographics To Boost Mockup PDF will help you deliver an outstanding performance that everyone would remember and praise you for. Do download this presentation today.
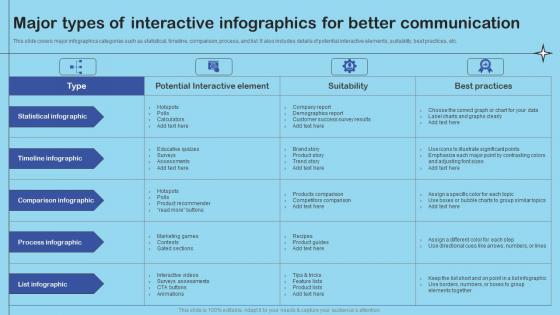
Major Types Of Interactive Infographics Enhance Client Engagement With Interactive Information Pdf
This slide covers major infographics categories such as statistical, timeline, comparison, process, and list. It also includes details of potential interactive elements, suitability, best practices, etc. Presenting this PowerPoint presentation, titled Major Types Of Interactive Infographics Enhance Client Engagement With Interactive Information Pdf, with topics curated by our researchers after extensive research. This editable presentation is available for immediate download and provides attractive features when used. Download now and captivate your audience. Presenting this Major Types Of Interactive Infographics Enhance Client Engagement With Interactive Information Pdf. Our researchers have carefully researched and created these slides with all aspects taken into consideration. This is a completely customizable Major Types Of Interactive Infographics Enhance Client Engagement With Interactive Information Pdf that is available for immediate downloading. Download now and make an impact on your audience. Highlight the attractive features available with our PPTs. This slide covers major infographics categories such as statistical, timeline, comparison, process, and list. It also includes details of potential interactive elements, suitability, best practices, etc.
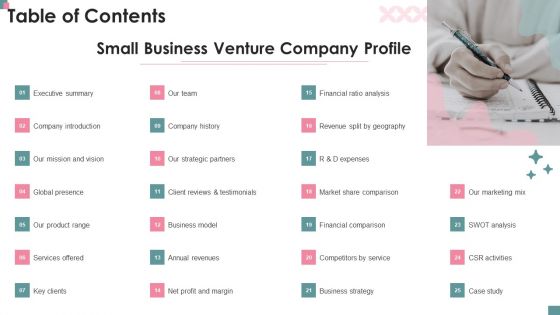
Small Business Venture Company Profile Table Of Contents Infographics PDF
Deliver and pitch your topic in the best possible manner with this Small Business Venture Company Profile Table Of Contents Infographics PDF. Use them to share invaluable insights on Executive Summary, Company Introduction, Financial Comparison and impress your audience. This template can be altered and modified as per your expectations. So, grab it now.
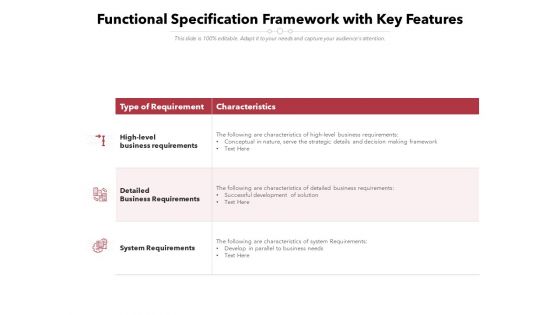
Functional Specification Framework With Key Features Ppt PowerPoint Presentation Infographics Infographics PDF
Presenting this set of slides with name functional specification framework with key features ppt powerpoint presentation infographics infographics pdf. The topics discussed in these slides are high level business requirements, detailed business requirements, system requirements. This is a completely editable PowerPoint presentation and is available for immediate download. Download now and impress your audience.
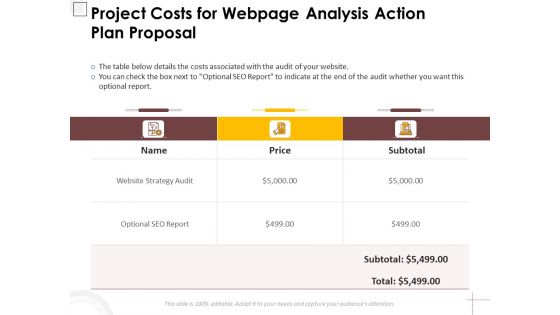
Project Costs For Webpage Analysis Action Plan Proposal Ppt PowerPoint Presentation Infographics Infographics PDF
Deliver and pitch your topic in the best possible manner with this project costs for webpage analysis action plan proposal ppt powerpoint presentation infographics infographics pdf. Use them to share invaluable insights on website strategy audit, price, optional seo report and impress your audience. This template can be altered and modified as per your expectations. So, grab it now.
Eight Key Questions With Icons And Query Sign Ppt PowerPoint Presentation Infographics Infographics PDF
Pitch your topic with ease and precision using this eight key questions with icons and query sign ppt powerpoint presentation infographics infographics pdf. This layout presents information on eight key questions with icons and query sign. It is also available for immediate download and adjustment. So, changes can be made in the color, design, graphics or any other component to create a unique layout.
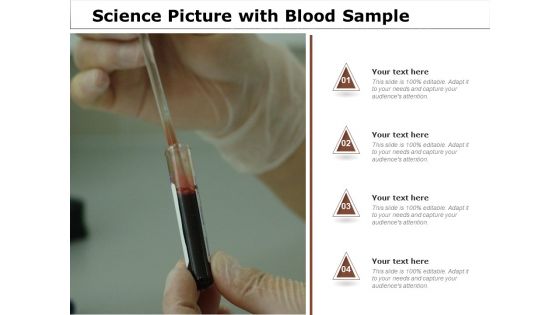
Science Picture With Blood Sample Ppt PowerPoint Presentation Infographics Infographics PDF
Pitch your topic with ease and precision using this science picture with blood sample ppt powerpoint presentation infographics infographics pdf. This layout presents information on science picture with blood sample. It is also available for immediate download and adjustment. So, changes can be made in the color, design, graphics or any other component to create a unique layout.

Target Market Strategy Developing Pricing Strategies And Programs Basic Ppt Infographics Infographics PDF
This is a target market strategy developing pricing strategies and programs basic ppt infographics infographics pdf template with various stages. Focus and dispense information on five stages using this creative set, that comes with editable features. It contains large content boxes to add your information on topics like advanced, platinum, business, basic, pro. You can also showcase facts, figures, and other relevant content using this PPT layout. Grab it now.
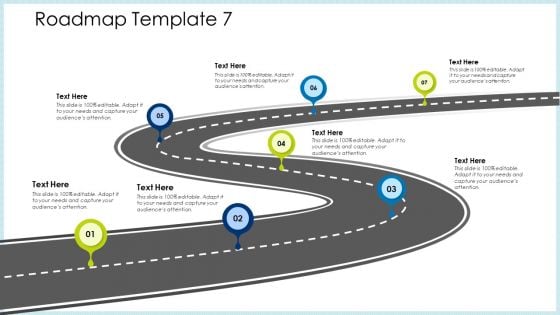
Technology Innovation Human Resource System Roadmap Seven Step Process Ppt Infographics Infographics PDF
This is a technology innovation human resource system roadmap seven step process ppt infographics infographics pdf template with various stages. Focus and dispense information on seven stages using this creative set, that comes with editable features. It contains large content boxes to add your information on topics like roadmap. You can also showcase facts, figures, and other relevant content using this PPT layout. Grab it now.
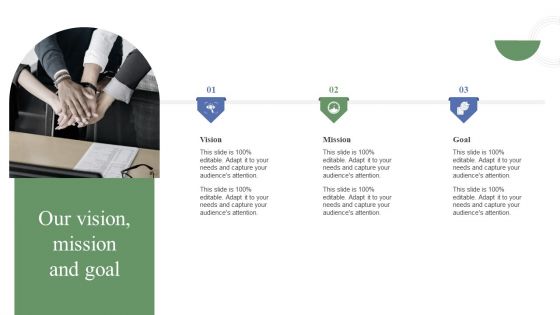
Toolkit To Administer Tactical Our Vision Mission And Goal Ppt Infographics Infographics PDF
This Toolkit To Administer Tactical Our Vision Mission And Goal Ppt Infographics Infographics PDF from Slidegeeks makes it easy to present information on your topic with precision. It provides customization options, so you can make changes to the colors, design, graphics, or any other component to create a unique layout. It is also available for immediate download, so you can begin using it right away. Slidegeeks has done good research to ensure that you have everything you need to make your presentation stand out. Make a name out there for a brilliant performance.
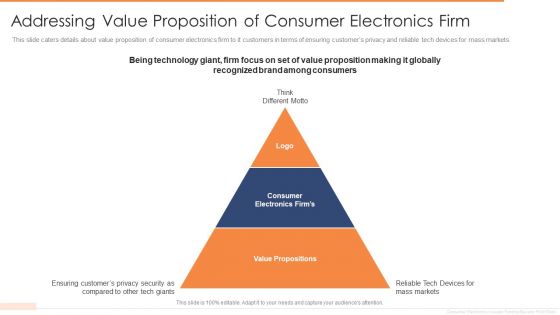
Addressing Value Proposition Of Consumer Electronics Firm Ppt Infographics Infographics PDF
This slide caters details about value proposition of consumer electronics firm to it customers in terms of ensuring customers privacy and reliable tech devices for mass markets. This is a addressing value proposition of consumer electronics firm ppt infographics infographics pdf template with various stages. Focus and dispense information on three stages using this creative set, that comes with editable features. It contains large content boxes to add your information on topics like mass markets, value propositions, technology, value proposition. You can also showcase facts, figures, and other relevant content using this PPT layout. Grab it now.
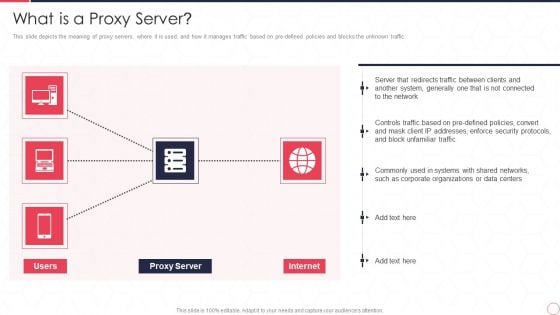
Reverse Proxy Server IT What Is A Proxy Server Ppt Infographics Infographics PDF
This slide depicts the meaning of proxy servers, where it is used, and how it manages traffic based on pre-defined policies and blocks the unknown traffic. This is a reverse proxy server it what is a proxy server ppt infographics infographics pdf template with various stages. Focus and dispense information on one stages using this creative set, that comes with editable features. It contains large content boxes to add your information on topics like network, unfamiliar traffic, enforce security protocols, controls traffic based. You can also showcase facts, figures, and other relevant content using this PPT layout. Grab it now.
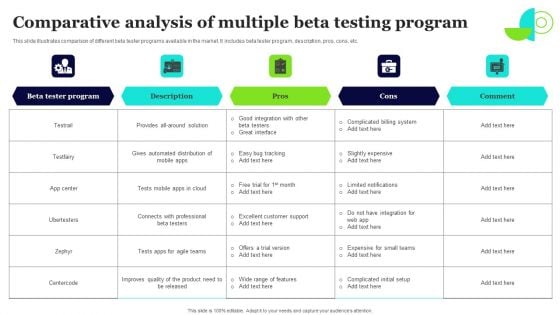
Comparative Analysis Of Multiple Beta Testing Program Infographics PDF
This slide illustrates comparison of different beta tester programs available in the market. It includes beta tester program, description, pros, cons, etc. Showcasing this set of slides titled Comparative Analysis Of Multiple Beta Testing Program Infographics PDF. The topics addressed in these templates are Beta Tester Program, Description, Pros. All the content presented in this PPT design is completely editable. Download it and make adjustments in color, background, font etc. as per your unique business setting.
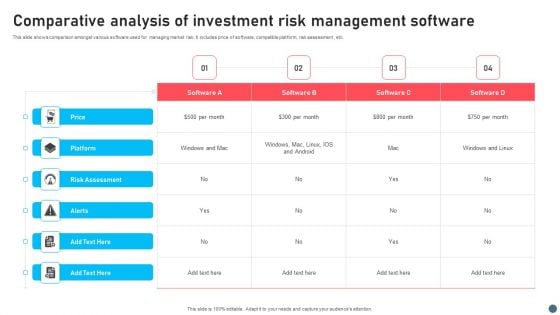
Comparative Analysis Of Investment Risk Management Software Infographics PDF

Comparative Analysis Of Types Of Project Assessing Infographics PDF
This slide depicts the comparison of various types of project monitoring. It includes monitoring management, financial and program those compared based on areas, data collected, source, and usage. Presenting Comparative Analysis Of Types Of Project Assessing Infographics PDF to dispense important information. This template comprises three stages. It also presents valuable insights into the topics including Management, Finance, Program. This is a completely customizable PowerPoint theme that can be put to use immediately. So, download it and address the topic impactfully.
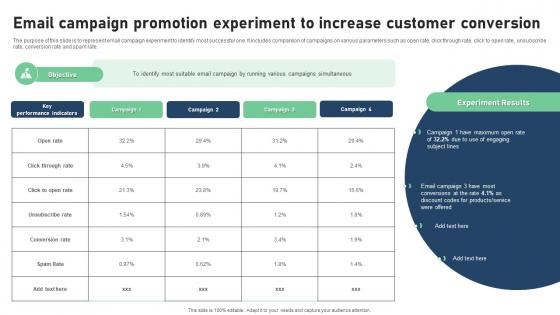
Email Campaign Promotion Experiment To Increase Customer Conversion Infographics Pdf
The purpose of this slide is to represent email campaign experiment to identify most successful one. It includes comparison of campaigns on various parameters such as open rate, click through rate, click to open rate, unsubscribe rate, conversion rate and spam rate. Pitch your topic with ease and precision using this Email Campaign Promotion Experiment To Increase Customer Conversion Infographics Pdf. This layout presents information on Email Campaign, Promotion Experiment, Increase Customer Conversion. It is also available for immediate download and adjustment. So, changes can be made in the color, design, graphics or any other component to create a unique layout. The purpose of this slide is to represent email campaign experiment to identify most successful one. It includes comparison of campaigns on various parameters such as open rate, click through rate, click to open rate, unsubscribe rate, conversion rate and spam rate.
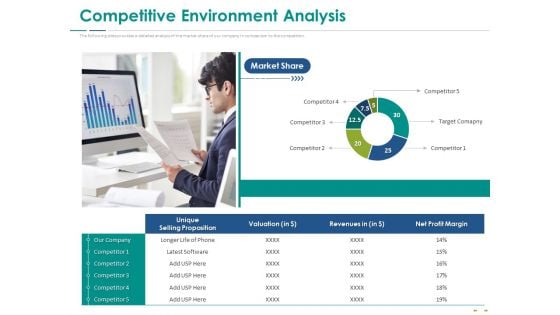
Stock Market Research Report Competitive Environment Analysis Infographics PDF
The following slide provides a detailed analysis of the market share of our company in comparison to the competition. Deliver an awe-inspiring pitch with this creative stock market research report competitive environment analysis infographics pdf bundle. Topics like market share, unique selling proposition, valuation, revenues, net profit margin can be discussed with this completely editable template. It is available for immediate download depending on the needs and requirements of the user.
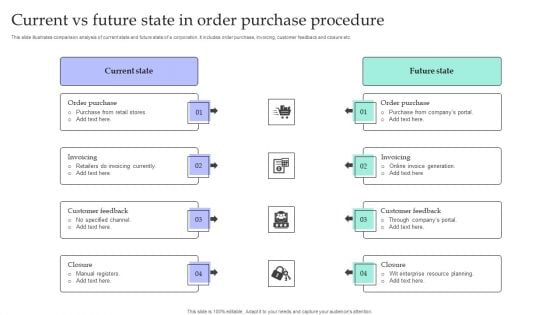
Current Vs Future State In Order Purchase Procedure Infographics PDF
This slide illustrates comparison analysis of current state and future state of a corporation. It includes order purchase, invoicing, customer feedback and closure etc.Showcasing this set of slides titled Current Vs Future State In Order Purchase Procedure Infographics PDF. The topics addressed in these templates are Order Purchase, Customer Feedback, Order Purchase. All the content presented in this PPT design is completely editable. Download it and make adjustments in color, background, font etc. as per your unique business setting.
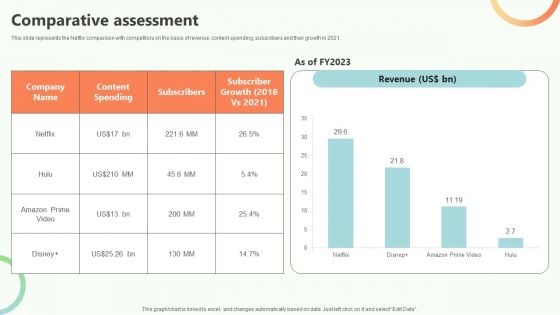
Online Video Content Provider Business Profile Comparative Assessment Infographics PDF
This slide represents the Netflix comparison with competitors on the basis of revenue, content spending, subscribers and their growth in 2021. Create an editable Online Video Content Provider Business Profile Comparative Assessment Infographics PDF that communicates your idea and engages your audience. Whether youre presenting a business or an educational presentation, pre designed presentation templates help save time. Online Video Content Provider Business Profile Comparative Assessment Infographics PDF is highly customizable and very easy to edit, covering many different styles from creative to business presentations. Slidegeeks has creative team members who have crafted amazing templates. So, go and get them without any delay.

Analysis Between Actual And Forecasted Financial Budget Infographics PDF
This slide shows the table representing the comparison between actual and forecasted financial budget of an ecommerce company. It includes details related to investments, start and finish date, budget, actual to date, budget remaining, Percent spent, forecast calculated and remaining etc. Showcasing this set of slides titled Analysis Between Actual And Forecasted Financial Budget Infographics PDF. The topics addressed in these templates are External Labor, Budget Remaining, Forecast Remaining. All the content presented in this PPT design is completely editable. Download it and make adjustments in color, background, font etc. as per your unique business setting.
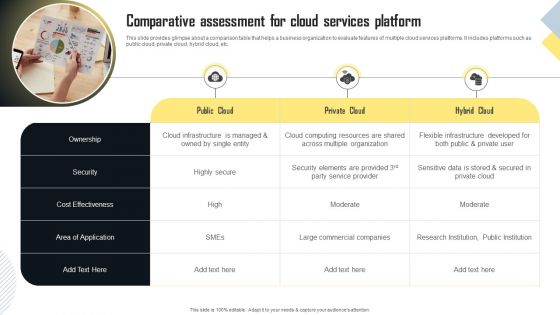
Comparative Assessment For Cloud Services Platform Infographics PDF
This slide provides glimpse about a comparison table that helps a business organization to evaluate features of multiple cloud services platforms. It includes platforms such as public cloud, private cloud, hybrid cloud, etc. Slidegeeks is one of the best resources for PowerPoint templates. You can download easily and regulate Comparative Assessment For Cloud Services Platform Infographics PDF for your personal presentations from our wonderful collection. A few clicks is all it takes to discover and get the most relevant and appropriate templates. Use our Templates to add a unique zing and appeal to your presentation and meetings. All the slides are easy to edit and you can use them even for advertisement purposes.
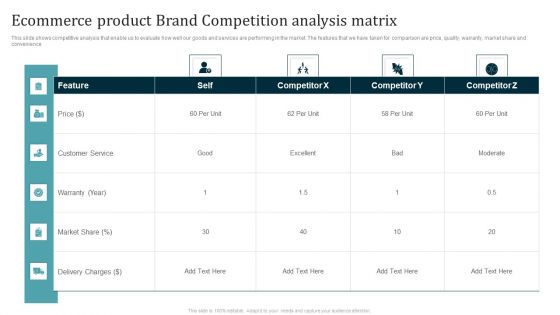
Ecommerce Product Brand Competition Analysis Matrix Ppt Infographics Vector PDF
This slide shows competitive analysis that enable us to evaluate how well our goods and services are performing in the market. The features that we have taken for comparison are price, quality, warranty, market share and convenience. Pitch your topic with ease and precision using this Ecommerce Product Brand Competition Analysis Matrix Ppt Infographics Vector PDF. This layout presents information on Customer Service, Market Share, Delivery Charges. It is also available for immediate download and adjustment. So, changes can be made in the color, design, graphics or any other component to create a unique layout.
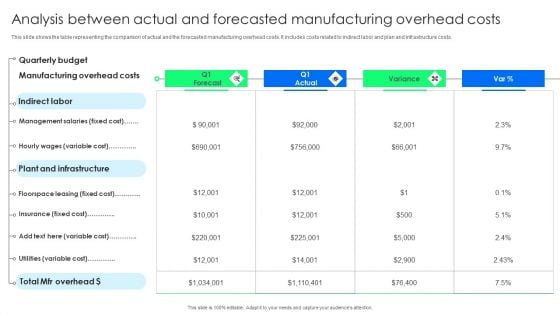
Analysis Between Actual And Forecasted Manufacturing Overhead Costs Infographics PDF
This slide shows the table representing the comparison of actual and the forecasted manufacturing overhead costs. It includes costs related to indirect labor and plan and infrastructure costs. Pitch your topic with ease and precision using this Analysis Between Actual And Forecasted Manufacturing Overhead Costs Infographics PDF. This layout presents information on Indirect Labor, Plant And Infrastructure. It is also available for immediate download and adjustment. So, changes can be made in the color, design, graphics or any other component to create a unique layout.
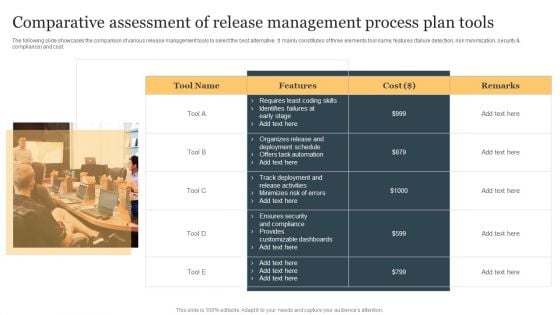
Comparative Assessment Of Release Management Process Plan Tools Infographics PDF
The following slide showcases the comparison of various release management tools to select the best alternative. It mainly constitutes of three elements tool name, features failure detection, risk minimization, security and compliance and cost. Presenting Comparative Assessment Of Release Management Process Plan Tools Infographics PDF to dispense important information. This template comprises one stages. It also presents valuable insights into the topics including Requires Least, Coding Skills, Cost. This is a completely customizable PowerPoint theme that can be put to use immediately. So, download it and address the topic impactfully.
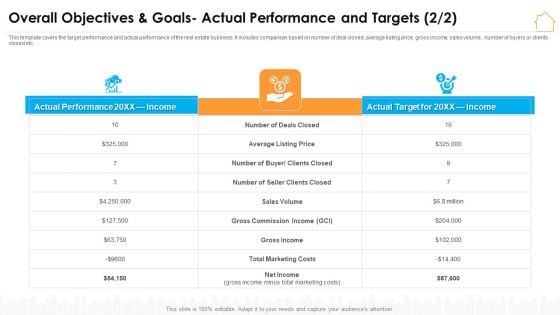
Overall Objectives And Goals Actual Performance And Targets Infographics PDF
This template covers the target performance and actual performance of the real estate business. It includes comparison based on number of deal closed, average listing price, gross income, sales volume, number of buyers or clients closed etc. Deliver and pitch your topic in the best possible manner with this overall objectives and goals actual performance and targets infographics pdf. Use them to share invaluable insights on sales volume, gross commission income, gross income and impress your audience. This template can be altered and modified as per your expectations. So, grab it now.
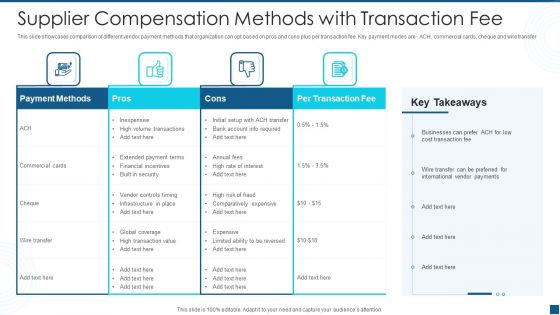
Supplier Compensation Methods With Transaction Fee Infographics PDF
This slide showcases comparison of different vendor payment methods that organization can opt based on pros and cons plus per transaction fee. Key payment modes are - ACH, commercial cards, cheque and wire transfer. Showcasing this set of slides titled supplier compensation methods with transaction fee infographics pdf. The topics addressed in these templates are payment methods, per transaction fee, commercial cards. All the content presented in this PPT design is completely editable. Download it and make adjustments in color, background, font etc. as per your unique business setting.
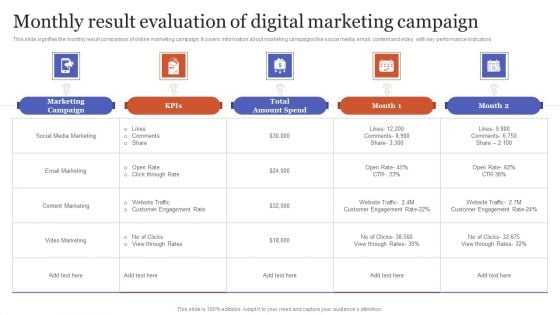
Monthly Result Evaluation Of Digital Marketing Campaign Infographics PDF
This slide signifies the monthly result comparison of online marketing campaign. It covers information about marketing campaigns like social media, email, content and video with key performance indicators . Showcasing this set of slides titled Monthly Result Evaluation Of Digital Marketing Campaign Infographics PDF. The topics addressed in these templates are Marketing Campaign, Customer Engagement, Amount Spend. All the content presented in this PPT design is completely editable. Download it and make adjustments in color, background, font etc. as per your unique business setting.
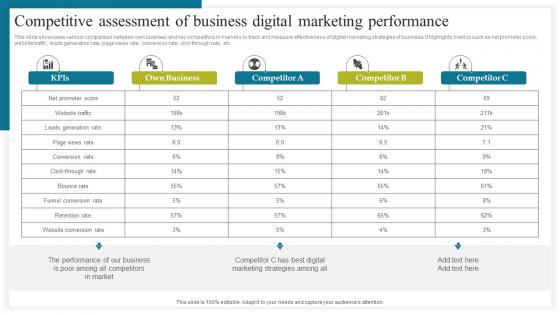
Competitive Assessment Of How To Conduct Competitive Assessment Infographics Pdf
This slide showcases various comparison between own business and key competitors in market s to track and measure effectiveness of digital marketing strategies of business. It highlights metrics such as net promoter score, website traffic, leads generation rate, page views rate, conversion rate, click through rate, etc. Find highly impressive Competitive Assessment Of How To Conduct Competitive Assessment Infographics Pdf on Slidegeeks to deliver a meaningful presentation. You can save an ample amount of time using these presentation templates. No need to worry to prepare everything from scratch because Slidegeeks experts have already done a huge research and work for you. You need to download Competitive Assessment Of How To Conduct Competitive Assessment Infographics Pdf for your upcoming presentation. All the presentation templates are 100 percent editable and you can change the color and personalize the content accordingly. Download now. This slide showcases various comparison between own business and key competitors in market s to track and measure effectiveness of digital marketing strategies of business. It highlights metrics such as net promoter score, website traffic, leads generation rate, page views rate, conversion rate, click through rate, etc.
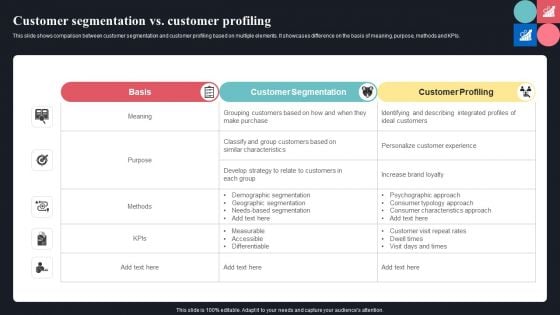
Customer Segmentation Vs Customer Profiling Ppt Infographics Guide PDF
This slide shows comparison between customer segmentation and customer profiling based on multiple elements. It showcases difference on the basis of meaning, purpose, methods and KPIs. Do you have to make sure that everyone on your team knows about any specific topic I yes, then you should give Customer Segmentation Vs Customer Profiling Ppt Infographics Guide PDF a try. Our experts have put a lot of knowledge and effort into creating this impeccable Customer Segmentation Vs Customer Profiling Ppt Infographics Guide PDF. You can use this template for your upcoming presentations, as the slides are perfect to represent even the tiniest detail. You can download these templates from the Slidegeeks website and these are easy to edit. So grab these today.
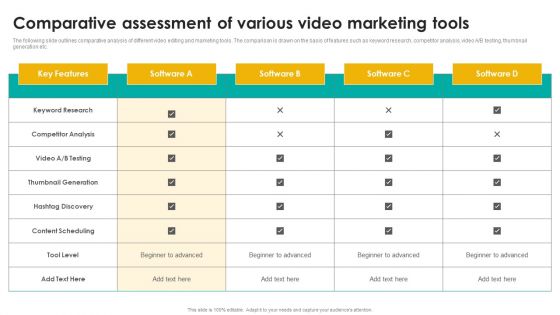
Comparative Assessment Of Various Video Marketing Tools Infographics PDF
The following slide outlines comparative analysis of different video editing and marketing tools. The comparison is drawn on the basis of features such as keyword research, competitor analysis, video A or B testing, thumbnail generation etc. This Comparative Assessment Of Various Video Marketing Tools Infographics PDF from Slidegeeks makes it easy to present information on your topic with precision. It provides customization options, so you can make changes to the colors, design, graphics, or any other component to create a unique layout. It is also available for immediate download, so you can begin using it right away. Slidegeeks has done good research to ensure that you have everything you need to make your presentation stand out. Make a name out there for a brilliant performance.
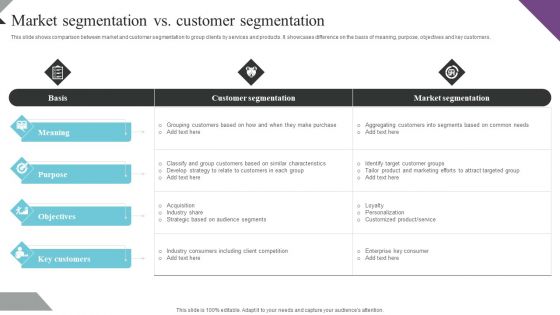
Customer Segmentation And Behavioral Analysis Market Segmentation Customer Infographics PDF
This slide shows comparison between market and customer segmentation to group clients by services and products. It showcases difference on the basis of meaning, purpose, objectives and key customers. Coming up with a presentation necessitates that the majority of the effort goes into the content and the message you intend to convey. The visuals of a PowerPoint presentation can only be effective if it supplements and supports the story that is being told. Keeping this in mind our experts created Customer Segmentation And Behavioral Analysis Market Segmentation Customer Infographics PDF to reduce the time that goes into designing the presentation. This way, you can concentrate on the message while our designers take care of providing you with the right template for the situation.
Various Ways To Reduce Staff Complaints At Workplace Infographics Pdf
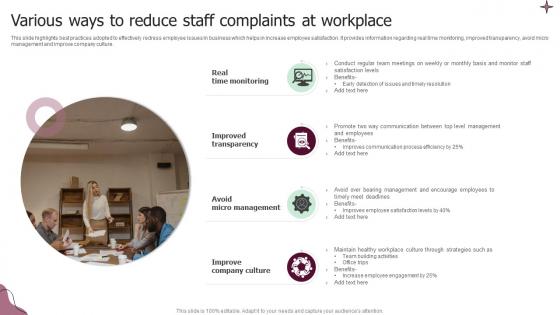
This slide highlights best practices adopted to effectively redress employee issues In business which helps in increase employee satisfaction. It provides information regarding real time monitoring, improved transparency, avoid micro management and improve company culture. Pitch your topic with ease and precision using this Various Ways To Reduce Staff Complaints At Workplace Infographics Pdf. This layout presents information on Monitoring, Improved Transparency, Management. It is also available for immediate download and adjustment. So, changes can be made in the color, design, graphics or any other component to create a unique layout. This slide highlights best practices adopted to effectively redress employee issues In business which helps in increase employee satisfaction. It provides information regarding real time monitoring, improved transparency, avoid micro management and improve company culture.
Possible Outcomes From Effective Account Methodology Infographics Pdf
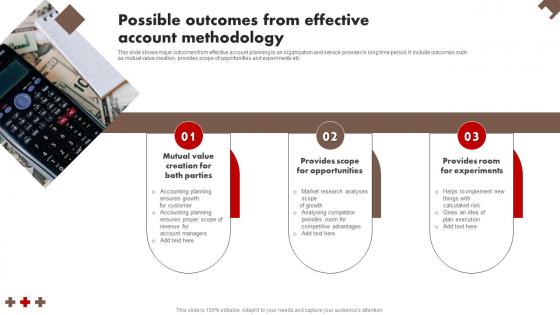
This slide shows major outcomes from effective account planning to an organization and service provider in long time period. It include outcomes such as mutual value creation, provides scope of opportunities and experiments etc Pitch your topic with ease and precision using this Possible Outcomes From Effective Account Methodology Infographics Pdf This layout presents information on Mutual Value, Provides Scope For Opportunities, Provides Room It is also available for immediate download and adjustment. So, changes can be made in the color, design, graphics or any other component to create a unique layout. This slide shows major outcomes from effective account planning to an organization and service provider in long time period. It include outcomes such as mutual value creation, provides scope of opportunities and experiments etc
5ws Of Advertising Communication Plan To Boost Sales Infographics Pdf
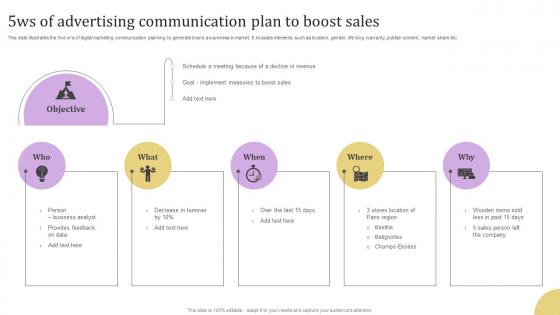
This slide illustrates the five ws of digital marketing communication planning to generate brand awareness in market. It includes elements such as location, gender, life long warranty, publish content , market share etc. Pitch your topic with ease and precision using this 5ws Of Advertising Communication Plan To Boost Sales Infographics Pdf. This layout presents information on Provides Feedback, Business Analyst, Stores Location. It is also available for immediate download and adjustment. So, changes can be made in the color, design, graphics or any other component to create a unique layout. This slide illustrates the five ws of digital marketing communication planning to generate brand awareness in market. It includes elements such as location, gender, life long warranty, publish content , market share etc.
Steps Involved In Hotel Yield Administration Process Infographics Pdf
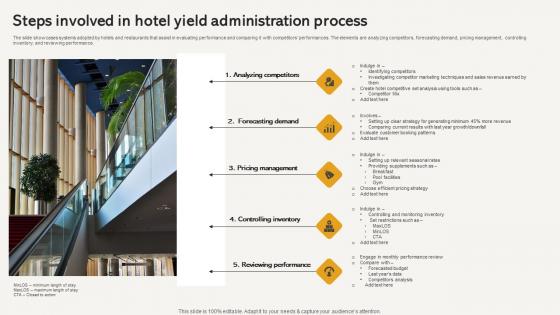
The slide showcases systems adopted by hotels and restaurants that assist in evaluating performance and comparing it with competitors performances. The elements are analyzing competitors, forecasting demand, pricing management, controlling inventory, and reviewing performance. Showcasing this set of slides titled Steps Involved In Hotel Yield Administration Process Infographics Pdf The topics addressed in these templates are Analyzing Competitors, Forecasting Demand, Pricing Management All the content presented in this PPT design is completely editable. Download it and make adjustments in color, background, font etc. as per your unique business setting. The slide showcases systems adopted by hotels and restaurants that assist in evaluating performance and comparing it with competitors performances. The elements are analyzing competitors, forecasting demand, pricing management, controlling inventory, and reviewing performance.
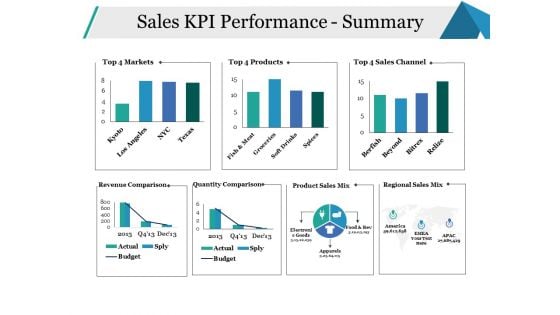
Sales KPI Performance Summary Ppt PowerPoint Presentation Infographics Model
This is a sales kpi performance summary ppt powerpoint presentation infographics model. This is a seven stage process. The stages in this process are sales channel, revenue comparison, quantity comparison, business, marketing.
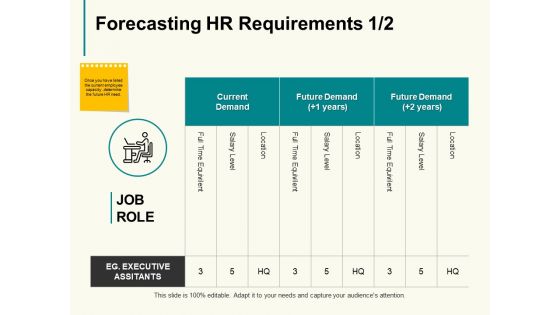
Forecasting Hr Requirements Ppt PowerPoint Presentation Infographics Templates
This is a forecasting hr requirements ppt powerpoint presentation infographics templates. This is a three stage process. The stages in this process are comparison, male, female, marketing, strategy.
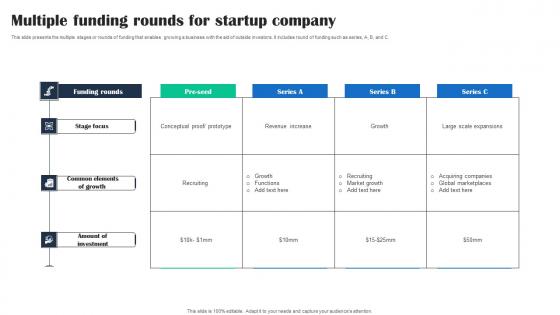
Multiple Funding Rounds For Startup Company Infographics Pdf
This slide presents the multiple stages or rounds of funding that enables growing a business with the aid of outside investors. It includes round of funding such as series, A, B, and C. Pitch your topic with ease and precision using this Multiple Funding Rounds For Startup Company Infographics Pdf. This layout presents information on Funding Rounds, Company, Funding. It is also available for immediate download and adjustment. So, changes can be made in the color, design, graphics or any other component to create a unique layout. This slide presents the multiple stages or rounds of funding that enables growing a business with the aid of outside investors. It includes round of funding such as series, A, B, and C.
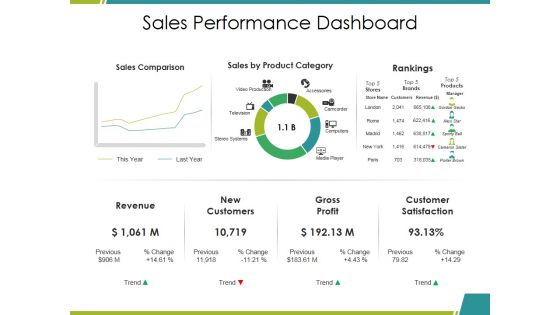
Sales Performance Dashboard Ppt PowerPoint Presentation Infographics Mockup
This is a sales performance dashboard ppt powerpoint presentation infographics mockup. This is a three stage process. The stages in this process are sales comparison, sales by product category, rankings, revenue, gross profit.
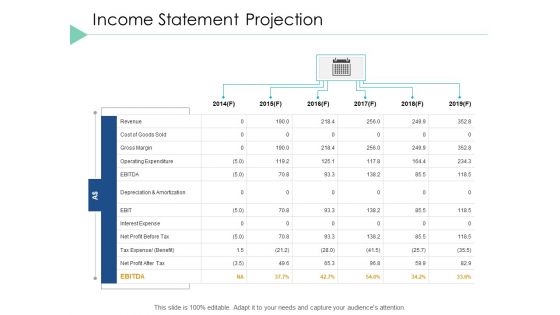
Income Statement Projection Business Ppt PowerPoint Presentation Infographics Slideshow
This is a income statement projection business ppt powerpoint presentation infographics slideshow. This is a three stage process. The stages in this process are comparison, planning, marketing, finance, strategy.
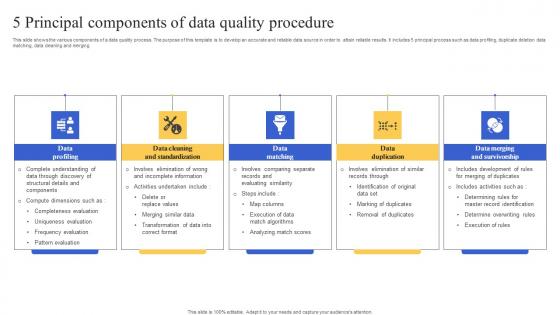
5 Principal Components Of Data Quality Procedure Infographics Pdf
This slide shows the various components of a data quality process. The purpose of this template is to develop an accurate and reliable data source in order to attain reliable results. It includes 5 principal process such as data profiling, duplicate deletion data matching, data cleaning and merging. Pitch your topic with ease and precision using this 5 Principal Components Of Data Quality Procedure Infographics Pdf. This layout presents information on Data Profiling, Data Matching, Data Duplication, Data Merging And Survivorship. It is also available for immediate download and adjustment. So, changes can be made in the color, design, graphics or any other component to create a unique layout. This slide shows the various components of a data quality process. The purpose of this template is to develop an accurate and reliable data source in order to attain reliable results. It includes 5 principal process such as data profiling, duplicate deletion data matching, data cleaning and merging.
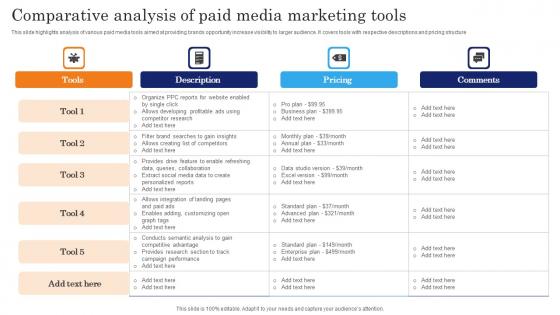
Comparative Analysis Of Paid Media Marketing Tools Infographics Pdf
This slide highlights analysis of various paid media tools aimed at providing brands opportunity increase visibility to larger audience. It covers tools with respective descriptions and pricing structure Showcasing this set of slides titled Comparative Analysis Of Paid Media Marketing Tools Infographics Pdf. The topics addressed in these templates are Description, Pricing, Comments. All the content presented in this PPT design is completely editable. Download it and make adjustments in color, background, font etc. as per your unique business setting. This slide highlights analysis of various paid media tools aimed at providing brands opportunity increase visibility to larger audience. It covers tools with respective descriptions and pricing structure
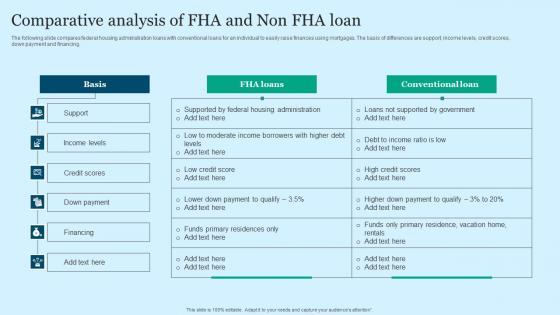
Comparative Analysis Of FHA And Non FHA Loan Infographics Pdf
The following slide compares federal housing administration loans with conventional loans for an individual to easily raise finances using mortgages. The basis of differences are support, income levels, credit scores, down payment and financing. Pitch your topic with ease and precision using this Comparative Analysis Of FHA And Non FHA Loan Infographics Pdf. This layout presents information on Basis, Loans, Conventional Loan. It is also available for immediate download and adjustment. So, changes can be made in the color, design, graphics or any other component to create a unique layout. The following slide compares federal housing administration loans with conventional loans for an individual to easily raise finances using mortgages. The basis of differences are support, income levels, credit scores, down payment and financing.


 Continue with Email

 Home
Home


