Comparison Infographic

Digital Marketing Assets Of The Company Ppt Infographics Format PDF
Deliver an awe inspiring pitch with this creative Digital Marketing Assets Of The Company Ppt Infographics Format Pdf bundle. Topics like branded assets, product, infographics, social media pages can be discussed with this completely editable template. It is available for immediate download depending on the needs and requirements of the user.
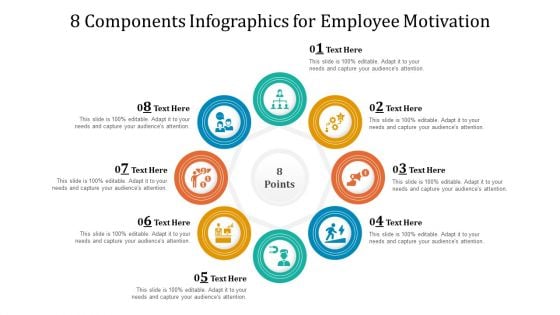
8 Components Infographics For Employee Motivation Ppt Slides Microsoft PDF
Persuade your audience using this 8 components infographics for employee motivation ppt slides microsoft pdf. This PPT design covers eight stages, thus making it a great tool to use. It also caters to a variety of topics including 8 components infographics for employee motivation. Download this PPT design now to present a convincing pitch that not only emphasizes the topic but also showcases your presentation skills.
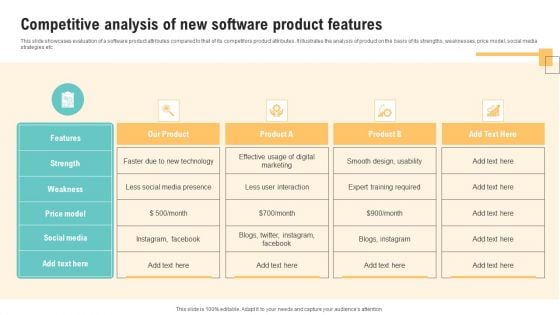
Competitive Analysis Of New Software Product Features Infographics PDF
This slide showcases evaluation of a software product attributes compared to that of its competitors product attributes. It illustrates the analysis of product on the basis of its strengths, weaknesses, price model, social media strategies etc. Showcasing this set of slides titled Competitive Analysis Of New Software Product Features Infographics PDF. The topics addressed in these templates are Features, Strength, Weakness, Social Media. All the content presented in this PPT design is completely editable. Download it and make adjustments in color, background, font etc. as per your unique business setting.
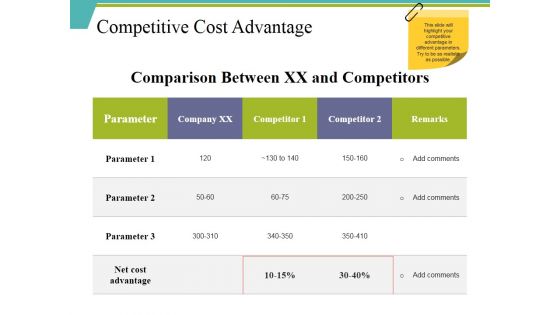
Competitive Cost Advantage Ppt PowerPoint Presentation Infographics Ideas
This is a competitive cost advantage ppt powerpoint presentation infographics ideas. This is a three stage process. The stages in this process are parameter, company, competitor, remarks, net cost advantage.
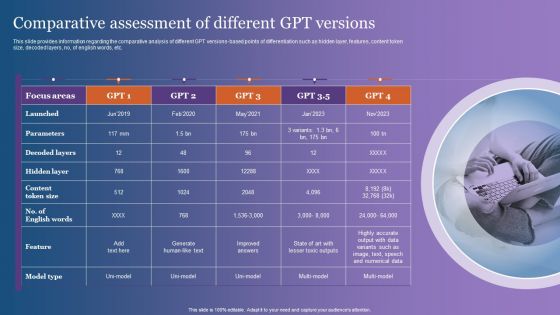
Comparative Assessment Of Different GPT Versions Infographics PDF
This slide provides information regarding the comparative analysis of different GPT versions-based points of differentiation such as hidden layer, features, content token size, decoded layers, no, of english words, etc. Presenting this PowerPoint presentation, titled Comparative Assessment Of Different GPT Versions Infographics PDF, with topics curated by our researchers after extensive research. This editable presentation is available for immediate download and provides attractive features when used. Download now and captivate your audience. Presenting this Comparative Assessment Of Different GPT Versions Infographics PDF. Our researchers have carefully researched and created these slides with all aspects taken into consideration. This is a completely customizable Comparative Assessment Of Different GPT Versions Infographics PDF that is available for immediate downloading. Download now and make an impact on your audience. Highlight the attractive features available with our PPTs.
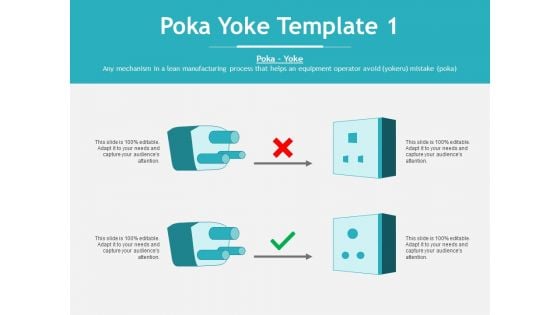
Poka Yoke Management Ppt PowerPoint Presentation Infographics Rules
This is a poka yoke management ppt powerpoint presentation infographics rules. This is a two stage process. The stages in this process are business, planning, strategy, marketing, management.
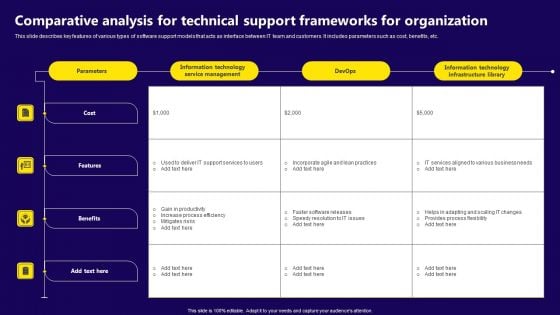
Comparative Analysis For Technical Support Frameworks For Organization Infographics PDF
This slide describes key features of various types of software support models that acts as interface between IT team and customers. It includes parameters such as cost, benefits, etc. Showcasing this set of slides titled Comparative Analysis For Technical Support Frameworks For Organization Infographics PDF. The topics addressed in these templates are Gain In Productivity, Increase Process Efficiency, Mitigates Risks . All the content presented in this PPT design is completely editable. Download it and make adjustments in color, background, font etc. as per your unique business setting.
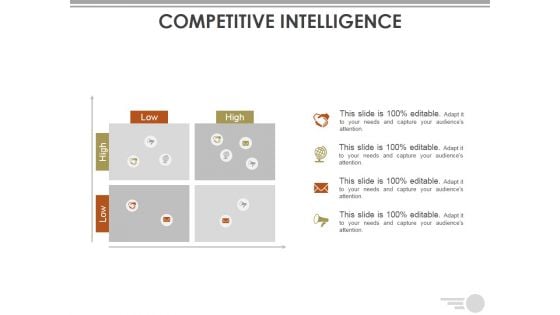
Competitive Intelligence Ppt PowerPoint Presentation Infographics Visual Aids
This is a competitive intelligence ppt powerpoint presentation infographics visual aids. This is a seven stage process. The stages in this process are business, marketing, tables, data, analysis.
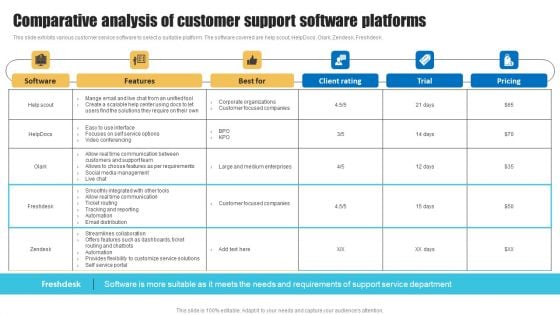
Comparative Analysis Of Customer Support Software Platforms Infographics PDF
This slide exhibits various customer service software to select a suitable platform. The software covered are help scout, HelpDocs, Olark, Zendesk, Freshdesk. If you are looking for a format to display your unique thoughts, then the professionally designed Comparative Analysis Of Customer Support Software Platforms Infographics PDF is the one for you. You can use it as a Google Slides template or a PowerPoint template. Incorporate impressive visuals, symbols, images, and other charts. Modify or reorganize the text boxes as you desire. Experiment with shade schemes and font pairings. Alter, share or cooperate with other people on your work. Download Comparative Analysis Of Customer Support Software Platforms Infographics PDF and find out how to give a successful presentation. Present a perfect display to your team and make your presentation unforgettable.
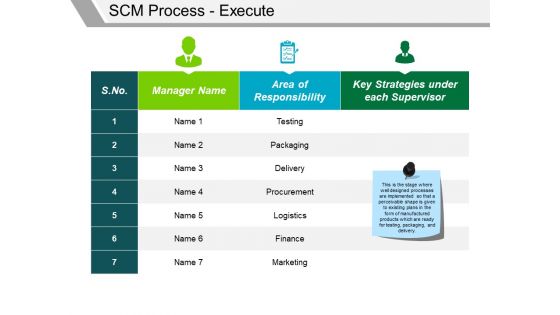
Scm Process Execute Ppt PowerPoint Presentation Infographics Guidelines
This is a scm process execute ppt powerpoint presentation infographics guidelines. This is a two stage process. The stages in this process are testing, packaging, delivery, procurement, logistics.
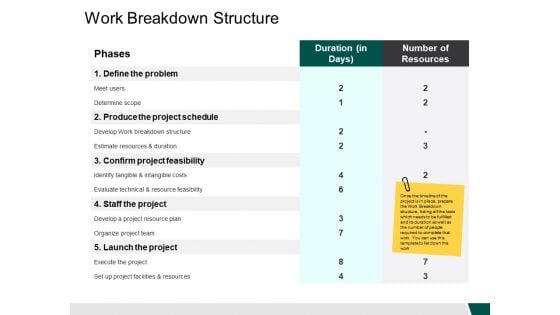
Work Breakdown Structure Ppt PowerPoint Presentation Infographics Brochure
This is a work breakdown structure ppt powerpoint presentation infographics brochure. This is a two stage process. The stages in this process are business, management, strategy, analysis, marketing.
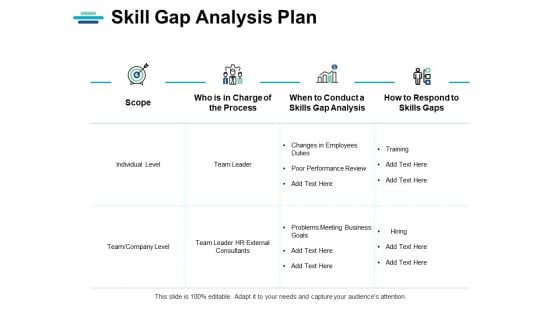
Skill Gap Analysis Plan Ppt PowerPoint Presentation Infographics Examples
This is a skill gap analysis plan ppt powerpoint presentation infographics examples. This is a four stage process. The stages in this process are compare, marketing, business, management, planning.
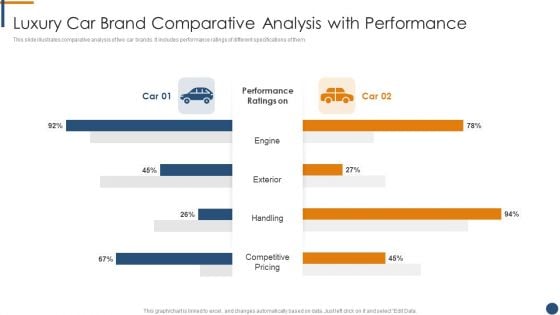
Luxury Car Brand Comparative Analysis With Performance Infographics PDF
This slide illustrates comparative analysis of two car brands. It includes performance ratings of different specifications of them.Showcasing this set of slides titled Luxury Car Brand Comparative Analysis With Performance Infographics PDF. The topics addressed in these templates are Competitive Pricing, Exterior, Engine. All the content presented in this PPT design is completely editable. Download it and make adjustments in color, background, font etc. as per your unique business setting.
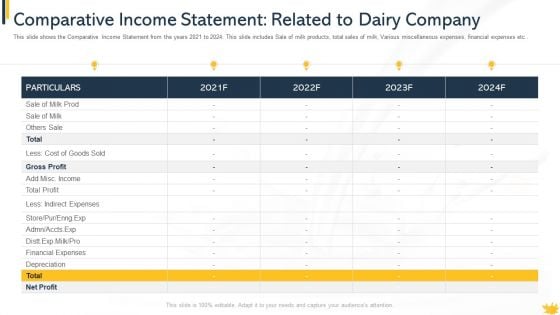
Comparative Income Statement Related To Dairy Company Infographics PDF
This slide shows the Comparative Income Statement from the years 2021 to 2024. This slide includes Sale of milk products, total sales of milk, Various miscellaneous expenses, financial expenses etc.Deliver an awe inspiring pitch with this creative comparative income statement related to dairy company infographics pdf bundle. Topics like sale of milk prod, financial expenses, particulars can be discussed with this completely editable template. It is available for immediate download depending on the needs and requirements of the user.
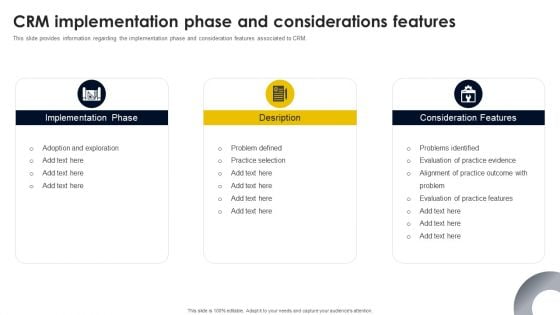
CRM Implementation Phase And Considerations Features Infographics PDF
This slide provides information regarding the implementation phase and consideration features associated to CRM. Whether you have daily or monthly meetings, a brilliant presentation is necessary. CRM Implementation Phase And Considerations Features Infographics PDF can be your best option for delivering a presentation. Represent everything in detail using CRM Implementation Phase And Considerations Features Infographics PDF and make yourself stand out in meetings. The template is versatile and follows a structure that will cater to your requirements. All the templates prepared by Slidegeeks are easy to download and edit. Our research experts have taken care of the corporate themes as well. So, give it a try and see the results.
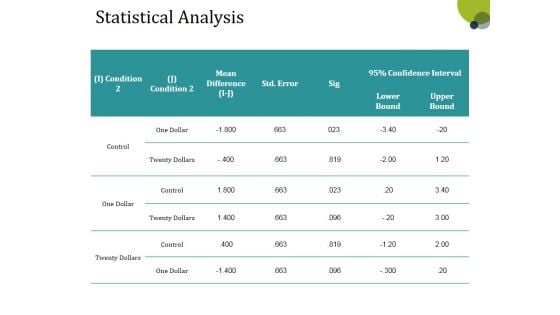
Statistical Analysis Template 1 Ppt PowerPoint Presentation Infographics Show
This is a statistical analysis template 1 ppt powerpoint presentation infographics show. This is a three stage process. The stages in this process are one dollar, control, condition, lower bound, upper bound.
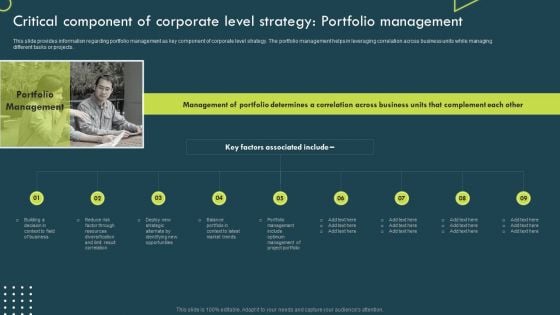
Critical Component Of Corporate Level Strategy Portfolio Management Infographics PDF
This slide provides information regarding portfolio management as key component of corporate level strategy. The portfolio management helps in leveraging correlation across business units while managing different tasks or projects. Present like a pro with Critical Component Of Corporate Level Strategy Portfolio Management Infographics PDF Create beautiful presentations together with your team, using our easy-to-use presentation slides. Share your ideas in real-time and make changes on the fly by downloading our templates. So whether you are in the office, on the go, or in a remote location, you can stay in sync with your team and present your ideas with confidence. With Slidegeeks presentation got a whole lot easier. Grab these presentations today.
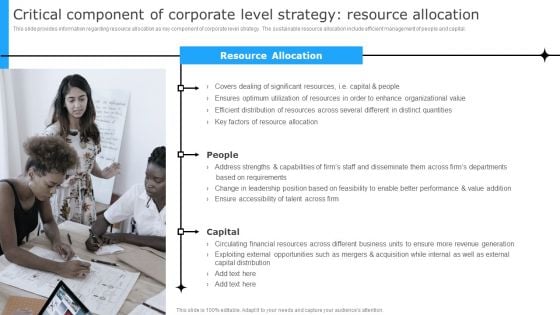
Critical Component Of Corporate Level Strategy Resource Allocation Infographics PDF
This slide provides information regarding resource allocation as key component of corporate level strategy. The sustainable resource allocation include efficient management of people and capital. Create an editable Critical Component Of Corporate Level Strategy Resource Allocation Infographics PDF that communicates your idea and engages your audience. Whether you are presenting a business or an educational presentation, pre designed presentation templates help save time. Critical Component Of Corporate Level Strategy Resource Allocation Infographics PDF is highly customizable and very easy to edit, covering many different styles from creative to business presentations. Slidegeeks has creative team members who have crafted amazing templates. So, go and get them without any delay.
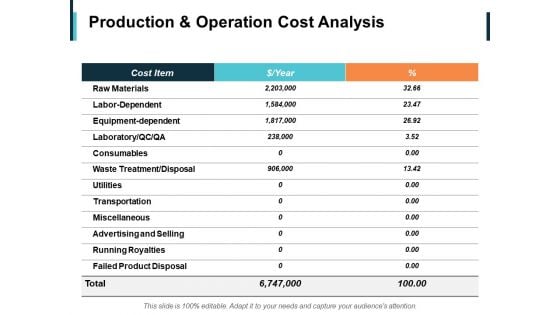
Production And Operation Cost Analysis Ppt PowerPoint Presentation Infographics Samples
This is a production and operation cost analysis ppt powerpoint presentation infographics samples. This is a three stage process. The stages in this process are utilities, transportation, miscellaneous, advertising and selling, running royalties.
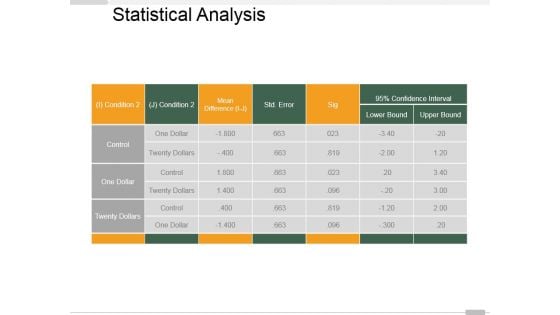
Statistical Analysis Template 2 Ppt PowerPoint Presentation Infographics Deck
This is a statistical analysis template 2 ppt powerpoint presentation infographics deck. This is a two stage process. The stages in this process are control, one dollar, twenty dollars, lower bound, upper bound.

Product Analysis Example Ppt Powerpoint Presentation Infographics Clipart
This is a product analysis example ppt powerpoint presentation infographics clipart. This is a three stage process. The stages in this process are product analysis example, attributes, customers rating, durability years, high temperature resistance.
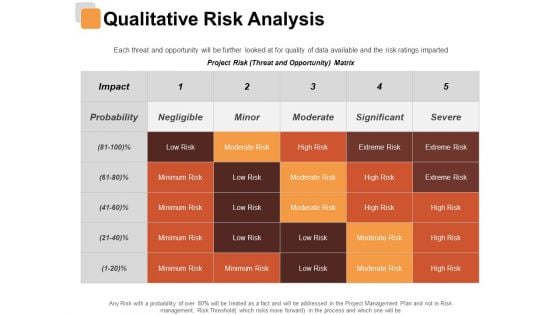
Qualitative Risk Analysis Risk Estimator Ppt PowerPoint Presentation Infographics Gallery
This is a qualitative risk analysis risk estimator ppt powerpoint presentation infographics gallery. This is a five stage process. The stages in this process are business, management, strategy, analysis, marketing.
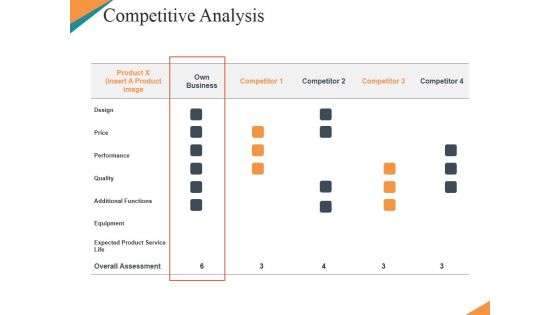
Competitive Analysis Ppt PowerPoint Presentation Infographics Format Ideas
This is a competitive analysis ppt powerpoint presentation infographics format ideas. This is a four stage process. The stages in this process are own business, competitor, price, quality, additional functions.
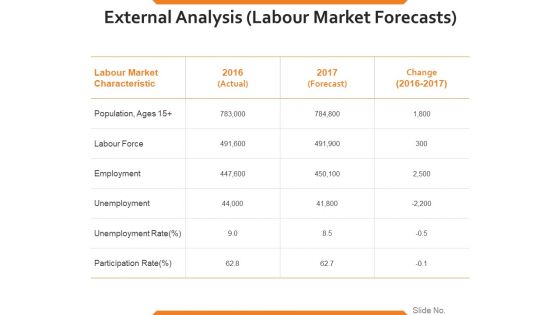
External Analysis Labour Market Forecasts Ppt PowerPoint Presentation Infographics Outfit
This is a external analysis labour market forecasts ppt powerpoint presentation infographics outfit. This is a three stage process. The stages in this process are labour force, employment, unemployment, unemployment rate, participation rate.
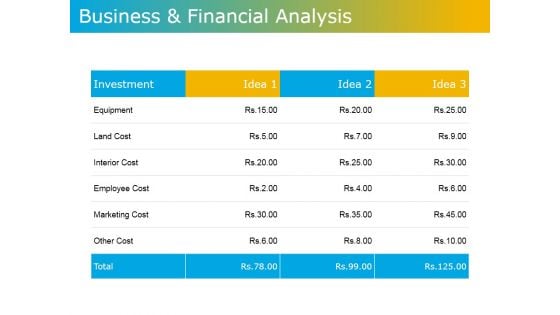
Business And Financial Analysis Ppt PowerPoint Presentation Infographics Slide Portrait
This is a business and financial analysis ppt powerpoint presentation infographics slide portrait. This is a three stage process. The stages in this process are investment, land cost, equipment, employee cost, marketing cost, other cost.
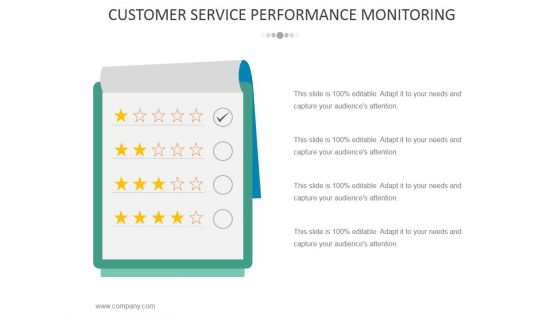
Customer Service Performance Monitoring Ppt PowerPoint Presentation Infographics Format
This is a customer service performance monitoring ppt powerpoint presentation infographics format. This is a four stage process. The stages in this process are business, strategy, marketing, analysis, finance, compare.
Product Features Vector Icon Ppt PowerPoint Presentation Infographics Clipart
Presenting this set of slides with name product features vector icon ppt powerpoint presentation infographics clipart. This is a three stage process. The stages in this process are product features vector icon. This is a completely editable PowerPoint presentation and is available for immediate download. Download now and impress your audience.
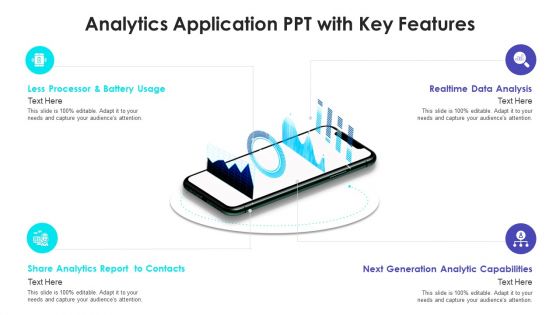
Analytics Application PPT With Key Features Infographics PDF
Presenting analytics application ppt with key features infographics pdf to dispense important information. This template comprises four stages. It also presents valuable insights into the topics including analytics application ppt with key features. This is a completely customizable PowerPoint theme that can be put to use immediately. So, download it and address the topic impactfully.
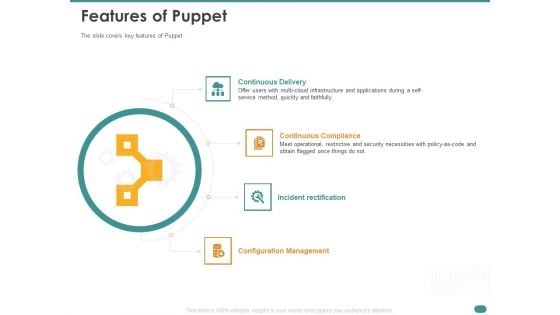
Configuration Management With Puppet Features Of Puppet Infographics PDF
Presenting this set of slides with name configuration management with puppet features of puppet infographics pdf. This is a four stage process. The stages in this process are continuous delivery, continuous compliance, incident rectification, configuration management. This is a completely editable PowerPoint presentation and is available for immediate download. Download now and impress your audience.

Git Overview Features Of Git Ppt Infographics Visuals PDF
Presenting this set of slides with name git overview features of git ppt infographics visuals pdf. This is a four stage process. The stages in this process are scalability, open source, security, speed. This is a completely editable PowerPoint presentation and is available for immediate download. Download now and impress your audience.

Business Environment Components PESTEL Analysis Ppt Infographics Styles PDF
Presenting this set of slides with name business environment components pestel analysis ppt infographics styles pdf. The topics discussed in these slides are political, economics, social, technological, environment, legislation . This is a completely editable PowerPoint presentation and is available for immediate download. Download now and impress your audience.
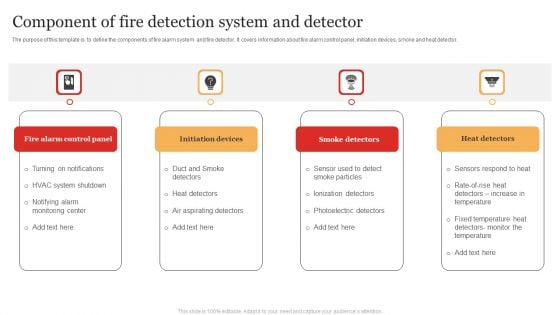
Component Of Fire Detection System And Detector Infographics PDF
Presenting Component Of Fire Detection System And Detector Infographics PDF to dispense important information. This template comprises four stages. It also presents valuable insights into the topics including Initiation Devices, Smoke Detectors, Heat Detectors . This is a completely customizable PowerPoint theme that can be put to use immediately. So, download it and address the topic impactfully.
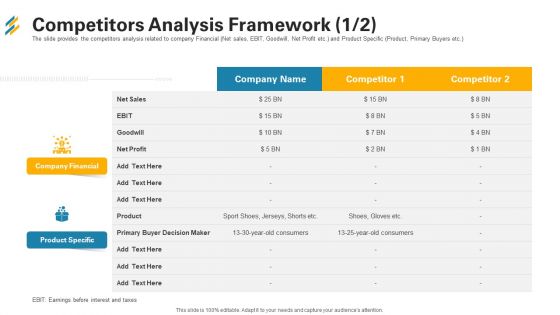
Competitors Analysis Framework Profit Ppt Infographics Graphics Tutorials PDF
The slide provides the competitors analysis related to company Financial Net sales, EBIT, Goodwill, Net Profit etc. and Product Specific Product, Primary Buyers etc. Deliver and pitch your topic in the best possible manner with this competitors analysis framework profit ppt infographics graphics tutorials pdf. Use them to share invaluable insights on net sales, net profit, company financial, product specific and impress your audience. This template can be altered and modified as per your expectations. So, grab it now.
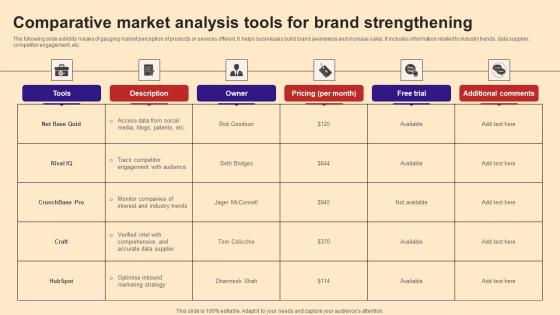
Comparative Market Analysis Tools For Brand Strengthening Infographics Pdf
The following slide exhibits means of gauging market perception of products or services offered. It helps businesses build brand awareness and increase sales. It includes information related to industry trends, data supplier, competitor engagement, etc.Pitch your topic with ease and precision using this Comparative Market Analysis Tools For Brand Strengthening Infographics Pdf This layout presents information on Engagement Audience, Accurate Data Supplier, Track Competitor It is also available for immediate download and adjustment. So, changes can be made in the color, design, graphics or any other component to create a unique layout. The following slide exhibits means of gauging market perception of products or services offered. It helps businesses build brand awareness and increase sales. It includes information related to industry trends, data supplier, competitor engagement, etc.
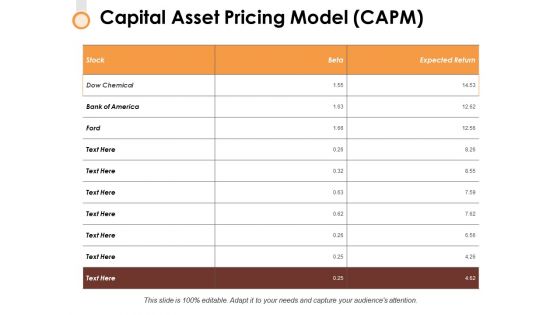
Capital Asset Pricing Model Capm Ppt PowerPoint Presentation Infographics Ideas
This is a capital asset pricing model capm ppt powerpoint presentation infographics ideas. This is a nine stage process. The stages in this process are analysis, strategy, marketing, compare, business.
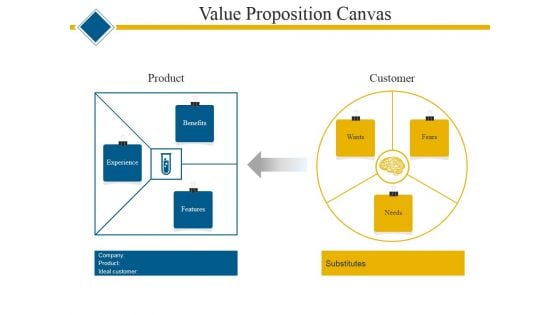
Value Proposition Canvas Ppt PowerPoint Presentation Infographics Example
This is a value proposition canvas ppt powerpoint presentation infographics example. This is a two stage process. The stages in this process are product, customer, benefits, features, experience, wants, fears, needs.
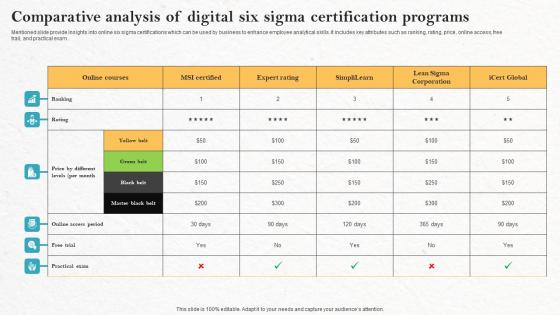
Comparative Analysis Of Digital Six Sigma Certification Programs Infographics Pdf
Mentioned slide provide insights into online six sigma certifications which can be used by business to enhance employee analytical skills. It includes key attributes such as ranking, rating, price, online access, free trail, and practical exam. Showcasing this set of slides titled Comparative Analysis Of Digital Six Sigma Certification Programs Infographics Pdf. The topics addressed in these templates are Comparative Analysis, Digital Six Sigma, Certification Programs, Practical Exam. All the content presented in this PPT design is completely editable. Download it and make adjustments in color, background, font etc. as per your unique business setting. Mentioned slide provide insights into online six sigma certifications which can be used by business to enhance employee analytical skills. It includes key attributes such as ranking, rating, price, online access, free trail, and practical exam.
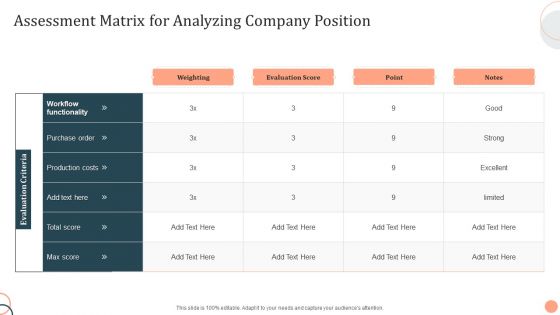
Assessment Matrix For Analyzing Company Position Infographics PDF
Pitch your topic with ease and precision using this Assessment Matrix For Analyzing Company Position Infographics PDF. This layout presents information on Production Costs, Purchase Order, Evaluation Criteria. It is also available for immediate download and adjustment. So, changes can be made in the color, design, graphics or any other component to create a unique layout.
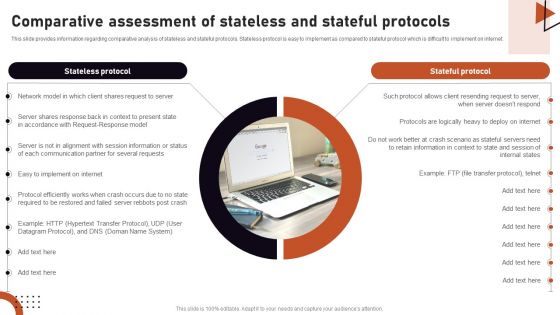
Iot Related Communication Strategies Comparative Assessment Of Stateless Infographics PDF
This slide provides information regarding comparative analysis of stateless and stateful protocols. Stateless protocol is easy to implement as compared to stateful protocol which is difficult to implement on internet. Find highly impressive Iot Related Communication Strategies Comparative Assessment Of Stateless Infographics PDF on Slidegeeks to deliver a meaningful presentation. You can save an ample amount of time using these presentation templates. No need to worry to prepare everything from scratch because Slidegeeks experts have already done a huge research and work for you. You need to download Iot Related Communication Strategies Comparative Assessment Of Stateless Infographics PDF for your upcoming presentation. All the presentation templates are 100 percent editable and you can change the color and personalize the content accordingly. Download now
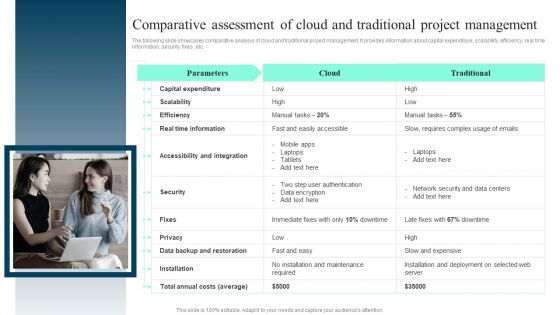
Comparative Assessment Of Cloud And Traditional Project Management Infographics PDF
The following slide showcases comparative analysis of cloud and traditional project management. It provides information about capital expenditure, scalability, efficiency, real time information, security, fixes, etc. Here you can discover an assortment of the finest PowerPoint and Google Slides templates. With these templates, you can create presentations for a variety of purposes while simultaneously providing your audience with an eye catching visual experience. Download Comparative Assessment Of Cloud And Traditional Project Management Infographics PDF to deliver an impeccable presentation. These templates will make your job of preparing presentations much quicker, yet still, maintain a high level of quality. Slidegeeks has experienced researchers who prepare these templates and write high quality content for you. Later on, you can personalize the content by editing the Comparative Assessment Of Cloud And Traditional Project Management Infographics PDF.
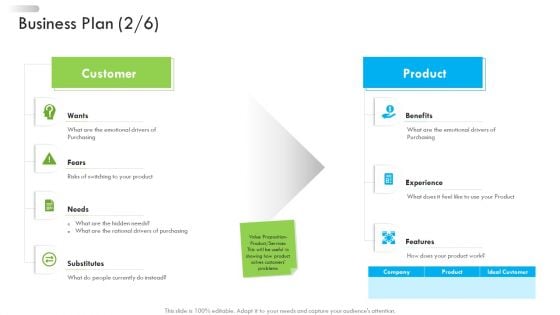
Enterprise Tactical Planning Business Plan Benefits Ppt Infographics Diagrams PDF
Deliver an awe-inspiring pitch with this creative enterprise tactical planning business plan benefits ppt infographics diagrams pdf bundle. Topics like customer, product can be discussed with this completely editable template. It is available for immediate download depending on the needs and requirements of the user.
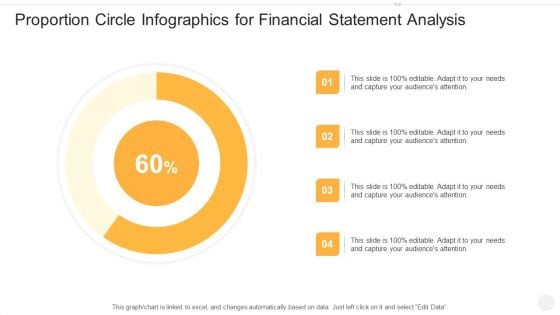
Proportion Circle Infographics For Financial Statement Analysis Mockup PDF
Pitch your topic with ease and precision using this proportion circle infographics for financial statement analysis mockup pdf. This layout presents information on proportion circle infographics for financial statement analysis. It is also available for immediate download and adjustment. So, changes can be made in the color, design, graphics or any other component to create a unique layout.
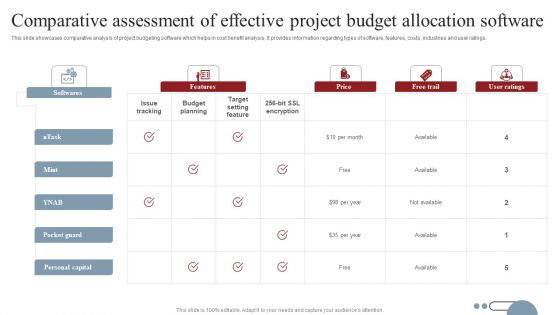
Comparative Assessment Of Effective Project Budget Allocation Software Infographics PDF
This slide showcases comparative analysis of project budgeting software which helps in cost benefit analysis. It provides information regarding types of software, features, costs, industries and user ratings. Showcasing this set of slides titled Comparative Assessment Of Effective Project Budget Allocation Software Infographics PDF. The topics addressed in these templates are Budget Planning, Target Setting Feature, Issue Tracking. All the content presented in this PPT design is completely editable. Download it and make adjustments in color, background, font etc. as per your unique business setting.
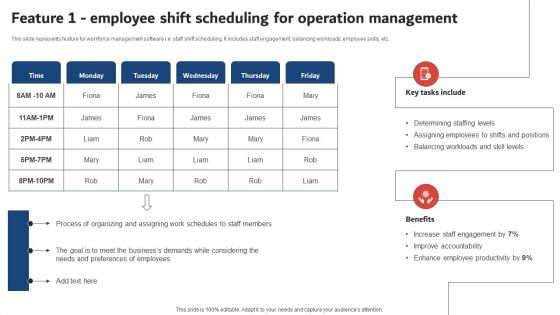
Feature 1 Employee Shift Scheduling For Operation Management Infographics PDF
This slide represents feature for workforce management software i.e. staff shift scheduling. It includes staff engagement, balancing workloads, employee skills, etc. Whether you have daily or monthly meetings, a brilliant presentation is necessary. Feature 1 Employee Shift Scheduling For Operation Management Infographics PDF can be your best option for delivering a presentation. Represent everything in detail using Feature 1 Employee Shift Scheduling For Operation Management Infographics PDF and make yourself stand out in meetings. The template is versatile and follows a structure that will cater to your requirements. All the templates prepared by Slidegeeks are easy to download and edit. Our research experts have taken care of the corporate themes as well. So, give it a try and see the results.

Donut Pie Chart Ppt PowerPoint Presentation Infographics Outfit
This is a donut pie chart ppt powerpoint presentation infographics outfit. This is a three stage process. The stages in this process are business, strategy, analysis, planning, dashboard, finance.
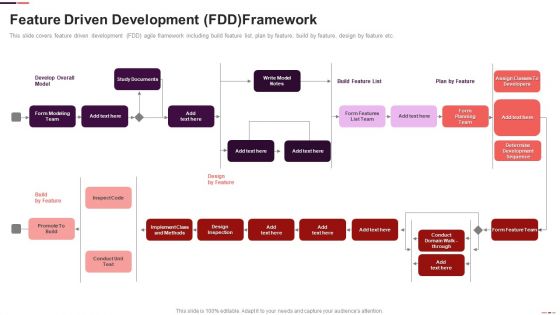
Feature Driven Development FDD Framework Ppt Infographics Diagrams PDF
This slide covers feature driven development FDD agile framework including build feature list, plan by feature, build by feature, design by feature etc. Deliver and pitch your topic in the best possible manner with this Feature Driven Development FDD Framework Ppt Infographics Diagrams PDF. Use them to share invaluable insights on Methods, Implement, Team and impress your audience. This template can be altered and modified as per your expectations. So, grab it now.
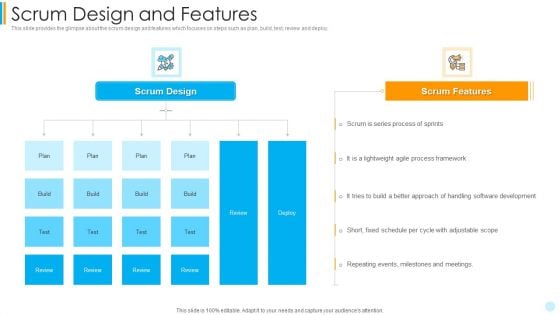
Scrum Development Model Scrum Design And Features Infographics PDF
This slide provides the glimpse about the scrum design and features which focuses on steps such as plan, build, test, review and deploy. Deliver an awe inspiring pitch with this creative scrum development model scrum design and features infographics pdf bundle. Topics like development, process framework, scrum design, scrum features can be discussed with this completely editable template. It is available for immediate download depending on the needs and requirements of the user.
Features Equity Market Ppt PowerPoint Presentation Infographics Objects Cpb
Presenting this set of slides with name features equity market ppt powerpoint presentation infographics objects cpb. This is an editable Powerpoint eight stages graphic that deals with topics like features equity market to help convey your message better graphically. This product is a premium product available for immediate download and is 100 percent editable in Powerpoint. Download this now and use it in your presentations to impress your audience.
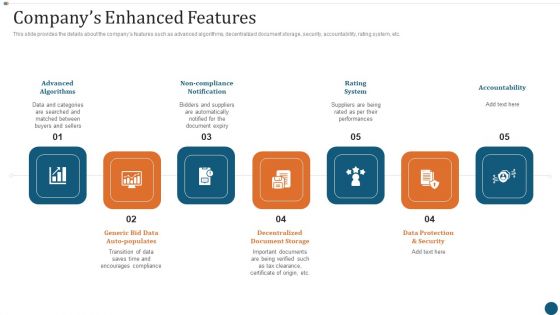
Strategic Sourcing Plan Companys Enhanced Features Infographics PDF
This slide provides the details about the companys features such as advanced algorithms, decentralized document storage, security, accountability, rating system, etc. Presenting strategic sourcing plan companys enhanced features infographics pdf to provide visual cues and insights. Share and navigate important information on seven stages that need your due attention. This template can be used to pitch topics like advanced algorithms, rating system, accountability. In addition, this PPT design contains high resolution images, graphics, etc, that are easily editable and available for immediate download.
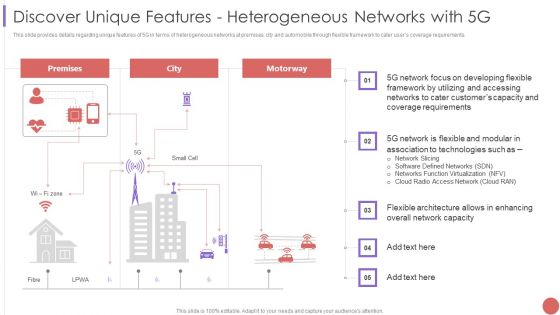
Discover Unique Features Heterogeneous Networks With 5G Infographics PDF
This slide provides details regarding unique features of 5G in terms of heterogeneous networks at premises, city and automobile through flexible framework to cater users coverage requirements.Deliver and pitch your topic in the best possible manner with this Discover Unique Features Heterogeneous Networks With 5G Infographics PDF Use them to share invaluable insights on Developing Flexible, Utilizing And Accessing, Coverage Requirements and impress your audience. This template can be altered and modified as per your expectations. So, grab it now.
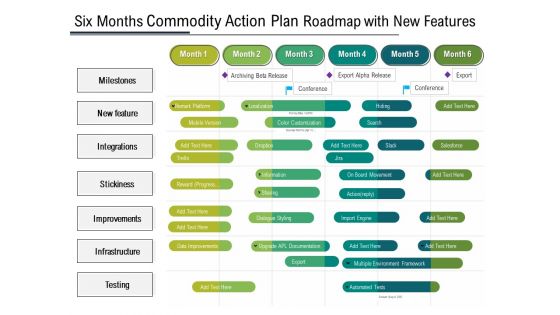
Six Months Product Strategy Roadmap With New Features Infographics
Presenting our innovatively-structured six months product strategy roadmap with new features infographics Template. Showcase your roadmap process in different formats like PDF, PNG, and JPG by clicking the download button below. This PPT design is available in both Standard Screen and Widescreen aspect ratios. It can also be easily personalized and presented with modified font size, font type, color, and shapes to measure your progress in a clear way.
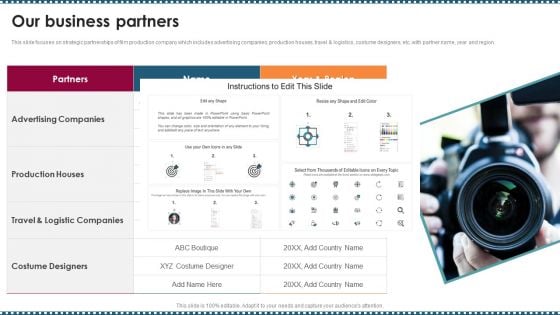
Feature Film Production Company Profile Our Business Partners Infographics PDF
This slide focuses on strategic partnerships of film production company which includes advertising companies, production houses, travel logistics, costume designers, etc. with partner name, year and region.Deliver and pitch your topic in the best possible manner with this Feature Film Production Company Profile Our Business Partners Infographics PDF Use them to share invaluable insights on Advertising Companies, Production Houses, Costume Designers and impress your audience. This template can be altered and modified as per your expectations. So, grab it now.
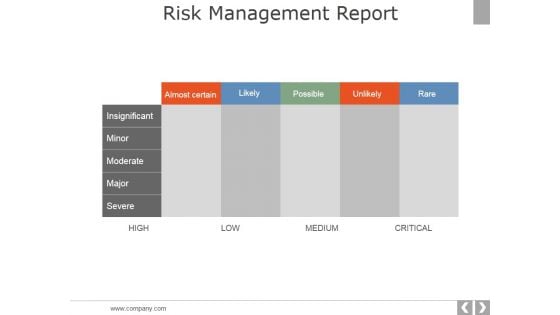
Risk Management Report Template 2 Ppt PowerPoint Presentation Infographics Brochure
This is a risk management report template 2 ppt powerpoint presentation infographics brochure. This is a five stage process. The stages in this process are insignificant, minor, moderate, major, severe.
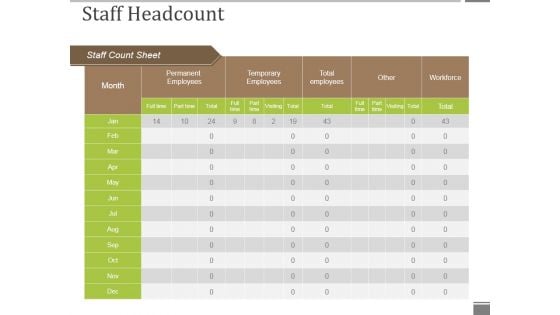
Staff Headcount Ppt PowerPoint Presentation Infographics Example Introduction
This is a staff headcount ppt powerpoint presentation infographics example introduction. This is a five stage process. The stages in this process are permanent employees, month, staff count sheet, other, total employees, temporary employees.
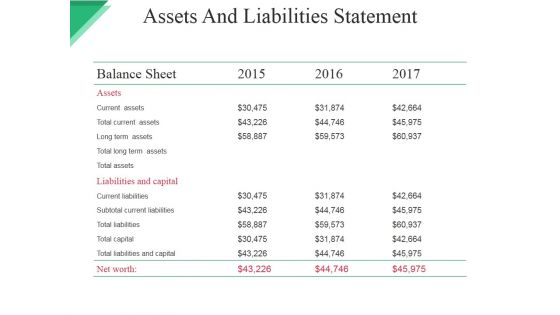
Assets And Liabilities Statement Ppt PowerPoint Presentation Infographics Shapes
This is a assets and liabilities statement ppt powerpoint presentation infographics shapes. This is a three stage process. The stages in this process are balance sheet, current assets, total current assets, long term assets, total long term assets.
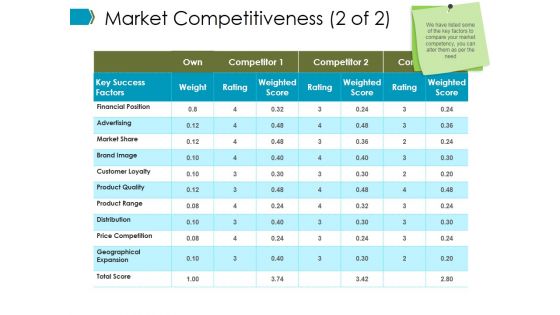
Market Competitiveness Template 1 Ppt PowerPoint Presentation Infographics Vector
This is a market competitiveness template 1 ppt powerpoint presentation infographics vector. This is a three stage process. The stages in this process are key success factors, weight, rating, weighted score.
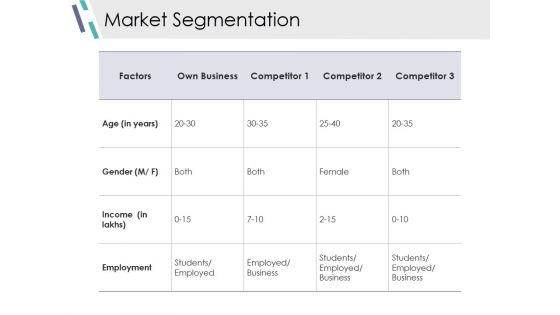
Market Segmentation Ppt PowerPoint Presentation Infographics Background Image
This is a market segmentation ppt powerpoint presentation infographics background image. This is a four stage process. The stages in this process are factors, own business, age, gender, employment.
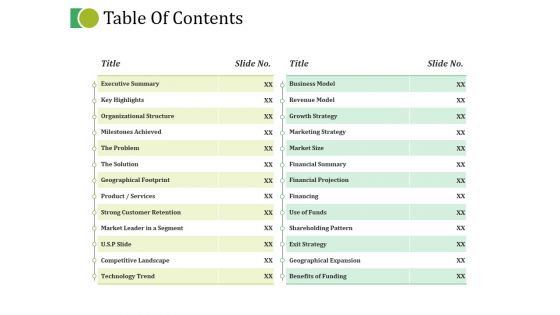
Table Of Contents Ppt PowerPoint Presentation Infographics Mockup
This is a table of contents ppt powerpoint presentation infographics mockup. This is a two stage process. The stages in this process are executive summary, key highlights, organizational structure, milestones achieved, the problem.
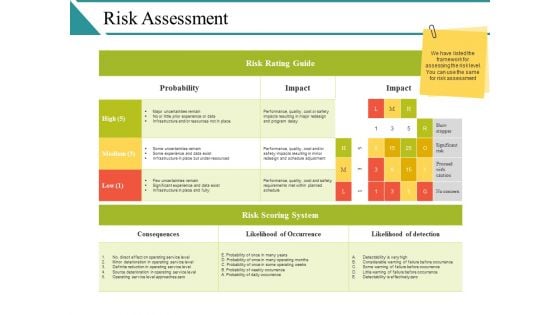
Risk Assessment Ppt PowerPoint Presentation Infographics Background Image
This is a risk assessment ppt powerpoint presentation infographics background image. This is a five stage process. The stages in this process are extreme risk, high risk, moderate risk, low risk, risk scoring results.
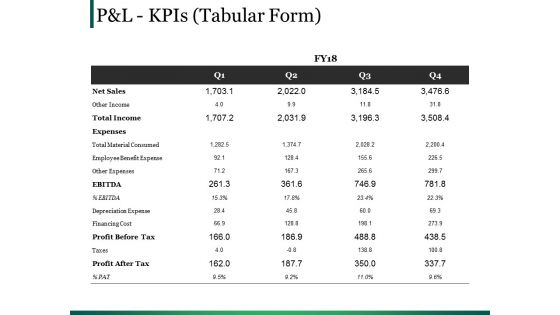
Pandl Kpis Template 1 Ppt PowerPoint Presentation Infographics Tips
This is a pandl kpis template 1 ppt powerpoint presentation infographics tips. This is a four stage process. The stages in this process are ebitda, total income, table, cost, management.


 Continue with Email

 Home
Home


