Concept Icon
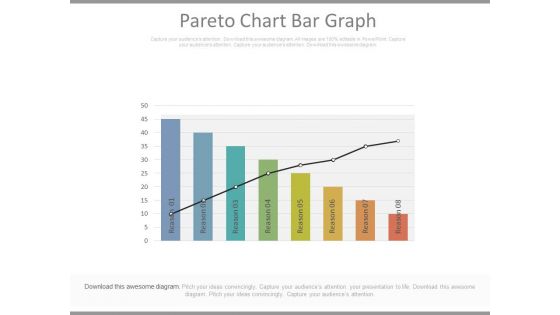
Pareto Chart Bar Graph Ppt Slides
This is a pareto chart bar graph ppt slides. This is a eight stage process. The stages in this process are business, marketing, success.\n
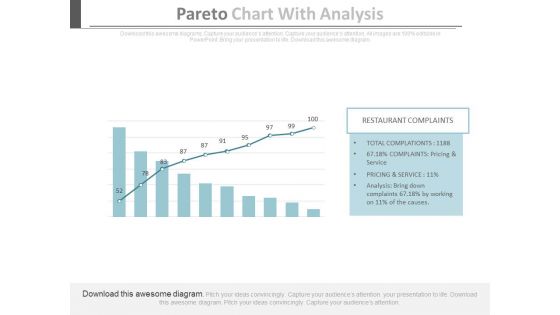
Pareto Chart With Analysis Ppt Slides
This is a pareto chart with analysis ppt slides. This is a one stage process. The stages in this process are business, success, marketing.\n\n\n
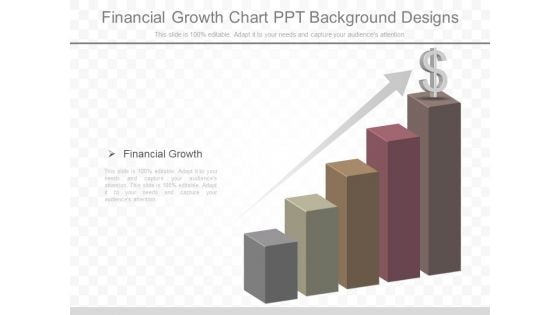
Financial Growth Chart Ppt Background Designs
This is a financial growth chart ppt background designs. This is a five stage process. The stages in this process are financial growth.\n\n\n\n\n\n\n\n\n\n\n\n\n\n\n\n\n\n
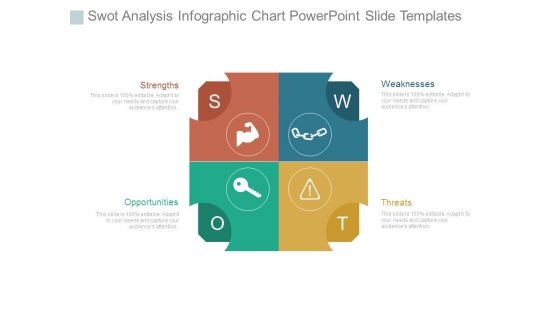
Swot Analysis Infographic Chart Powerpoint Slide Templates
This is a swot analysis infographic chart powerpoint slide templates. This is a four stage process. The stages in this process are strengths, opportunities, threats, weaknesses.

X And R Analysis Chart Ppt Presentation
This is a x and r analysis chart ppt presentation. This is a two stage process. The stages in this process are subtitle, ucl, lcl, option.
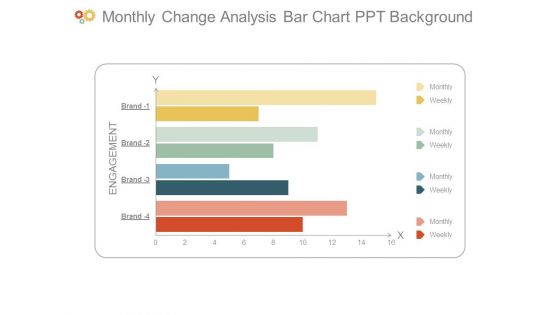
Monthly Change Analysis Bar Chart Ppt Background
This is a monthly change analysis bar chart ppt background. This is a four stage process. The stages in this process are engagement, monthly, weekly, brand.
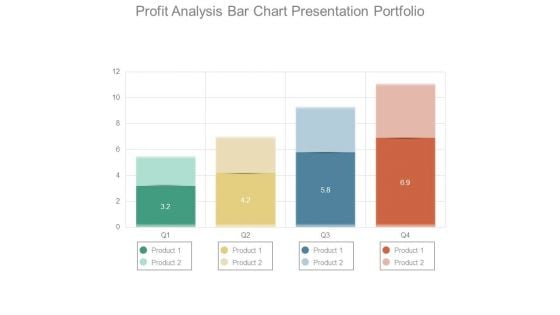
Profit Analysis Bar Chart Presentation Portfolio
This is a profit analysis bar chart presentation portfolio. This is a four stage process. The stages in this process are product.
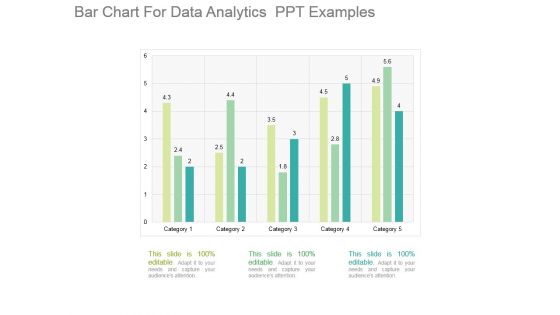
Bar Chart For Data Analytics Ppt Examples
This is a bar chart for data analytics ppt examples. This is a five stage process. The stages in this process are category.
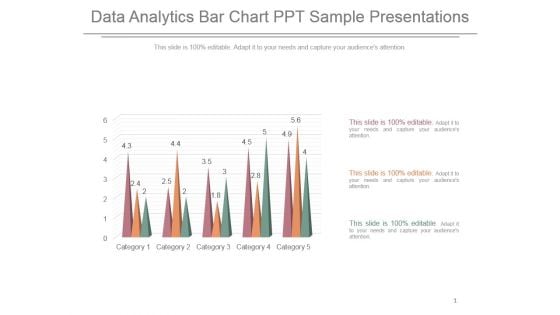
Data Analytics Bar Chart Ppt Sample Presentations
This is a data analytics bar chart ppt sample presentations. This is a five stage process. The stages in this process are category.
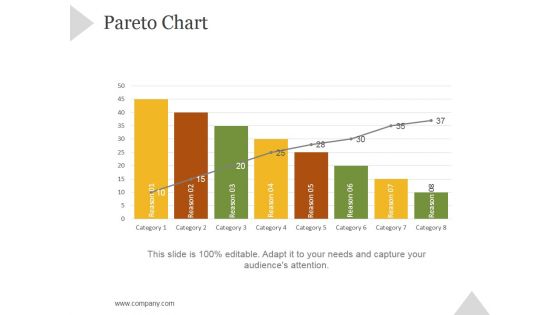
Pareto Chart Ppt PowerPoint Presentation Shapes
This is a pareto chart ppt powerpoint presentation shapes. This is a eight stage process. The stages in this process are business, strategy, marketing, success, growth strategy.
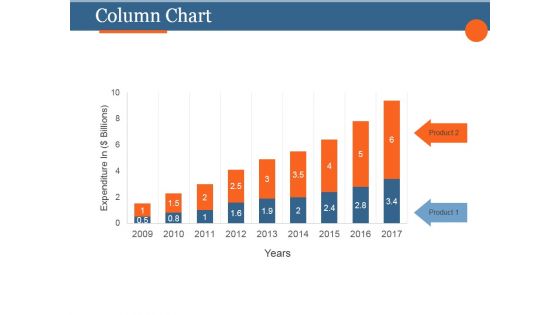
Column Chart Ppt PowerPoint Presentation Designs Download
This is a column chart ppt powerpoint presentation designs download. This is a two stage process. The stages in this process are business, strategy, marketing, analysis, growth.
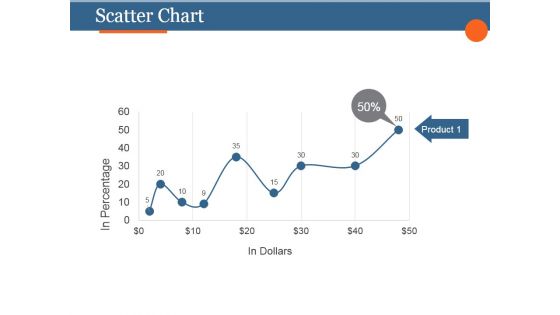
Scatter Chart Ppt PowerPoint Presentation Slides
This is a scatter chart ppt powerpoint presentation slides. This is a five stage process. The stages in this process are product, in dollars, in percentage.
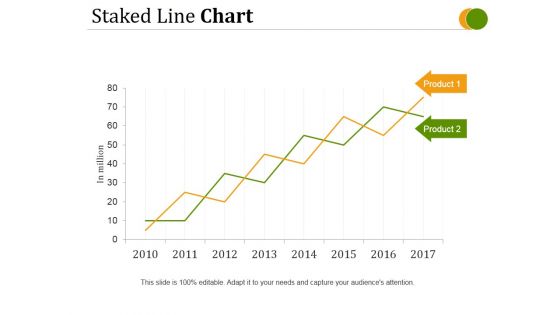
Staked Line Chart Ppt PowerPoint Presentation Tips
This is a staked line chart ppt powerpoint presentation tips. This is a two stage process. The stages in this process are stacked line, business, management, marketing, strategy.
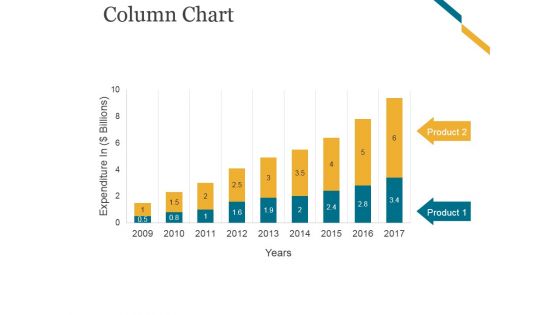
Column Chart Ppt PowerPoint Presentation Graphics
This is a column chart ppt powerpoint presentation graphics. This is a nine stage process. The stages in this process are business, marketing, growth, timeline, planning.
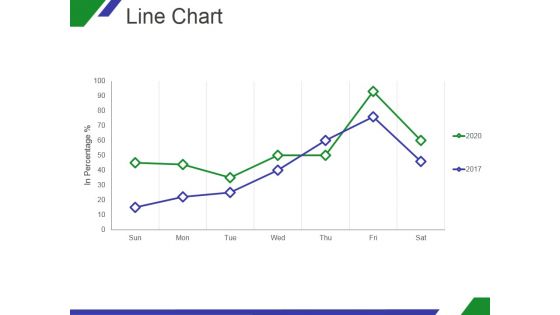
Line Chart Ppt PowerPoint Presentation Shapes
This is a line chart ppt powerpoint presentation shapes. This is a two stage process. The stages in this process are growth, in percentage, sun, mon, tue, wed.
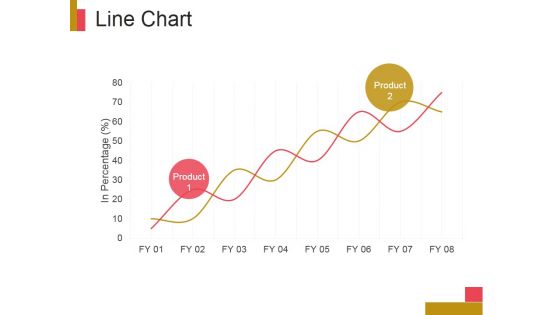
Line Chart Ppt PowerPoint Presentation Example
This is a line chart ppt powerpoint presentation example. This is a two stage process. The stages in this process are product, in percentage, business, marketing.
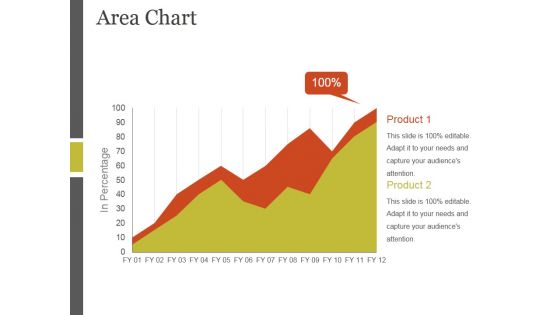
Area Chart Ppt PowerPoint Presentation Templates
This is a area chart ppt powerpoint presentation templates. This is a two stage process. The stages in this process are product, business, management, strategy, marketing, planning.
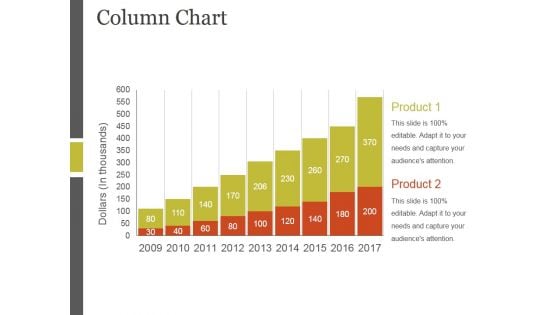
Column Chart Ppt PowerPoint Presentation Layout
This is a column chart ppt powerpoint presentation layout. This is a two stage process. The stages in this process are product, business, management, strategy, marketing, planning.
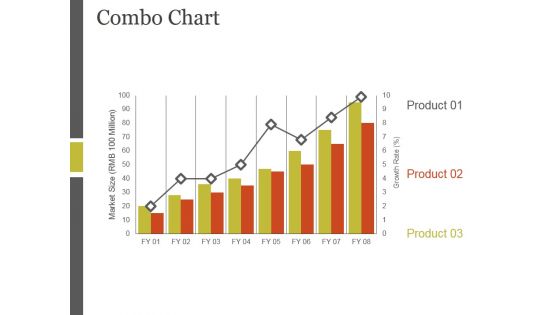
Combo Chart Ppt PowerPoint Presentation Professional
This is a combo chart ppt powerpoint presentation professional. This is a three stage process. The stages in this process are product, business, management, strategy, marketing, planning.
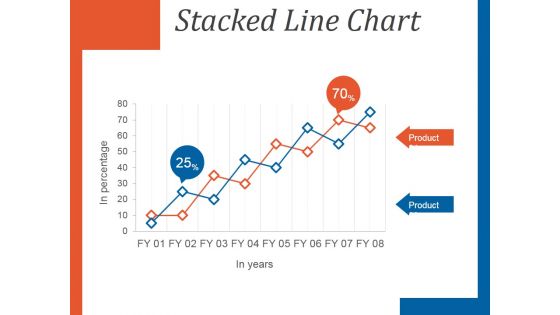
Stacked Line Chart Ppt PowerPoint Presentation Pictures
This is a stacked line chart ppt powerpoint presentation pictures. This is a two stage process. The stages in this process are growth, planning, business, management, strategy.
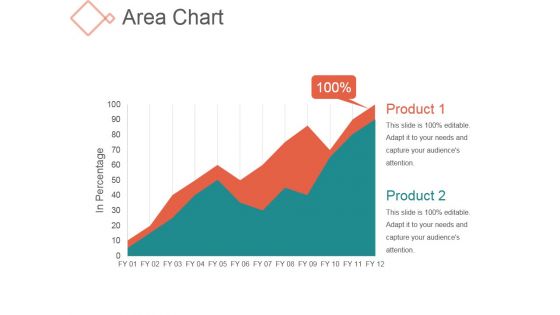
Area Chart Ppt PowerPoint Presentation Rules
This is a area chart ppt powerpoint presentation rules. This is a two stage process. The stages in this process are business, management, product, growth.
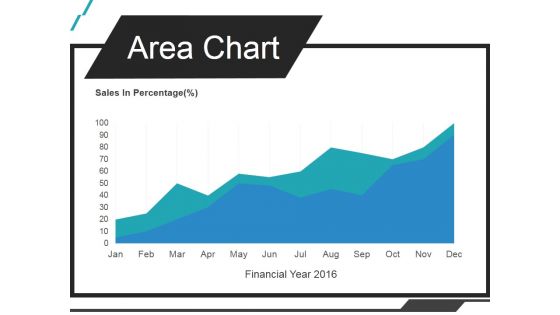
Area Chart Ppt PowerPoint Presentation Infographics
This is a area chart ppt powerpoint presentation infographics. This is a one stage process. The stages in this process are sales in percentage, jan, feb, mar, apr.
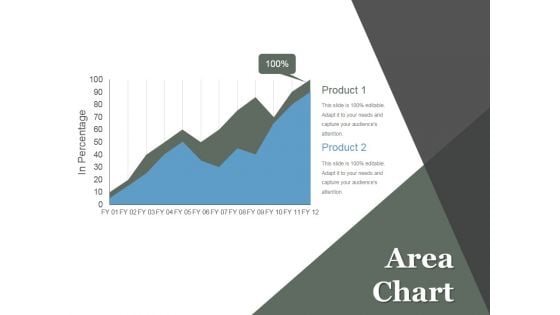
Area Chart Ppt PowerPoint Presentation Example File
This is a area chart ppt powerpoint presentation example file. This is a two stage process. The stages in this process are business, marketing, growth, planning, management.
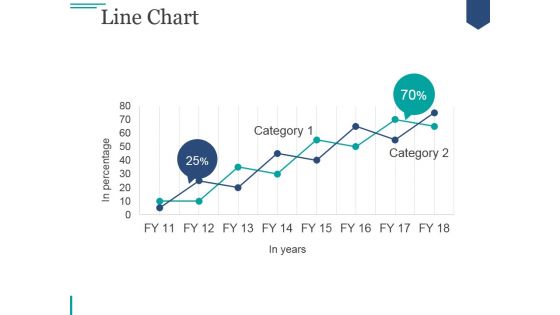
Line Chart Ppt PowerPoint Presentation Tips
This is a line chart ppt powerpoint presentation tips. This is a two stage process. The stages in this process are business, marketing, strategy, success, growth.
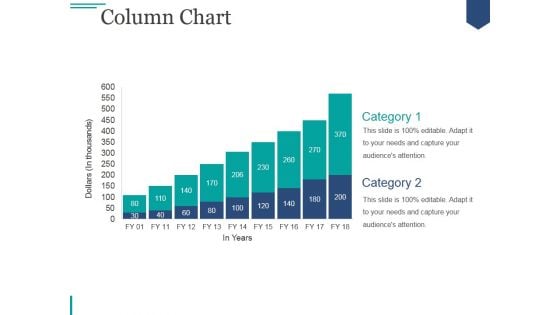
Column Chart Ppt PowerPoint Presentation Visuals
This is a column chart ppt powerpoint presentation visuals. This is a two stage process. The stages in this process are business, marketing, growth, strategy, planning.
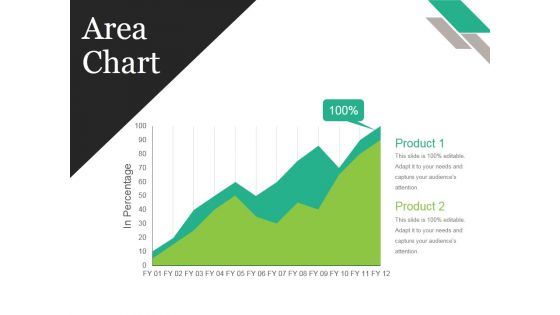
Area Chart Ppt PowerPoint Presentation Summary Graphics
This is a area chart ppt powerpoint presentation summary graphics. This is a two stage process. The stages in this process are business, strategy, marketing, analysis, finance, growth.
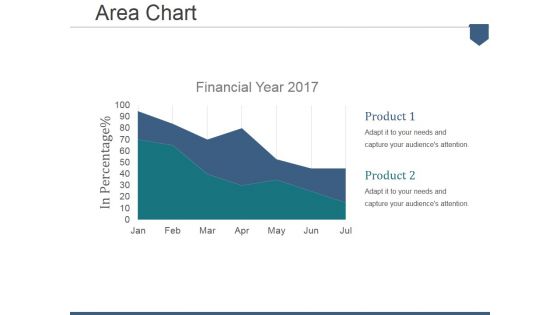
Area Chart Ppt PowerPoint Presentation Summary Example
This is a area chart ppt powerpoint presentation summary example. This is a two stage process. The stages in this process are financial year, in percentage, product.
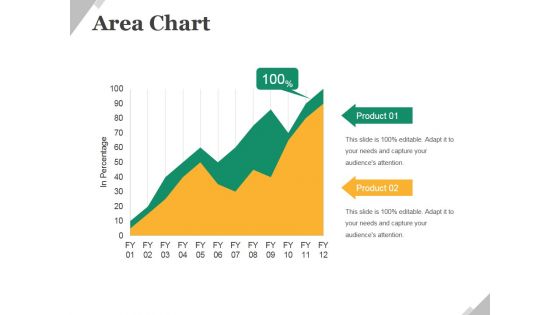
Area Chart Ppt PowerPoint Presentation Show Portfolio
This is a area chart ppt powerpoint presentation show portfolio. This is a two stage process. The stages in this process are business, product, finance, growth, management.
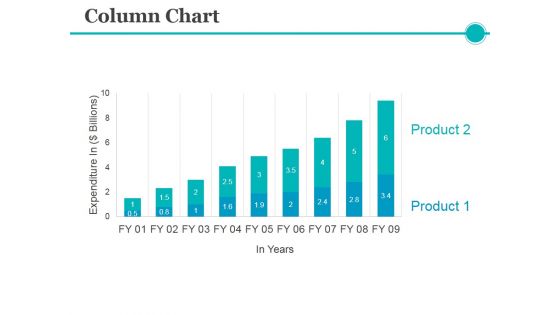
Column Chart Ppt PowerPoint Presentation Inspiration Visuals
This is a column chart ppt powerpoint presentation inspiration visuals. This is a nine stage process. The stages in this process are business, marketing, product, expenditure.
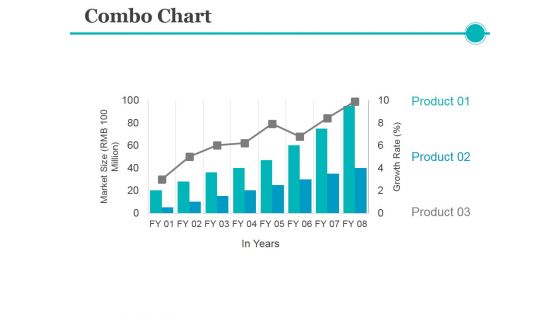
Combo Chart Ppt PowerPoint Presentation Pictures Layouts
This is a combo chart ppt powerpoint presentation pictures layouts. This is a eight stage process. The stages in this process are product, growth rate, market size, years.
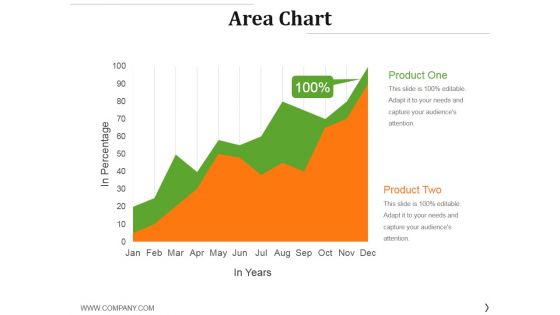
Area Chart Ppt PowerPoint Presentation Gallery Inspiration
This is a area chart ppt powerpoint presentation gallery inspiration. This is a two stage process. The stages in this process are product, growth, success, graph, finance.
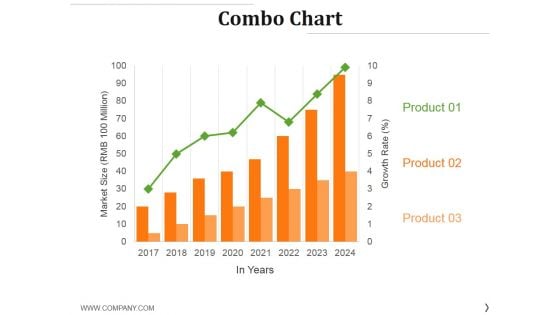
Combo Chart Ppt PowerPoint Presentation File Model
This is a combo chart ppt powerpoint presentation file model. This is a eight stage process. The stages in this process are product, year, market size, business, marketing.
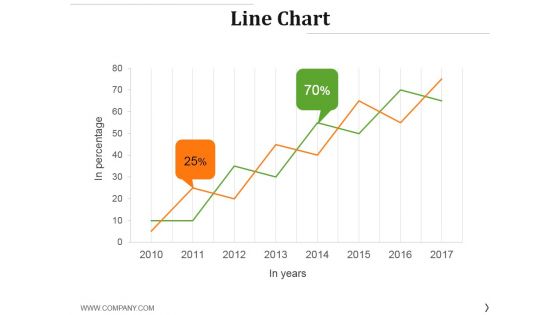
Line Chart Ppt PowerPoint Presentation Professional Template
This is a line chart ppt powerpoint presentation professional template. This is a two stage process. The stages in this process are business, finance, percentage, growth, success.
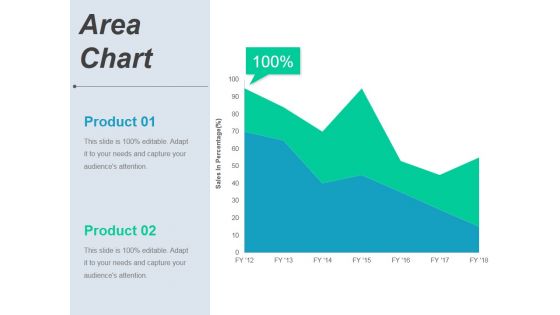
Area Chart Ppt PowerPoint Presentation Pictures Visuals
This is a area chart ppt powerpoint presentation pictures visuals. This is a two stage process. The stages in this process are product, business, finance, marketing.
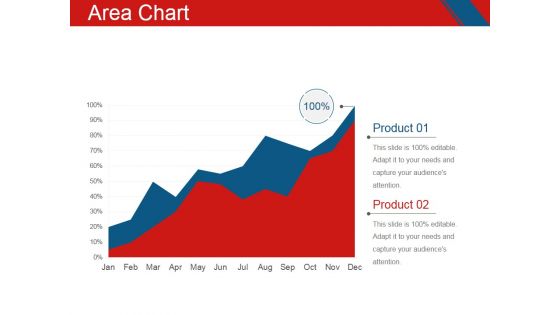
Area Chart Ppt PowerPoint Presentation Professional Deck
This is a area chart ppt powerpoint presentation professional deck. This is a two stage process. The stages in this process are business, marketing, growth, finance, management.

Bar Chart Ppt PowerPoint Presentation File Skills
This is a bar chart ppt powerpoint presentation file skills. This is a nine stage process. The stages in this process are business, marketing, growth, finance, management.
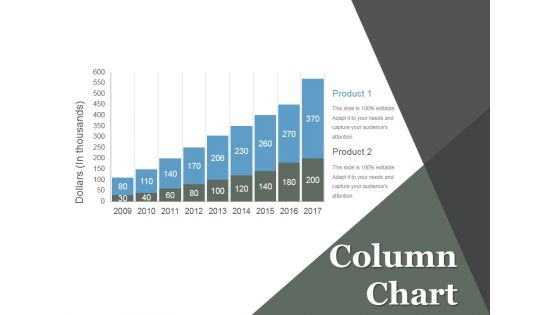
Column Chart Ppt PowerPoint Presentation Inspiration Format
This is a column chart ppt powerpoint presentation inspiration format. This is a nine stage process. The stages in this process are business, marketing, timeline, growth, management.
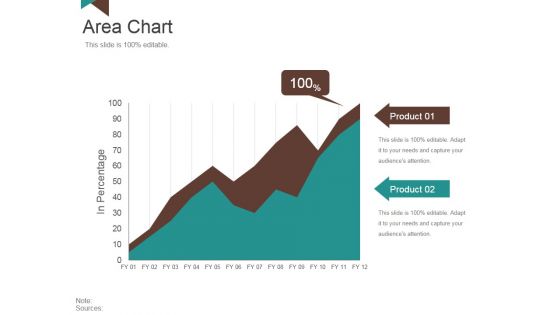
Area Chart Ppt PowerPoint Presentation Summary Shapes
This is a area chart ppt powerpoint presentation summary shapes. This is a two stage process. The stages in this process are growth, business, management, planning, strategy.
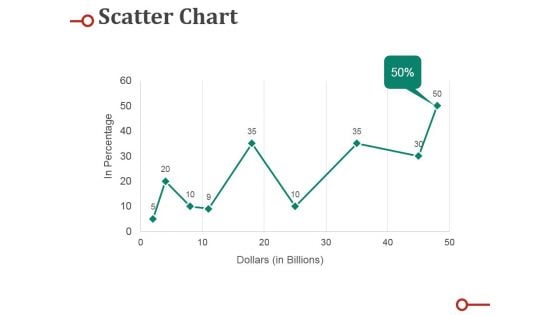
Scatter Chart Ppt PowerPoint Presentation Professional Deck
This is a scatter chart ppt powerpoint presentation professional deck. This is a nine stage process. The stages in this process are percentage, business, marketing, graph, line.
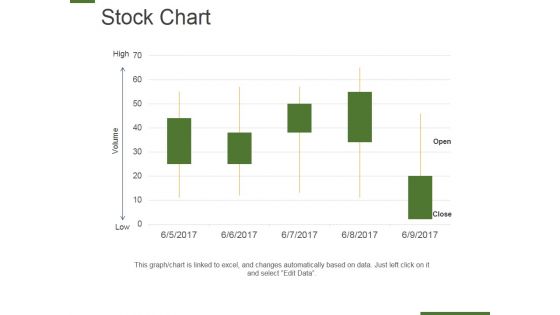
Stock Chart Ppt PowerPoint Presentation Professional Layouts
This is a stock chart ppt powerpoint presentation professional layouts. This is a five stage process. The stages in this planning, management, strategy, marketing, business.

Line Chart Ppt PowerPoint Presentation Model Visuals
This is a line chart ppt powerpoint presentation model visuals. This is a two stage process. The stages in this process are business, strategy, analysis, pretention, growth strategy.
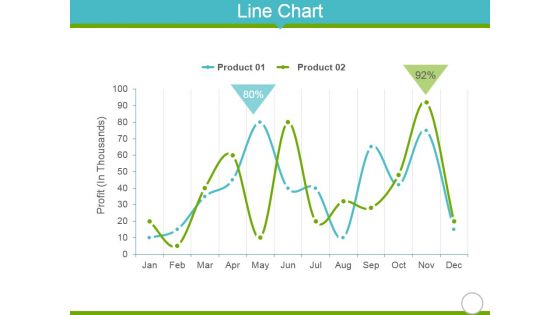
Line Chart Ppt Powerpoint Presentation Portfolio Clipart
This is a line chart ppt powerpoint presentation portfolio clipart. This is a two stage process. The stages in this process are jan, feb, mar, apr, may, jun.

Scatter Chart Ppt PowerPoint Presentation Examples
This is a scatter chart ppt powerpoint presentation examples. This is a eight stage process. The stages in this process are business, strategy, marketing, success, profit in sales.
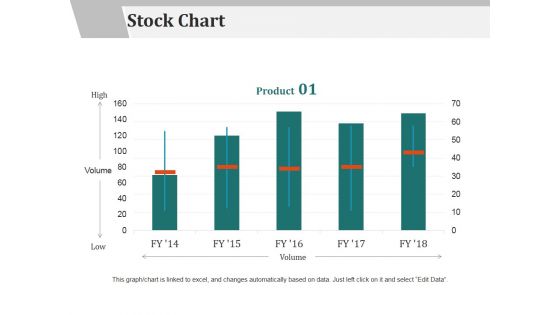
Stock Chart Ppt PowerPoint Presentation Model Backgrounds
This is a stock chart ppt powerpoint presentation model backgrounds. This is a five stage process. The stages in this process are business, marketing, management, strategy, planning.
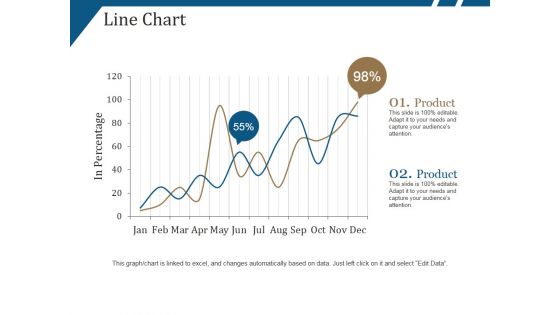
Line Chart Ppt PowerPoint Presentation Portfolio Show
This is a line chart ppt powerpoint presentation portfolio show. This is a two stage process. The stages in this process are product, in percentage, growth, success.

Area Chart Ppt PowerPoint Presentation Slides Show
This is a area chart ppt powerpoint presentation slides show. This is a two stage process. The stages in this process are business, marketing, success, graph, growth.
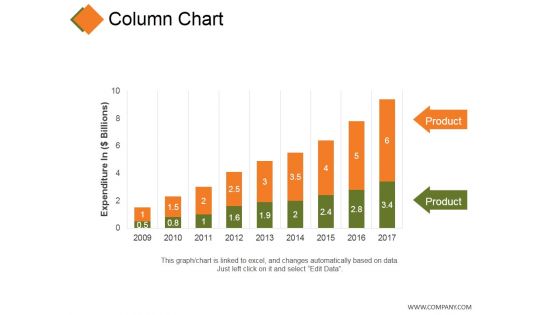
Column Chart Ppt PowerPoint Presentation Portfolio Background
This is a column chart ppt powerpoint presentation portfolio background. This is a nine stage process. The stages in this process are product, expenditure, growth, success, business.
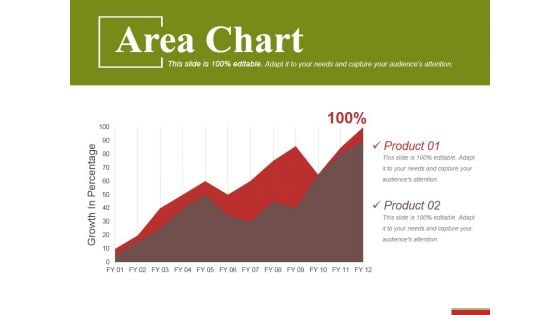
Area Chart Ppt PowerPoint Presentation Gallery Brochure
This is a area chart ppt powerpoint presentation gallery brochure. This is a two stage process. The stages in this process are product, growth in percentage, success, business.
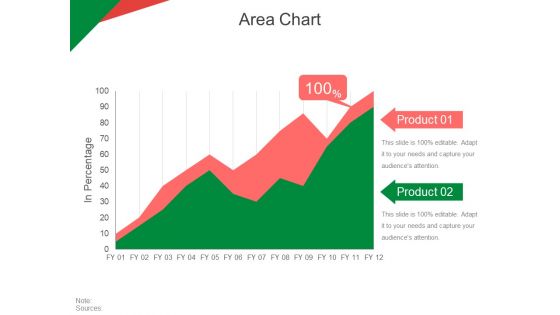
Area Chart Ppt PowerPoint Presentation Inspiration Aids
This is a area chart ppt powerpoint presentation inspiration aids. This is a two stage process. The stages in this process are in percentage, product, business, marketing, strategy.
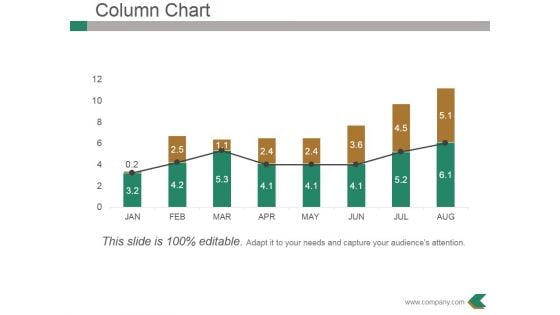
Column Chart Ppt PowerPoint Presentation Professional Example
This is a column chart ppt powerpoint presentation professional example. This is a eight stage process. The stages in this process are bar graph, growth, success, business, marketing.
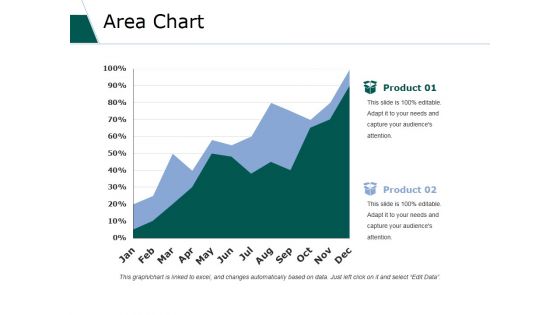
Area Chart Ppt PowerPoint Presentation Outline Microsoft
This is a area chart ppt powerpoint presentation outline microsoft. This is a two stage process. The stages in this process are business, marketing, strategy, planning, growth.
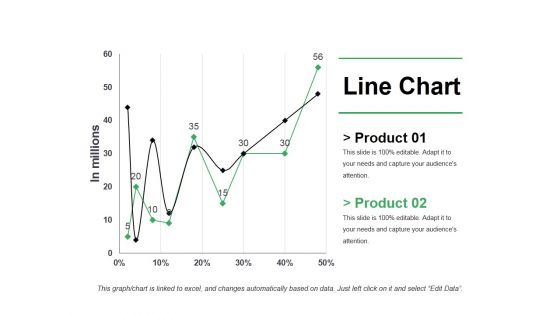
Line Chart Ppt PowerPoint Presentation Pictures Shapes
This is a line chart ppt powerpoint presentation pictures shapes. This is a two stage process. The stages in this process are business, marketing, strategy, finance, growth.

Column Chart Ppt PowerPoint Presentation Portfolio Inspiration
This is a column chart ppt powerpoint presentation portfolio inspiration. This is a two stage process. The stages in this process are finance, marketing, management, investment, analysis.
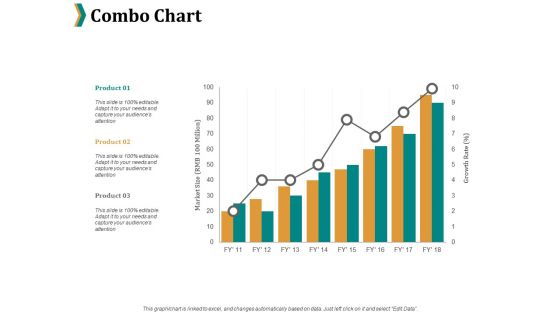
Combo Chart Ppt PowerPoint Presentation File Example
This is a combo chart ppt powerpoint presentation file example. This is a three stage process. The stages in this process are product, percentage, marketing, business, management.
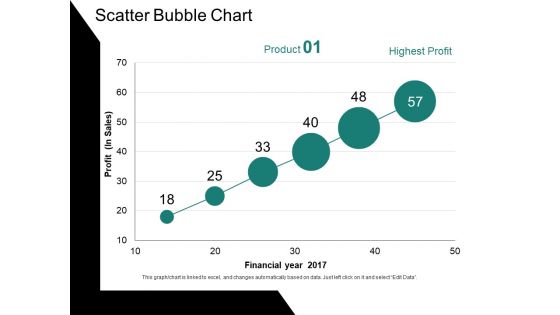
Scatter Bubble Chart Ppt PowerPoint Presentation Ideas Gallery
This is a scatter bubble chart ppt powerpoint presentation ideas gallery. This is a six stage process. The stages in this process are profit, financial year, chart, business, growth.
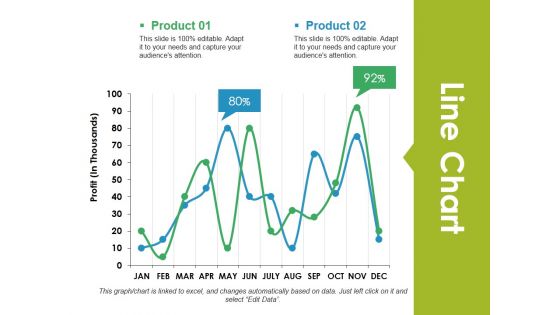
Line Chart Ppt PowerPoint Presentation Ideas Background Designs
This is a line chart ppt powerpoint presentation ideas background designs. This is a two stage process. The stages in this process are line chart, growth, business, marketing, strategy.
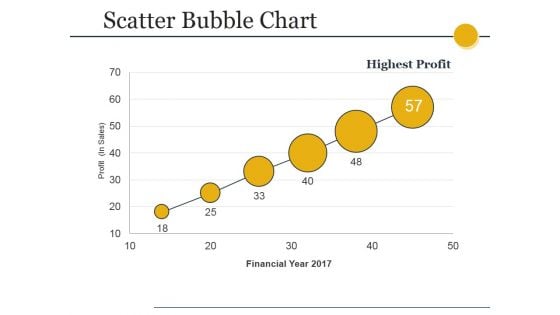
Scatter Bubble Chart Ppt PowerPoint Presentation Ideas Brochure
This is a scatter bubble chart ppt powerpoint presentation ideas brochure. This is a six stage process. The stages in this process are business, marketing, graph, growth, success.
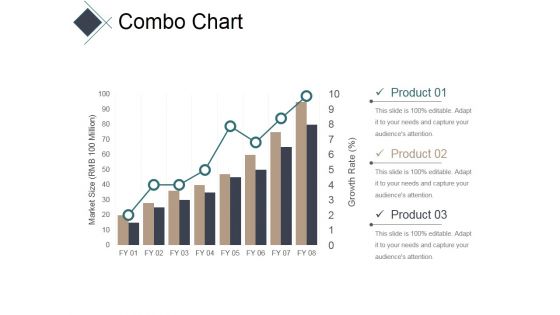
Combo Chart Ppt PowerPoint Presentation Ideas Graphic Images
This is a combo chart ppt powerpoint presentation ideas graphic images. This is a eight stage process. The stages in this process are bar, finance, business, marketing, success.
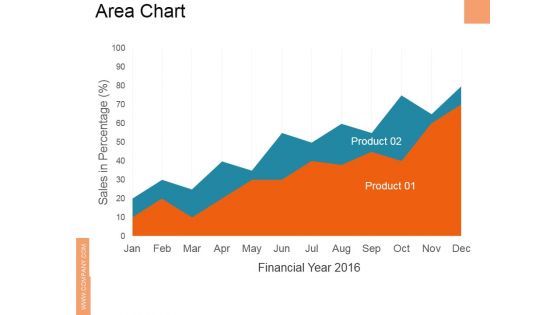
Area Chart Ppt PowerPoint Presentation Ideas Designs Download
This is a area chart ppt powerpoint presentation ideas designs download. This is a twelve stage process. The stages in this process are business, marketing, success, growth, area.
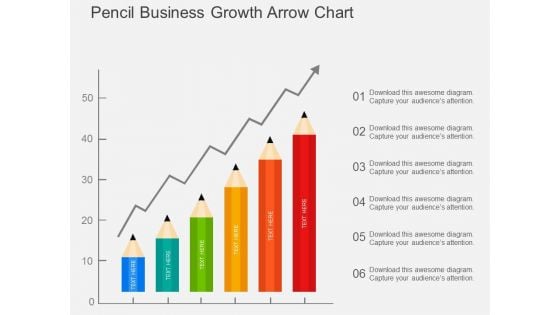
Pencil Business Growth Arrow Chart Powerpoint Template
The above template displays graphics of pencil business growth arrow chart. This PowerPoint template has been professionally designed to display growth strategy and planning. Grab centre stage with this PPT slide.
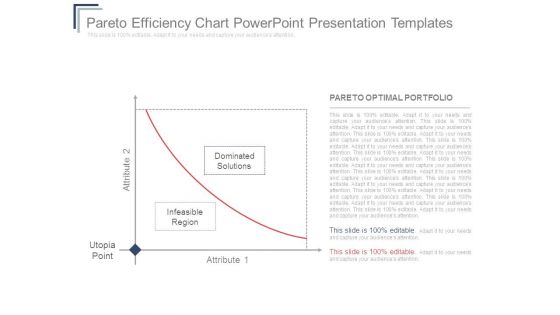
Pareto Efficiency Chart Powerpoint Presentation Templates
This is a pareto efficiency chart powerpoint presentation templates. This is a two stage process. The stages in this process are attribute 2, utopia, point, infeasible region, dominated, solutions, attribute 1, pareto optimal portfolio.
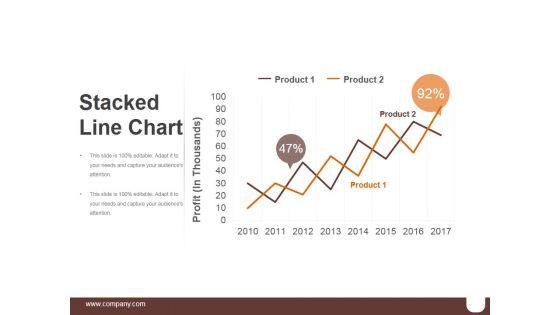
Stacked Line Chart Ppt PowerPoint Presentation Shapes
This is a stacked line chart ppt powerpoint presentation shapes. This is a two stage process. The stages in this process are product, profit in thousands, finance, analysis, growth.
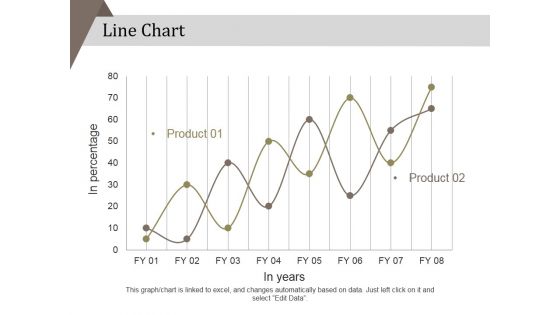
Line Chart Ppt PowerPoint Presentation Layouts Professional
This is a line chart ppt powerpoint presentation layouts professional. This is a two stage process. The stages in this process are in percentage, product, in years, strategy, marketing, business.
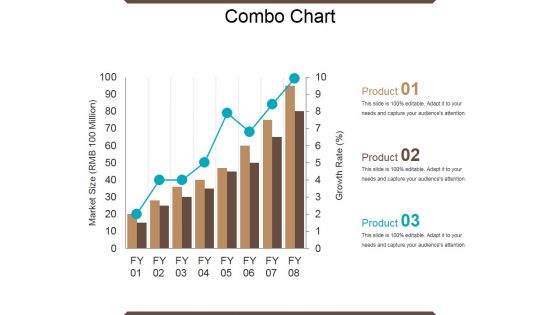
Combo Chart Ppt PowerPoint Presentation Outline Model
This is a combo chart ppt powerpoint presentation outline model. This is a eight stage process. The stages in this process are market size, growth rate, growth, success, graph.
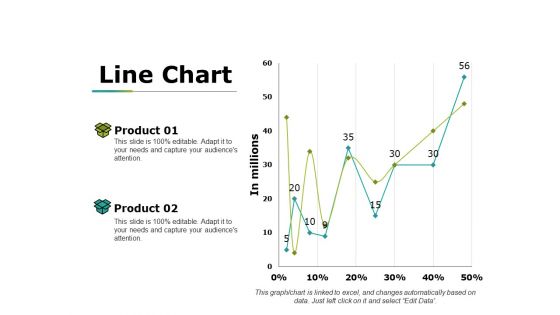
Line Chart Ppt PowerPoint Presentation Infographic Template Design Ideas
This is a line chart ppt powerpoint presentation infographic template design ideas. This is a two stage process. The stages in this process are product, in millions, percentage, line chart, success.
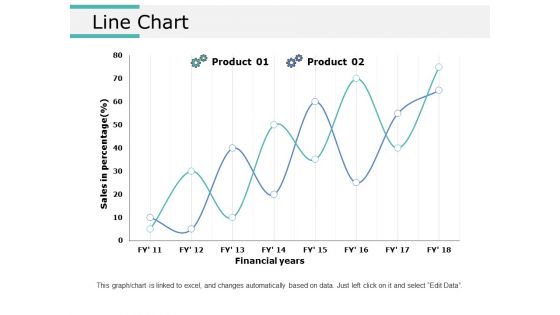
Line Chart Ppt PowerPoint Presentation Ideas Graphics Tutorials
This is a line chart ppt powerpoint presentation ideas graphics tutorials. This is a two stage process. The stages in this process are line chart, marketing, strategy, planning, finance.
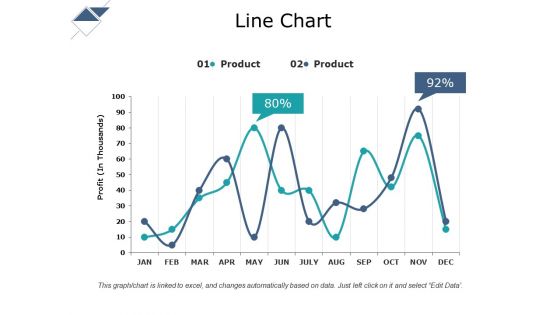
Line Chart Ppt PowerPoint Presentation Gallery Format Ideas
This is a line chart ppt powerpoint presentation gallery format ideas. This is a two stage process. The stages in this process are line chart, product, in year, profit.
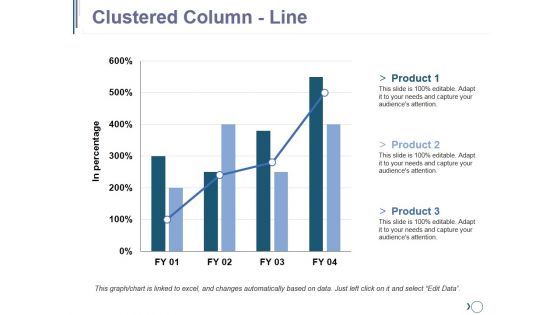
Clustered Column Line Ppt PowerPoint Presentation Slides Themes
This is a clustered column line ppt powerpoint presentation slides themes. This is a four stage process. The stages in this process are business, marketing, strategy, planning, finance.
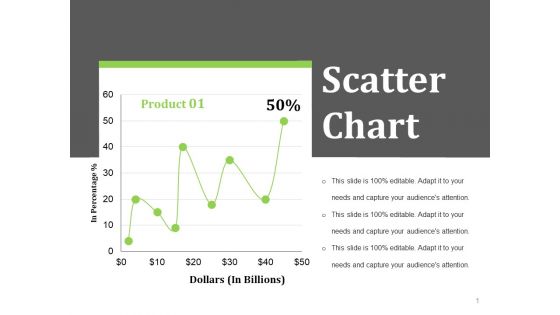
Scatter Chart Ppt PowerPoint Presentation Styles Layout Ideas
This is a scatter chart ppt powerpoint presentation styles layout ideas. This is a one stage process. The stages in this process are dollars in billions, in percentage, business, finance.
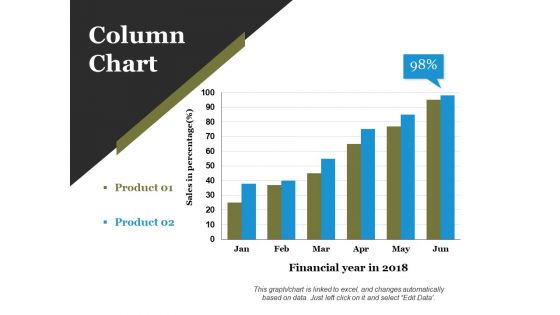
Column Chart Ppt PowerPoint Presentation Infographics Layout Ideas
This is a column chart ppt powerpoint presentation infographics layout ideas. This is a two stage process. The stages in this process are financial year in, business, marketing, growth, graph.
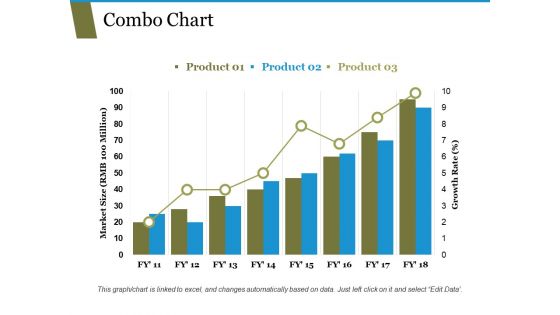
Combo Chart Ppt PowerPoint Presentation Ideas Infographic Template
This is a combo chart ppt powerpoint presentation ideas infographic template. This is a three stage process. The stages in this process are market size growth rate, graph, business, strategy.
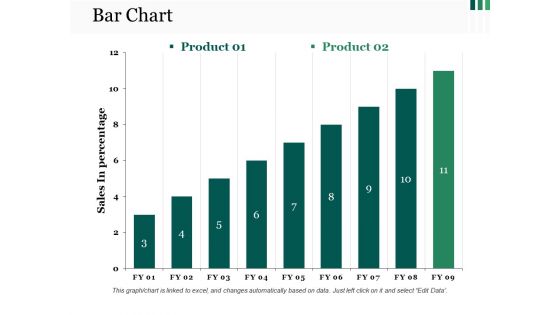
Bar Chart Ppt PowerPoint Presentation Show Format Ideas
This is a bar chart ppt powerpoint presentation show format ideas. This is a two stage process. The stages in this process are bar graph, growth, success, business, marketing.
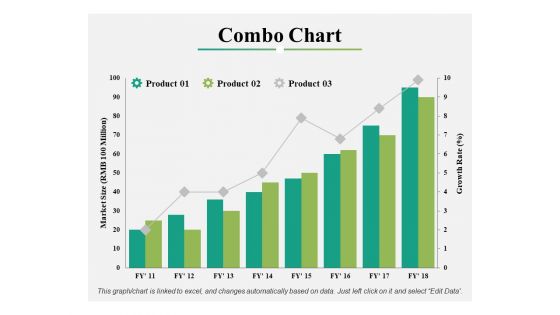
Combo Chart Ppt PowerPoint Presentation Styles Format Ideas
This is a combo chart ppt powerpoint presentation styles format ideas. This is a three stage process. The stages in this process are percentage, product, marketing.
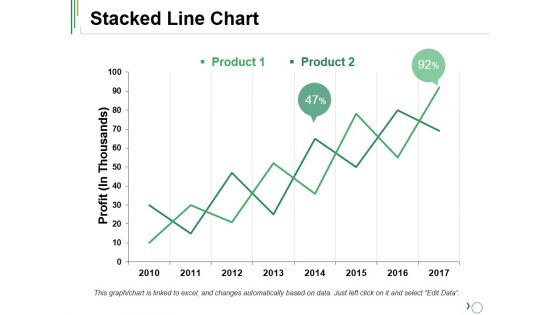
Stacked Line Chart Ppt PowerPoint Presentation Ideas Outfit
This is a stacked line chart ppt powerpoint presentation ideas outfit. This is a two stage process. The stages in this process are product, stacked line, profit, growth, success.
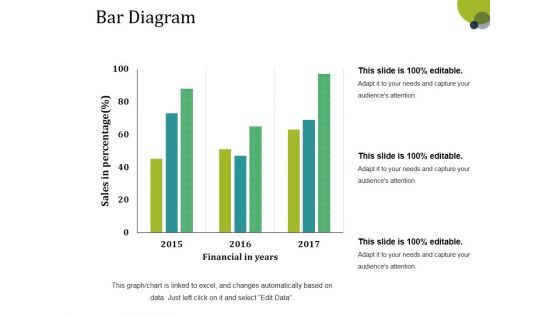
Bar Diagram Ppt PowerPoint Presentation Gallery Structure
This is a bar diagram ppt powerpoint presentation gallery structure. This is a three stage process. The stages in this process are financial in years, sales in percentage, bar graph, growth, success.

Column Chart Ppt PowerPoint Presentation Inspiration Design Ideas
This is a column chart ppt powerpoint presentation inspiration design ideas. This is a nine stage process. The stages in this process are product, growth, success, graph, business.
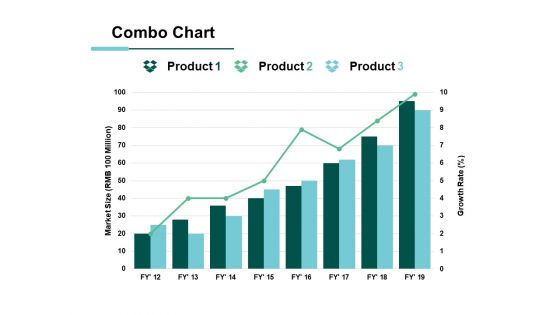
Combo Chart Product Ppt PowerPoint Presentation Ideas Styles
This is a combo chart product ppt powerpoint presentation ideas styles. This is a three stage process. The stages in this process are business, management, marketing, percentage, product.

Ownership Technology Expertise Diagram Ppt Diagrams
This is a ownership technology expertise diagram ppt diagrams. This is a four stage process. The stages in this process are business, marketing, technology, growth, people.
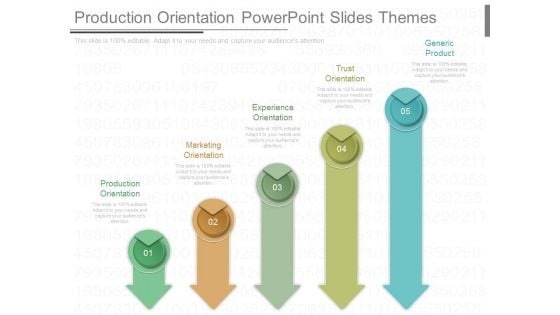
Production Orientation Powerpoint Slides Themes
This is a production orientation powerpoint slides themes. This is a five stage process. The stages in this process are production orientation, marketing orientation, experience orientation, trust orientation, generic product.
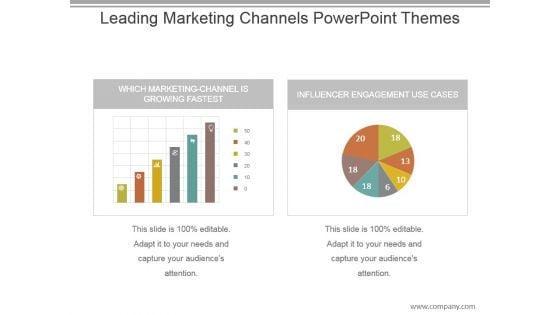
Leading Marketing Channels Powerpoint Themes
This is a leading marketing channels powerpoint themes. This is a two stage process. The stages in this process are which marketing channel is growing fastest, influencer engagement use cases.
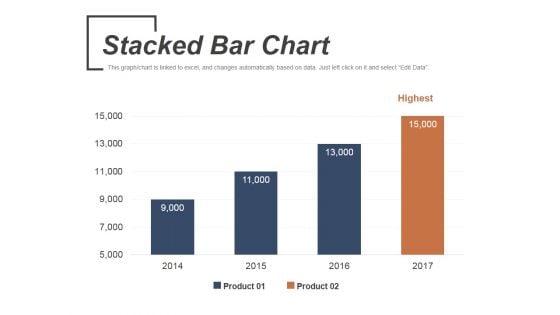
Stacked Bar Chart Ppt PowerPoint Presentation Inspiration Ideas
This is a stacked bar chart ppt powerpoint presentation inspiration ideas. This is a four stage process. The stages in this process are product, highest, business, marketing, bar graph.
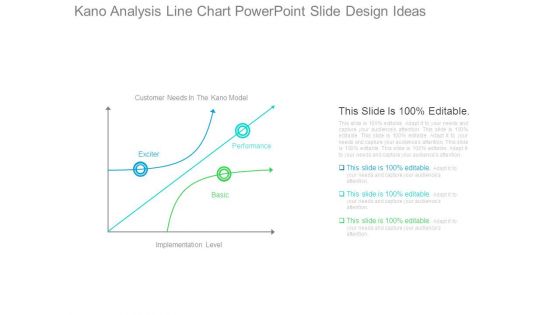
Kano Analysis Line Chart Powerpoint Slide Design Ideas
This is a kano analysis line chart powerpoint slide design ideas. This is a three stage process. The stages in this process are customer needs in the kano model, exciter, performance, basic, implementation level.
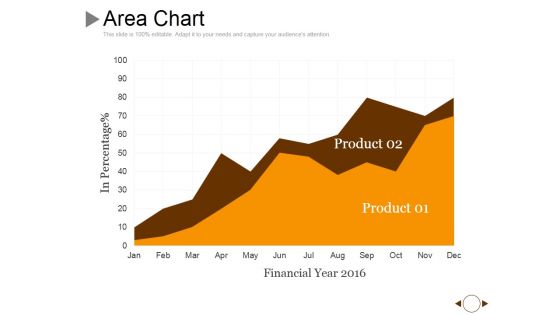
Area Chart Ppt PowerPoint Presentation Show Layout Ideas
This is a area chart ppt powerpoint presentation show layout ideas. This is a two stage process. The stages in this process are product, in percentage, financial year, growth.
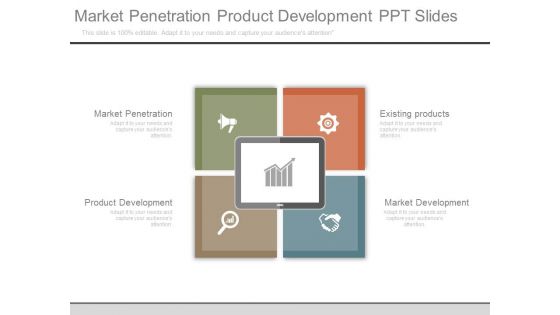
Market Penetration Product Development Ppt Slides
This is a market penetration product development ppt slides. This is a four stage process. The stages in this process are business, communication, network diagrams.
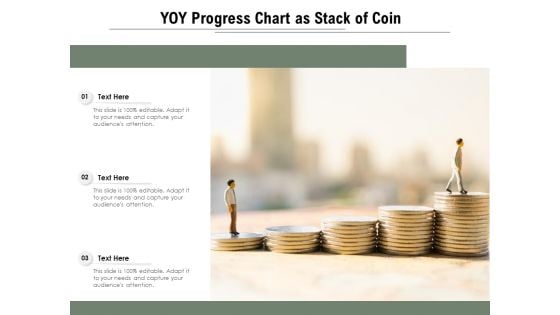
YOY Progress Chart As Stack Of Coin Ppt PowerPoint Presentation Infographic Template Ideas PDF
Presenting yoy progress chart as stack of coin ppt powerpoint presentation infographic template ideas pdf to dispense important information. This template comprises three stages. It also presents valuable insights into the topics including yoy progress chart as stack of coin. This is a completely customizable PowerPoint theme that can be put to use immediately. So, download it and address the topic impactfully.
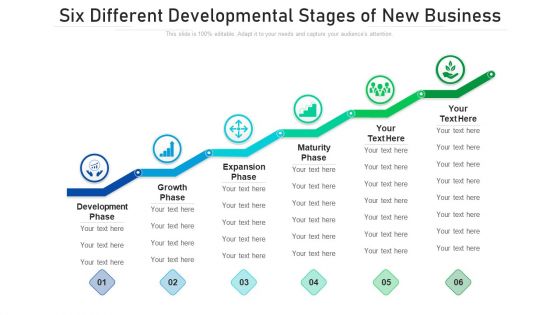
Six Different Developmental Stages Of New Business Ppt PowerPoint Presentation File Show PDF
Presenting six different developmental stages of new business ppt powerpoint presentation file show pdf to dispense important information. This template comprises six stages. It also presents valuable insights into the topics including development phase, growth phase, expansion phase. This is a completely customizable PowerPoint theme that can be put to use immediately. So, download it and address the topic impactfully.
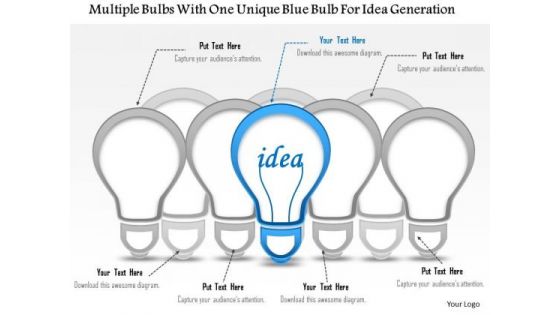
Business Diagram Multiple Bulbs With One Unique Blue Bulb For Idea Generation Presentation Template
This business diagram has been designed with multiple bulbs with one unique bulb. This diagram can be used to depict innovative business ideas. Use this slide for your business and technology based presentations.
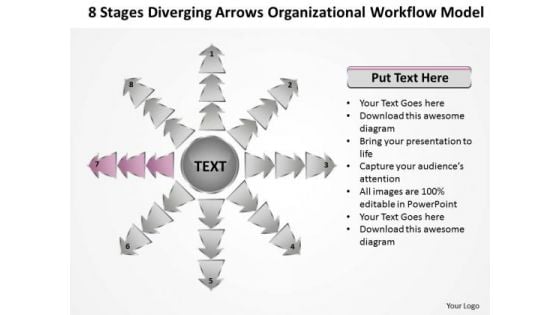
8 Stages Diverging Arrows Organizational Workflow Model Ppt Charts And PowerPoint Slides
We present our 8 stages diverging arrows organizational workflow model ppt Charts and PowerPoint Slides.Download and present our Arrows PowerPoint Templates because you should Demonstrate how you think out of the box. Use our Business PowerPoint Templates because watch the excitement levels rise as they realise their worth. Download our Flow Charts PowerPoint Templates because you will be able to Highlight these individual targets and the paths to their achievement. Present our Shapes PowerPoint Templates because you can take it along a sure fire road to good profit. Download and present our Process and Flows PowerPoint Templates because it helps you to display your ideas and thoughts.Use these PowerPoint slides for presentations relating to Arrows, Business, Chart, Cyclic, Data, Diagram, Financial, Goal, Graph, Illustration, Info, Information, Marketing, Model, Option, Part, Pie, Presentation, Process, Result, Sphere, Statistics. The prominent colors used in the PowerPoint template are Pink, White, Gray. PowerPoint presentation experts tell us our 8 stages diverging arrows organizational workflow model ppt Charts and PowerPoint Slides will make the presenter look like a pro even if they are not computer savvy. The feedback we get is that our Graph PowerPoint templates and PPT Slides provide you with a vast range of viable options. Select the appropriate ones and just fill in your text. Fresh concepts are ever evolving. Help the audience absorb them with our 8 Stages Diverging Arrows Organizational Workflow Model Ppt Charts And PowerPoint Slides.
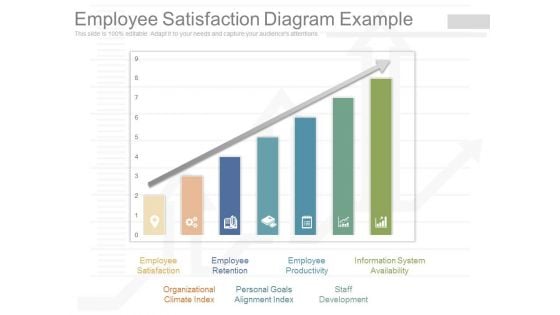
Employee Satisfaction Diagram Example
This is a employee satisfaction diagram example. This is a seven stage process. The stages in this process are employee satisfaction, organizational climate index, personal goals alignment index, employee retention, employee productivity, information system availability, staff development.
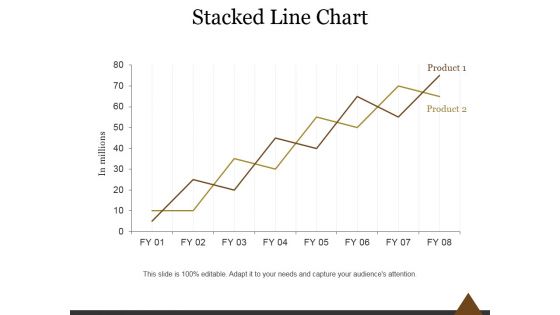
Stacked Line Chart Ppt PowerPoint Presentation Example 2015
This is a stacked line chart ppt powerpoint presentation example 2015. This is a two stage process. The stages in this process are business, marketing, stacked, line, chart.
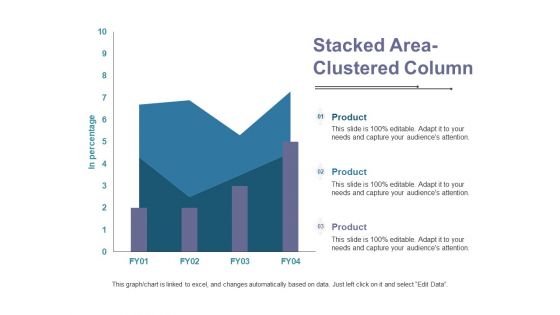
Stacked Area Clustered Column Ppt PowerPoint Presentation Outline Diagrams
This is a stacked area clustered column ppt powerpoint presentation outline diagrams. This is a three stage process. The stages in this process are product, in percentage, area chart.
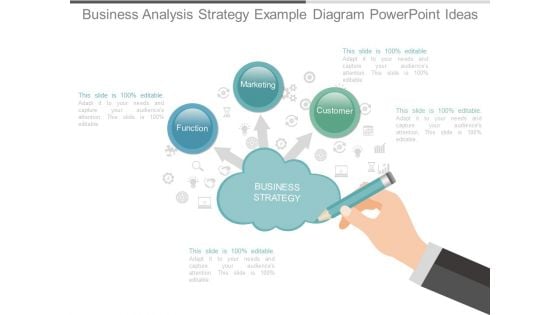
Business Analysis Strategy Example Diagram Powerpoint Ideas
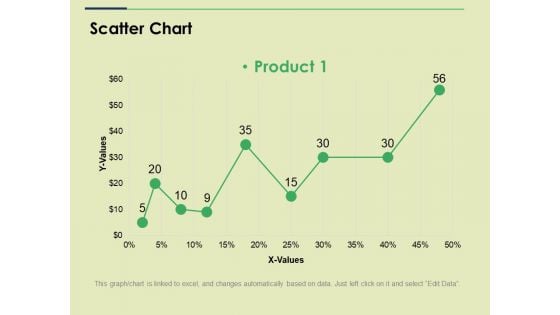
Scatter Chart Ppt PowerPoint Presentation Portfolio Background Designs
This is a scatter chart ppt powerpoint presentation portfolio background designs. This is a one stage process. The stages in this process are chart, business, marketing, graph, strategy.
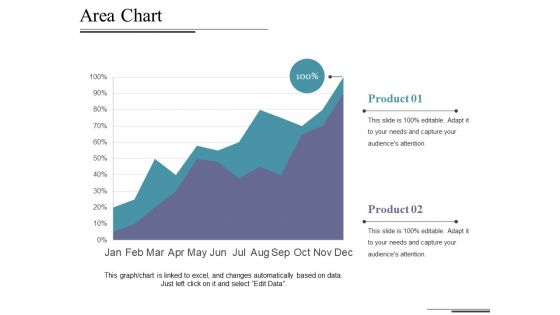
Area Chart Ppt PowerPoint Presentation Outline Graphics Download
This is a area chart ppt powerpoint presentation outline graphics download. This is a two stage process. The stages in this process are chart, percentage, business, marketing, strategy.

Line Chart Ppt PowerPoint Presentation Gallery Example Introduction
This is a line chart ppt powerpoint presentation portfolio shapes. This is a two stage process. The stages in this process are product, financial years, line chart.
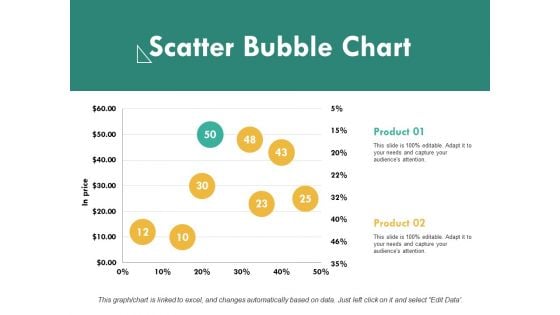
Scatter Bubble Chart Ppt PowerPoint Presentation File Samples
This is a scatter bubble chart ppt powerpoint presentation file samples. This is a two stage process. The stages in this process are product, in price, scatter chart.
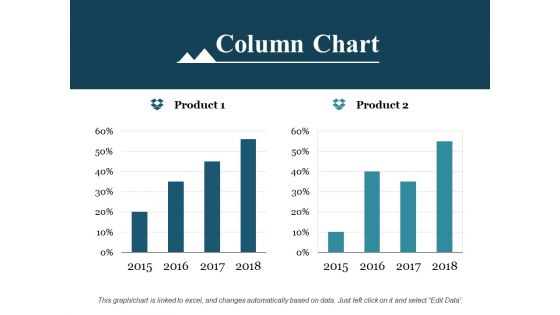
Column Chart Ppt PowerPoint Presentation Outline Background Image
This is a column chart ppt powerpoint presentation outline background image. This is a two stage process. The stages in this process are product, column chart, growth.

Line Chart Ppt PowerPoint Presentation Portfolio File Formats
This is a line chart ppt powerpoint presentation portfolio file formats. This is a two stage process. The stages in this process are product, profit, line chart.
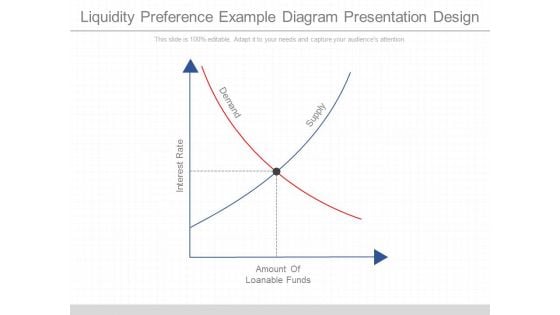
Liquidity Preference Example Diagram Presentation Design
This is a liquidity preference example diagram presentation design. This is a four stage process. The stages in this process are interest rate, amount of loanable funds, demand, supply.
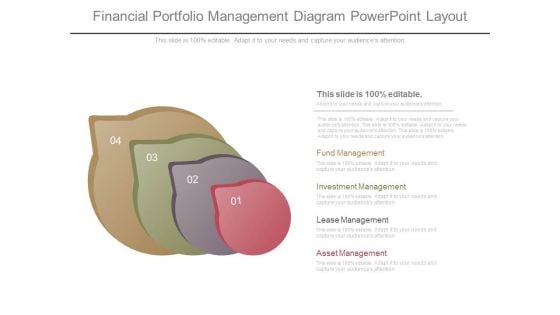
Financial Portfolio Management Diagram Powerpoint Layout
This is a financial portfolio management diagram powerpoint layout. This is a four stage process. The stages in this process are asset management, lease management, investment management, fund management.
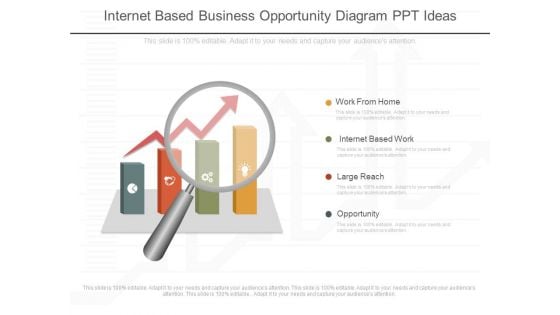
Internet Based Business Opportunity Diagram Ppt Ideas
This is a internet based business opportunity diagram ppt ideas. This is a four stage process. The stages in this process are work from home, internet based work, large reach, opportunity.
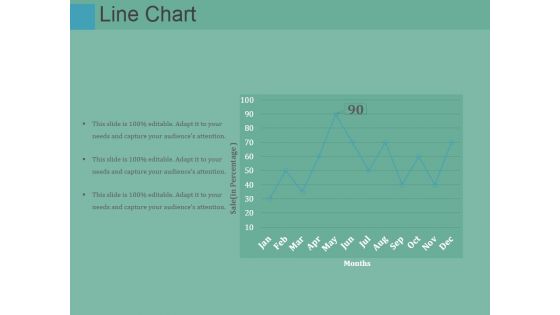
Line Chart Ppt PowerPoint Presentation Outline Design Inspiration
This is a line chart ppt powerpoint presentation outline design inspiration. This is a five stage process. The stages in this process are line chart, management, business, strategy, marketing.
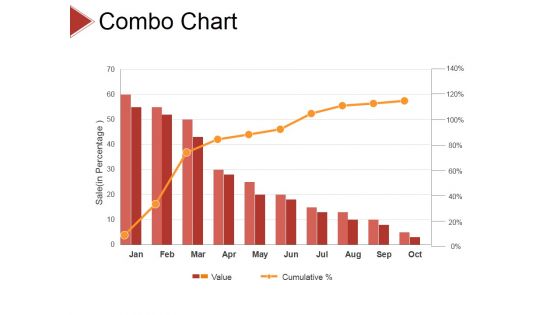
Combo Chart Ppt PowerPoint Presentation File Example Introduction
This is a combo chart ppt powerpoint presentation file example introduction. This is a ten stage process. The stages in this process are business, strategy, analysis, pretention, chart and graph.
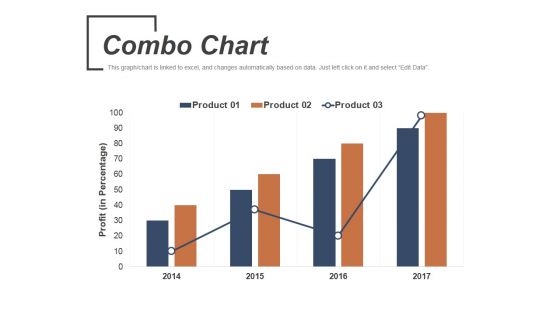
Combo Chart Ppt PowerPoint Presentation Infographic Template Demonstration
This is a combo chart ppt powerpoint presentation infographic template demonstration. This is a four stage process. The stages in this process are combo chart, management, planning, strategy, marketing.
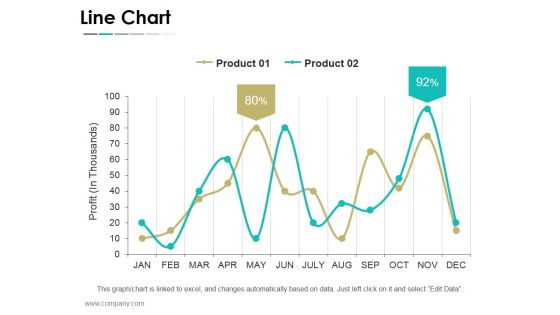
Line Chart Ppt PowerPoint Presentation File Graphics Template
This is a line chart ppt powerpoint presentation file graphics template. This is a twelve stage process. The stages in this process are business, strategy, marketing, success, line chart.
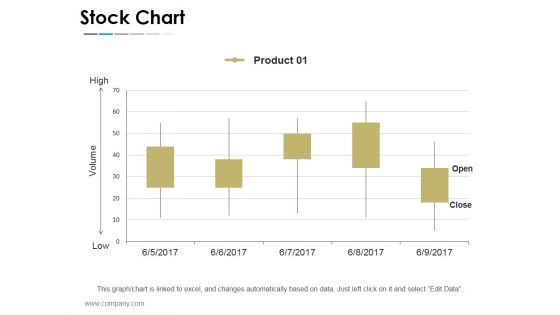
Stock Chart Ppt PowerPoint Presentation Summary Graphic Images
This is a stock chart ppt powerpoint presentation summary graphic images. This is a five stage process. The stages in this process are business, strategy, marketing, success, stock chart.
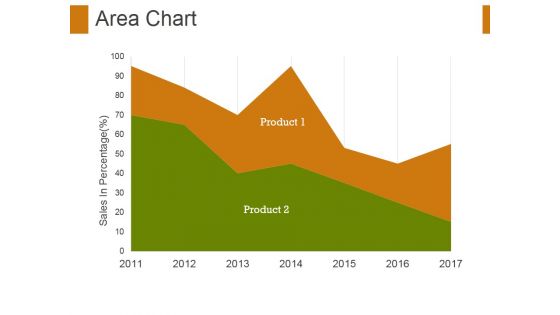
Area Chart Ppt PowerPoint Presentation Visual Aids Example 2015
This is a area chart ppt powerpoint presentation visual aids example 2015. This is a two stage process. The stages in this process are area chart, finance, marketing, strategy, business.
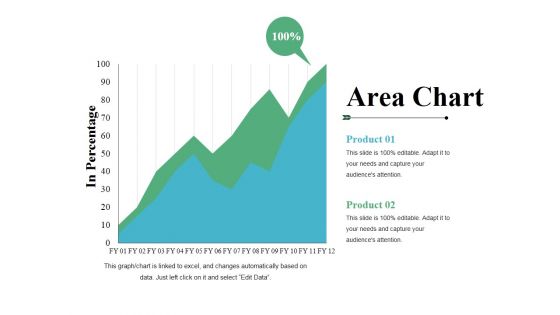
Area Chart Ppt PowerPoint Presentation Infographics Visual Aids
This is a area chart ppt powerpoint presentation infographics visual aids. This is a two stage process. The stages in this process are product, area chart, in percentage, growth, success.
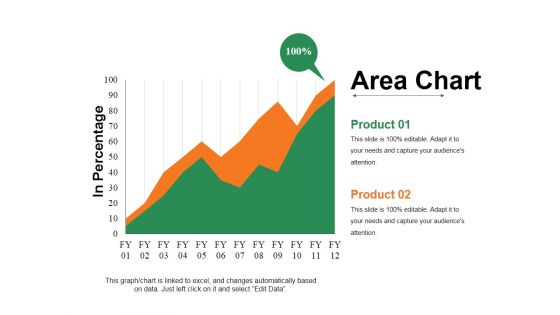
Area Chart Ppt PowerPoint Presentation Infographic Template Guidelines
This is a area chart ppt powerpoint presentation infographic template guidelines. This is a two stage process. The stages in this process are in percentage, chart, business, growth, strategy.

Area Chart Ppt PowerPoint Presentation Infographic Template Layout
This is a area chart ppt powerpoint presentation infographic template layout. This is a two stage process. The stages in this process are product, profit, area chart, growth, success.
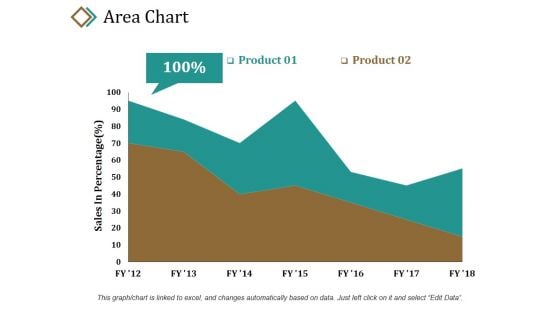
Area Chart Ppt PowerPoint Presentation Summary Example Introduction
This is a area chart ppt powerpoint presentation summary example introduction. This is a two stage process. The stages in this process are product, sales in percentage, percentage, area chart, business.
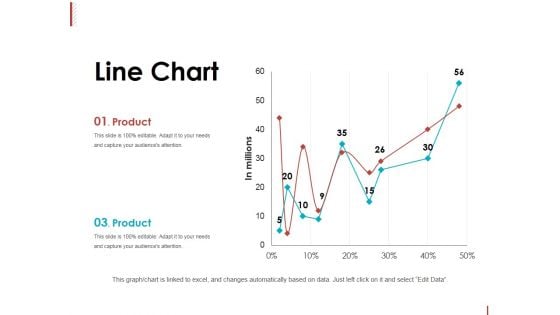
Line Chart Ppt PowerPoint Presentation Slides Graphics Tutorials
This is a line chart ppt powerpoint presentation slides graphics tutorials. This is a two stage process. The stages in this process are product, in millions, line chart, percentage, finance.

Combo Chart Ppt PowerPoint Presentation Inspiration Slide Portrait
This is a combo chart ppt powerpoint presentation inspiration slide portrait. This is a three stage process. The stages in this process are product, market size, bar chart, growth, success.
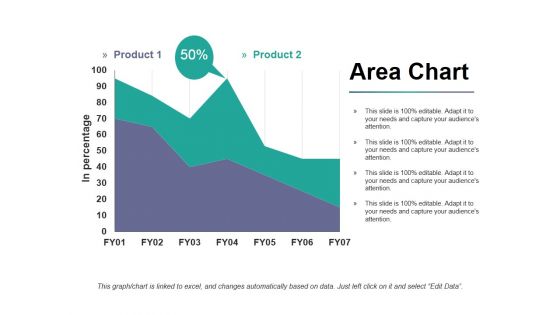
Area Chart Ppt PowerPoint Presentation Styles Graphics Download
This is a area chart ppt powerpoint presentation styles graphics download. This is a two stage process. The stages in this process are product, in percentage, area chart, business, marketing.
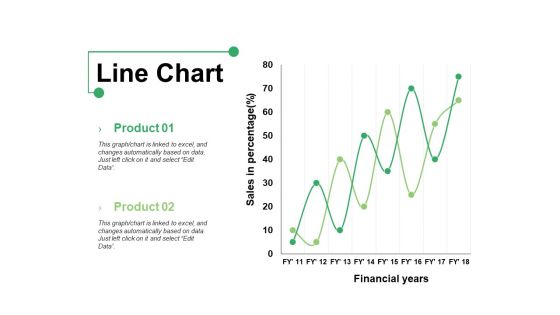
Line Chart Ppt PowerPoint Presentation Show Graphics Example
This is a line chart ppt powerpoint presentation show graphics example. This is a two stage process. The stages in this process are product, line chart, financial years, sales in percentage.
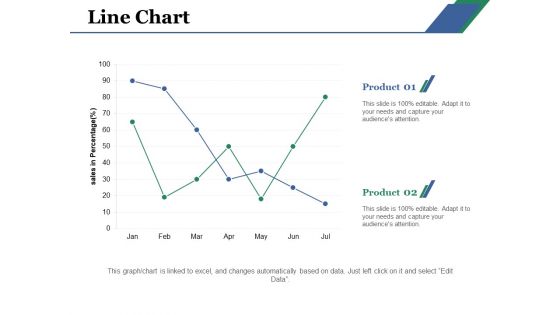
Line Chart Ppt PowerPoint Presentation Layouts Example File
This is a line chart ppt powerpoint presentation layouts example file. This is a two stage process. The stages in this process are line chart, product, business, sales, analysis.
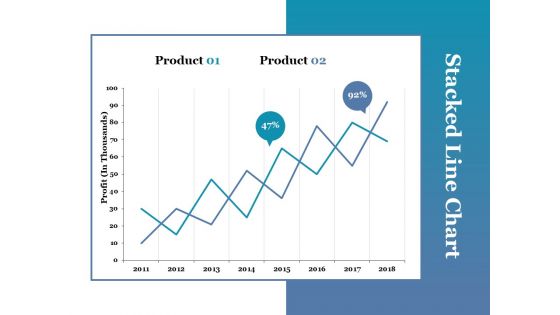
Stacked Line Chart Ppt PowerPoint Presentation Portfolio Picture
This is a stacked line chart ppt powerpoint presentation portfolio picture. This is a two stage process. The stages in this process are stacked line chart, product, profit, growth.
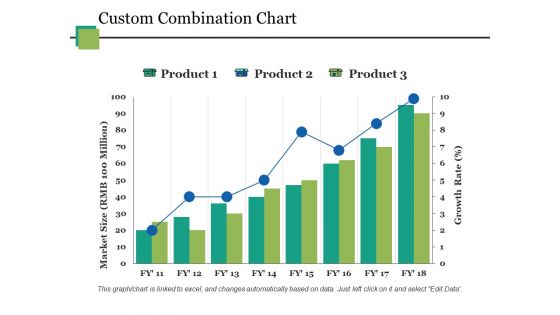
Custom Combination Chart Ppt PowerPoint Presentation Styles Good
This is a custom combination chart ppt powerpoint presentation styles good. This is a three stage process. The stages in this process are custom combination chart, finance, business, planning, marketing.
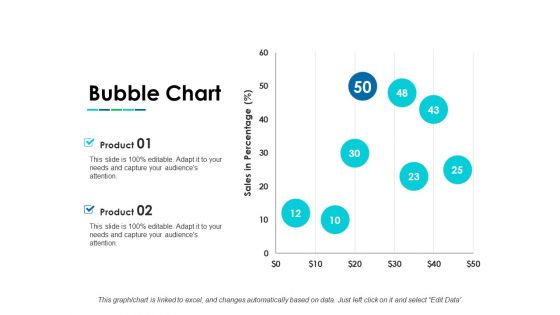
Bubble Chart Ppt PowerPoint Presentation Infographic Template Layouts
This is a bubble chart ppt powerpoint presentation infographic template layouts. This is a two stage process. The stages in this process are bubble chart, product, sales in percentage, growth.

Column Chart Ppt PowerPoint Presentation Gallery Background Images
This is a column chart ppt powerpoint presentation gallery background images. This is a two stage process. The stages in this process are column chart, product, year, growth, expenditure.

 Home
Home