Concept Icon
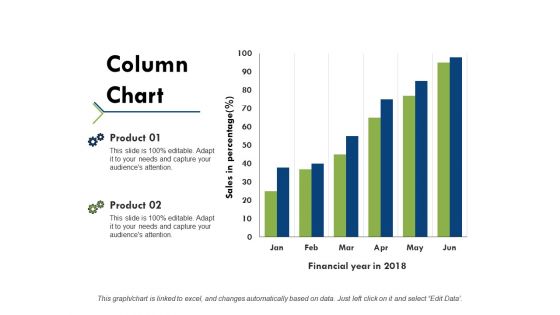
Column Chart Ppt PowerPoint Presentation Portfolio Example Topics
This is a column chart ppt powerpoint presentation portfolio example topics. This is a two stage process. The stages in this process are product, financial year, sales in percentage, column chart.
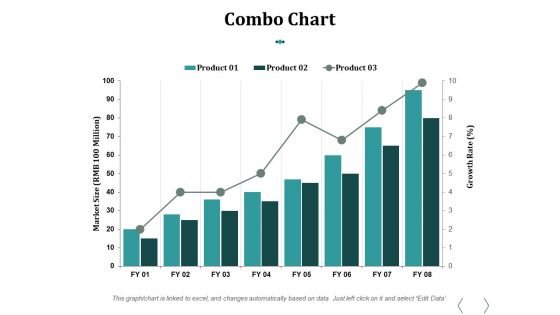
Combo Chart Ppt PowerPoint Presentation Summary Graphic Images
This is a combo chart ppt powerpoint presentation summary graphic images. This is a three stage process. The stages in this process are combo chart, product, growth, marketing, business.
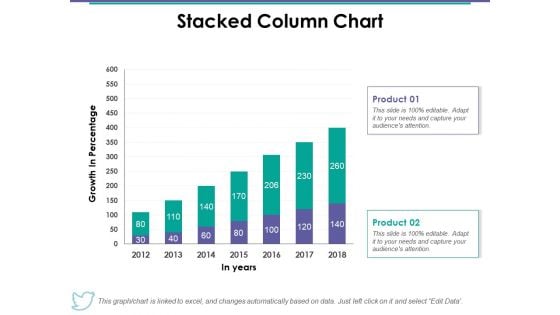
Stacked Column Chart Ppt PowerPoint Presentation Summary Gallery
This is a stacked column chart ppt powerpoint presentation summary gallery. This is a two stage process. The stages in this process are stacked column chart, product, in years, growth, percentage.
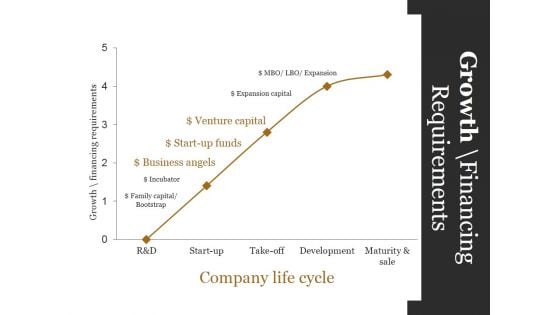
Growth Financing Requirements Ppt PowerPoint Presentation Gallery Ideas
This is a growth financing requirements ppt powerpoint presentation gallery ideas. This is a five stage process. The stages in this process are business angels, startup funds, venture capital, expansion capital, expansion.
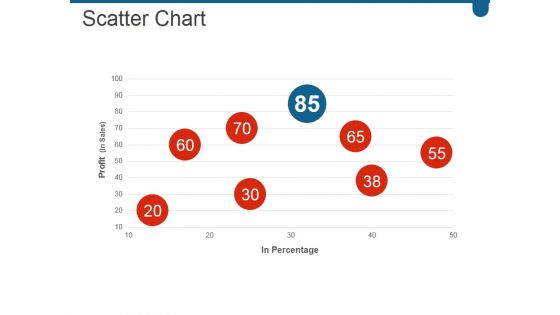
Scatter Chart Ppt PowerPoint Presentation Visual Aids Deck
This is a scatter chart ppt powerpoint presentation visual aids deck. This is a five stage process. The stages in this process are scatter, business, marketing, success, growth.
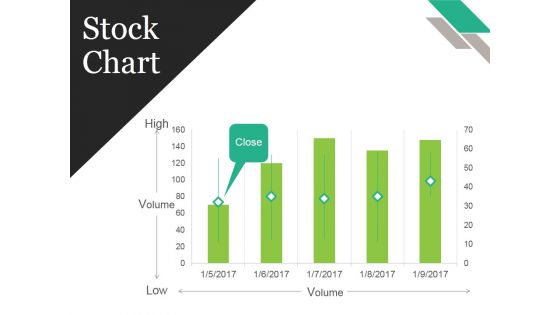
Stock Chart Ppt PowerPoint Presentation Show Graphics Design
This is a stock chart ppt powerpoint presentation show graphics design. This is a five stage process. The stages in this process are business, strategy, marketing, analysis, growth.
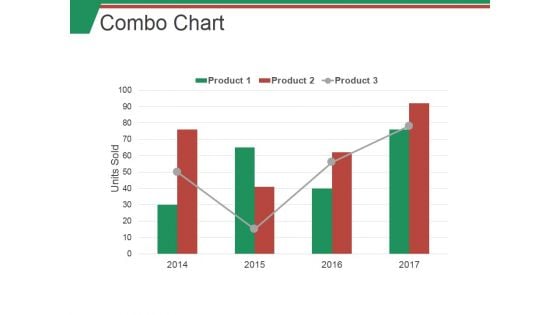
Combo Chart Ppt PowerPoint Presentation Styles Example Topics
This is a combo chart ppt powerpoint presentation styles example topics. This is a four stage process. The stages in this process are bar, success, growth, business, marketing.
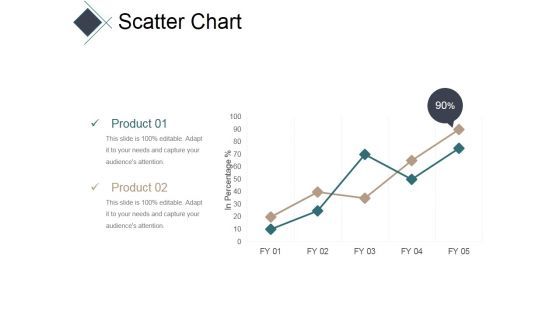
Scatter Chart Ppt PowerPoint Presentation Pictures Slide Portrait
This is a scatter chart ppt powerpoint presentation pictures slide portrait. This is a two stage process. The stages in this process are business, line, graph, success, finance.
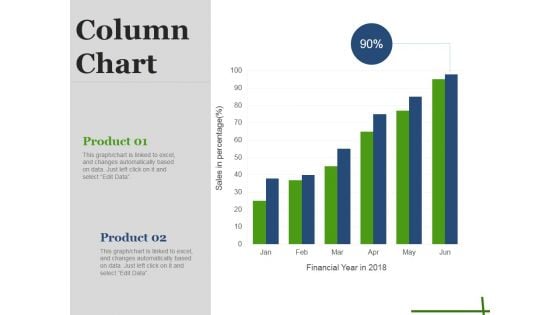
Column Chart Ppt PowerPoint Presentation Pictures Background Images
This is a column chart ppt powerpoint presentation pictures background images. This is a six stage process. The stages in this process are business, marketing, strategy, bar, success.

Column Chart Ppt PowerPoint Presentation Model Design Inspiration
This is a column chart ppt powerpoint presentation model design inspiration. This is a three stage process. The stages in this process are business, marketing, bar, graph, plan.
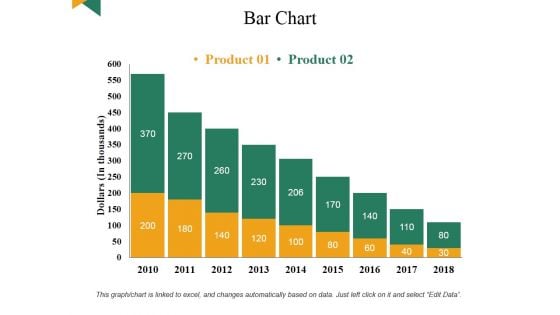
Bar Chart Ppt PowerPoint Presentation Infographic Template Portfolio
This is a bar chart ppt powerpoint presentation infographic template portfolio. This is a two stage process. The stages in this process are bar, strategy, finance, marketing, planning.
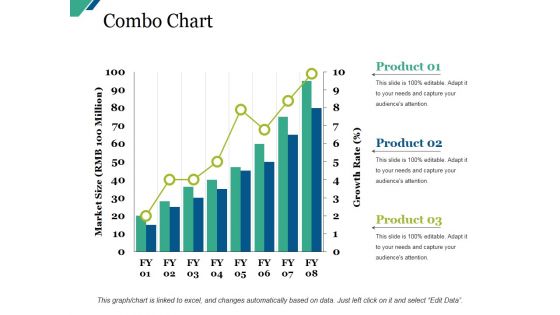
Combo Chart Ppt PowerPoint Presentation Visual Aids Outline
This is a combo chart ppt powerpoint presentation visual aids outline. This is a three stage process. The stages in this process are business, marketing, strategy, finance, growth.
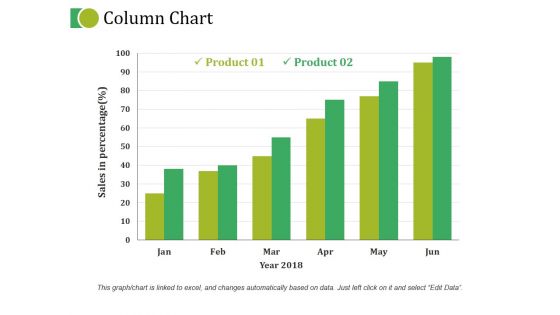
Column Chart Ppt PowerPoint Presentation Gallery File Formats
This is a column chart ppt powerpoint presentation gallery file formats. This is a six stage process. The stages in this process are growth, marketing, strategy, planning, finance.
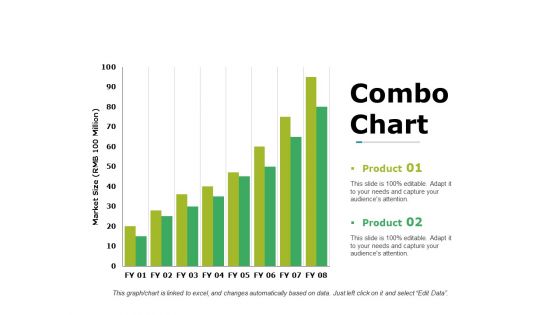
Combo Chart Ppt PowerPoint Presentation Gallery Background Designs
This is a combo chart ppt powerpoint presentation gallery background designs. This is a two stage process. The stages in this process are business, marketing, planning, finance, growth.
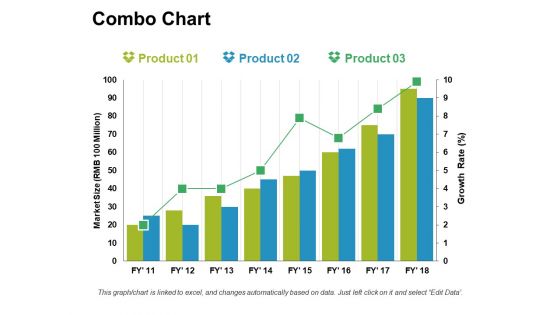
Combo Chart Ppt PowerPoint Presentation Summary Graphics Example
This is a combo chart ppt powerpoint presentation summary graphics example. This is a three stage process. The stages in this process are product, growth, marketing.
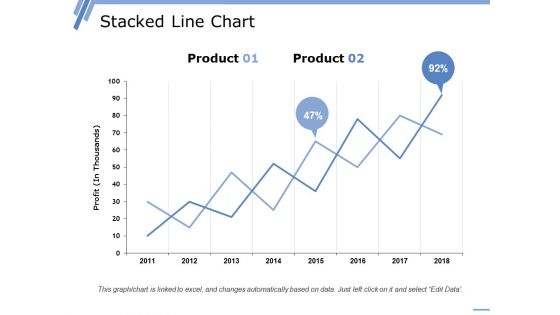
Stacked Line Chart Ppt PowerPoint Presentation Styles Graphics
This is a stacked line chart ppt powerpoint presentation styles graphics. This is a two stage process. The stages in this process are product, year, profit, percentage, growth.
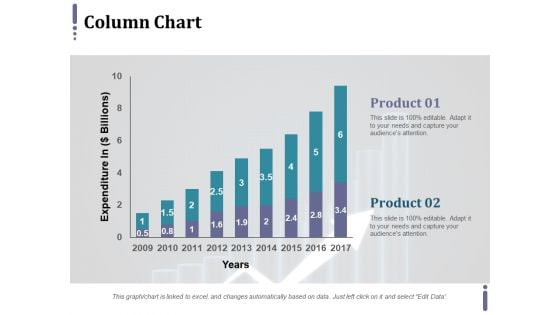
Column Chart Ppt PowerPoint Presentation Model Graphics Example
This is a column chart ppt powerpoint presentation model graphics example. This is a two stage process. The stages in this process are expenditure in, product, years.
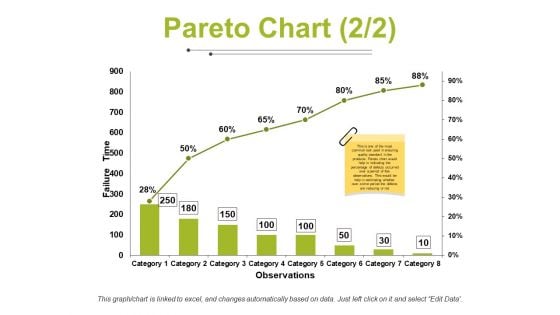
Pareto Chart Template 2 Ppt PowerPoint Presentation Gallery Microsoft
This is a pareto chart template 2 ppt powerpoint presentation gallery microsoft. This is a eight stage process. The stages in this process are failure time, observations, category.
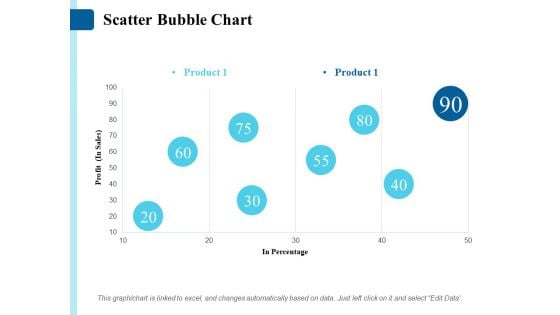
Scatter Bubble Chart Ppt PowerPoint Presentation Summary Slides
This is a scatter bubble chart ppt powerpoint presentation summary slides. This is a one stage process. The stages in this process are product, profit, in percentage.

Column Chart Finance Ppt PowerPoint Presentation Styles Backgrounds
This is a column chart finance ppt powerpoint presentation styles backgrounds. This is a three stage process. The stages in this process are finance, marketing, management, investment, analysis.
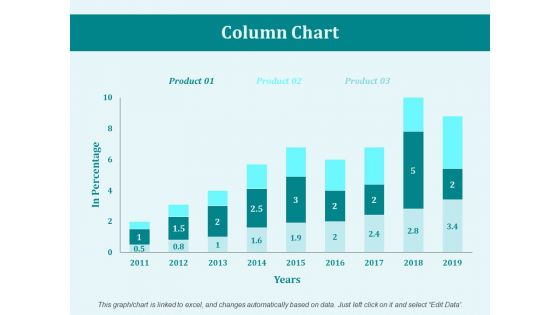
Column Chart Marketing Ppt PowerPoint Presentation Summary Images
This is a column chart marketing ppt powerpoint presentation summary images. This is a three stage process. The stages in this process are business, management, marketing, product, percentage.
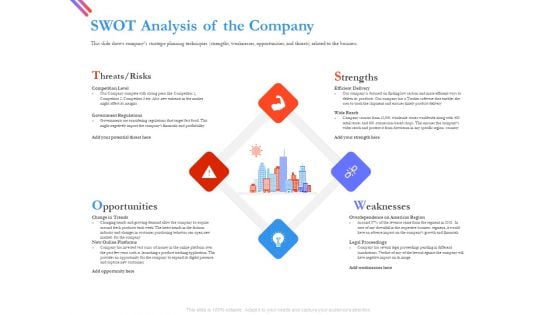
Pitch Deck For Fund Raising From Series C Funding SWOT Analysis Of The Company Themes PDF
This slide shows companys strategic planning techniques strengths, weaknesses, opportunities, and threats related to the business. This is a pitch deck for fund raising from series c funding swot analysis of the company themes pdf template with various stages. Focus and dispense information on four stages using this creative set, that comes with editable features. It contains large content boxes to add your information on topics like threats, opportunities, strengths, weaknesses. You can also showcase facts, figures, and other relevant content using this PPT layout. Grab it now.
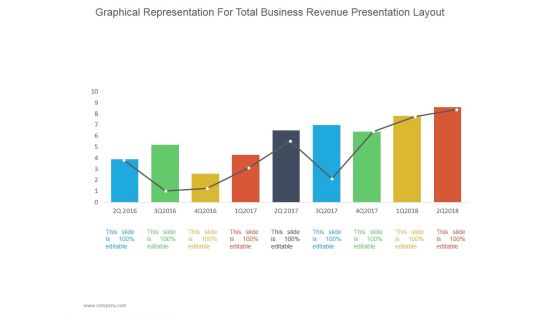
Graphical Representation For Total Business Revenue Ppt PowerPoint Presentation Diagrams
This is a graphical representation for total business revenue ppt powerpoint presentation diagrams. This is a nine stage process. The stages in this process are business, strategy, line chart, bar graph, marketing, management.
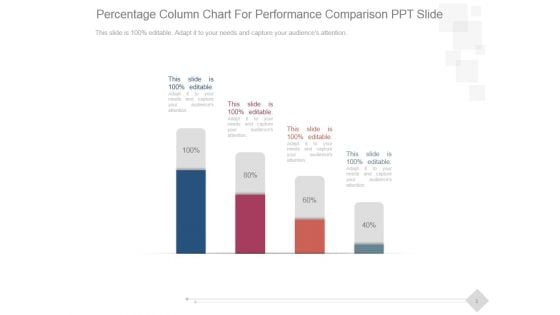
Percentage Column Chart For Performance Comparison Ppt PowerPoint Presentation Good
This is a percentage column chart for performance comparison ppt powerpoint presentation good. This is a four stage process. The stages in this process are business, marketing, technology, presentation, management.
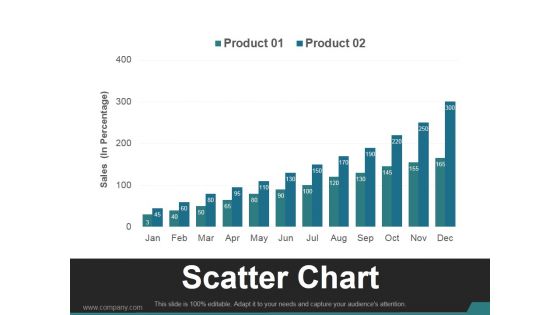
Scatter Chart Template 1 Ppt PowerPoint Presentation Visual Aids
This is a scatter chart template 1 ppt powerpoint presentation visual aids. This is a twelve stage process. The stages in this process are business, marketing, growth, finance, management.
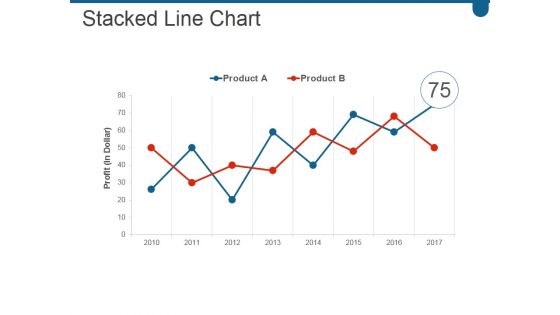
Stacked Line Chart Ppt PowerPoint Presentation Infographic Template Show
This is a stacked line chart ppt powerpoint presentation infographic template show. This is a two stage process. The stages in this process are business, marketing, growth, success, line.
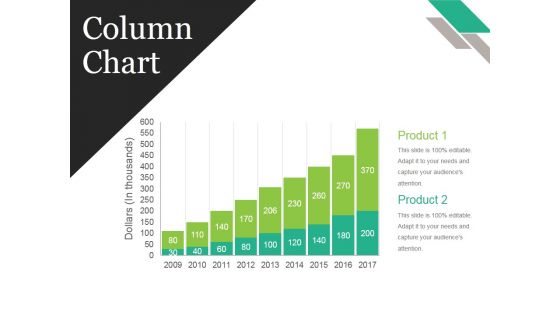
Column Chart Ppt PowerPoint Presentation Show Background Images
This is a column chart ppt powerpoint presentation show background images. This is a nine stage process. The stages in this process are business, strategy, marketing, analysis, growth strategy.
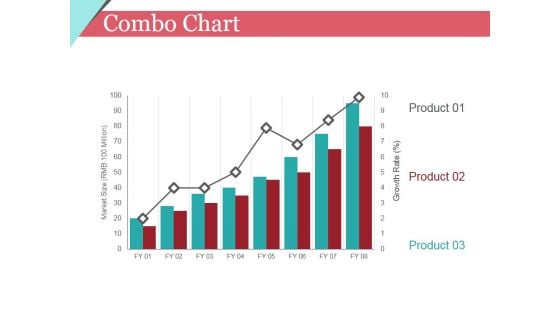
Combo Chart Ppt PowerPoint Presentation Summary Graphics Tutorials
This is a combo chart ppt powerpoint presentation summary graphics tutorials. This is a eight stage process. The stages in this process are product, growth rate, market size, business.
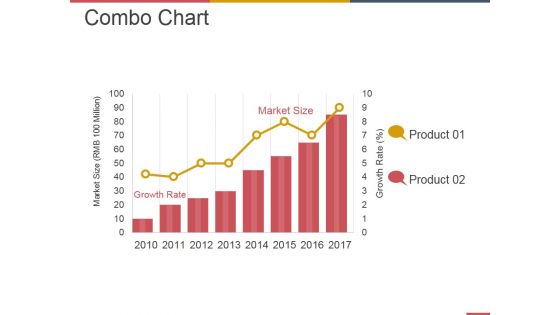
Combo Chart Ppt PowerPoint Presentation Infographic Template Deck
This is a combo chart ppt powerpoint presentation infographic template deck. This is a eight stage process. The stages in this process are business, strategy, marketing, analysis, growth strategy, market size.

Combo Chart Ppt PowerPoint Presentation Infographic Template Influencers
This is a combo chart ppt powerpoint presentation infographic template influencers. This is a three stage process. The stages in this process are market size rmb million, growth rate.
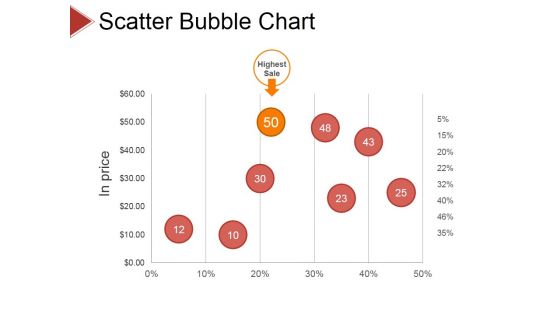
Scatter Bubble Chart Ppt PowerPoint Presentation Pictures Show
This is a scatter bubble chart ppt powerpoint presentation pictures show. This is a eight stage process. The stages in this process are business, strategy, analysis, pretention, highest sale.
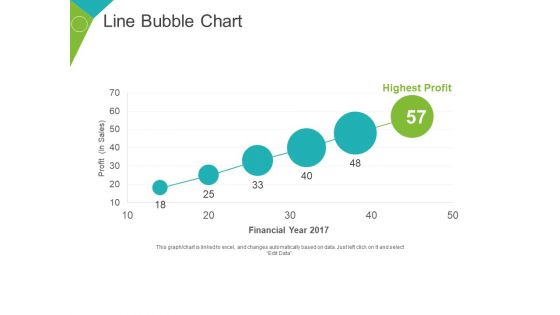
Line Bubble Chart Ppt PowerPoint Presentation Portfolio Slide Portrait
This is a line bubble chart ppt powerpoint presentation portfolio slide portrait. This is a six stage process. The stages in this process are highest profit, financial year, profit in sales, growth, business.
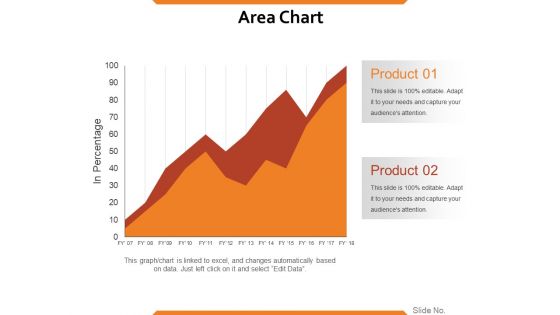
Area Chart Ppt PowerPoint Presentation Inspiration Slide Download
This is a area chart ppt powerpoint presentation inspiration slide download. This is a two stage process. The stages in this process are product, in percentage, business, growth, strategy, finance.
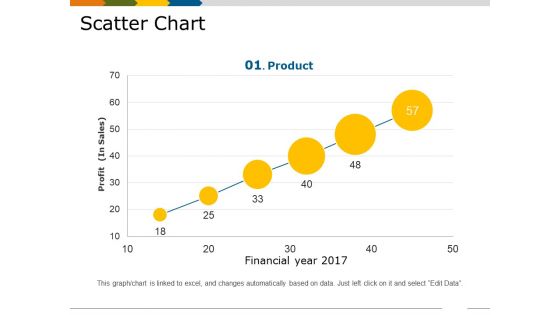
Scatter Chart Template 1 Ppt PowerPoint Presentation Show Slides
This is a scatter chart template 1 ppt powerpoint presentation show slides. This is a six stage process. The stages in this process are financial year, profit in sales, growth, business, marketing, product.
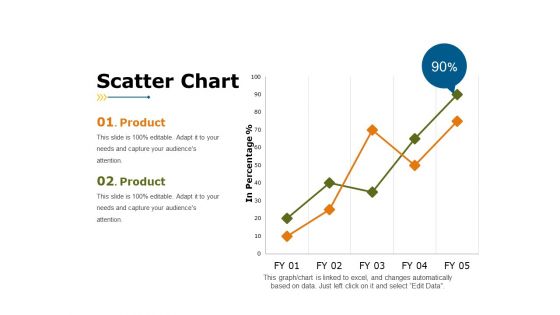
Scatter Chart Template 2 Ppt PowerPoint Presentation Styles Visual Aids
This is a scatter chart template 2 ppt powerpoint presentation styles visual aids. This is a two stage process. The stages in this process are product, business, marketing, in percentage, growth.
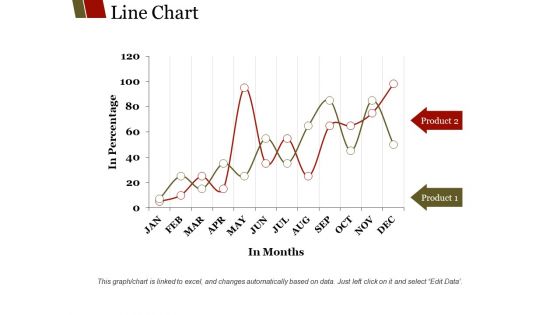
Line Chart Ppt PowerPoint Presentation Show Background Designs
This is a line chart ppt powerpoint presentation show background designs. This is a two stage process. The stages in this process are product, in months, in percentage, business.
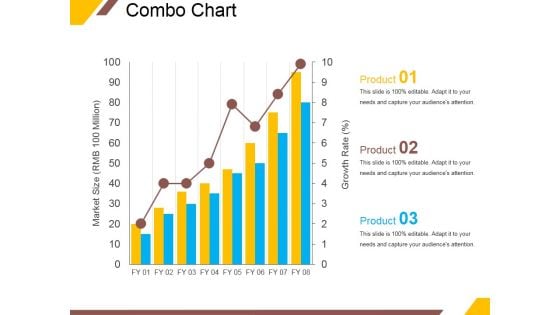
Combo Chart Ppt PowerPoint Presentation Professional Slide Download
This is a combo chart ppt powerpoint presentation professional slide download. This is a three stage process. The stages in this process are market size, growth rate, product, graph, growth.
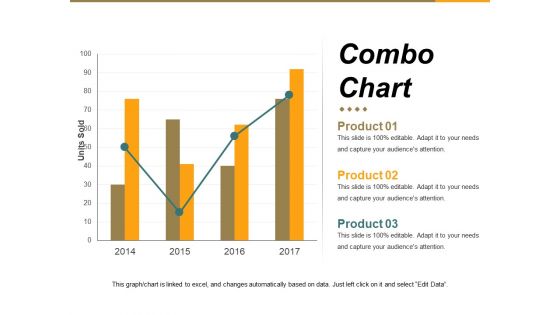
Combo Chart Ppt PowerPoint Presentation Infographics Example Introduction
This is a combo chart ppt powerpoint presentation infographics example introduction. This is a four stage process. The stages in this process are units sold, business, marketing, graph, growth.
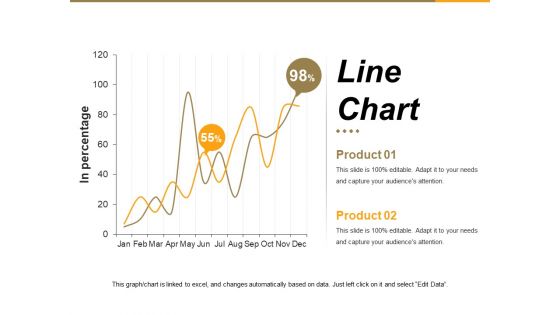
Line Chart Ppt PowerPoint Presentation Summary File Formats
This is a line chart ppt powerpoint presentation summary file formats. This is a two stage process. The stages in this process are in percentage, graph, business, marketing, growth.
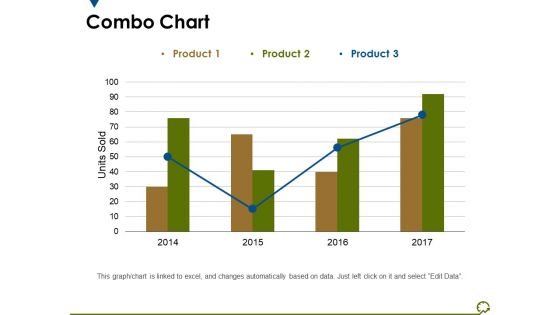
Combo Chart Ppt PowerPoint Presentation Outline Graphics Tutorials
This is a combo chart ppt powerpoint presentation outline graphics tutorials. This is a three stage process. The stages in this process are units sold, years, business, marketing, graph.

Line Chart Ppt PowerPoint Presentation Infographics Graphic Images
This is a line chart ppt powerpoint presentation infographics graphic images. This is a two stage process. The stages in this process are sales in percentage, financial years, growth, business, marketing.
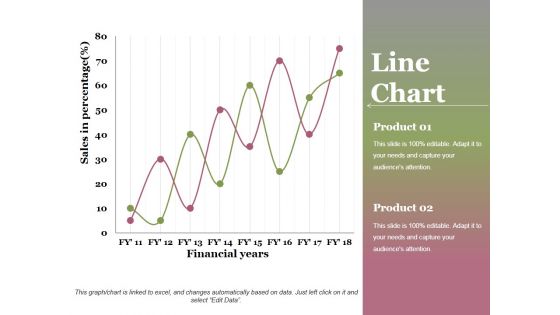
Line Chart Ppt PowerPoint Presentation Professional Graphics Design
This is a line chart ppt powerpoint presentation professional graphics design. This is a two stage process. The stages in this process are financial years, sales in percentage, product, growth, success.
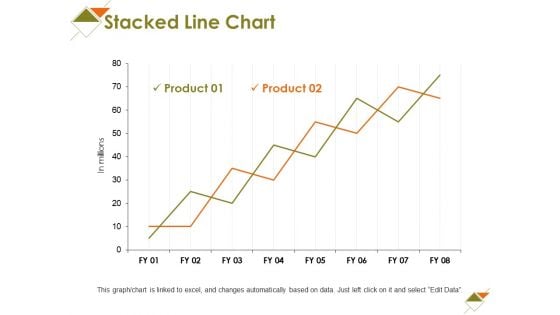
Stacked Line Chart Ppt PowerPoint Presentation File Display
This is a stacked line chart ppt powerpoint presentation file display. This is a two stage process. The stages in this process are business, marketing, graph, strategy, in millions.
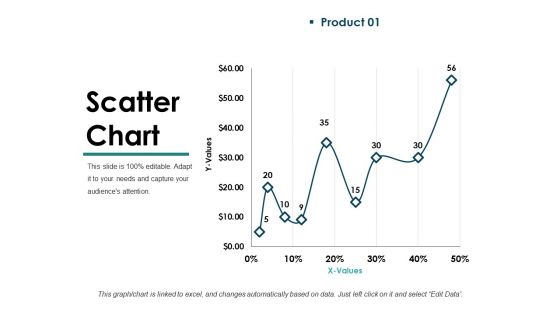
Scatter Chart Template 1 Ppt PowerPoint Presentation Inspiration Guidelines
This is a scatter chart template 1 ppt powerpoint presentation inspiration guidelines. This is a one stage process. The stages in this process are business, marketing, graph, values, growth.
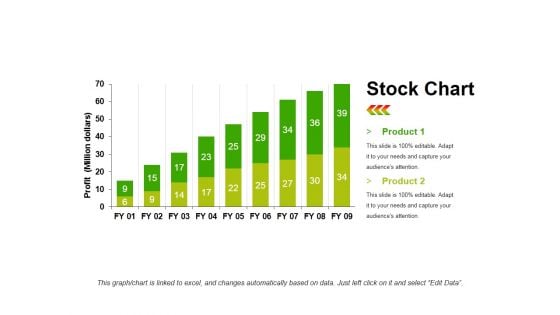
Stock Chart Template 1 Ppt PowerPoint Presentation Infographic Template Objects
This is a stock chart template 1 ppt powerpoint presentation infographic template objects. This is a two stage process. The stages in this process are product, profit, bar graph, growth, success.
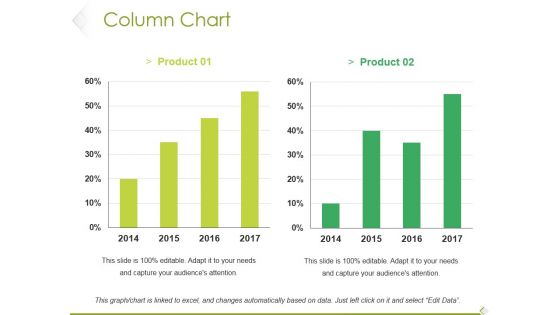
Column Chart Ppt PowerPoint Presentation Model Clipart Images
This is a column chart ppt powerpoint presentation model clipart images. This is a two stage process. The stages in this process are product, bar graph, growth, success, business.
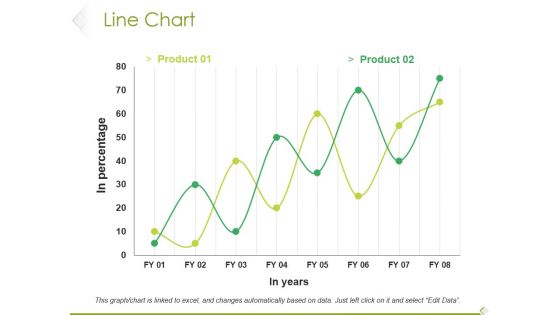
Line Chart Ppt PowerPoint Presentation File Example File
This is a line chart ppt powerpoint presentation file example file. This is a two stage process. The stages in this process are product, in percentage, in years, growth, success.
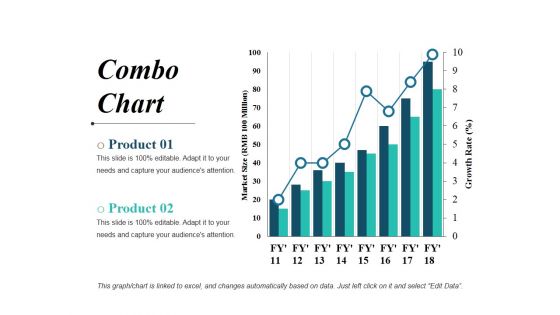
Combo Chart Ppt PowerPoint Presentation File Visual Aids
This is a combo chart ppt powerpoint presentation file visual aids. This is a two stage process. The stages in this process are bar graph, business, marketing, finance, planning.
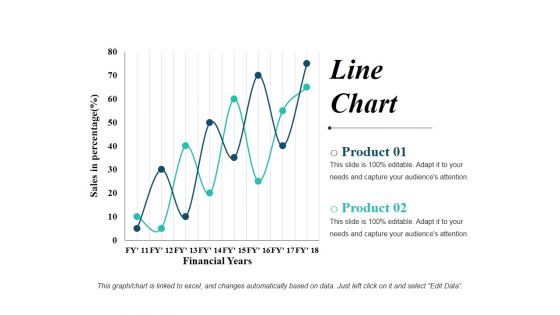
Line Chart Ppt PowerPoint Presentation Show Graphics Design
This is a line chart ppt powerpoint presentation show graphics design. This is a two stage process. The stages in this process are line graph, business, marketing, finance, planning.
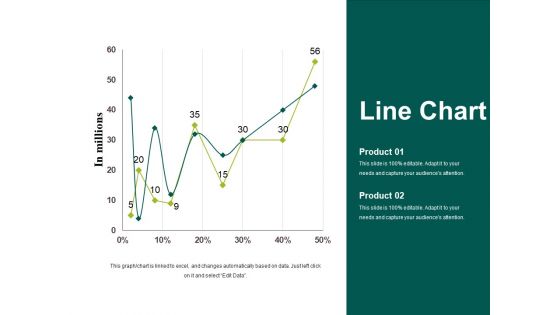
Line Chart Template 1 Ppt PowerPoint Presentation Styles Graphics Tutorials
This is a line chart template 1 ppt powerpoint presentation styles graphics tutorials. This is a two stage process. The stages in this process are in millions, business, marketing, strategy, graph.
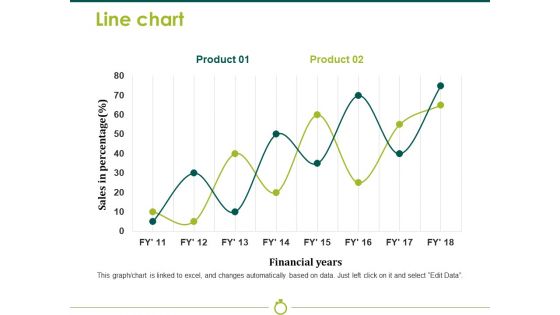
Line Chart Template 2 Ppt PowerPoint Presentation Model Background Image
This is a line chart template 2 ppt powerpoint presentation model background image. This is a two stage process. The stages in this process are sales in percentage, financial years, business, marketing, strategy, graph.
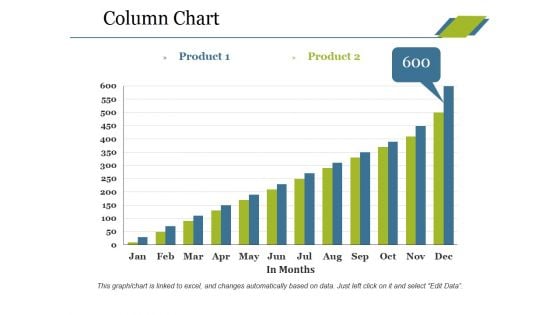
Column Chart Ppt PowerPoint Presentation Layouts Background Images
This is a column chart ppt powerpoint presentation layouts background images. This is a two stage process. The stages in this process are product, in months, graph, growth, success.
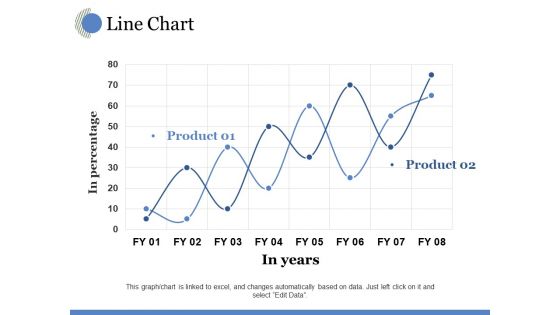
Line Chart Ppt PowerPoint Presentation Model Visual Aids
This is a line chart ppt powerpoint presentation model visual aids. This is a two stage process. The stages in this process are in years, in percentage, growth, business, marketing.

Line Chart Ppt PowerPoint Presentation Gallery Example Topics
This is a line chart ppt powerpoint presentation gallery example topics. This is a two stage process. The stages in this process are in millions, business, marketing, strategy, graph.
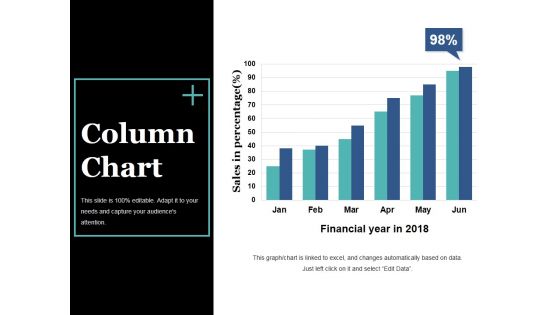
Column Chart Ppt PowerPoint Presentation Slides Visual Aids
This is a column chart ppt powerpoint presentation slides visual aids. This is a six stage process. The stages in this process are bar graph, growth, success, sales in percentage, financial year.
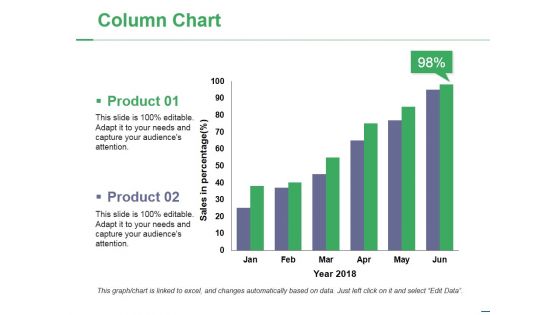
Column Chart Ppt PowerPoint Presentation Portfolio Slide Download
This is a column chart ppt powerpoint presentation portfolio slide download. This is a two stage process. The stages in this process are product, year, bar graph, success, business.
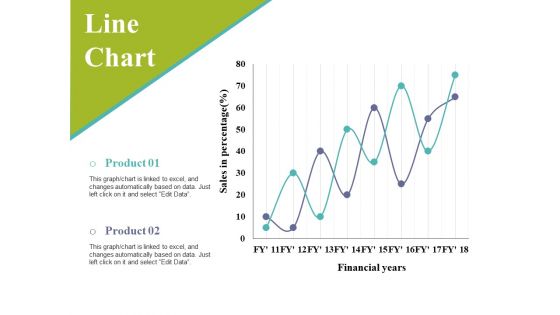
Line Chart Ppt PowerPoint Presentation Infographic Template Slides
This is a line chart ppt powerpoint presentation infographic template slides. This is a two stage process. The stages in this process are sales in percentage, financial years, business, marketing, graph.
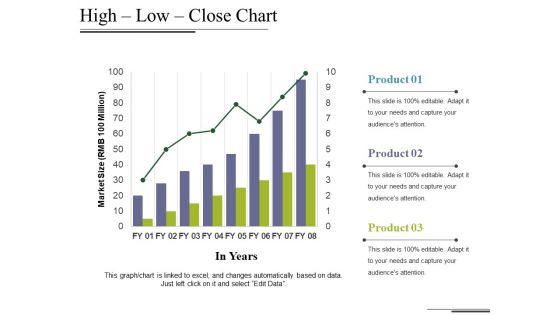
High Low Close Chart Ppt PowerPoint Presentation Styles Maker
This is a high low close chart ppt powerpoint presentation styles maker. This is a three stage process. The stages in this process are market size, in years, growth, business, marketing, graph.
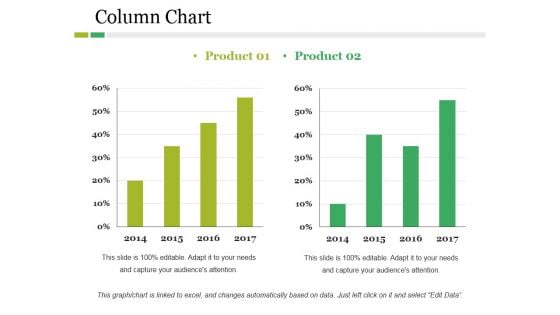
Column Chart Ppt PowerPoint Presentation Layouts Graphics Example
This is a column chart ppt powerpoint presentation layouts graphics example. This is a two stage process. The stages in this process are product, year, bar graph, business, finance.
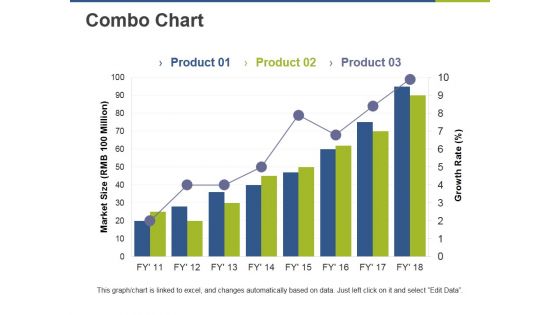
Combo Chart Ppt PowerPoint Presentation Pictures Graphic Images
This is a combo chart ppt powerpoint presentation pictures graphic images. This is a three stage process. The stages in this process are bar graph, growth, market size, growth rate, success.
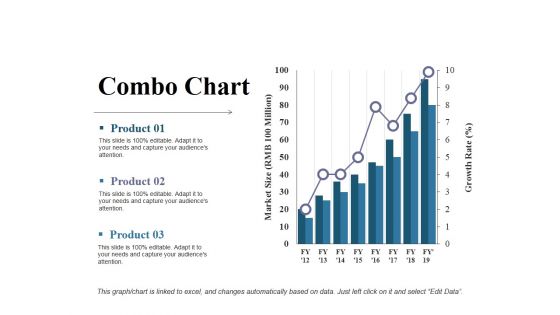
Combo Chart Ppt PowerPoint Presentation Styles Example Introduction
This is a combo chart ppt powerpoint presentation styles example introduction. This is a three stage process. The stages in this process are product, growth rate, market size, growth, success.

Column Chart Ppt PowerPoint Presentation Styles Graphics Design
This is a column chart ppt powerpoint presentation styles graphics design. This is a two stage process. The stages in this process are expenditure in, product, years, growth, success.
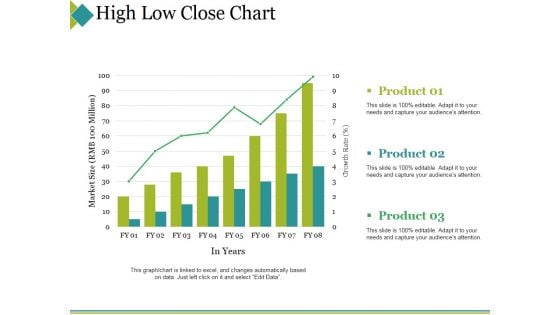
High Low Close Chart Ppt PowerPoint Presentation Portfolio Topics
This is a high low close chart ppt powerpoint presentation portfolio topics. This is a three stage process. The stages in this process are product, market size, in years, success, bar graph.

Column Chart Ppt PowerPoint Presentation Pictures Graphic Images
This is a column chart ppt powerpoint presentation pictures graphic images. This is a two stage process. The stages in this process are product, years, growth, success, bar graph.
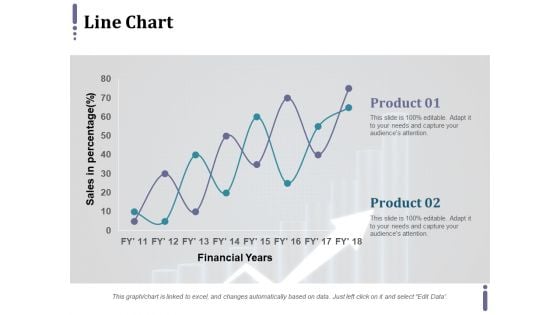
Line Chart Ppt PowerPoint Presentation Infographic Template Master Slide
This is a line chart ppt powerpoint presentation infographic template master slide. This is a two stage process. The stages in this process are product, financial years, sales in percentage.
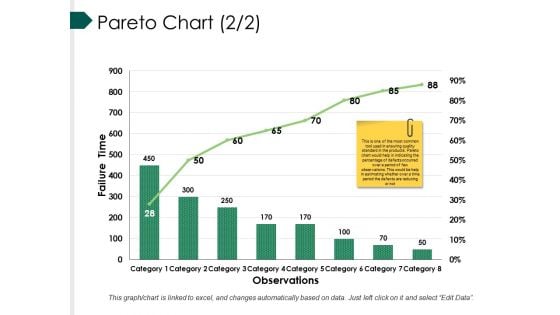
Pareto Chart Template Ppt PowerPoint Presentation Summary Graphic Images
This is a pareto chart template ppt powerpoint presentation summary graphic images. This is a eight stage process. The stages in this process are bar, marketing, strategy, finance, teamwork.
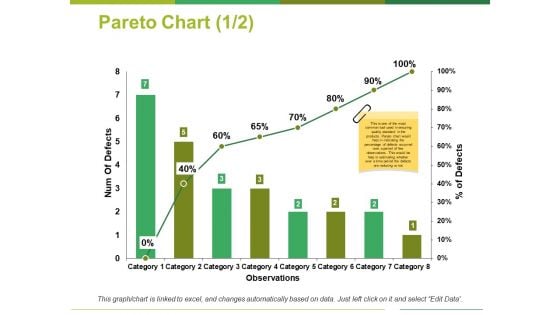
Pareto Chart Template 1 Ppt PowerPoint Presentation Outline Show
This is a pareto chart template 1 ppt powerpoint presentation outline show. This is a eight stage process. The stages in this process are num of defects, percentage of defects, observations, category.

Regression Line Chart Ppt PowerPoint Presentation Visual Aids Summary
This is a regression line chart ppt powerpoint presentation visual aids summary. This is a two stage process. The stages in this process are linear periodization, linear growth, linear progression.
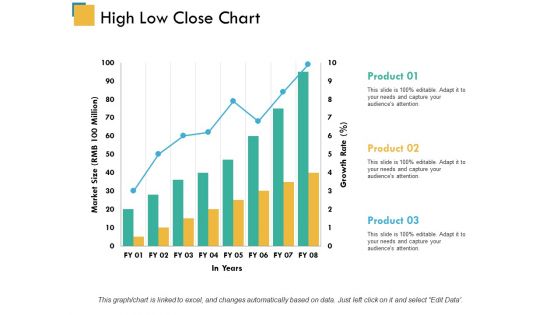
High Low Close Chart Ppt PowerPoint Presentation Model Inspiration
This is a high low close chart ppt powerpoint presentation model inspiration. This is a three stage process. The stages in this process are product, market size, in years.
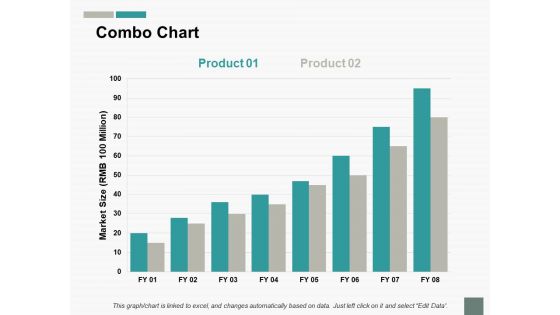
Combo Chart Finance Ppt PowerPoint Presentation Infographic Template Graphics
This is a combo chart finance ppt powerpoint presentation infographic template graphics. This is a two stage process. The stages in this process are growth, finance, marketing, management, investment.
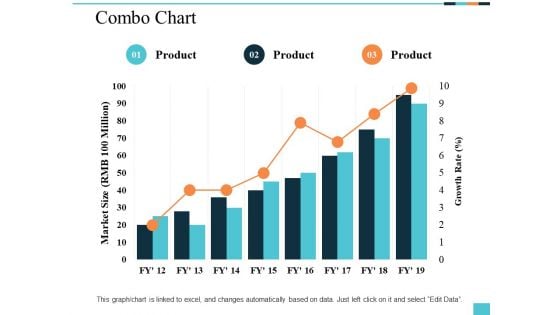
Combo Chart Product Ppt PowerPoint Presentation Professional Graphics Template
This is a combo chart product ppt powerpoint presentation professional graphics template. This is a three stage process. The stages in this process are finance, marketing, management, investment, product.
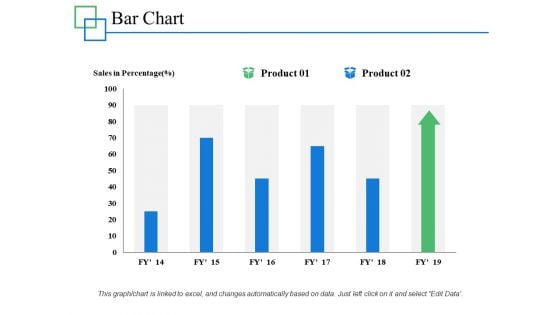
Bar Chart Percentage Product Ppt PowerPoint Presentation Layouts Designs Download
This is a bar chart percentage product ppt powerpoint presentation layouts designs download. This is a two stage process. The stages in this process are percentage, product, business, management.
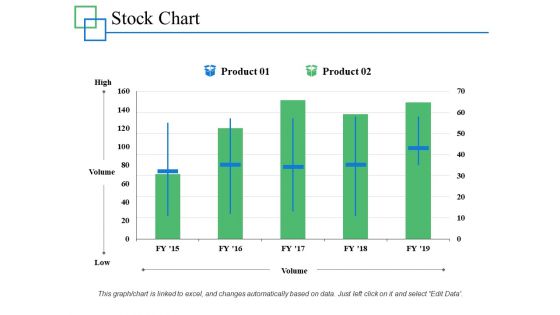
Stock Chart Management Investment Ppt PowerPoint Presentation Infographics Professional
This is a stock chart management investment ppt powerpoint presentation infographics professional. This is a two stage process. The stages in this process are marketing, business, management, percentage, product.
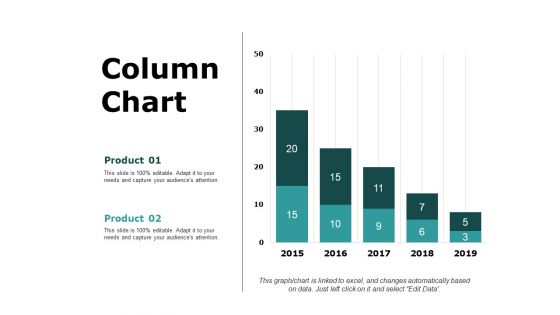
Column Chart Finance Marketing Ppt PowerPoint Presentation Model Example Introduction
This is a column chart finance marketing ppt powerpoint presentation model example introduction. This is a two stage process. The stages in this process are business, management, marketing, percentage, product.
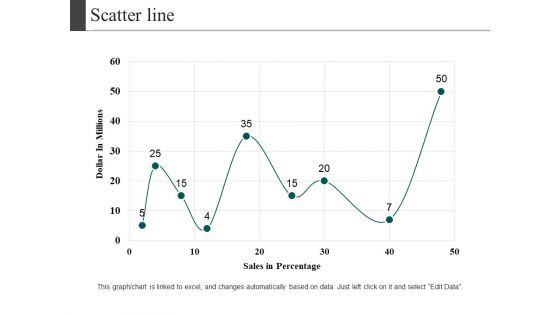
Scatter Line Ppt PowerPoint Presentation Visual Aids Diagrams
This is a scatter line ppt powerpoint presentation visual aids diagrams. This is a one stage process. The stages in this process are dollar in millions, sales in percentage, growth, business, marketing.
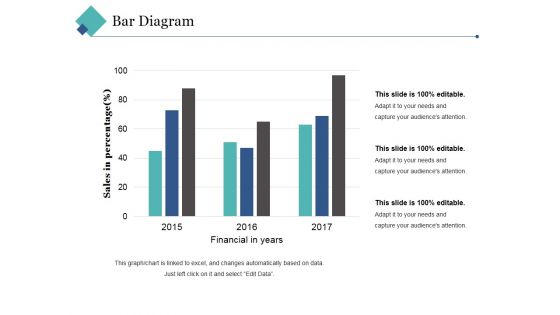
Bar Diagram Ppt PowerPoint Presentation Pictures Background Image
This is a bar diagram ppt powerpoint presentation pictures background image. This is a three stage process. The stages in this process are financial in years, sales in percentage, bar graph, growth, success.
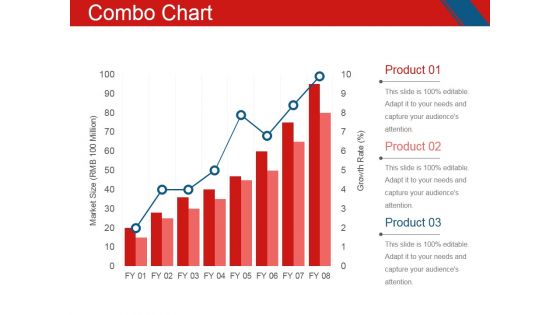
Combo Chart Ppt PowerPoint Presentation Inspiration Graphics Pictures
This is a combo chart ppt powerpoint presentation inspiration graphics pictures. This is a eight stage process. The stages in this process are business, marketing, chart, growth, product.
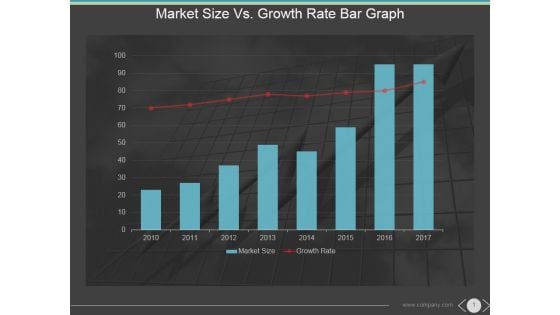
Market Size Vs Growth Rate Bar Graph Ppt PowerPoint Presentation Themes
This is a market size vs growth rate bar graph ppt powerpoint presentation themes. This is a eight stage process. The stages in this process are market size, growth rate, years, future, graph.
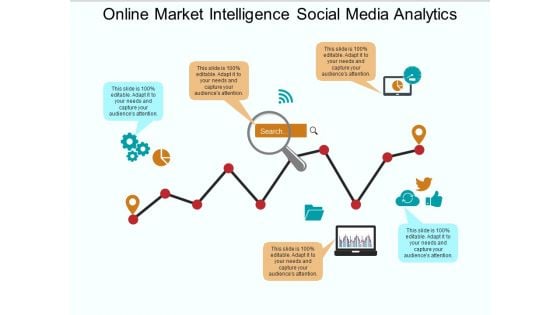
Online Market Intelligence Social Media Analytics Ppt PowerPoint Presentation Infographics Themes
This is a online market intelligence social media analytics ppt powerpoint presentation infographics themes. This is a five stage process. The stages in this process are digital analytics, digital dashboard, marketing.
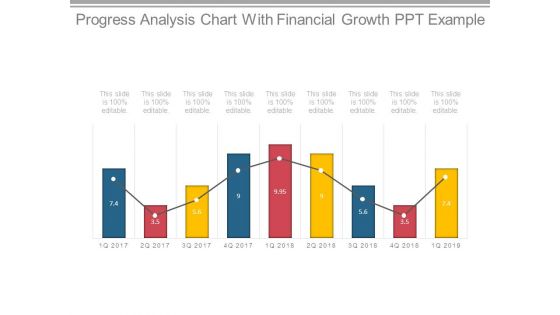
Progress Analysis Chart With Financial Growth Ppt Example
This is a progress analysis chart with financial growth ppt example. This is a nine stage process. The stages in this process are chart, years, business, growth, marketing, management.
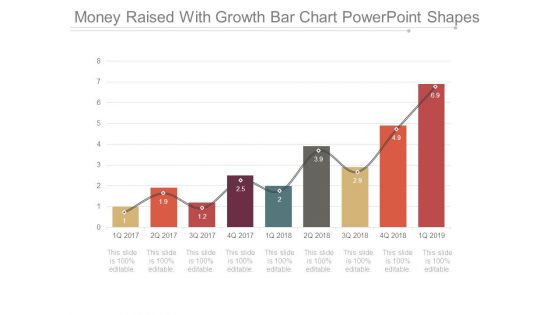
Money Raised With Growth Bar Chart Powerpoint Shapes
This is a money raised with growth bar chart powerpoint shapes. This is a nine stage process. The stages in this process are bar chart, growth, business, success, management.
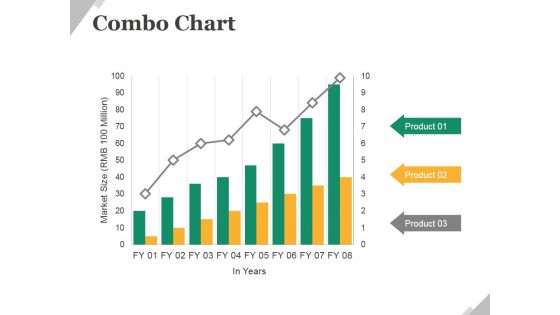
Combo Chart Ppt PowerPoint Presentation Infographics Example Topics
This is a combo chart ppt powerpoint presentation infographics example topics. This is a eight stage process. The stages in this process are business, marketing, growth, combo chart, management.

Combo Chart Ppt PowerPoint Presentation Summary Design Templates
This is a combo chart ppt powerpoint presentation summary design templates. This is a four stage process. The stages in this process are units sold, product, combo chart, years, planning.
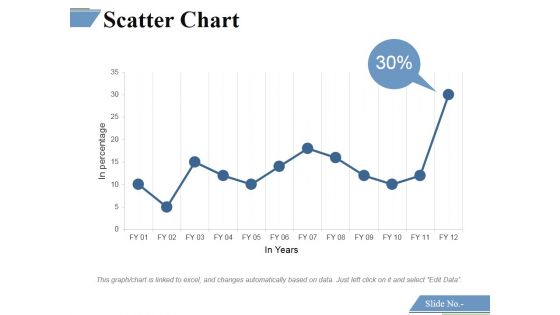
Scatter Chart Ppt PowerPoint Presentation Portfolio File Formats
This is a scatter chart ppt powerpoint presentation portfolio file formats. This is a one stage process. The stages in this process are scatter chart, finance, success, management, business.
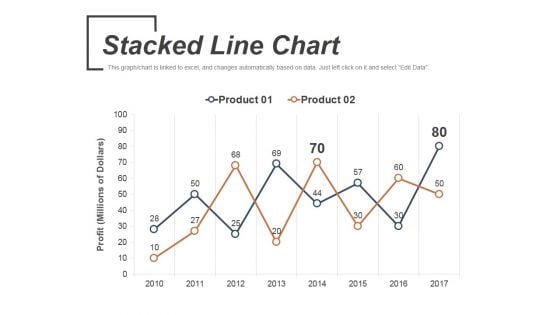
Stacked Line Chart Ppt PowerPoint Presentation Outline Examples
This is a stacked line chart ppt powerpoint presentation outline examples. This is a two stage process. The stages in this process are product, stacked line chart, business, marketing, profit.
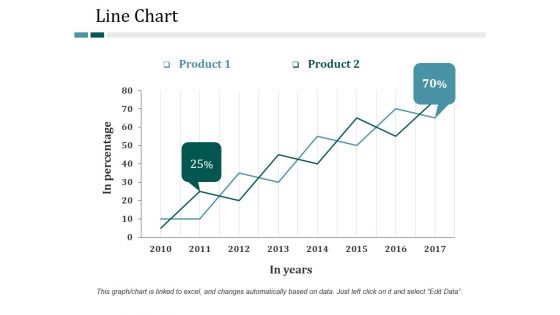
Line Chart Ppt PowerPoint Presentation Summary Graphic Tips
This is a line chart ppt powerpoint presentation summary graphic tips. This is a two stage process. The stages in this process are line chart, product, in percentage, analysis, business.
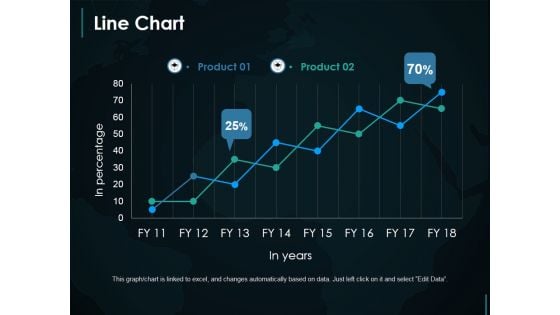
Line Chart Ppt PowerPoint Presentation Infographic Template Demonstration
This is a line chart ppt powerpoint presentation infographic template demonstration. This is a two stage process. The stages in this process are line chart, growth, finance, marketing, strategy.
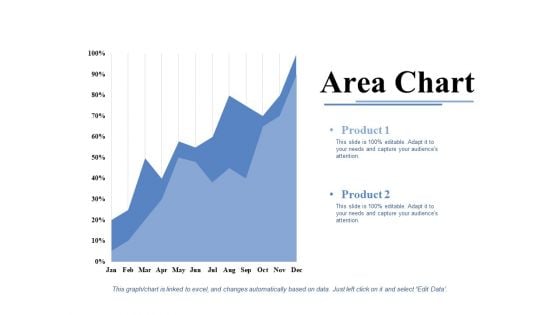
Area Chart Ppt PowerPoint Presentation Infographic Template Model
This is a area chart ppt powerpoint presentation infographic template model. This is a two stage process. The stages in this process are product, area chart, growth, percentage, success.
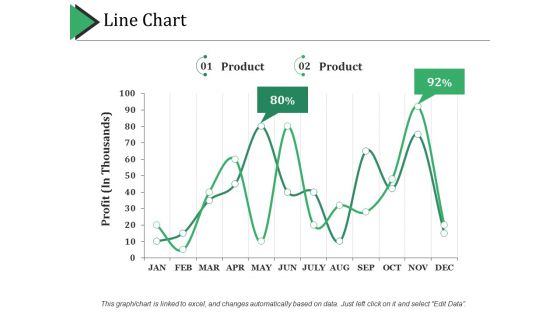
Line Chart Ppt PowerPoint Presentation Portfolio Graphics Pictures
This is a line chart ppt powerpoint presentation portfolio graphics pictures. This is a two stage process. The stages in this process are line chart, finance, growth, strategy, business.
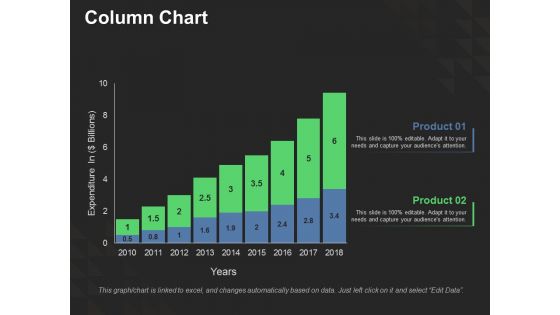
Column Chart Finance Ppt PowerPoint Presentation Slides Information
This is a column chart finance ppt powerpoint presentation slides information. This is a two stage process. The stages in this process are column chart finance, investment, business, planning, marketing.
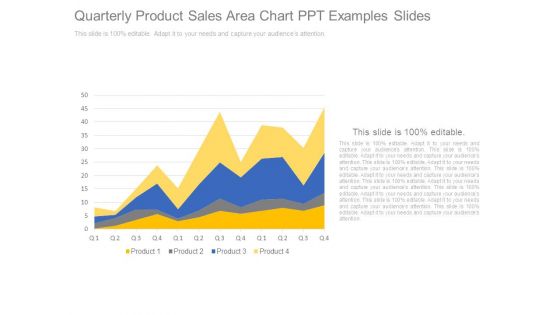
Quarterly Product Sales Area Chart Ppt Examples Slides
This is a quarterly product sales area chart ppt examples slides. This is a four stage process. The stages in this process are product, business, marketing, success, sales.
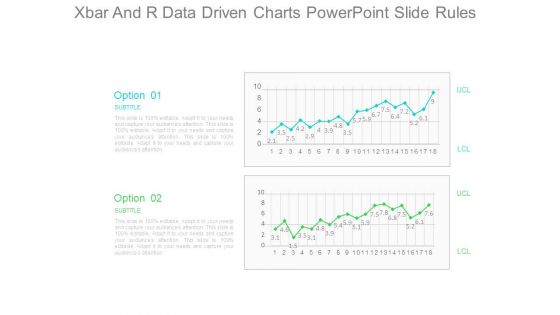
Xbar And R Data Driven Charts Powerpoint Slide Rules
This is a xbar and r data driven charts powerpoint slide rules. This is a two stage process. The stages in this process are option, subtitle, lcl, ucl.
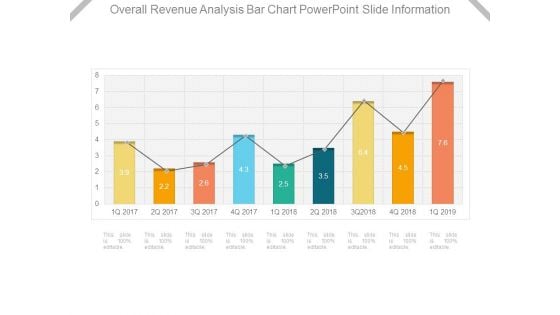
Overall Revenue Analysis Bar Chart Powerpoint Slide Information
This is a overall revenue analysis bar chart powerpoint slide information. This is a nine stage process. The stages in this process are finance, success, business, marketing, percentage.
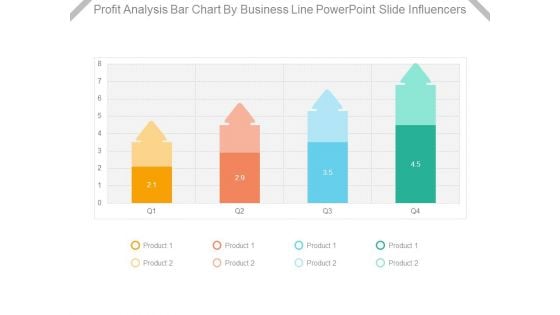
Profit Analysis Bar Chart By Business Line Powerpoint Slide Influencers
This is a profit analysis bar chart by business line powerpoint slide influencers. This is a four stage process. The stages in this process are product.
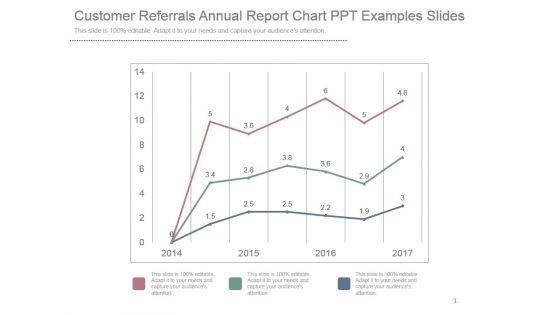
Customer Referrals Annual Report Chart Ppt Examples Slides
This is a customer referrals annual report chart ppt examples slides. This is a three stage process. The stages in this process are business, marketing, graph, success, years.
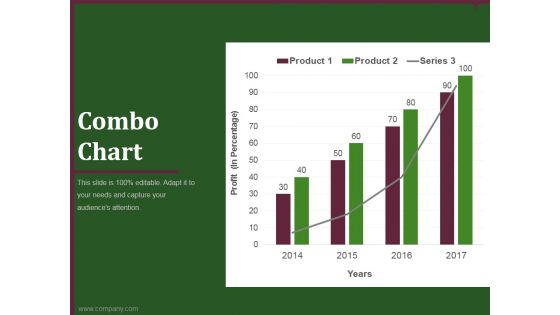
combo chart template 1 ppt powerpoint presentation show
This is a combo chart template 1 ppt powerpoint presentation show. This is a four stage process. The stages in this process are business, marketing, finance, analysis, growth.
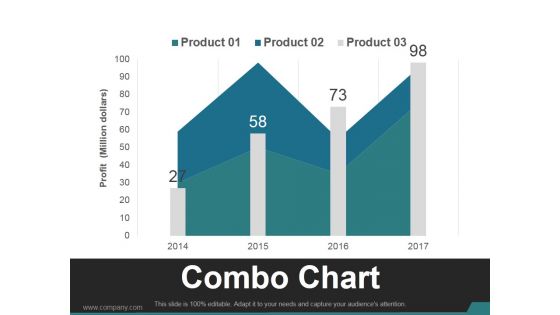
Combo Chart Template 2 Ppt PowerPoint Presentation Guidelines
This is a combo chart template 2 ppt powerpoint presentation guidelines. This is a four stage process. The stages in this process are business, marketing, growth, product, timeline.
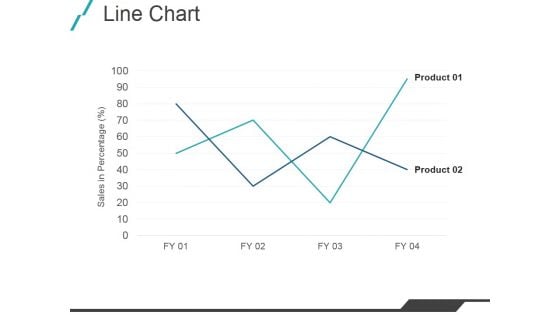
Line Chart Ppt PowerPoint Presentation Model Example File
This is a line chart ppt powerpoint presentation model example file. This is a two stage process. The stages in this process are product, graph, growth, management.

Line Chart Ppt PowerPoint Presentation Professional Slide Download
This is a line chart ppt powerpoint presentation professional slide download. This is a two stage process. The stages in this process are growth, business, management, marketing.
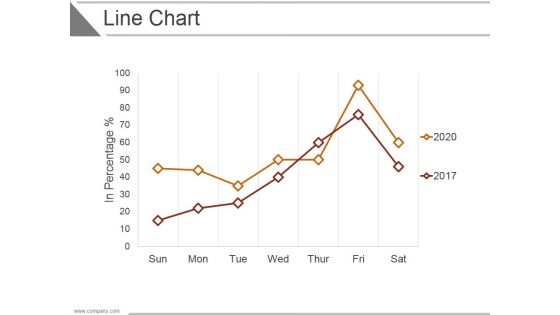
Line Chart Ppt PowerPoint Presentation Infographic Template Shapes
This is a line chart ppt powerpoint presentation infographic template shapes. This is a seven stage process. The stages in this process are business, strategy, analysis, marketing, growth.
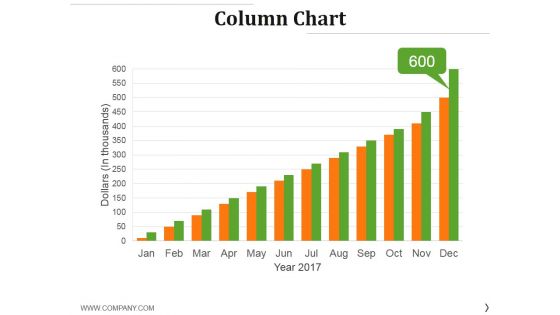
Column Chart Ppt PowerPoint Presentation Inspiration Example Topics
This is a column chart ppt powerpoint presentation inspiration example topics. This is a twelve stage process. The stages in this process are dollar, growth, business, marketing, success.
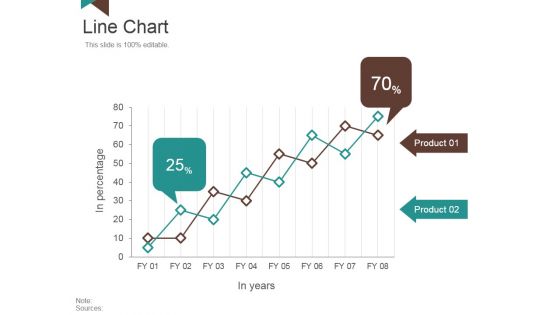
Line Chart Ppt PowerPoint Presentation Layouts Background Image
This is a line chart ppt powerpoint presentation layouts background image. This is a two stage process. The stages in this process are in percentage, in years, product.
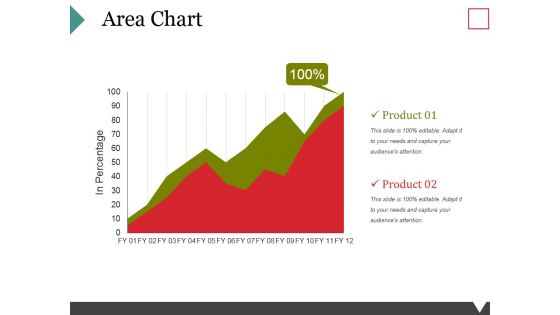
Area Chart Ppt PowerPoint Presentation Gallery Example Topics
This is a area chart ppt powerpoint presentation gallery example topics. This is a two stage process. The stages in this process are product, growth, finance, management, business.
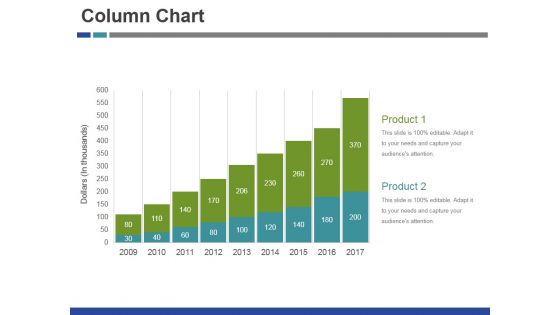
Column Chart Ppt PowerPoint Presentation Infographic Template Layouts
This is a column chart ppt powerpoint presentation infographic template layouts. This is a nine stage process. The stages in this process are product, growth, success, business, graph.
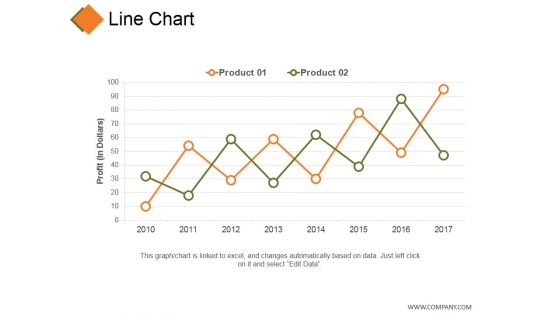
Line Chart Ppt PowerPoint Presentation Visual Aids Inspiration
This is a line chart ppt powerpoint presentation visual aids inspiration. This is a two stage process. The stages in this process are product, profit, growth, decline, success.

Line Chart Ppt PowerPoint Presentation Styles Graphics Example
This is a line chart ppt powerpoint presentation styles graphics example. This is a two stage process. The stages in this process are graph, business, success, marketing, line.
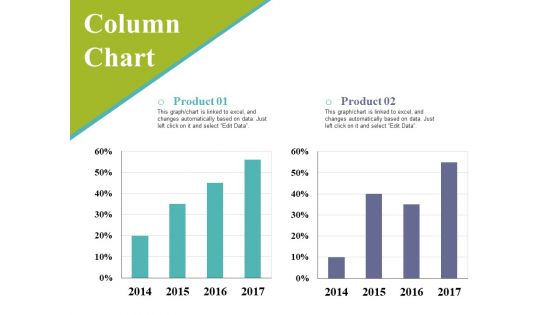
Column Chart Ppt PowerPoint Presentation Styles Background Image
This is a column chart ppt powerpoint presentation styles background image. This is a two stage process. The stages in this process are business, graph, percentage, marketing, strategy.
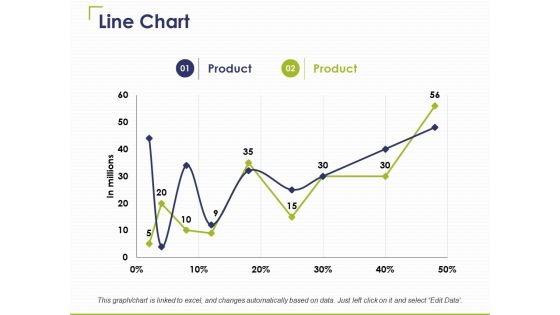
Line Chart Ppt PowerPoint Presentation Inspiration Slide Download
This is a line chart ppt powerpoint presentation inspiration slide download. This is a two stage process. The stages in this process are product, in millions, business, marketing.
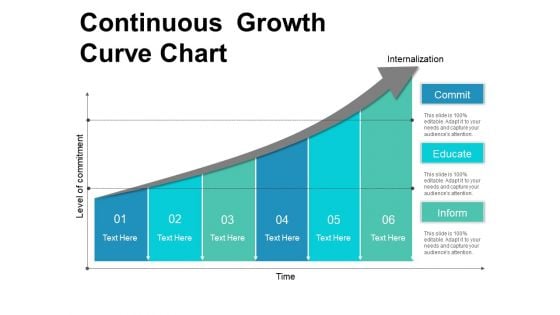
Continuous Growth Curve Chart Ppt PowerPoint Presentation Inspiration Slideshow
This is a continuous growth curve chart ppt powerpoint presentation inspiration slideshow. This is a six stage process. The stages in this process are circular, continuity, continuum.
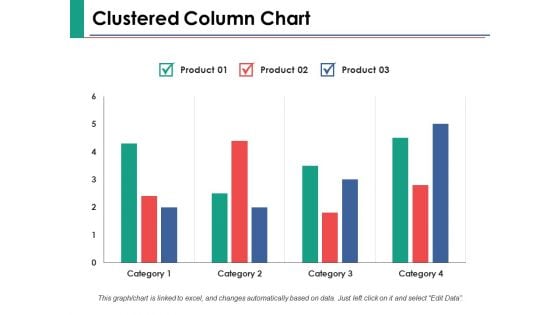
Clustered Column Chart Ppt PowerPoint Presentation Show Samples
This is a clustered column chart ppt powerpoint presentation show samples. This is a three stage process. The stages in this process are finance, marketing, management, investment, analysis.
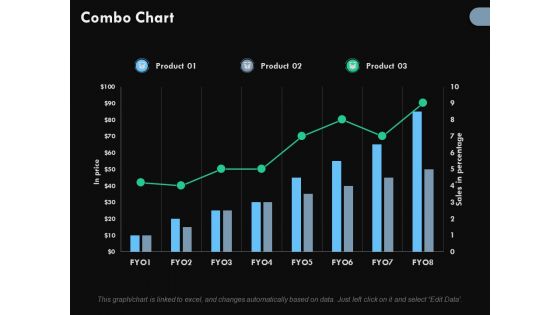
Combo Chart Ppt PowerPoint Presentation Infographic Template Maker
This is a combo chart ppt powerpoint presentation infographic template maker. This is a three stage process. The stages in this process are business, finance, growth, investment, marketing.
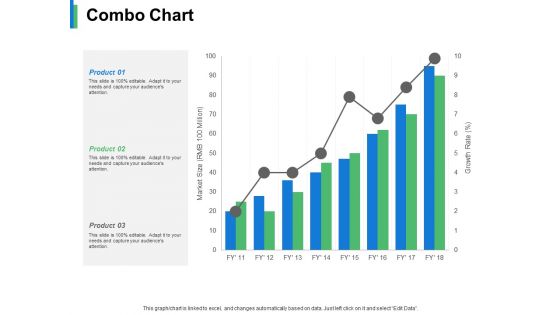
Combo Chart Product Ppt PowerPoint Presentation Slides Aids
This is a combo chart product ppt powerpoint presentation slides aids. This is a three stage process. The stages in this process are business, management, marketing, strategy, sales.

Stacked Column Chart Ppt PowerPoint Presentation Professional Show
This is a stacked column chart ppt powerpoint presentation professional show. This is a three stage process. The stages in this process are business, management, marketing, growth.
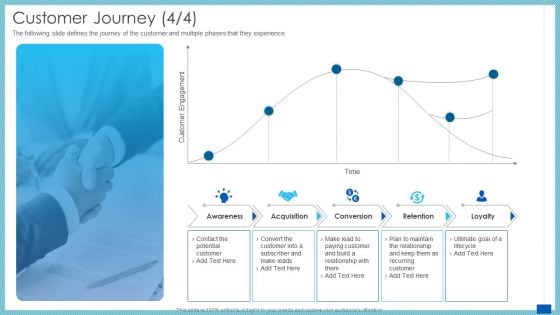
Evaluation Evolving Advanced Enterprise Development Marketing Tactics Customer Journey Retention Diagrams PDF
The following slide defines the journey of the customer and multiple phases that they experience. This is a evaluation evolving advanced enterprise development marketing tactics customer journey retention diagrams pdf template with various stages. Focus and dispense information on five stages using this creative set, that comes with editable features. It contains large content boxes to add your information on topics like customer engagement, awareness, conversion. You can also showcase facts, figures, and other relevant content using this PPT layout. Grab it now.

And R Chart For Six Sigma Powerpoint Slide Background Designs
This is a and r chart for six sigma powerpoint slide background designs. This is a two stage process. The stages in this process are subtitle, option, lcl, ucl.
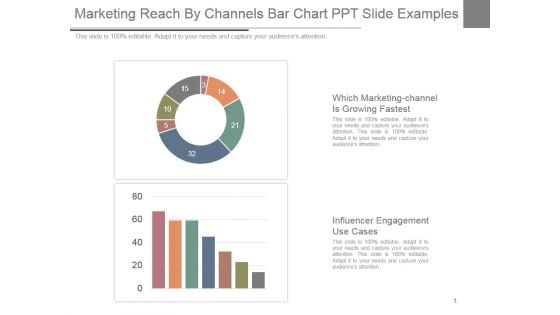
Marketing Reach By Channels Bar Chart Ppt Slide Examples
This is a marketing reach by channels bar chart ppt slide examples. This is a two stage process. The stages in this process are which marketing-channel is growing fastest, influencer engagement use cases.

Xbar And R Chart Ppt PowerPoint Presentation Example 2015
This is a xbar and r chart ppt powerpoint presentation example 2015. This is a two stage process. The stages in this process are business, strategy, marketing, success, growth strategy.
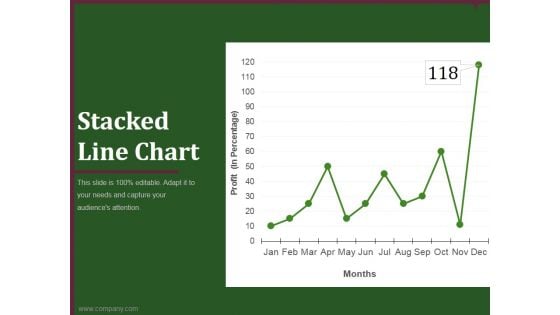
Stacked Line Chart Ppt PowerPoint Presentation Background Image
This is a stacked line chart ppt powerpoint presentation background image. This is a twelve stage process. The stages in this process are business, marketing, analysis, finance, growth strategy.
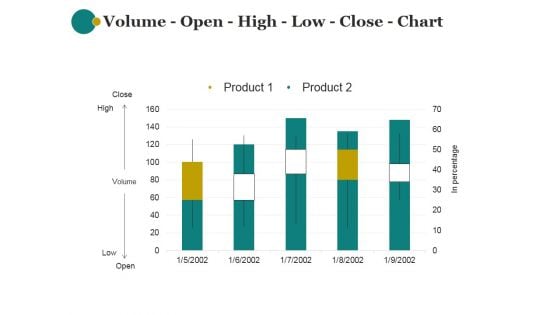
Volume Open High Low Close Chart Ppt PowerPoint Presentation Show
This is a volume open high low close chart ppt powerpoint presentation show. This is a five stage process. The stages in this process are product, marketing, business, management, strategy.
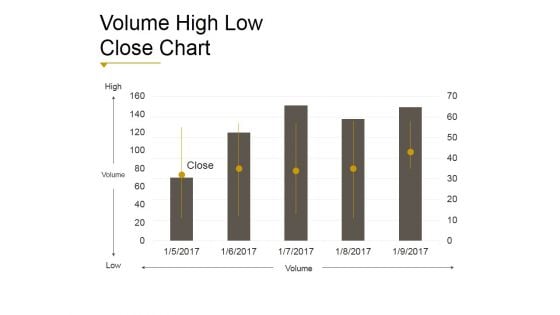
Volume High Low Close Chart Ppt PowerPoint Presentation Shapes
This is a volume high low close chart ppt powerpoint presentation shapes. This is a five stage process. The stages in this process are business, strategy, analysis, marketing, finance, growth.

 Home
Home