Construction Icons
Employee Talent Management Procedure Tracking Dashboard With Kpis Download PDF
This slide represents dashboard of the human resource department for tracking the performance and management of organizations workforce. It includes details related to monthly new hires, total active employees, suite people metrics along with key performance indicators. Showcasing this set of slides titled Employee Talent Management Procedure Tracking Dashboard With Kpis Download PDF. The topics addressed in these templates are Total Active Employees, Employees, Suite People Metrics. All the content presented in this PPT design is completely editable. Download it and make adjustments in color, background, font etc. as per your unique business setting.
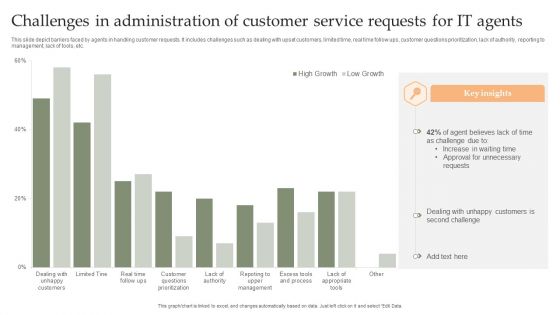
Challenges In Administration Of Customer Service Requests For IT Agents Mockup PDF
This slide depict barriers faced by agents in handling customer requests. It includes challenges such as dealing with upset customers, limited time, real time follow ups, customer questions prioritization, lack of authority, reporting to management, lack of tools, etc. Pitch your topic with ease and precision using this Challenges In Administration Of Customer Service Requests For IT Agents Mockup PDF. This layout presents information on Increase Waiting Time, Approval For Unnecessary, Dealing Unhappy Customers. It is also available for immediate download and adjustment. So, changes can be made in the color, design, graphics or any other component to create a unique layout.
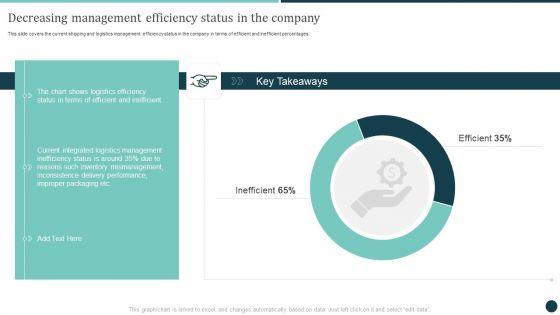
Decreasing Management Efficiency Status In The Company Logistics Strategy To Improve Slides PDF
This slide covers the current shipping and logistics management efficiency status in the company in terms of efficient and inefficient percentages.This Decreasing Management Efficiency Status In The Company Logistics Strategy To Improve Slides PDF from Slidegeeks makes it easy to present information on your topic with precision. It provides customization options, so you can make changes to the colors, design, graphics, or any other component to create a unique layout. It is also available for immediate download, so you can begin using it right away. Slidegeeks has done good research to ensure that you have everything you need to make your presentation stand out. Make a name out there for a brilliant performance.
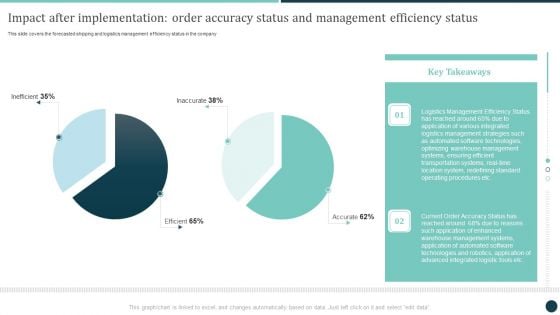
Impact After Implementation Order Accuracy Status And Management Efficiency Status Demonstration PDF
Slidegeeks is here to make your presentations a breeze with Impact After Implementation Order Accuracy Status And Management Efficiency Status Demonstration PDF With our easytouse and customizable templates, you can focus on delivering your ideas rather than worrying about formatting. With a variety of designs to choose from, youre sure to find one that suits your needs. And with animations and unique photos, illustrations, and fonts, you can make your presentation pop. So whether youre giving a sales pitch or presenting to the board, make sure to check out Slidegeeks first.
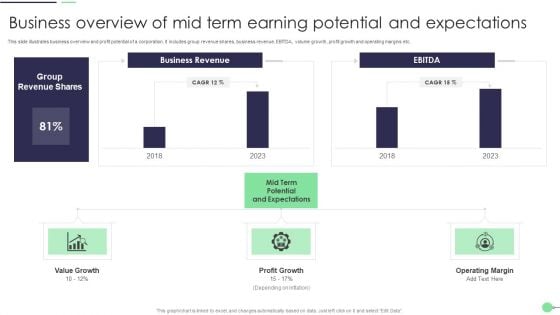
Business Overview Of Mid Term Earning Potential And Expectations Slides PDF
This slide illustrates business overview and profit potential of a corporation. It includes group revenue shares, business revenue, EBITDA, volume growth, profit growth and operating margins etc. Showcasing this set of slides titled Business Overview Of Mid Term Earning Potential And Expectations Slides PDF. The topics addressed in these templates are Value Growth, Profit Growth, Operating Margin. All the content presented in this PPT design is completely editable. Download it and make adjustments in color, background, font etc. as per your unique business setting.
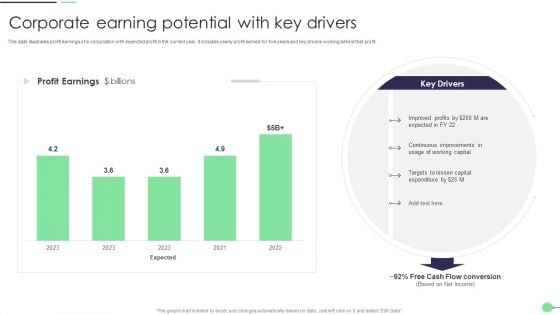
Corporate Earning Potential With Key Drivers Summary PDF
This slide illustrates profit earnings of a corporation with expected profit in the current year. It includes yearly profit earned for five years and key drivers working behind that profit. Pitch your topic with ease and precision using this Corporate Earning Potential With Key Drivers Summary PDF. This layout presents information on Working Capital, Improved Profits, Capital. It is also available for immediate download and adjustment. So, changes can be made in the color, design, graphics or any other component to create a unique layout.
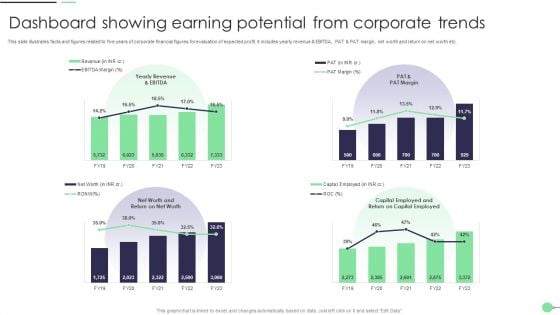
Dashboard Showing Earning Potential From Corporate Trends Demonstration PDF
This slide illustrates facts and figures related to five years of corporate financial figures for evaluation of expected profit. It includes yearly revenue and EBITDA, PAT and PAT margin, net worth and return on net worth etc. Showcasing this set of slides titled Dashboard Showing Earning Potential From Corporate Trends Demonstration PDF. The topics addressed in these templates are Potential From Corporate Trends, Dashboard Showing Earning. All the content presented in this PPT design is completely editable. Download it and make adjustments in color, background, font etc. as per your unique business setting.
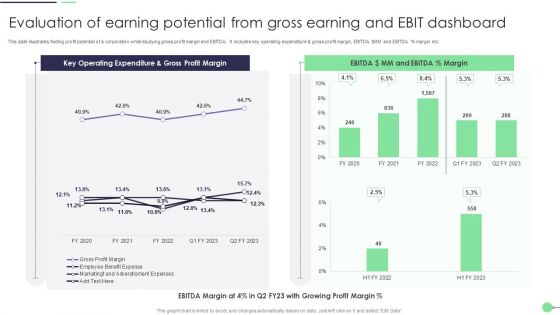
Evaluation Of Earning Potential From Gross Earning And Ebit Dashboard Professional PDF
This slide illustrates finding profit potential of a corporation while studying gross profit margin and EBITDA. It includes key operating expenditure and gross profit margin, EBITDA dollar MM and EBITDA percent margin etc. Showcasing this set of slides titled Evaluation Of Earning Potential From Gross Earning And Ebit Dashboard Professional PDF. The topics addressed in these templates are Evaluation Of Earning Potential, Gross Earning, Ebit Dashboard. All the content presented in this PPT design is completely editable. Download it and make adjustments in color, background, font etc. as per your unique business setting.
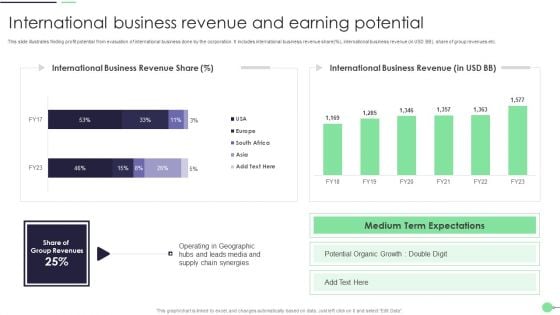
International Business Revenue And Earning Potential Guidelines PDF
This slide illustrates finding profit potential from evaluation of international business done by the corporation. It includes international business revenue share percent, international business revenue in USD BB, share of group revenues etc. Pitch your topic with ease and precision using this International Business Revenue And Earning Potential Guidelines PDF. This layout presents information on Potential Organic Growth, Supply Chain. It is also available for immediate download and adjustment. So, changes can be made in the color, design, graphics or any other component to create a unique layout.
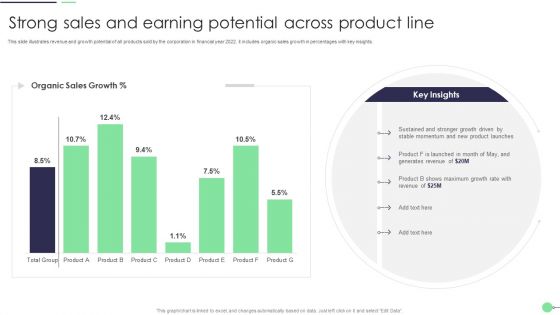
Strong Sales And Earning Potential Across Product Line Professional PDF
This slide illustrates revenue and growth potential of all products sold by the corporation in financial year 2022. it includes organic sales growth in percentages with key insights. Showcasing this set of slides titled Strong Sales And Earning Potential Across Product Line Professional PDF. The topics addressed in these templates are Product Launches, Generates Revenue, Growth Rate. All the content presented in this PPT design is completely editable. Download it and make adjustments in color, background, font etc. as per your unique business setting.
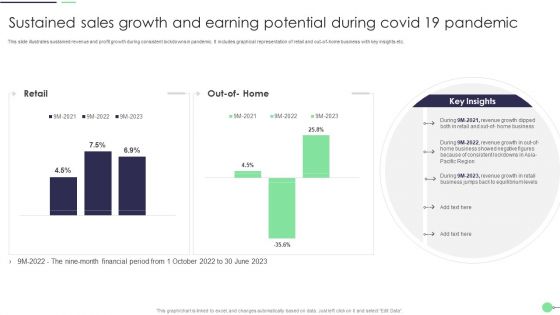
Sustained Sales Growth And Earning Potential During Covid 19 Pandemic Demonstration PDF
This slide illustrates sustained revenue and profit growth during consistent lockdowns in pandemic. It includes graphical representation of retail and out of home business with key insights etc. Pitch your topic with ease and precision using this Sustained Sales Growth And Earning Potential During Covid 19 Pandemic Demonstration PDF. This layout presents information on Revenue Growth, Business, Retail. It is also available for immediate download and adjustment. So, changes can be made in the color, design, graphics or any other component to create a unique layout.
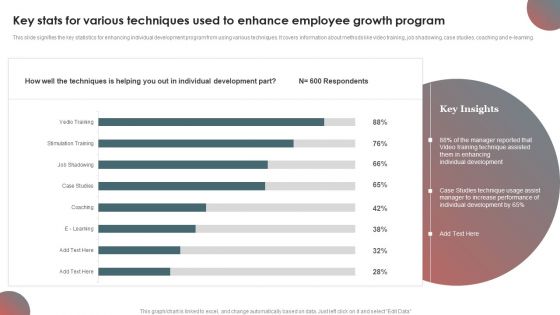
Key Stats For Various Techniques Used To Enhance Employee Growth Program Information PDF
This slide signifies the key statistics for enhancing individual development program from using various techniques. It covers information about methods like video training, job shadowing, case studies, coaching and e-learning.Pitch your topic with ease and precision using this Key Stats For Various Techniques Used To Enhance Employee Growth Program Information PDF. This layout presents information on Manager Reported, Technique Assisted, Them Enhancing. It is also available for immediate download and adjustment. So, changes can be made in the color, design, graphics or any other component to create a unique layout.
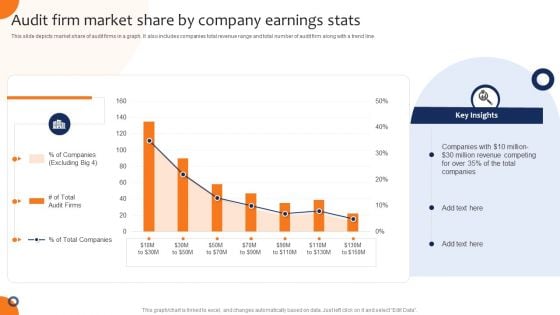
Audit Firm Market Share By Company Earnings Stats Formats PDF
This slide depicts market share of audit firms in a graph. It also includes companies total revenue range and total number of audit firm along with a trend line. Showcasing this set of slides titled Audit Firm Market Share By Company Earnings Stats Formats PDF. The topics addressed in these templates are Company Earnings Stats, Audit Firm Market Share. All the content presented in this PPT design is completely editable. Download it and make adjustments in color, background, font etc. as per your unique business setting.
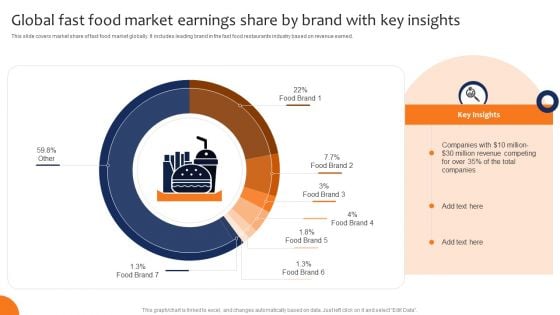
Global Fast Food Market Earnings Share By Brand With Key Insights Structure PDF
This slide covers market share of fast food market globally. It includes leading brand in the fast food restaurants industry based on revenue earned. Showcasing this set of slides titled Global Fast Food Market Earnings Share By Brand With Key Insights Structure PDF. The topics addressed in these templates are Global, Market Earnings Share, Brand With Key Insights. All the content presented in this PPT design is completely editable. Download it and make adjustments in color, background, font etc. as per your unique business setting.
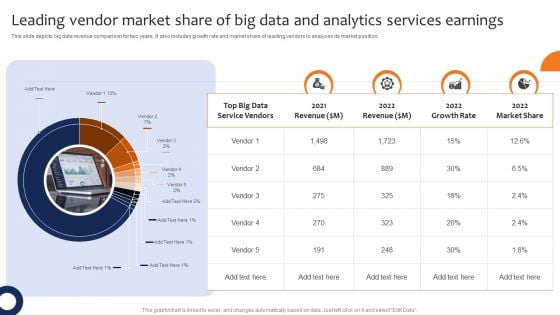
Leading Vendor Market Share Of Big Data And Analytics Services Earnings Professional PDF
This slide depicts big data revenue comparison for two years. It also includes growth rate and market share of leading vendors to analyses its market position. Pitch your topic with ease and precision using this Leading Vendor Market Share Of Big Data And Analytics Services Earnings Professional PDF. This layout presents information on Revenue, Growth Rate, Market Share. It is also available for immediate download and adjustment. So, changes can be made in the color, design, graphics or any other component to create a unique layout.
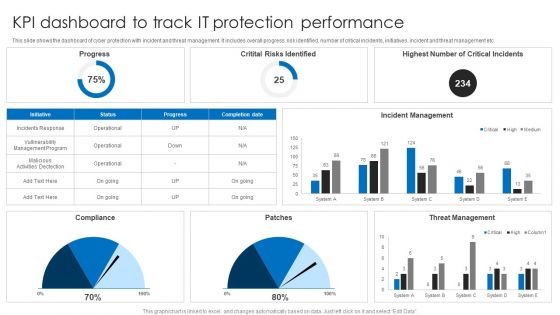
KPI Dashboard To Track IT Protection Performance Elements PDF
This slide shows the dashboard of cyber protection with incident and threat management. It includes overall progress, risk identified, number of critical incidents, initiatives, incident and threat management etc. Pitch your topic with ease and precision using this KPI Dashboard To Track IT Protection Performance Elements PDF. This layout presents information on Incident Management, Threat Management, Critital Risks Identified. It is also available for immediate download and adjustment. So, changes can be made in the color, design, graphics or any other component to create a unique layout.
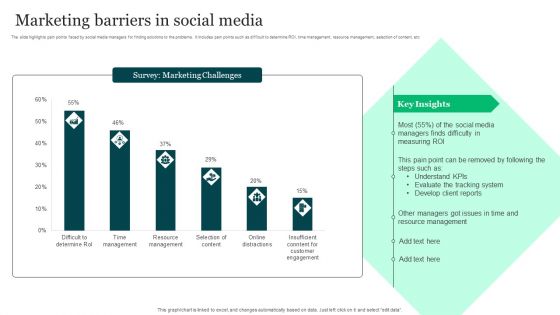
Marketing Barriers In Social Media Ppt Background PDF
This slide highlights pain points faced by social media managers for finding solutions to the problems. It includes pain points such as difficult to determine ROI, time management, resource management, selection of content, etc. Pitch your topic with ease and precision using this Marketing Barriers In Social Media Ppt Background PDF. This layout presents information on Marketing Challenges, Social Media Managers, Measuring ROI. It is also available for immediate download and adjustment. So, changes can be made in the color, design, graphics or any other component to create a unique layout.
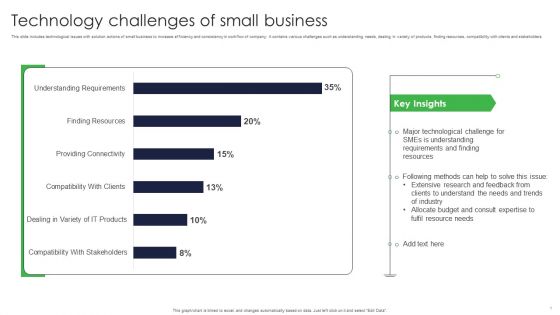
Technology Challenges Of Small Business Ppt Portfolio Introduction PDF
This slide includes technological issues with solution actions of small business to increase efficiency and consistency in workflow of company. It contains various challenges such as understanding needs, dealing in variety of products, finding resources, compatibility with clients and stakeholders. Showcasing this set of slides titled Technology Challenges Of Small Business Ppt Portfolio Introduction PDF. The topics addressed in these templates are Technological Challenge, Following Methods, Extensive Research. All the content presented in this PPT design is completely editable. Download it and make adjustments in color, background, font etc. as per your unique business setting.
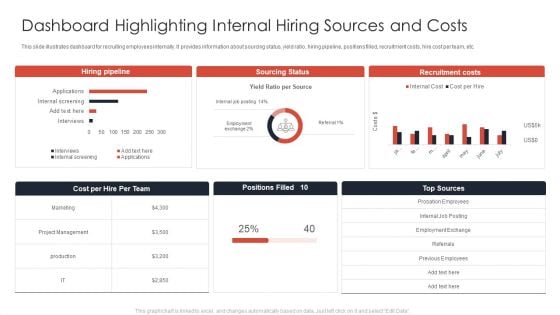
Dashboard Highlighting Internal Hiring Sources And Costs Ppt Show Templates PDF
This slide illustrates dashboard for recruiting employees internally. It provides information about sourcing status, yield ratio, hiring pipeline, positions filled, recruitment costs, hire cost per team, etc. Showcasing this set of slides titled Dashboard Highlighting Internal Hiring Sources And Costs Ppt Show Templates PDF. The topics addressed in these templates are Hiring Pipeline, Sourcing Status, Recruitment Costs. All the content presented in this PPT design is completely editable. Download it and make adjustments in color, background, font etc. as per your unique business setting.
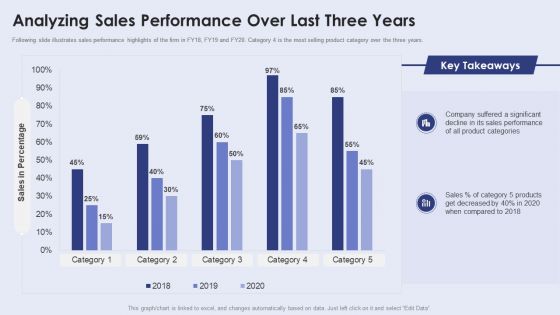
Creating New Product Launch Campaign Strategy Analyzing Sales Performance Over Last Three Years Structure PDF
Following slide illustrates sales performance highlights of the firm in FY18, FY19 and FY20. Category 4 is the most selling product category over the three years. If your project calls for a presentation, then Slidegeeks is your go to partner because we have professionally designed, easy to edit templates that are perfect for any presentation. After downloading, you can easily edit Creating New Product Launch Campaign Strategy Analyzing Sales Performance Over Last Three Years Structure PDF and make the changes accordingly. You can rearrange slides or fill them with different images. Check out all the handy templates.
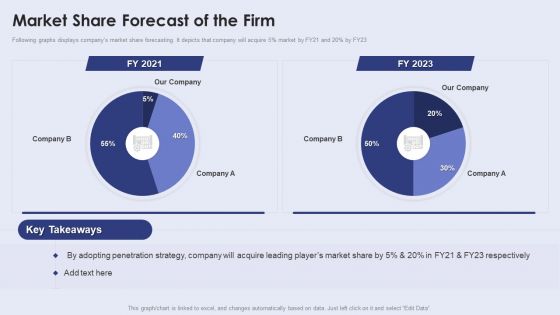
Creating New Product Launch Campaign Strategy Market Share Forecast Of The Firm Infographics PDF
Following graphs displays companys market share forecasting. It depicts that company will acquire 5 percent market by FY21 and 20 percent by FY23. This Creating New Product Launch Campaign Strategy Market Share Forecast Of The Firm Infographics PDF is perfect for any presentation, be it in front of clients or colleagues. It is a versatile and stylish solution for organizing your meetings. The product features a modern design for your presentation meetings. The adjustable and customizable slides provide unlimited possibilities for acing up your presentation. Slidegeeks has done all the homework before launching the product for you. So, dont wait, grab the presentation templates today.

Increase Sales By Lead Generation Problems Faced By The Company Pictures PDF
This slide shows the problems which are faced by the company while managing leads such as finding strategies, generate the leads, etc. This Increase Sales By Lead Generation Problems Faced By The Company Pictures PDF is perfect for any presentation, be it in front of clients or colleagues. It is a versatile and stylish solution for organizing your meetings. The product features a modern design for your presentation meetings. The adjustable and customizable slides provide unlimited possibilities for acing up your presentation. Slidegeeks has done all the homework before launching the product for you. So, dont wait, grab the presentation templates today.
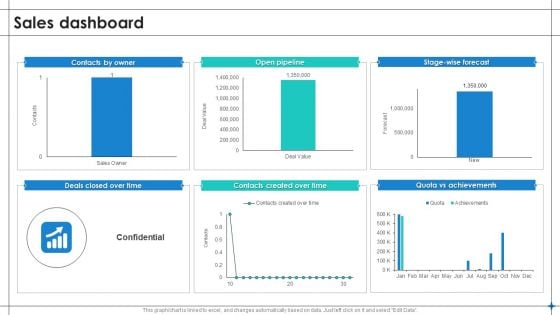
Increase Sales By Lead Generation Sales Dashboard Formats PDF
Explore a selection of the finest Increase Sales By Lead Generation Sales Dashboard Formats PDF here. With a plethora of professionally designed and pre made slide templates, you can quickly and easily find the right one for your upcoming presentation. You can use our Increase Sales By Lead Generation Sales Dashboard Formats PDF to effectively convey your message to a wider audience. Slidegeeks has done a lot of research before preparing these presentation templates. The content can be personalized and the slides are highly editable. Grab templates today from Slidegeeks.

Increase Sales By Lead Generation Total Lead Capture Automation In Percentage Pictures PDF
This slide shows the total lead capture automation in percentage through various channels include Ads. Phone, chat, social, etc. The Increase Sales By Lead Generation Total Lead Capture Automation In Percentage Pictures PDF is a compilation of the most recent design trends as a series of slides. It is suitable for any subject or industry presentation, containing attractive visuals and photo spots for businesses to clearly express their messages. This template contains a variety of slides for the user to input data, such as structures to contrast two elements, bullet points, and slides for written information. Slidegeeks is prepared to create an impression.
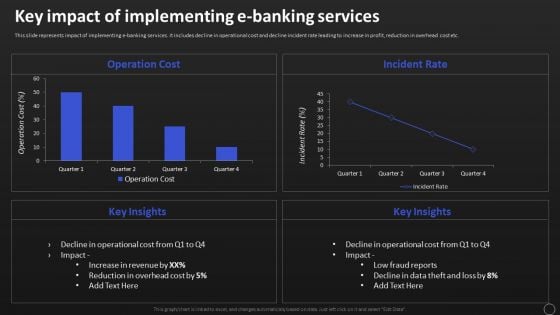
Net Banking Channel And Service Management Key Impact Of Implementing E Banking Services Clipart PDF
This slide represents impact of implementing e banking services. It includes decline in operational cost and decline incident rate leading to increase in profit, reduction in overhead cost etc. Find a pre designed and impeccable Net Banking Channel And Service Management Key Impact Of Implementing E Banking Services Clipart PDF. The templates can ace your presentation without additional effort. You can download these easy to edit presentation templates to make your presentation stand out from others. So, what are you waiting for Download the template from Slidegeeks today and give a unique touch to your presentation.
Stress Management Dashboard With Wellness Tracking And Heart Rate Variability Ideas PDF
This slide highlights the stress management dashboard which showcases the perceived stress scale, heart rate, blood pressure, sleep quality and employee wellness. This Stress Management Dashboard With Wellness Tracking And Heart Rate Variability Ideas PDF is perfect for any presentation, be it in front of clients or colleagues. It is a versatile and stylish solution for organizing your meetings. The product features a modern design for your presentation meetings. The adjustable and customizable slides provide unlimited possibilities for acing up your presentation. Slidegeeks has done all the homework before launching the product for you. So, dont wait, grab the presentation templates today.
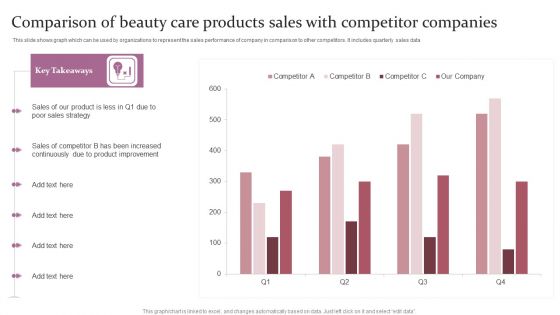
Comparison Of Beauty Care Products Sales With Competitor Companies Ppt Slides Samples PDF
This slide shows graph which can be used by organizations to represent the sales performance of company in comparison to other competitors. It includes quarterly sales data Showcasing this set of slides titled Comparison Of Beauty Care Products Sales With Competitor Companies Ppt Slides Samples PDF. The topics addressed in these templates are Our Product, Poor Sales Strategy, Product Improvement. All the content presented in this PPT design is completely editable. Download it and make adjustments in color, background, font etc. as per your unique business setting.
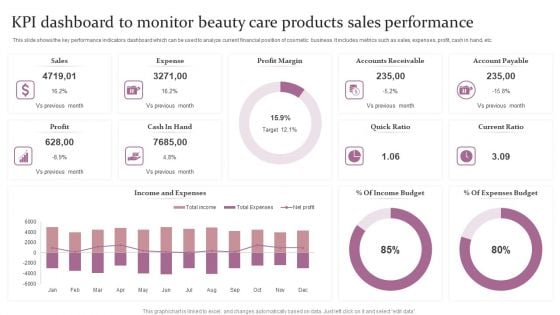
KPI Dashboard To Monitor Beauty Care Products Sales Performance Ppt Outline Example Topics PDF
This slide shows the key performance indicators dashboard which can be used to analyze current financial position of cosmetic business. It includes metrics such as sales, expenses, profit, cash in hand, etc. Showcasing this set of slides titled KPI Dashboard To Monitor Beauty Care Products Sales Performance Ppt Outline Example Topics PDF. The topics addressed in these templates are Accounts Receivable, Profit Margin, Expense. All the content presented in this PPT design is completely editable. Download it and make adjustments in color, background, font etc. as per your unique business setting.
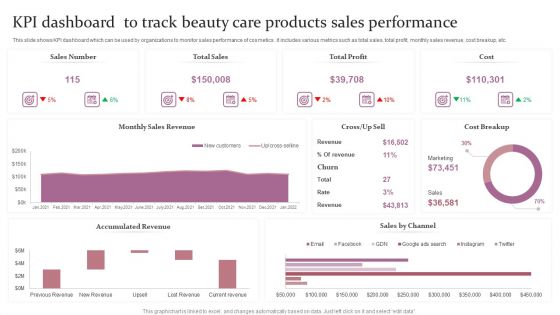
KPI Dashboard To Track Beauty Care Products Sales Performance Ppt Outline Pictures PDF
This slide shows the key performance indicators dashboard which can be used to analyze current financial position of cosmetic business. It includes metrics such as sales, expenses, profit, cash in hand, etc. Showcasing this set of slides titled KPI Dashboard To Track Beauty Care Products Sales Performance Ppt Outline Pictures PDF. The topics addressed in these templates are Sales Number, Total Sales, Total Profit, Cost. All the content presented in this PPT design is completely editable. Download it and make adjustments in color, background, font etc. as per your unique business setting.
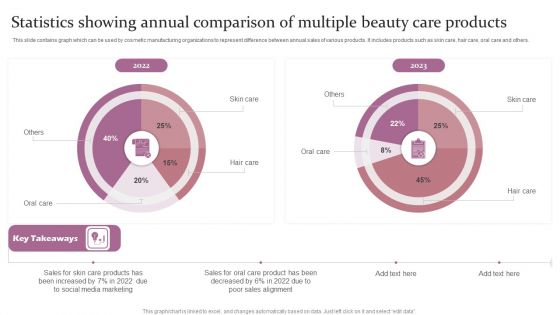
Statistics Showing Annual Comparison Of Multiple Beauty Care Products Ppt Infographics Objects PDF
This slide contains graph which can be used by cosmetic manufacturing organizations to represent difference between annual sales of various products. It includes products such as skin care, hair care, oral care and others. Showcasing this set of slides titled Statistics Showing Annual Comparison Of Multiple Beauty Care Products Ppt Infographics Objects PDF. The topics addressed in these templates are Skin Care, Hair Care, 2022 To 2023. All the content presented in this PPT design is completely editable. Download it and make adjustments in color, background, font etc. as per your unique business setting.
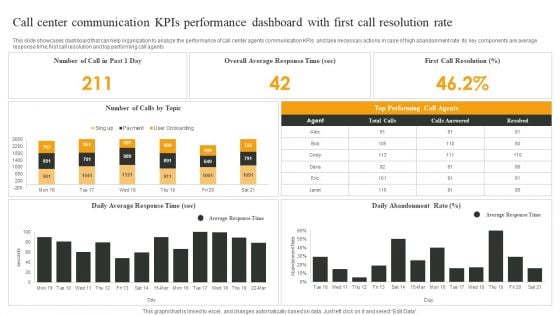
Call Center Communication Kpis Performance Dashboard With First Call Resolution Rate Graphics PDF
This slide showcases dashboard that can help organization to analyze the performance of call center agents communication KPIs and take necessary actions in case of high abandonment rate. Its key components are average response time, first call resolution and top performing call agents. Showcasing this set of slides titled Call Center Communication Kpis Performance Dashboard With First Call Resolution Rate Graphics PDF. The topics addressed in these templates are Overall Average, Response Time, First Call Resolution, Daily Abandonment Rate. All the content presented in this PPT design is completely editable. Download it and make adjustments in color, background, font etc. as per your unique business setting.
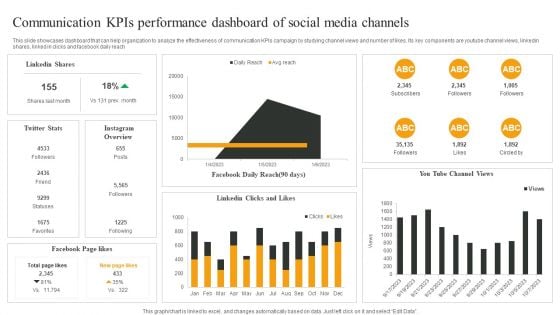
Communication Kpis Performance Dashboard Of Social Media Channels Mockup PDF
This slide showcases dashboard that can help organization to analyze the effectiveness of communication KPIs campaign by studying channel views and number of likes. Its key components are youtube channel views, linkedin shares, linked in clicks and facebook daily reach. Pitch your topic with ease and precision using this Communication Kpis Performance Dashboard Of Social Media Channels Mockup PDF. This layout presents information on Linkedin Shares, Facebook Page likes, Facebook Daily Reach. It is also available for immediate download and adjustment. So, changes can be made in the color, design, graphics or any other component to create a unique layout.
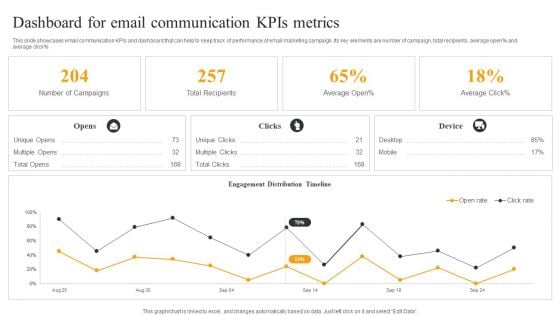
Dashboard For Email Communication Kpis Metrics Topics PDF
This slide showcases email communication KPIs and dashboard that can help to keep track of performance of email marketing campaign. Its key elements are number of campaign, total recipients, average open percent and average click percent. Showcasing this set of slides titled Dashboard For Email Communication Kpis Metrics Topics PDF. The topics addressed in these templates are Number Campaigns, Total Recipients, Engagement Distribution. All the content presented in this PPT design is completely editable. Download it and make adjustments in color, background, font etc. as per your unique business setting.
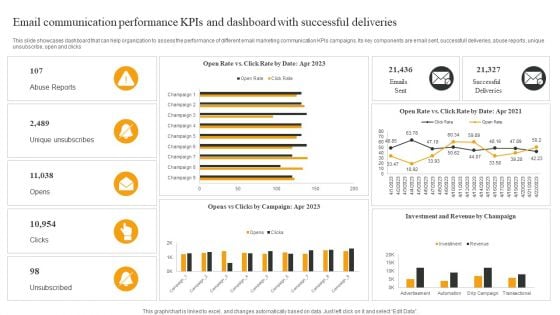
Email Communication Performance Kpis And Dashboard With Successful Deliveries Elements PDF
This slide showcases dashboard that can help organization to assess the performance of different email marketing communication KPIs campaigns. Its key components are email sent, successfull deliveries, abuse reports, unique unsubscribe, open and clicks. Showcasing this set of slides titled Email Communication Performance Kpis And Dashboard With Successful Deliveries Elements PDF. The topics addressed in these templates are Abuse Reports, Unique Unsubscribes, Opens. All the content presented in this PPT design is completely editable. Download it and make adjustments in color, background, font etc. as per your unique business setting.
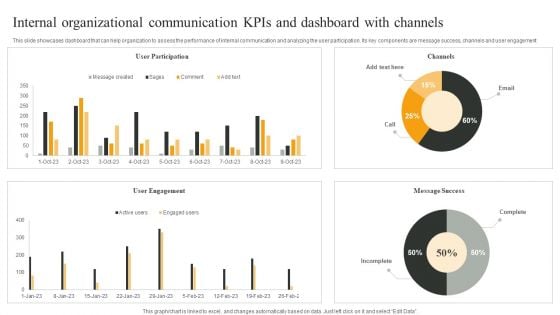
Internal Organizational Communication Kpis And Dashboard With Channels Infographics PDF
This slide showcases dashboard that can help organization to assess the performance of internal communication and analyzing the user participation. Its key components are message success, channels and user engagement. Pitch your topic with ease and precision using this Internal Organizational Communication Kpis And Dashboard With Channels Infographics PDF. This layout presents information on User Participation, User Engagement, Message Success. It is also available for immediate download and adjustment. So, changes can be made in the color, design, graphics or any other component to create a unique layout.
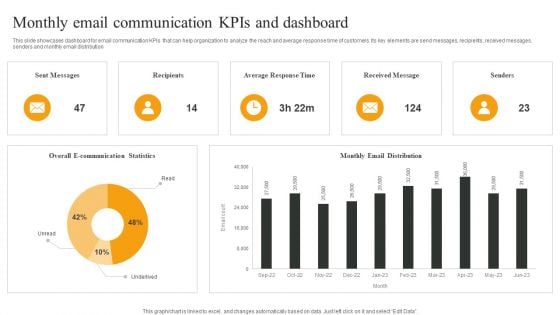
Monthly Email Communication Kpis And Dashboard Download PDF
This slide showcases dashboard for email communication KPIs that can help organization to analyze the reach and average response time of customers. Its key elements are send messages, recipients, received messages, senders and monthly email distribution. Pitch your topic with ease and precision using this Monthly Email Communication Kpis And Dashboard Download PDF. This layout presents information on Sent Messages, Recipients, Average Response Time, Received Message. It is also available for immediate download and adjustment. So, changes can be made in the color, design, graphics or any other component to create a unique layout.
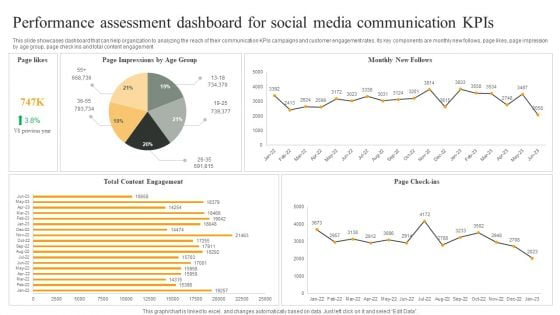
Performance Assessment Dashboard For Social Media Communication Kpis Graphics PDF
This slide showcases dashboard that can help organization to analyzing the reach of their communication KPIs campaigns and customer engagement rates. Its key components are monthly new follows, page likes, page impression by age group, page check ins and total content engagement. Pitch your topic with ease and precision using this Performance Assessment Dashboard For Social Media Communication Kpis Graphics PDF. This layout presents information on Monthly New Follows, Page Check ins, Total Content Engagement. It is also available for immediate download and adjustment. So, changes can be made in the color, design, graphics or any other component to create a unique layout.
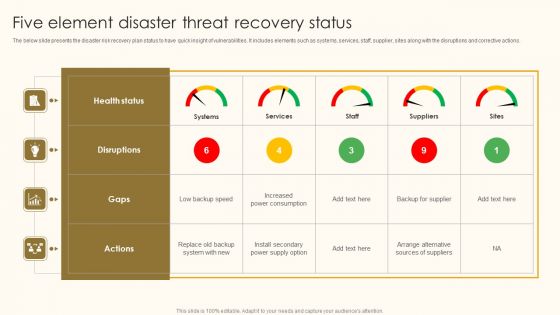
Five Element Disaster Threat Recovery Status Ppt Outline Inspiration PDF
The below slide presents the disaster risk recovery plan status to have quick insight of vulnerabilities. It includes elements such as systems, services, staff, supplier, sites along with the disruptions and corrective actions. Pitch your topic with ease and precision using this Five Element Disaster Threat Recovery Status Ppt Outline Inspiration PDF. This layout presents information on Health Status, Disruptions, Gaps. It is also available for immediate download and adjustment. So, changes can be made in the color, design, graphics or any other component to create a unique layout.
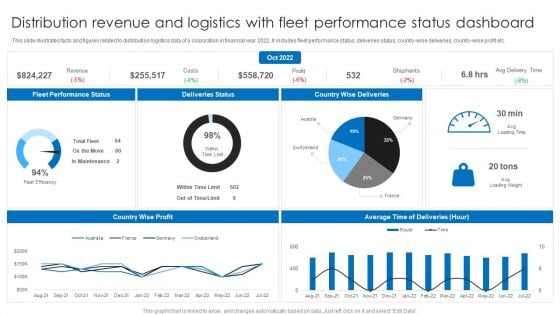
Distribution Revenue And Logistics With Fleet Performance Status Dashboard Ppt Layouts Background PDF
This slide illustrates facts and figures related to distribution logistics data of a corporation in financial year 2022. It includes fleet performance status, deliveries status, country-wise deliveries, country-wise profit etc. Pitch your topic with ease and precision using this Distribution Revenue And Logistics With Fleet Performance Status Dashboard Ppt Layouts Background PDF. This layout presents information on Deliveries Status, Country Wise Deliveries, Fleet Performance Status. It is also available for immediate download and adjustment. So, changes can be made in the color, design, graphics or any other component to create a unique layout.
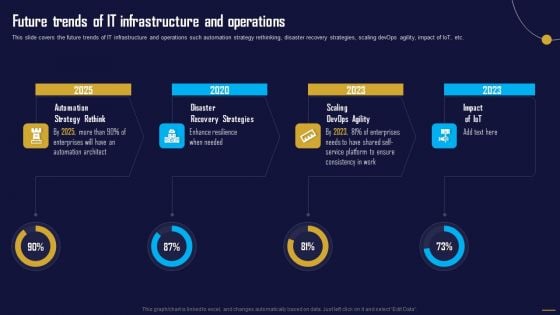
Future Trends Of IT Infrastructure And Operations Information Tech System Maintenance Ideas PDF
This slide covers the future trends of IT infrastructure and operations such automation strategy rethinking, disaster recovery strategies, scaling devOps agility, impact of IoT, etc. Find a pre-designed and impeccable Future Trends Of IT Infrastructure And Operations Information Tech System Maintenance Ideas PDF. The templates can ace your presentation without additional effort. You can download these easy to edit presentation templates to make your presentation stand out from others. So, what are you waiting for Download the template from Slidegeeks today and give a unique touch to your presentation.
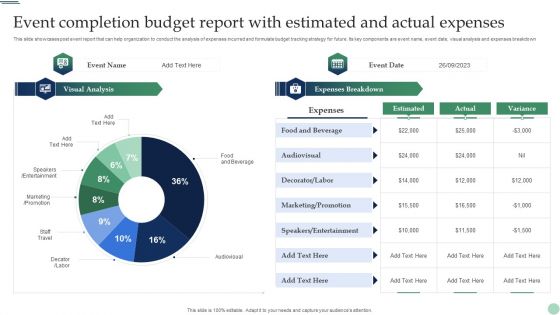
Event Completion Budget Report With Estimated And Actual Expenses Pictures PDF
This slide showcases post event report that can help organization to conduct the analysis of expenses incurred and formulate budget tracking strategy for future. Its key components are event name, event date, visual analysis and expenses breakdown. Pitch your topic with ease and precision using this Event Completion Budget Report With Estimated And Actual Expenses Pictures PDF. This layout presents information on Food And Beverage, Audiovisual, Marketing, Entertainment. It is also available for immediate download and adjustment. So, changes can be made in the color, design, graphics or any other component to create a unique layout.
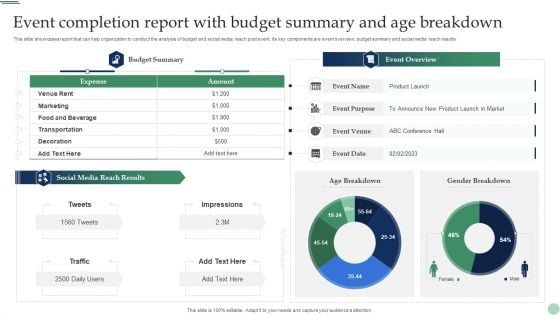
Event Completion Report With Budget Summary And Age Breakdown Elements PDF
This slide showcases report that can help organization to conduct the analysis of budget and social media reach post event. Its key components are event overview, budget summary and social media reach results. Showcasing this set of slides titled Event Completion Report With Budget Summary And Age Breakdown Elements PDF. The topics addressed in these templates are Social Media Reach Results, Event Overview, Age Breakdown. All the content presented in this PPT design is completely editable. Download it and make adjustments in color, background, font etc. as per your unique business setting.
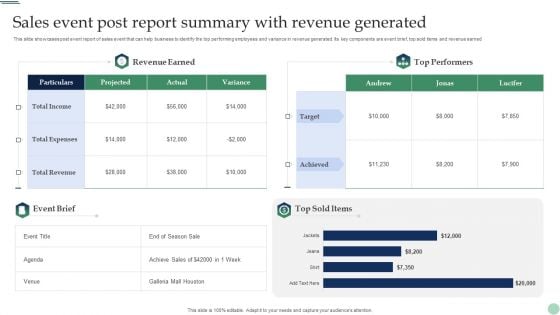
Sales Event Post Report Summary With Revenue Generated Portrait PDF
This slide showcases post event report of sales event that can help business to identify the top performing employees and variance in revenue generated. Its key components are event brief, top sold items and revenue earned. Showcasing this set of slides titled Sales Event Post Report Summary With Revenue Generated Portrait PDF. The topics addressed in these templates are Revenue Earned, Top Performers, Revenue Generated. All the content presented in this PPT design is completely editable. Download it and make adjustments in color, background, font etc. as per your unique business setting.
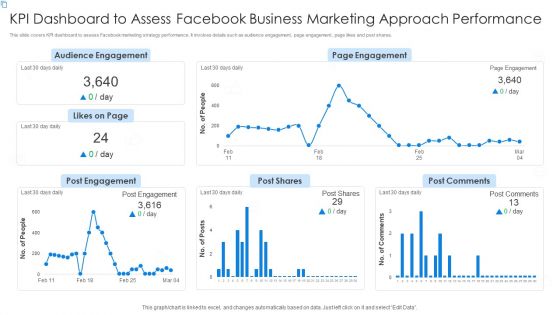
KPI Dashboard To Assess Facebook Business Marketing Approach Performance Portrait PDF
This slide covers KPI dashboard to assess Facebook marketing strategy performance. It involves details such as audience engagement, page engagement, page likes and post shares. Pitch your topic with ease and precision using this KPI Dashboard To Assess Facebook Business Marketing Approach Performance Portrait PDF. This layout presents information on Audience Engagement, Page Engagement, Post Comments. It is also available for immediate download and adjustment. So, changes can be made in the color, design, graphics or any other component to create a unique layout.
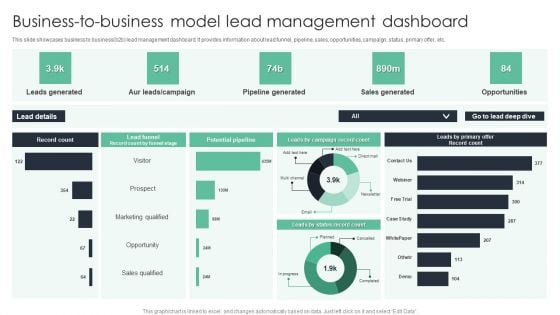
Business To Business Model Lead Management Dashboard Ppt Portfolio Backgrounds PDF
This slide showcases business to business b2b lead management dashboard. It provides information about lead funnel, pipeline, sales, opportunities, campaign, status, primary offer, etc. Pitch your topic with ease and precision using this Business To Business Model Lead Management Dashboard Ppt Portfolio Backgrounds PDF. This layout presents information on Leads Generated, Pipeline Generated, Sales Generated, Opportunities. It is also available for immediate download and adjustment. So, changes can be made in the color, design, graphics or any other component to create a unique layout.
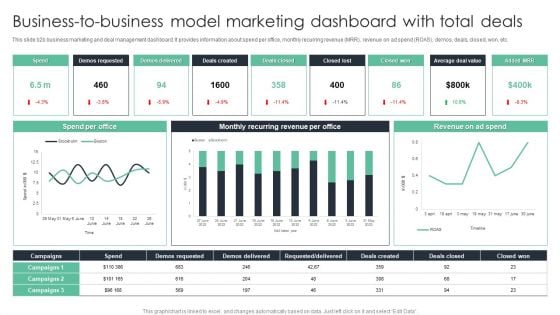
Business To Business Model Marketing Dashboard With Total Deals Ppt Professional Inspiration PDF
This slide b2b business marketing and deal management dashboard. It provides information about spend per office, monthly recurring revenue MRR, revenue on ad spend ROAS, demos, deals, closed, won, etc. Showcasing this set of slides titled Business To Business Model Marketing Dashboard With Total Deals Ppt Professional Inspiration PDF. The topics addressed in these templates are Demos Requested, Demos Delivered, Deals Created. All the content presented in this PPT design is completely editable. Download it and make adjustments in color, background, font etc. as per your unique business setting.
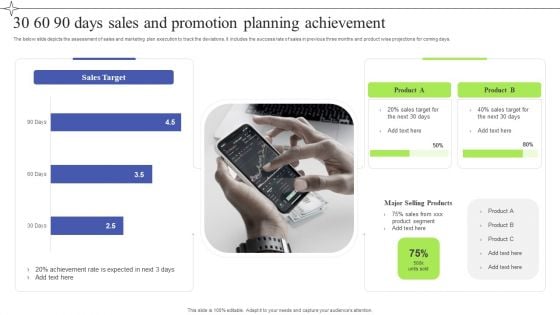
30 60 90 Days Sales And Promotion Planning Achievement Infographics PDF
The below slide depicts the assessment of sales and marketing plan execution to track the deviations. It includes the success rate of sales in previous three months and product wise projections for coming days. Showcasing this set of slides titled 30 60 90 Days Sales And Promotion Planning Achievement Infographics PDF. The topics addressed in these templates are 30 60 90 Days, Sales Promotion Planning, Achievement. All the content presented in this PPT design is completely editable. Download it and make adjustments in color, background, font etc. as per your unique business setting.
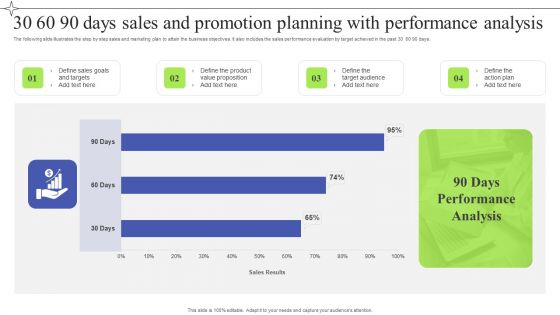
30 60 90 Days Sales And Promotion Planning With Performance Analysis Guidelines PDF
The following slide illustrates the step by step sales and marketing plan to attain the business objectives. It also includes the sales performance evaluation by target achieved in the past 30 60 90 days. Showcasing this set of slides titled 30 60 90 Days Sales And Promotion Planning With Performance Analysis Guidelines PDF. The topics addressed in these templates are 30 60 90 Days, Sales Promotion Planning, Performance Analysis. All the content presented in this PPT design is completely editable. Download it and make adjustments in color, background, font etc. as per your unique business setting.
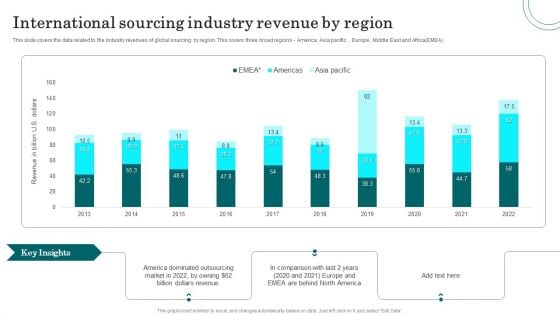
International Sourcing Industry Revenue By Region Information PDF
This slide covers the data related to the industry revenues of global sourcing by region. This covers three broad regions America, Asia pacific, Europe, Middle East and Africa EMEA. Showcasing this set of slides titled International Sourcing Industry Revenue By Region Information PDF. The topics addressed in these templates are Dollars Revenue, America Dominated Outsourcing Market, Industry Revenue. All the content presented in this PPT design is completely editable. Download it and make adjustments in color, background, font etc. as per your unique business setting.
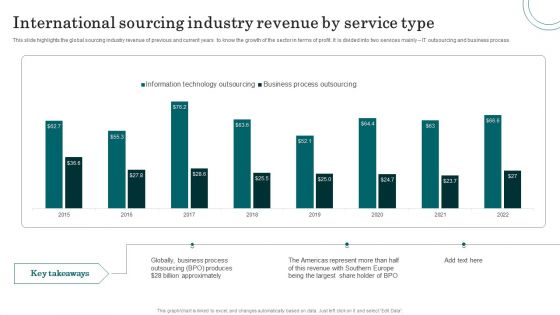
International Sourcing Industry Revenue By Service Type Mockup PDF
This slide highlights the global sourcing industry revenue of previous and current years to know the growth of the sector in terms of profit. It is divided into two services mainly IT outsourcing and business process. Pitch your topic with ease and precision using this International Sourcing Industry Revenue By Service Type Mockup PDF. This layout presents information on Business Process, Revenue, Share Holder. It is also available for immediate download and adjustment. So, changes can be made in the color, design, graphics or any other component to create a unique layout.
Property Flipping Expenses And Profit Tracking Dashboard Ppt Good PDF
This slide covers dashboard to estimate multiple expenses incurred and profits earned by property flipping. It includes elements such repair costs, after repair value, rehab profits, purchase price, total amount of investment Made, etc. Showcasing this set of slides titled Property Flipping Expenses And Profit Tracking Dashboard Ppt Good PDF. The topics addressed in these templates are Repair Costs, Loan Amount, Down Payment. All the content presented in this PPT design is completely editable. Download it and make adjustments in color, background, font etc. as per your unique business setting.
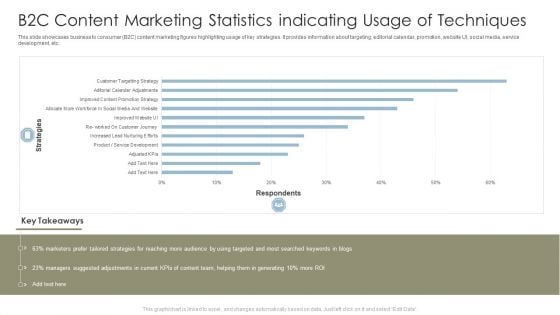
B2C Content Marketing Statistics Indicating Usage Of Techniques Sample PDF
This slide showcases business to consumer B2C content marketing figures highlighting usage of key strategies. It provides information about targeting, editorial calendar, promotion, website UI, social media, service development, etc. Pitch your topic with ease and precision using this B2C Content Marketing Statistics Indicating Usage Of Techniques Sample PDF. This layout presents information on Strategies, Marketers, Content Team. It is also available for immediate download and adjustment. So, changes can be made in the color, design, graphics or any other component to create a unique layout.
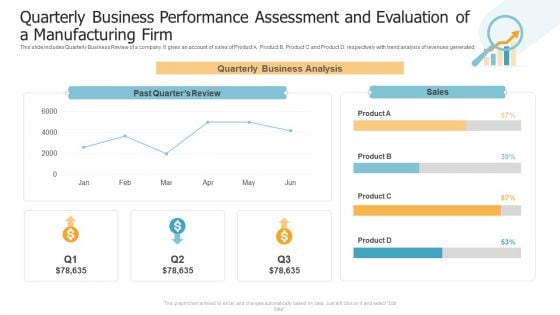
Quarterly Business Performance Assessment And Evaluation Of A Manufacturing Firm Inspiration PDF
This slide includes Quarterly Business Review of a company. It gives an account of sales of Product A, Product B, Product C and Product D, respectively with trend analysis of revenues generated. Showcasing this set of slides titled Quarterly Business Performance Assessment And Evaluation Of A Manufacturing Firm Inspiration PDF. The topics addressed in these templates are Quarterly Business Analysis, Product, Sales. All the content presented in this PPT design is completely editable. Download it and make adjustments in color, background, font etc. as per your unique business setting.

Cyber Protection Incident And Privacy Analysis With KPI Dashboard Ideas PDF
The following slide highlights some kpas of cyber security incidents to evaluate and monitor threats. It includes elements such as open incidents, warnings by severity, average response time, warnings pending for inspection etc. Showcasing this set of slides titled Cyber Protection Incident And Privacy Analysis With KPI Dashboard Ideas PDF. The topics addressed in these templates are Cyber Protection Incident, Privacy Analysis, KPI Dashboard. All the content presented in this PPT design is completely editable. Download it and make adjustments in color, background, font etc. as per your unique business setting.
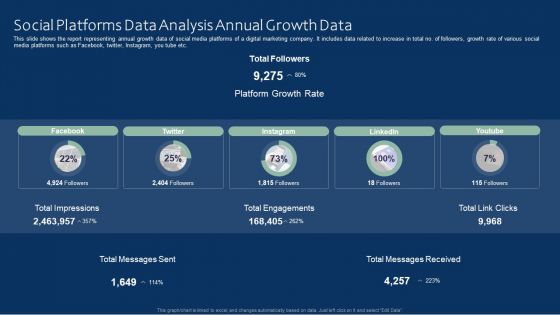
Social Platforms Data Analysis Annual Growth Data Ideas PDF
This slide shows the report representing annual growth data of social media platforms of a digital marketing company. It includes data related to increase in total no. of followers, growth rate of various social media platforms such as Facebook, twitter, Instagram, you tube etc. Pitch your topic with ease and precision using this Social Platforms Data Analysis Annual Growth Data Ideas PDF. This layout presents information on Social Platforms Data Analysis, Annual Growth Data. It is also available for immediate download and adjustment. So, changes can be made in the color, design, graphics or any other component to create a unique layout.
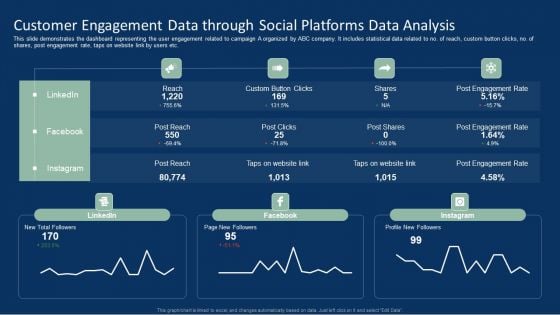
Customer Engagement Data Through Social Platforms Data Analysis Brochure PDF
This slide demonstrates the dashboard representing the user engagement related to campaign A organized by ABC company. It includes statistical data related to no. of reach, custom button clicks, no. of shares, post engagement rate, taps on website link by users etc. Showcasing this set of slides titled Customer Engagement Data Through Social Platforms Data Analysis Brochure PDF. The topics addressed in these templates are Customer Engagement Data, Social Platforms Data Analysis. All the content presented in this PPT design is completely editable. Download it and make adjustments in color, background, font etc. as per your unique business setting.
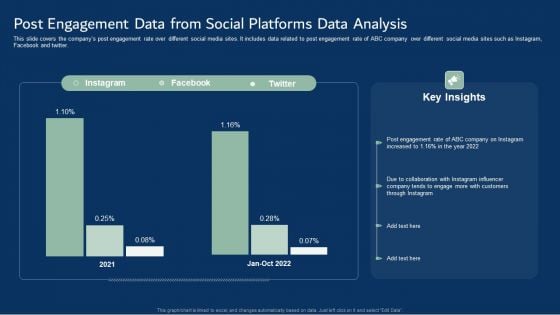
Post Engagement Data From Social Platforms Data Analysis Template PDF
This slide covers the companys post engagement rate over different social media sites. It includes data related to post engagement rate of ABC company over different social media sites such as Instagram, Facebook and twitter. Pitch your topic with ease and precision using this Post Engagement Data From Social Platforms Data Analysis Template PDF. This layout presents information on Post Engagement Data, Social Platforms Data Analysis. It is also available for immediate download and adjustment. So, changes can be made in the color, design, graphics or any other component to create a unique layout.
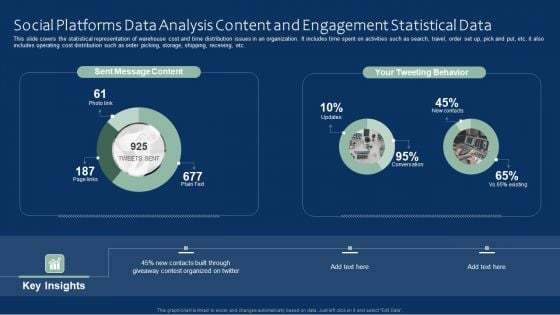
Social Platforms Data Analysis Content And Engagement Statistical Data Microsoft PDF
This slide covers the statistical representation of warehouse cost and time distribution issues in an organization. It includes time spent on activities such as search, travel, order set up, pick and put, etc. it also includes operating cost distribution such as order picking, storage, shipping, receiving, etc. Showcasing this set of slides titled Social Platforms Data Analysis Content And Engagement Statistical Data Microsoft PDF. The topics addressed in these templates are Social Platforms Data, Analysis Content, Engagement Statistical Data. All the content presented in this PPT design is completely editable. Download it and make adjustments in color, background, font etc. as per your unique business setting.
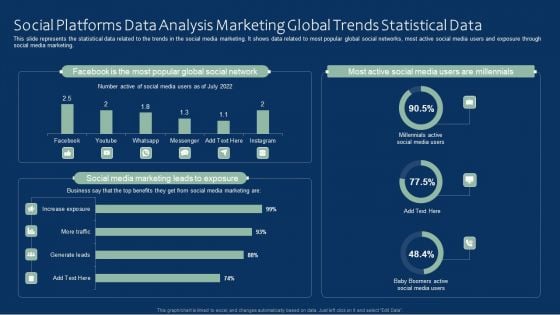
Social Platforms Data Analysis Marketing Global Trends Statistical Data Rules PDF
This slide represents the statistical data related to the trends in the social media marketing. It shows data related to most popular global social networks, most active social media users and exposure through social media marketing. Pitch your topic with ease and precision using this Social Platforms Data Analysis Marketing Global Trends Statistical Data Rules PDF. This layout presents information on Social Platforms Data Analysis, Marketing Global, Trends Statistical Data. It is also available for immediate download and adjustment. So, changes can be made in the color, design, graphics or any other component to create a unique layout.
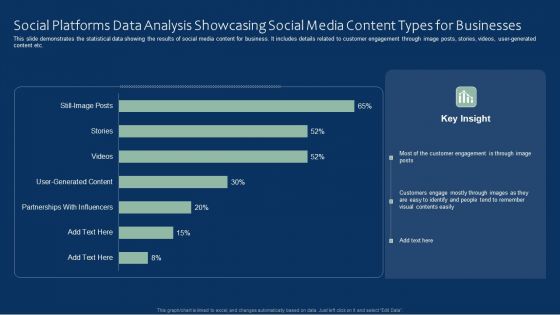
Social Platforms Data Analysis Showcasing Social Media Content Types For Businesses Inspiration PDF
This slide demonstrates the statistical data showing the results of social media content for business. It includes details related to customer engagement through image posts, stories, videos, user-generated content etc. Showcasing this set of slides titled Social Platforms Data Analysis Showcasing Social Media Content Types For Businesses Inspiration PDF. The topics addressed in these templates are Content Types For Businesses, Showcasing Social Media, Social Platforms Data Analysis. All the content presented in this PPT design is completely editable. Download it and make adjustments in color, background, font etc. as per your unique business setting.
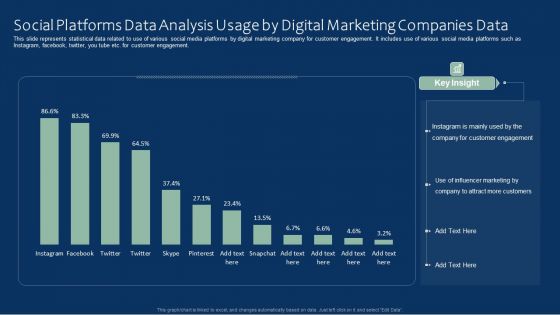
Social Platforms Data Analysis Usage By Digital Marketing Companies Data Clipart PDF
This slide represents statistical data related to use of various social media platforms by digital marketing company for customer engagement. It includes use of various social media platforms such as Instagram, facebook, twitter, you tube etc. for customer engagement. Pitch your topic with ease and precision using this Social Platforms Data Analysis Usage By Digital Marketing Companies Data Clipart PDF. This layout presents information on Social Platforms Data Analysis, Digital Marketing Companies Data. It is also available for immediate download and adjustment. So, changes can be made in the color, design, graphics or any other component to create a unique layout.
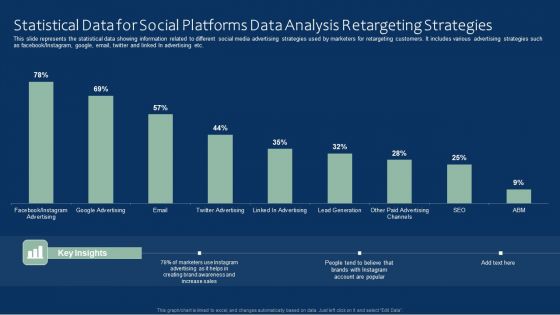
Statistical Data For Social Platforms Data Analysis Retargeting Strategies Inspiration PDF
This slide represents the statistical data showing information related to different social media advertising strategies used by marketers for retargeting customers. It includes various advertising strategies such as facebook or Instagram, google, email, twitter and linked In advertising etc. Showcasing this set of slides titled Statistical Data For Social Platforms Data Analysis Retargeting Strategies Inspiration PDF. The topics addressed in these templates are Social Platforms Data, Statistical Data, Analysis Retargeting Strategies. All the content presented in this PPT design is completely editable. Download it and make adjustments in color, background, font etc. as per your unique business setting.
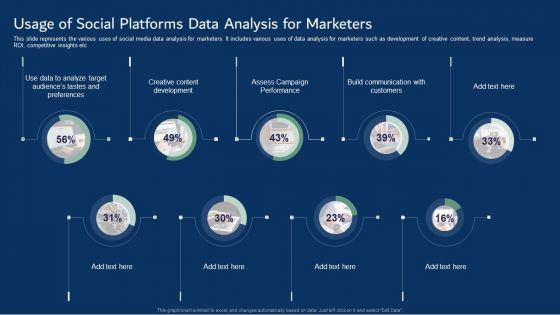
Usage Of Social Platforms Data Analysis For Marketers Information PDF
This slide represents the various uses of social media data analysis for marketers. It includes various uses of data analysis for marketers such as development of creative content, trend analysis, measure ROI, competitive insights etc. Showcasing this set of slides titled Usage Of Social Platforms Data Analysis For Marketers Information PDF. The topics addressed in these templates are Creative Content Development, Assess Campaign Performance, Build Communication. All the content presented in this PPT design is completely editable. Download it and make adjustments in color, background, font etc. as per your unique business setting.
Tracking Goals Alignment KPI Dashboard Guidelines PDF
This slide showcases a tracking dashboard for determining the alignment and progress percentage of the assigned objectives. It also includes the objective evaluation KPIs such as active objectives, overall progress, total employees, objective as per employees, aligned, organizational and departmental objectives. Pitch your topic with ease and precision using this Tracking Goals Alignment KPI Dashboard Guidelines PDF. This layout presents information on Employee, Organizational Objectives, Departmental Objectives. It is also available for immediate download and adjustment. So, changes can be made in the color, design, graphics or any other component to create a unique layout.
Tracking Goals Dashboard With Progress Report Rules PDF
This slide showcases the progress report which helps to determine gaps in the objective achievement process and take corrective actions. It also includes objective details such as contributor, due date, and progress percentage. Showcasing this set of slides titled Tracking Goals Dashboard With Progress Report Rules PDF. The topics addressed in these templates are Immediate Action Required, Progress Update Required, Concise Goal Outcome Required. All the content presented in this PPT design is completely editable. Download it and make adjustments in color, background, font etc. as per your unique business setting.
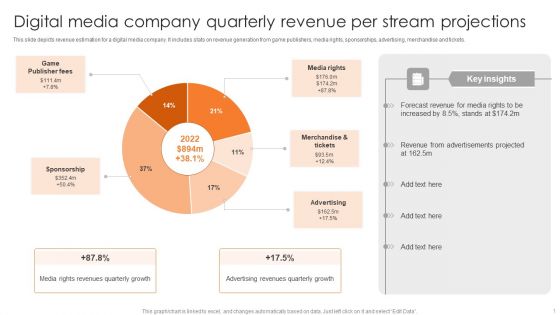
Digital Media Company Quarterly Revenue Per Stream Projections Elements PDF
This slide depicts revenue estimation for a digital media company. It includes stats on revenue generation from game publishers, media rights, sponsorships, advertising, merchandise and tickets. Pitch your topic with ease and precision using this Digital Media Company Quarterly Revenue Per Stream Projections Elements PDF. This layout presents information on Game Publisher Fees, Media Rights, Merchandise And Tickets. It is also available for immediate download and adjustment. So, changes can be made in the color, design, graphics or any other component to create a unique layout.
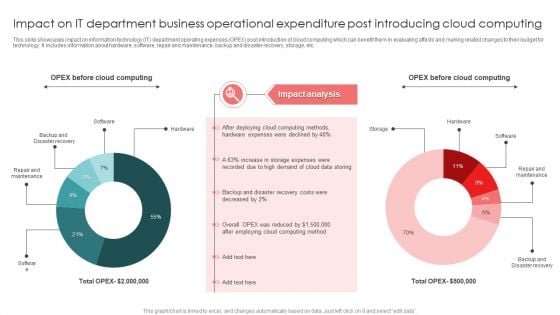
Impact On IT Department Business Operational Expenditure Post Introducing Cloud Computing Infographics PDF
This slide showcases impact on information technology IT department operating expenses OPEX post introduction of cloud computing which can benefit them in evaluating affects and making related changes to their budget for technology. It includes information about hardware, software, repair and maintenance, backup and disaster recovery, storage, etc. Showcasing this set of slides titled Impact On IT Department Business Operational Expenditure Post Introducing Cloud Computing Infographics PDF. The topics addressed in these templates are Software, Hardware, Storage. All the content presented in this PPT design is completely editable. Download it and make adjustments in color, background, font etc. as per your unique business setting.
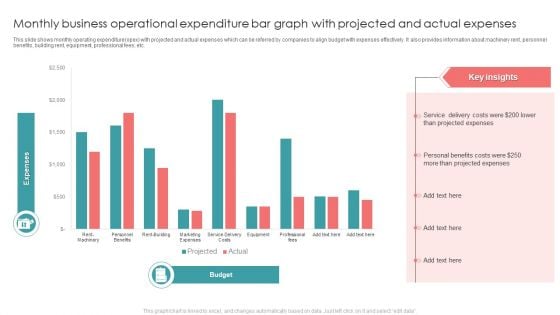
Monthly Business Operational Expenditure Bar Graph With Projected And Actual Expenses Introduction PDF
This slide shows monthly operating expenditure opex with projected and actual expenses which can be referred by companies to align budget with expenses effectively. It also provides information about machinery rent, personnel benefits, building rent, equipment, professional fees, etc. Pitch your topic with ease and precision using this Monthly Business Operational Expenditure Bar Graph With Projected And Actual Expenses Introduction PDF. This layout presents information on Projected Expenses, Costs, Service. It is also available for immediate download and adjustment. So, changes can be made in the color, design, graphics or any other component to create a unique layout.
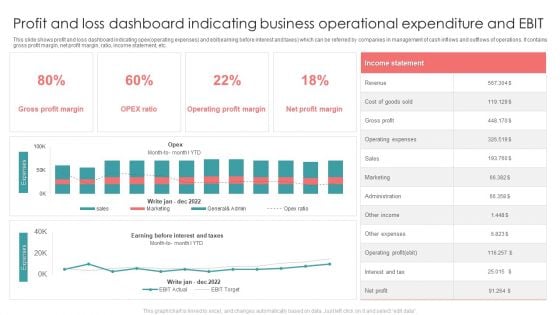
Profit And Loss Dashboard Indicating Business Operational Expenditure And EBIT Formats PDF
This slide shows profit and loss dashboard indicating opex operating expenses and ebit earning before interest and taxes which can be referred by companies in management of cash inflows and outflows of operations. It contains gross profit margin, net profit margin, ratio, income statement, etc. Showcasing this set of slides titled Profit And Loss Dashboard Indicating Business Operational Expenditure And EBIT Formats PDF. The topics addressed in these templates are Revenue, Gross Profit, Sales. All the content presented in this PPT design is completely editable. Download it and make adjustments in color, background, font etc. as per your unique business setting.
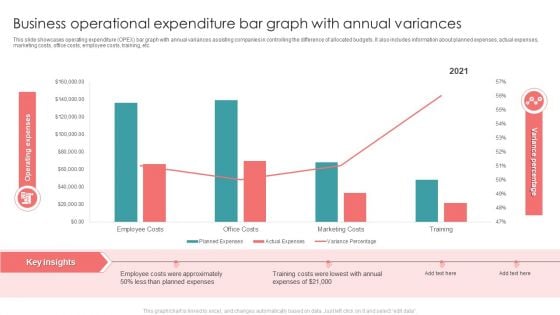
Business Operational Expenditure Bar Graph With Annual Variances Brochure PDF
This slide showcases operating expenditure OPEX bar graph with annual variances assisting companies in controlling the difference of allocated budgets. It also includes information about planned expenses, actual expenses, marketing costs, office costs, employee costs, training, etc. Showcasing this set of slides titled Business Operational Expenditure Bar Graph With Annual Variances Brochure PDF. The topics addressed in these templates are Employee Costs, Planned Expenses, Training Costs. All the content presented in this PPT design is completely editable. Download it and make adjustments in color, background, font etc. as per your unique business setting.
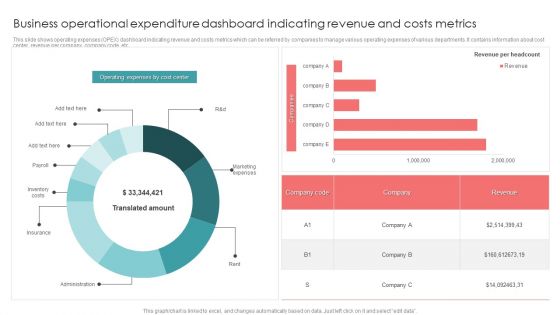
Business Operational Expenditure Dashboard Indicating Revenue And Costs Metrics Pictures PDF
This slide shows operating expenses OPEX dashboard indicating revenue and costs metrics which can be referred by companies to manage various operating expenses of various departments. It contains information about cost center, revenue per company, company code, etc. Pitch your topic with ease and precision using this Business Operational Expenditure Dashboard Indicating Revenue And Costs Metrics Pictures PDF. This layout presents information on Business Operational, Costs Metrics, Revenue. It is also available for immediate download and adjustment. So, changes can be made in the color, design, graphics or any other component to create a unique layout.

Business Revenue Bar Graph With Business Operational Expenditure Details Summary PDF
This slide represents business revenue bar graph with OPEX details which can be referred by companies to earn more revenue by controlling expenditures. It also provides information about marketing and sales, research and development, administration, total revenue, etc. Pitch your topic with ease and precision using this Business Revenue Bar Graph With Business Operational Expenditure Details Summary PDF. This layout presents information on Cost Of Marketing, Sales, Highest Amount. It is also available for immediate download and adjustment. So, changes can be made in the color, design, graphics or any other component to create a unique layout.
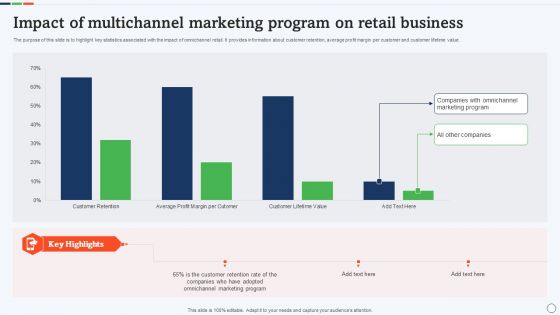
Impact Of Multichannel Marketing Program On Retail Business Brochure PDF
The purpose of this slide is to highlight key statistics associated with the impact of omnichannel retail. It provides information about customer retention, average profit margin per customer and customer lifetime value. Showcasing this set of slides titled Impact Of Multichannel Marketing Program On Retail Business Brochure PDF. The topics addressed in these templates are Customer Lifetime Value, Customer Retention, Average Profit Margin. All the content presented in this PPT design is completely editable. Download it and make adjustments in color, background, font etc. as per your unique business setting.
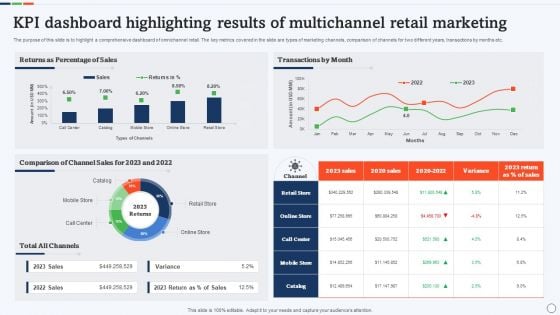
KPI Dashboard Highlighting Results Of Multichannel Retail Marketing Rules PDF
The purpose of this slide is to highlight a comprehensive dashboard of omnichannel retail. The key metrics covered in the slide are types of marketing channels, comparison of channels for two different years, transactions by months etc. Pitch your topic with ease and precision using this KPI Dashboard Highlighting Results Of Multichannel Retail Marketing Rules PDF. This layout presents information on Comparison Of Channel Sales, Percentage Of Sales, Transactions By Month. It is also available for immediate download and adjustment. So, changes can be made in the color, design, graphics or any other component to create a unique layout.
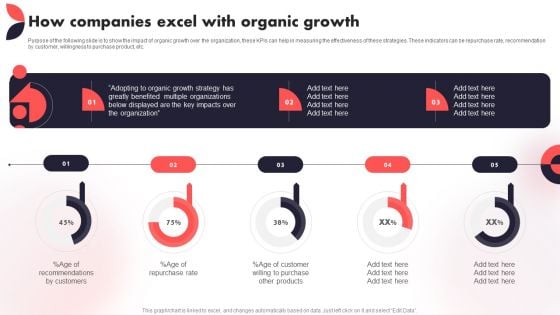
How Companies Excel With Organic Growth Year Over Year Business Success Playbook Guidelines PDF
Purpose of the following slide is to show the impact of organic growth over the organization, these KPIs can help in measuring the effectiveness of these strategies. These indicators can be repurchase rate, recommendation by customer, willingness to purchase product, etc.Find a pre-designed and impeccable How Companies Excel With Organic Growth Year Over Year Business Success Playbook Guidelines PDF. The templates can ace your presentation without additional effort. You can download these easy-to-edit presentation templates to make your presentation stand out from others. So, what are you waiting for Download the template from Slidegeeks today and give a unique touch to your presentation.
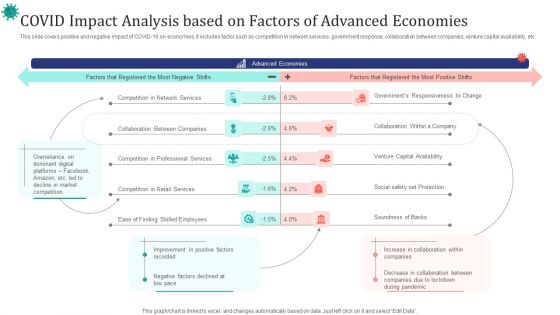
COVID Impact Analysis Based On Factors Of Advanced Economies Ppt Slides Example PDF
This slide covers positive and negative impact of COVID-19 on economies. It includes factor such as competition in network services, government response, collaboration between companies, venture capital availability, etc. Showcasing this set of slides titled COVID Impact Analysis Based On Factors Of Advanced Economies Ppt Slides Example PDF. The topics addressed in these templates are Advanced Economies, Network Services, Collaboration Between Companies. All the content presented in this PPT design is completely editable. Download it and make adjustments in color, background, font etc. as per your unique business setting.
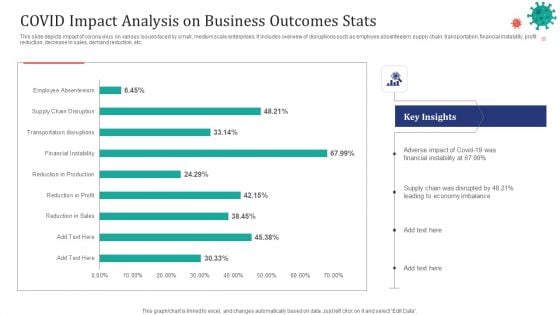
COVID Impact Analysis On Business Outcomes Stats Ppt Layouts Introduction PDF
This slide depicts impact of corona virus on various issues faced by small, medium scale enterprises. It includes overview of disruptions such as employee absenteeism, supply chain, transportation, financial instability, profit reduction, decrease in sales, demand reduction, etc. Showcasing this set of slides titled COVID Impact Analysis On Business Outcomes Stats Ppt Layouts Introduction PDF. The topics addressed in these templates are Reduction Sales, Reduction Profit, Reduction Production. All the content presented in this PPT design is completely editable. Download it and make adjustments in color, background, font etc. as per your unique business setting.
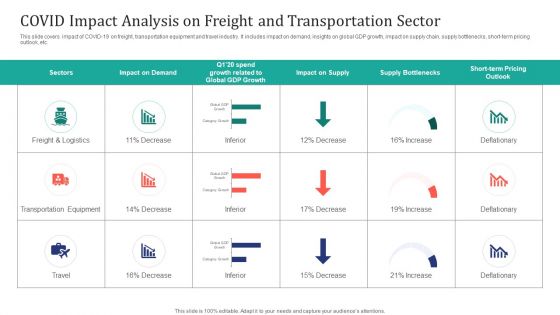
COVID Impact Analysis On Freight And Transportation Sector Ppt Outline Graphics Tutorials PDF
This slide covers impact of COVID-19 on freight, transportation equipment and travel industry. It includes impact on demand, insights on global GDP growth, impact on supply chain, supply bottlenecks, short-term pricing outlook, etc. Pitch your topic with ease and precision using this COVID Impact Analysis On Freight And Transportation Sector Ppt Outline Graphics Tutorials PDF. This layout presents information on Freight And Logistics, Transportation Equipment, Deflationary. It is also available for immediate download and adjustment. So, changes can be made in the color, design, graphics or any other component to create a unique layout.
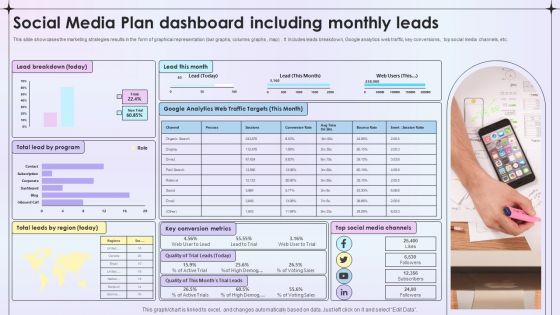
Social Media Plan Dashboard Including Monthly Leads Ppt File Slides PDF
This slide showcases the marketing strategies results in the form of graphical representation bar graphs, columns graphs , map. It includes leads breakdown, Google analytics web traffic, key conversions , top social media channels, etc. Showcasing this set of slides titled Social Media Plan Dashboard Including Monthly Leads Ppt File Slides PDF. The topics addressed in these templates are Lead Breakdown, Key Conversion Metrics, Social Media Channels. All the content presented in this PPT design is completely editable. Download it and make adjustments in color, background, font etc. as per your unique business setting.
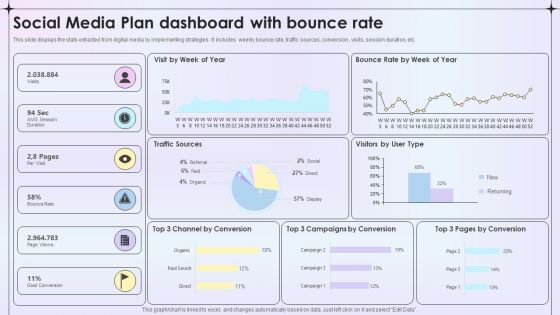
Social Media Plan Dashboard With Bounce Rate Ppt Ideas Graphics Template PDF
This slide displays the stats extracted from digital media by implementing strategies . It includes weekly bounce rate, traffic sources, conversion , visits, session duration, etc. Pitch your topic with ease and precision using this Social Media Plan Dashboard With Bounce Rate Ppt Ideas Graphics Template PDF. This layout presents information on Traffic Sources, Visitors User Type, Goal Conversion. It is also available for immediate download and adjustment. So, changes can be made in the color, design, graphics or any other component to create a unique layout.
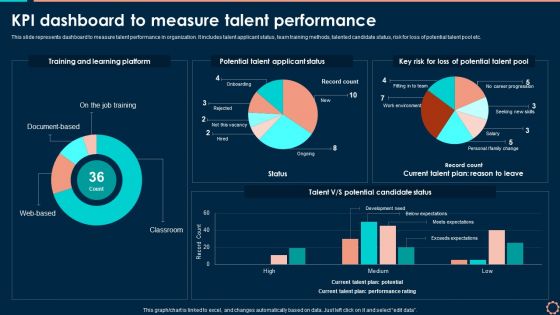
KPI Dashboard To Measure Talent Performance Slides PDF
This slide represents dashboard to measure talent performance in organization. It includes talent applicant status, team training methods, talented candidate status, risk for loss of potential talent pool etc. Get a simple yet stunning designed KPI Dashboard To Measure Talent Performance Slides PDF. It is the best one to establish the tone in your meetings. It is an excellent way to make your presentations highly effective. So, download this PPT today from Slidegeeks and see the positive impacts. Our easy to edit KPI Dashboard To Measure Talent Performance Slides PDF can be your go-to option for all upcoming conferences and meetings. So, what are you waiting for Grab this template today.
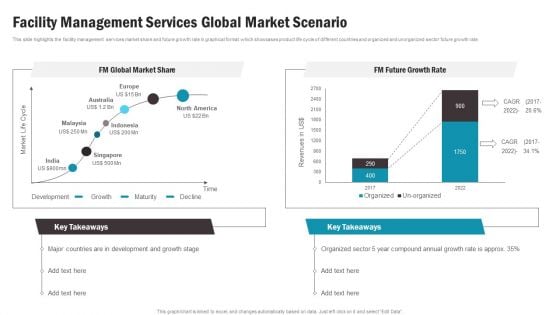
Facility Management Services Global Market Scenario Topics PDF
This slide highlights the facility management services market share and future growth rate in graphical format which showcases product life cycle of different countries and organized and unorganized sector future growth rate. This Facility Management Services Global Market Scenario Topics PDF is perfect for any presentation, be it in front of clients or colleagues. It is a versatile and stylish solution for organizing your meetings. The product features a modern design for your presentation meetings. The adjustable and customizable slides provide unlimited possibilities for acing up your presentation. Slidegeeks has done all the homework before launching the product for you. So, do not wait, grab the presentation templates today.
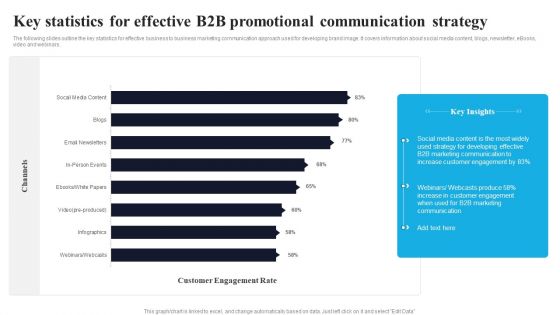
Key Statistics For Effective B2B Promotional Communication Strategy Information PDF
The following slides outline the key statistics for effective business to business marketing communication approach used for developing brand image. It covers information about social media content, blogs, newsletter, eBooks, video and webinars. Showcasing this set of slides titled Key Statistics For Effective B2B Promotional Communication Strategy Information PDF. The topics addressed in these templates are Customer Engagement Rate, Social Media Content, Customer Engagement. All the content presented in this PPT design is completely editable. Download it and make adjustments in color, background, font etc. as per your unique business setting.
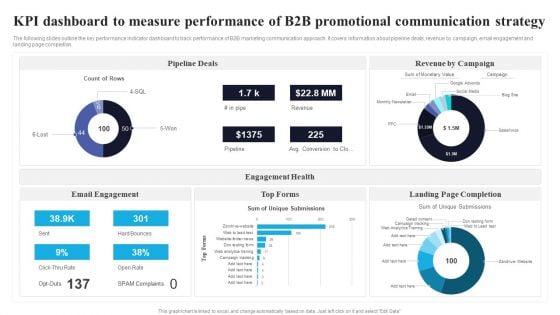
KPI Dashboard To Measure Performance Of B2B Promotional Communication Strategy Mockup PDF
The following slides outline the key performance indicator dashboard to track performance of B2B marketing communication approach. It covers information about pipeline deals, revenue by campaign, email engagement and landing page completion. Pitch your topic with ease and precision using this KPI Dashboard To Measure Performance Of B2B Promotional Communication Strategy Mockup PDF. This layout presents information on Pipeline Deals, Engagement Health, Email Engagement. It is also available for immediate download and adjustment. So, changes can be made in the color, design, graphics or any other component to create a unique layout.
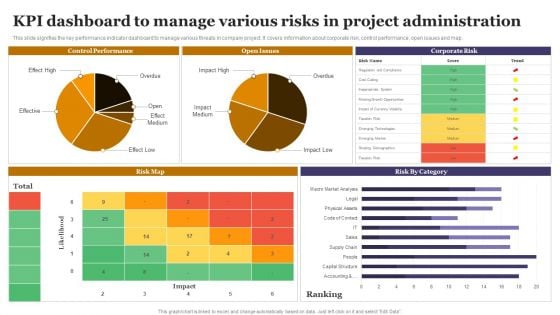
KPI Dashboard To Manage Various Risks In Project Administration Sample PDF
This slide signifies the key performance indicator dashboard to manage various threats in company project. It covers information about corporate risk, control performance, open issues and map. Showcasing this set of slides titled KPI Dashboard To Manage Various Risks In Project Administration Sample PDF. The topics addressed in these templates are Control Performance, Open Issues, Corporate Risk. All the content presented in this PPT design is completely editable. Download it and make adjustments in color, background, font etc. as per your unique business setting.
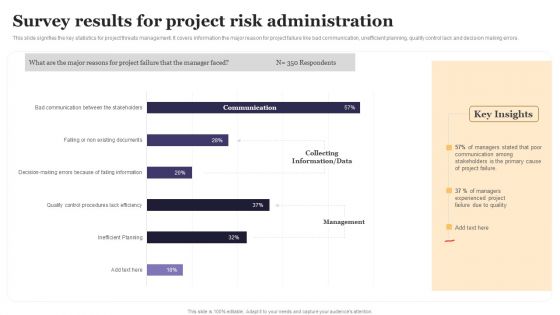
Survey Results For Project Risk Administration Ppt Portfolio Display PDF
This slide signifies the key statistics for project threats management. It covers information the major reason for project failure like bad communication, unefficient planning, quality control lack and decision making errors. Showcasing this set of slides titled Survey Results For Project Risk Administration Ppt Portfolio Display PDF. The topics addressed in these templates are Collecting Information, Data, Management. All the content presented in this PPT design is completely editable. Download it and make adjustments in color, background, font etc. as per your unique business setting.
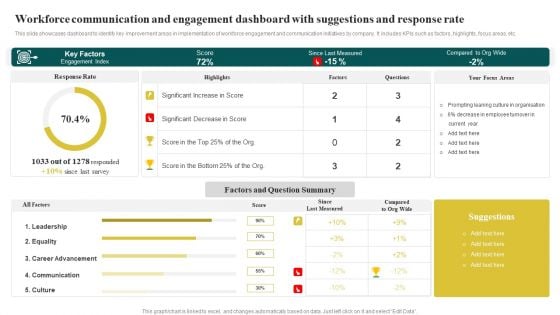
Workforce Communication And Engagement Dashboard With Suggestions And Response Rate Microsoft PDF
This slide showcases dashboard to identify key improvement areas in implementation of workforce engagement and communication initiatives by company. It includes KPIs such as factors, highlights, focus areas, etc. Pitch your topic with ease and precision using this Workforce Communication And Engagement Dashboard With Suggestions And Response Rate Microsoft PDF. This layout presents information on Key Factors, Since Last Measured, Factors And Que. It is also available for immediate download and adjustment. So, changes can be made in the color, design, graphics or any other component to create a unique layout.
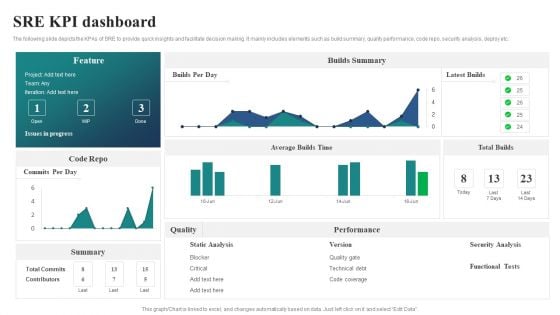
SRE KPI Dashboard Ppt PowerPoint Presentation File Slide Portrait PDF
The following slide depicts the KPAs of SRE to provide quick insights and facilitate decision making. It mainly includes elements such as build summary, quality performance, code repo, security analysis, deploy etc. Showcasing this set of slides titled SRE KPI Dashboard Ppt PowerPoint Presentation File Slide Portrait PDF. The topics addressed in these templates are Builds Summary, Latest Builds, Total Builds. All the content presented in this PPT design is completely editable. Download it and make adjustments in color, background, font etc. as per your unique business setting.
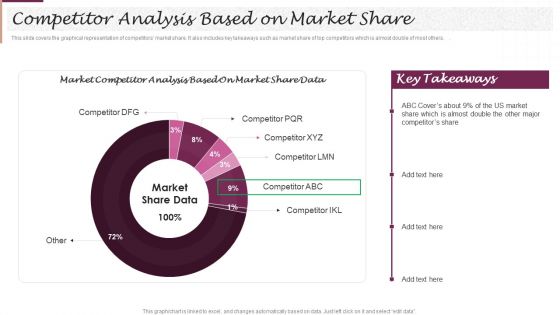
New Market Segment Entry Plan Competitor Analysis Based On Market Share Demonstration PDF
This slide covers the graphical representation of competitors market share. It also includes key takeaways such as market share of top competitors which is almost double of most others. . If your project calls for a presentation, then Slidegeeks is your go-to partner because we have professionally designed, easy-to-edit templates that are perfect for any presentation. After downloading, you can easily edit New Market Segment Entry Plan Competitor Analysis Based On Market Share Demonstration PDF and make the changes accordingly. You can rearrange slides or fill them with different images. Check out all the handy templates.

Staff Succession Planning And Development Determining Employee Headcount Average Elements PDF
Following slide displays informational stats about employee headcount and average tenure. It also includes a graph that shows stats about hiring and turnover rate.Get a simple yet stunning designed Staff Succession Planning And Development Determining Employee Headcount Average Elements PDF. It is the best one to establish the tone in your meetings. It is an excellent way to make your presentations highly effective. So, download this PPT today from Slidegeeks and see the positive impacts. Our easy-to-edit Staff Succession Planning And Development Determining Employee Headcount Average Elements PDF can be your go-to option for all upcoming conferences and meetings. So, what are you waiting for Grab this template today.
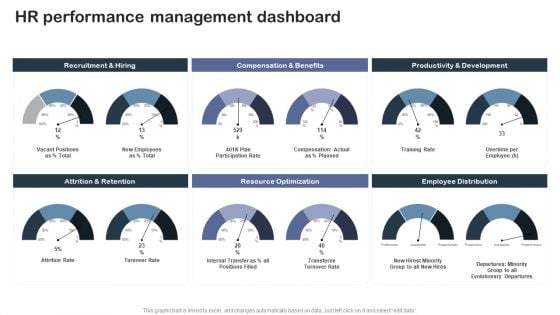
Staff Succession Planning And Development Hr Performance Management Dashboard Structure PDF
Do you have an important presentation coming up Are you looking for something that will make your presentation stand out from the rest Look no further than Staff Succession Planning And Development Hr Performance Management Dashboard Structure PDF. With our professional designs, you can trust that your presentation will pop and make delivering it a smooth process. And with Slidegeeks, you can trust that your presentation will be unique and memorable. So why wait Grab Staff Succession Planning And Development Hr Performance Management Dashboard Structure PDF today and make your presentation stand out from the rest.
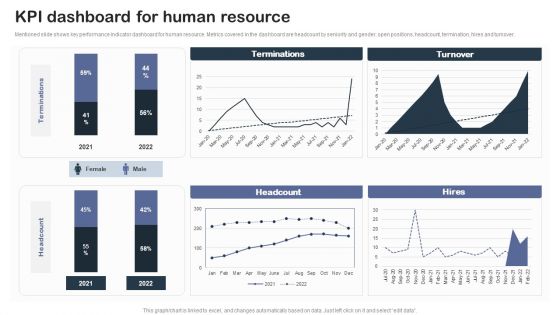
Staff Succession Planning And Development Strategy Kpi Dashboard For Human Clipart PDF
Mentioned slide shows key performance indicator dashboard for human resource. Metrics covered in the dashboard are headcount by seniority and gender, open positions, headcount, termination, hires and turnover.If your project calls for a presentation, then Slidegeeks is your go-to partner because we have professionally designed, easy-to-edit templates that are perfect for any presentation. After downloading, you can easily edit Staff Succession Planning And Development Strategy Kpi Dashboard For Human Clipart PDF and make the changes accordingly. You can rearrange slides or fill them with different images. Check out all the handy templates.
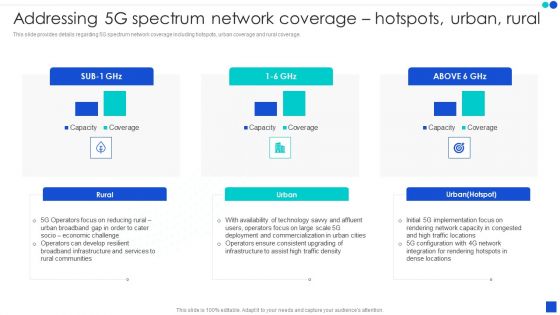
Addressing 5G Spectrum Network Coverage Hotspots Urban Rural Inspiration PDF
This slide provides details regarding 5G spectrum network coverage including hotspots, urban coverage and rural coverage. Create an editable Addressing 5G Spectrum Network Coverage Hotspots Urban Rural Inspiration PDF that communicates your idea and engages your audience. Whether you are presenting a business or an educational presentation, pre designed presentation templates help save time. Addressing 5G Spectrum Network Coverage Hotspots Urban Rural Inspiration PDF is highly customizable and very easy to edit, covering many different styles from creative to business presentations. Slidegeeks has creative team members who have crafted amazing templates. So, go and get them without any delay.
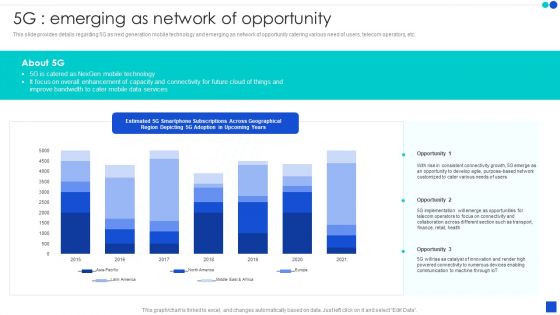
5G Technology Development For Digital Transformation 5G Emerging As Network Of Opportunity Portrait PDF
This slide provides details regarding 5G as next generation mobile technology and emerging as network of opportunity catering various need of users, telecom operators, etc. Find a pre designed and impeccable 5G Technology Development For Digital Transformation 5G Emerging As Network Of Opportunity Portrait PDF. The templates can ace your presentation without additional effort. You can download these easy to edit presentation templates to make your presentation stand out from others. So, what are you waiting for Download the template from Slidegeeks today and give a unique touch to your presentation.

5G Technology Development For Digital Transformation Determine Competitive Landscape Of 5G Clipart PDF
Create an editable 5G Technology Development For Digital Transformation Determine Competitive Landscape Of 5G Clipart PDF that communicates your idea and engages your audience. Whether you are presenting a business or an educational presentation, pre designed presentation templates help save time. 5G Technology Development For Digital Transformation Determine Competitive Landscape Of 5G Clipart PDF is highly customizable and very easy to edit, covering many different styles from creative to business presentations. Slidegeeks has creative team members who have crafted amazing templates. So, go and get them without any delay.

Benefits Of Enterprise Risk Management Experienced By Organizations Pictures PDF
This slide represents the ways in which enterprise risk management helps organizations to improve decision quality, reduce business liability and frame regulatory issues. It includes details related to results of survey conducted to analyze benefits of ERM experienced by various organizations. Find a pre designed and impeccable Benefits Of Enterprise Risk Management Experienced By Organizations Pictures PDF. The templates can ace your presentation without additional effort. You can download these easy to edit presentation templates to make your presentation stand out from others. So, what are you waiting for Download the template from Slidegeeks today and give a unique touch to your presentation.
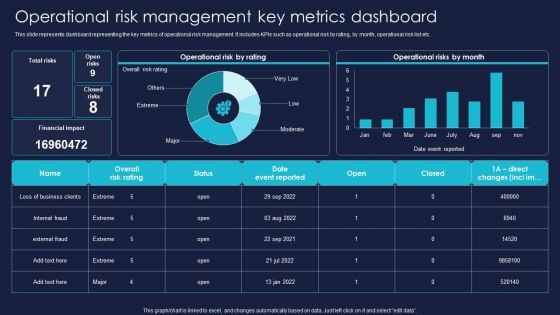
Operational Risk Management Key Metrics Dashboard Professional PDF
This slide represents dashboard representing the key metrics of operational risk management. It includes KPIs such as operational risk by rating, by month, operational risk list etc. Get a simple yet stunning designed Operational Risk Management Key Metrics Dashboard Professional PDF. It is the best one to establish the tone in your meetings. It is an excellent way to make your presentations highly effective. So, download this PPT today from Slidegeeks and see the positive impacts. Our easy to edit Operational Risk Management Key Metrics Dashboard Professional PDF can be your go-to option for all upcoming conferences and meetings. So, what are you waiting for Grab this template today.
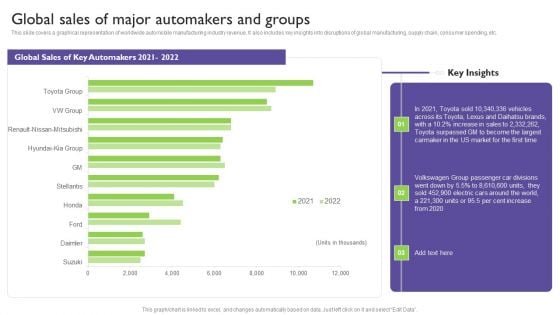
Global Automotive Industry Analysis Global Sales Of Major Automakers And Groups Pictures PDF
This slide covers a graphical representation of worldwide automobile manufacturing industry revenue. It also includes key insights into disruptions of global manufacturing, supply chain, consumer spending, etc. The Global Automotive Industry Analysis Global Sales Of Major Automakers And Groups Pictures PDF is a compilation of the most recent design trends as a series of slides. It is suitable for any subject or industry presentation, containing attractive visuals and photo spots for businesses to clearly express their messages. This template contains a variety of slides for the user to input data, such as structures to contrast two elements, bullet points, and slides for written information. Slidegeeks is prepared to create an impression.
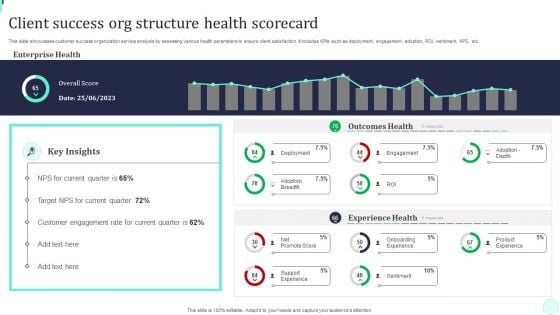
Client Success Org Structure Health Scorecard Background PDF
This slide showcases customer success organization service analysis by assessing various health parameters to ensure client satisfaction. It includes KPIs such as deployment, engagement, adoption, ROI, sentiment, NPS, etc. Showcasing this set of slides titled Client Success Org Structure Health Scorecard Background PDF. The topics addressed in these templates are Overall Score, Key Insights, Outcomes Health . All the content presented in this PPT design is completely editable. Download it and make adjustments in color, background, font etc. as per your unique business setting.
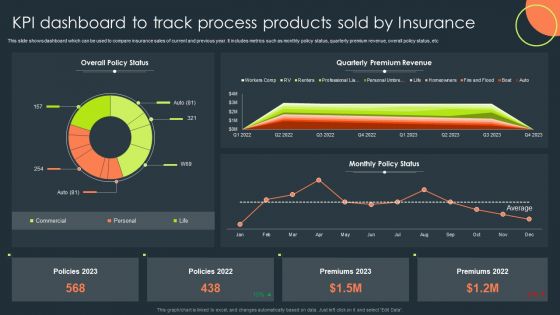
KPI Dashboard To Track Process Products Sold By Insurance Topics PDF
This slide shows dashboard which can be used to compare insurance sales of current and previous year. It includes metrics such as monthly policy status, quarterly premium revenue, overall policy status, etc. Pitch your topic with ease and precision using this KPI Dashboard To Track Process Products Sold By Insurance Topics PDF. This layout presents information on Overall Policy Status, Quarterly Premium Revenue, Monthly Policy Status. It is also available for immediate download and adjustment. So, changes can be made in the color, design, graphics or any other component to create a unique layout.
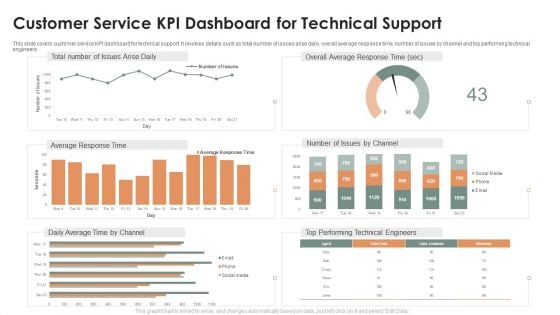
Customer Service KPI Dashboard For Technical Support Ppt Model Vector PDF
This slide covers customer service KPI dashboard for technical support. It involves details such as total number of issues arise daily, overall average response time, number of issues by channel and top performing technical engineers. Pitch your topic with ease and precision using this Customer Service KPI Dashboard For Technical Support Ppt Model Vector PDF. This layout presents information on Overall Average, Response Time, Total Number, Issues Arise Daily. It is also available for immediate download and adjustment. So, changes can be made in the color, design, graphics or any other component to create a unique layout.
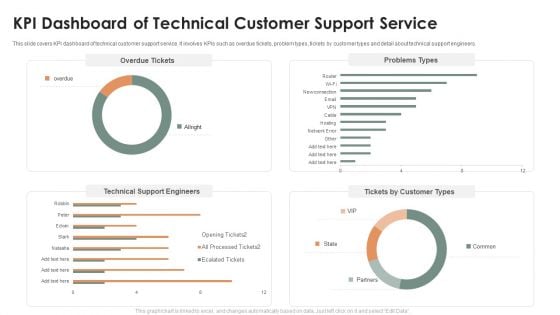
KPI Dashboard Of Technical Customer Support Service Ppt Layouts Professional PDF
This slide covers KPI dashboard of technical customer support service. It involves KPIs such as overdue tickets, problem types, tickets by customer types and detail about technical support engineers. Showcasing this set of slides titled KPI Dashboard Of Technical Customer Support Service Ppt Layouts Professional PDF. The topics addressed in these templates are Overdue Tickets, Problems Types, Technical Support Engineers. All the content presented in this PPT design is completely editable. Download it and make adjustments in color, background, font etc. as per your unique business setting.
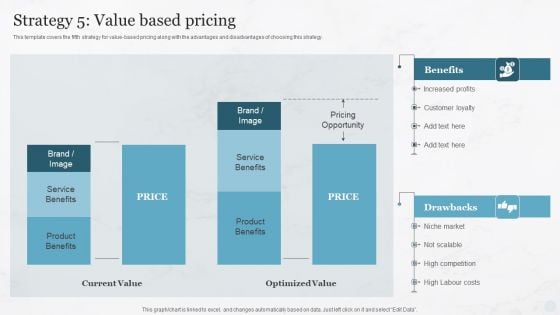
Strategy 5 Value Based Pricing Pricing Strategies For New Product In Market Ideas PDF
This template covers the fifth strategy for value-based pricing along with the advantages and disadvantages of choosing this strategy.The Strategy 5 Value Based Pricing Pricing Strategies For New Product In Market Ideas PDF is a compilation of the most recent design trends as a series of slides. It is suitable for any subject or industry presentation, containing attractive visuals and photo spots for businesses to clearly express their messages. This template contains a variety of slides for the user to input data, such as structures to contrast two elements, bullet points, and slides for written information. Slidegeeks is prepared to create an impression.
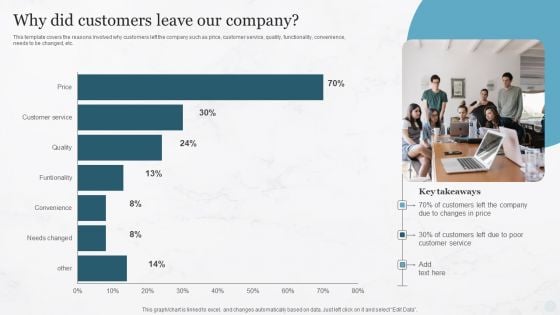
Why Did Customers Leave Our Company Pricing Strategies For New Product In Market Professional PDF
This template covers the reasons involved why customers left the company such as price, customer service, quality, functionality, convenience, needs to be changed, etc.This Why Did Customers Leave Our Company Pricing Strategies For New Product In Market Professional PDF is perfect for any presentation, be it in front of clients or colleagues. It is a versatile and stylish solution for organizing your meetings. The product features a modern design for your presentation meetings. The adjustable and customizable slides provide unlimited possibilities for acing up your presentation. Slidegeeks has done all the homework before launching the product for you. So, do not wait, grab the presentation templates today.

KPI Dashboard Showing Results Of Sales And Marketing Project Campaign Formats PDF
Following slide showcases performance KPI dashboard used to evaluate marketing project campaign results. The dashboard provides overview of key metrics such as total revenue, marketing spend, profit and cost per acquisition, leads etc. Showcasing this set of slides titled KPI Dashboard Showing Results Of Sales And Marketing Project Campaign Formats PDF. The topics addressed in these templates are Marketing Spend, Revenue, Profit Per Acquisition. All the content presented in this PPT design is completely editable. Download it and make adjustments in color, background, font etc. as per your unique business setting.
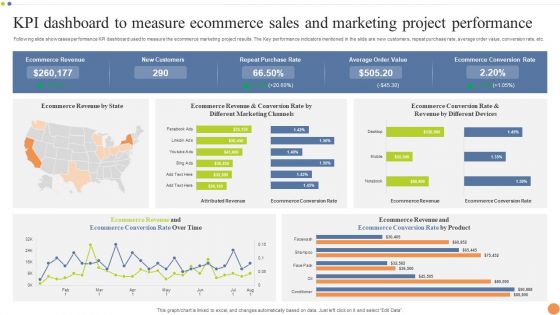
KPI Dashboard To Measure Ecommerce Sales And Marketing Project Performance Portrait PDF
Following slide showcases performance KPI dashboard used to measure the ecommerce marketing project results. The Key performance indicators mentioned in the slide are new customers, repeat purchase rate, average order value, conversion rate, etc. Pitch your topic with ease and precision using this KPI Dashboard To Measure Ecommerce Sales And Marketing Project Performance Portrait PDF. This layout presents information on Purchase Rate, Average Order Value, Ecommerce Conversion Rate. It is also available for immediate download and adjustment. So, changes can be made in the color, design, graphics or any other component to create a unique layout.
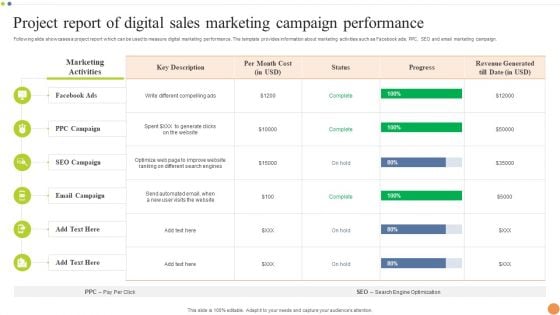
Project Report Of Digital Sales Marketing Campaign Performance Professional PDF
Following slide showcases a project report which can be used to measure digital marketing performance. The template provides information about marketing activities such as Facebook ads, PPC, SEO and email marketing campaign. Pitch your topic with ease and precision using this Project Report Of Digital Sales Marketing Campaign Performance Professional PDF. This layout presents information on Email Campaign, SEO Campaign, Marketing Activities. It is also available for immediate download and adjustment. So, changes can be made in the color, design, graphics or any other component to create a unique layout.
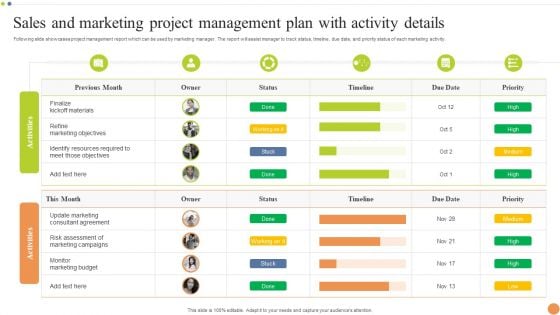
Sales And Marketing Project Management Plan With Activity Details Ideas PDF
Following slide showcases project management report which can be used by marketing manager. The report will assist manager to track status, timeline, due date, and priority status of each marketing activity. Showcasing this set of slides titled Sales And Marketing Project Management Plan With Activity Details Ideas PDF. The topics addressed in these templates are Monitor Marketing Budget, Update Marketing Consultant Agreement, Risk Assessment. All the content presented in this PPT design is completely editable. Download it and make adjustments in color, background, font etc. as per your unique business setting.
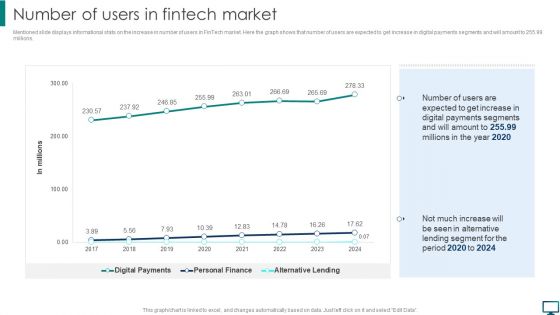
Optimizing Advanced Technology To Gain Competitive Edge Number Of Users In Fintech Market Elements PDF
Mentioned slide displays informational stats on the increase in number of users in FinTech market. Here the graph shows that number of users are expected to get increase in digital payments segments and will amount to 255.99 millions. Find a pre designed and impeccable Optimizing Advanced Technology To Gain Competitive Edge Number Of Users In Fintech Market Elements PDF. The templates can ace your presentation without additional effort. You can download these easy to edit presentation templates to make your presentation stand out from others. So, what are you waiting for Download the template from Slidegeeks today and give a unique touch to your presentation.
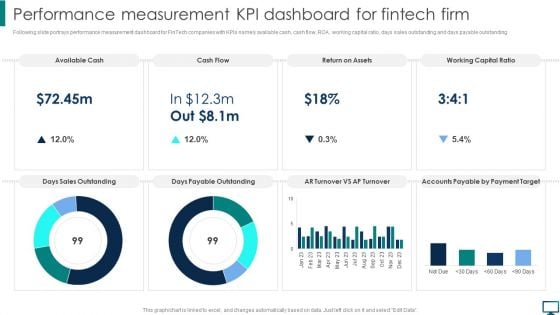
Performance Measurement KPI Dashboard For Fintech Firm Topics PDF
Following slide portrays performance measurement dashboard for FinTech companies with KPIs namely available cash, cash flow, ROA, working capital ratio, days sales outstanding and days payable outstanding. Create an editable Performance Measurement KPI Dashboard For Fintech Firm Topics PDF that communicates your idea and engages your audience. Whether you are presenting a business or an educational presentation, pre designed presentation templates help save time. Performance Measurement KPI Dashboard For Fintech Firm Topics PDF is highly customizable and very easy to edit, covering many different styles from creative to business presentations. Slidegeeks has creative team members who have crafted amazing templates. So, go and get them without any delay.
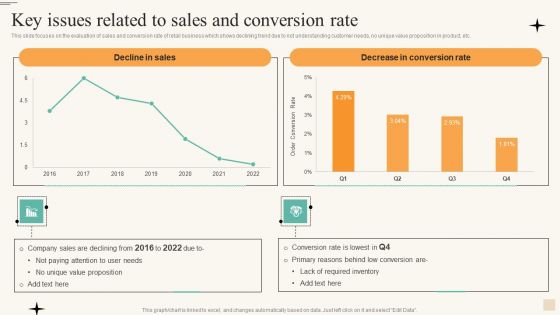
Retail Merchandise Management To Improve Buyer Engagement Key Issues Related Download PDF
This slide focuses on the evaluation of sales and conversion rate of retail business which shows declining trend due to not understanding customer needs, no unique value proposition in product, etc. This Retail Merchandise Management To Improve Buyer Engagement Key Issues Related Download PDF is perfect for any presentation, be it in front of clients or colleagues. It is a versatile and stylish solution for organizing your meetings. The product features a modern design for your presentation meetings. The adjustable and customizable slides provide unlimited possibilities for acing up your presentation. Slidegeeks has done all the homework before launching the product for you. So, do not wait, grab the presentation templates today.
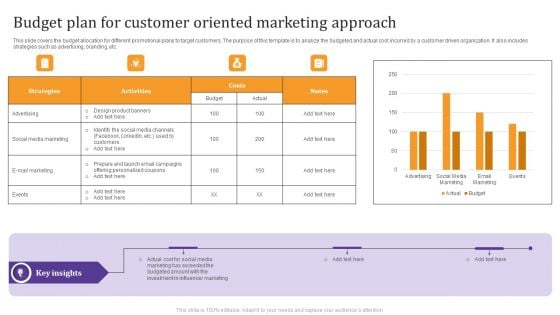
Budget Plan For Customer Oriented Marketing Approach Template PDF
This slide covers the budget allocation for different promotional plans to target customers. The purpose of this template is to analyze the budgeted and actual cost incurred by a customer driven organization. It also includes strategies such as advertising, branding, etc. Showcasing this set of slides titled Budget Plan For Customer Oriented Marketing Approach Template PDF. The topics addressed in these templates are Costs, Strategies, Activities, Advertising. All the content presented in this PPT design is completely editable. Download it and make adjustments in color, background, font etc. as per your unique business setting.
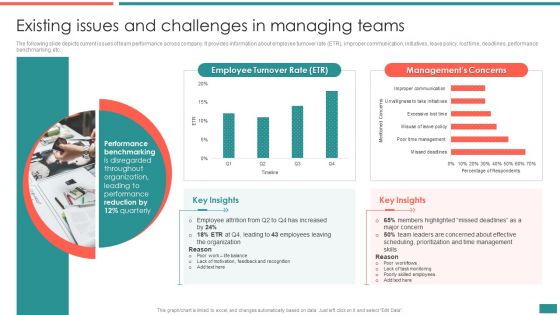
Existing Issues And Challenges In Managing Teams Building Efficient Workplace Performance Information PDF
The following slide depicts current issues of team performance across company. It provides information about employee turnover rate ETR, improper communication, initiatives, leave policy, lost time, deadlines, performance benchmarking, etc.Find a pre-designed and impeccable Existing Issues And Challenges In Managing Teams Building Efficient Workplace Performance Information PDF. The templates can ace your presentation without additional effort. You can download these easy-to-edit presentation templates to make your presentation stand out from others. So, what are you waiting for Download the template from Slidegeeks today and give a unique touch to your presentation.
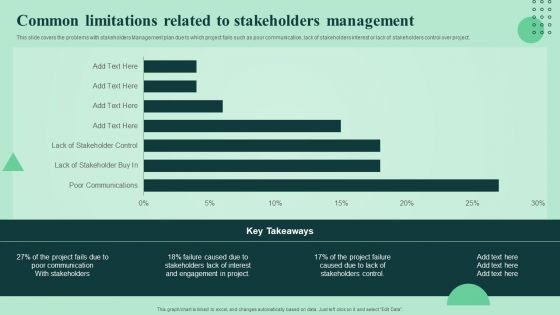
Common Limitations Related To Stakeholders Management Strengthen Manage Relationships Professional PDF
This slide covers the problems with stakeholders Management plan due to which project fails such as poor communication, lack of stakeholders interest or lack of stakeholders control over project. The Common Limitations Related To Stakeholders Management Strengthen Manage Relationships Professional PDF is a compilation of the most recent design trends as a series of slides. It is suitable for any subject or industry presentation, containing attractive visuals and photo spots for businesses to clearly express their messages. This template contains a variety of slides for the user to input data, such as structures to contrast two elements, bullet points, and slides for written information. Slidegeeks is prepared to create an impression.
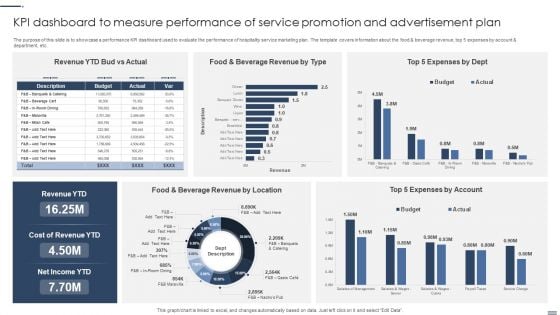
Kpi Dashboard To Measure Performance Of Service Promotion And Advertisement Plan Background PDF
The purpose of this slide is to showcase a performance KPI dashboard used to evaluate the performance of hospitality service marketing plan. The template covers information about the food and beverage revenue, top 5 expenses by account and department, etc. Showcasing this set of slides titled Kpi Dashboard To Measure Performance Of Service Promotion And Advertisement Plan Background PDF. The topics addressed in these templates areLocation, Account, Cost Revenue. All the content presented in this PPT design is completely editable. Download it and make adjustments in color, background, font etc. as per your unique business setting.
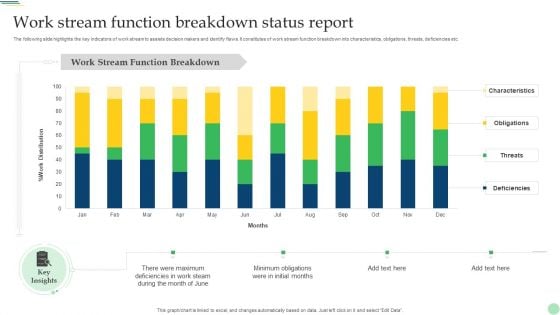
Work Stream Function Breakdown Status Report Demonstration PDF
The following slide highlights the key indicators of work stream to assists decision makers and identify flaws. It constitutes of work stream function breakdown into characteristics, obligations, threats, deficiencies etc. Pitch your topic with ease and precision using this Work Stream Function Breakdown Status Report Demonstration PDF. This layout presents information on Characteristics, Obligations, Threats, Deficiencies. It is also available for immediate download and adjustment. So, changes can be made in the color, design, graphics or any other component to create a unique layout.
Workforce Productivity Tracking Report Dashboard Background PDF
The given below slide depicts the KPIs of work stream status to assess progress and stagnation. It includes elements such as budget, risk, action plan, work stream timeline, highlights etc. Showcasing this set of slides titled Workforce Productivity Tracking Report Dashboard Background PDF. The topics addressed in these templates are High Technology Turnover, Workforce Health Safety Risk, Plan Employee Training. All the content presented in this PPT design is completely editable. Download it and make adjustments in color, background, font etc. as per your unique business setting.
KPI Dashboard For Tracking Supply Chain Costs Industry Analysis Of Food Formats PDF
This slide represents the KPI dashboard to track the multiple cost associated with supply chain in food manufacturing industry. It includes information regarding cash to cash cycle in days, carry cost of inventory along with details of net sales.Find a pre-designed and impeccable KPI Dashboard For Tracking Supply Chain Costs Industry Analysis Of Food Formats PDF. The templates can ace your presentation without additional effort. You can download these easy-to-edit presentation templates to make your presentation stand out from others. So, what are you waiting for Download the template from Slidegeeks today and give a unique touch to your presentation.
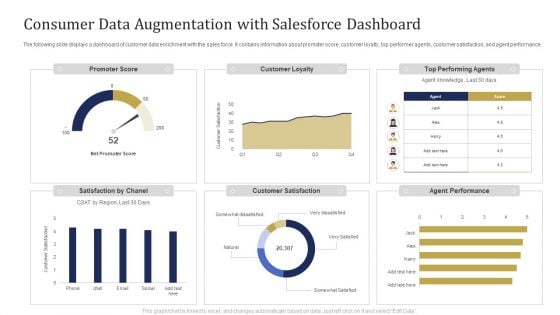
Consumer Data Augmentation With Salesforce Dashboard Ppt Pictures Portrait PDF
The following slide displays a dashboard of customer data enrichment with the sales force. It contains information about promoter score, customer loyalty, top performer agents, customer satisfaction, and agent performance. Showcasing this set of slides titled Consumer Data Augmentation With Salesforce Dashboard Ppt Pictures Portrait PDF. The topics addressed in these templates are Promoter Score, Customer Loyalty, Top Performing Agents. All the content presented in this PPT design is completely editable. Download it and make adjustments in color, background, font etc. as per your unique business setting.
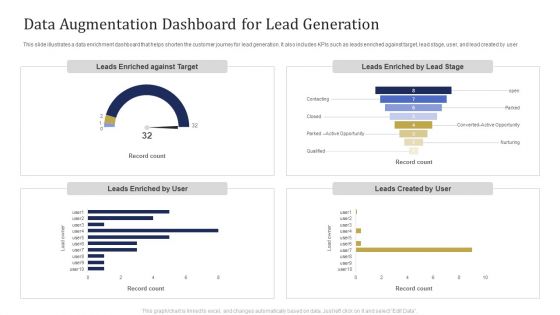
Data Augmentation Dashboard For Lead Generation Ppt Pictures Deck PDF
This slide illustrates a data enrichment dashboard that helps shorten the customer journey for lead generation. It also includes KPIs such as leads enriched against target, lead stage, user, and lead created by user. Showcasing this set of slides titled Data Augmentation Dashboard For Lead Generation Ppt Pictures Deck PDF. The topics addressed in these templates are Leads Enriched against, Target, Leads Enriched, Lead Stage, Leads Created User, Leads Enriched User. All the content presented in this PPT design is completely editable. Download it and make adjustments in color, background, font etc. as per your unique business setting.

 Home
Home