Construction Icons
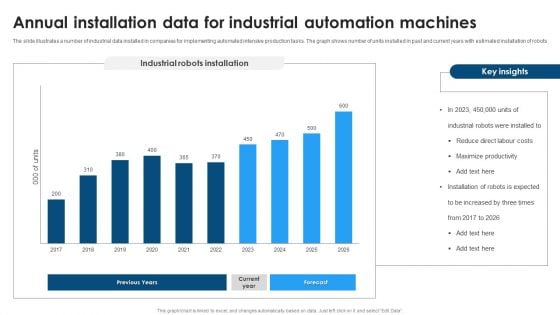
Annual Installation Data For Industrial Automation Machines Microsoft PDF
The slide illustrates a number of industrial data installed in companies for implementing automated intensive production tasks. The graph shows number of units installed in past and current years with estimated installation of robots. Showcasing this set of slides titled Annual Installation Data For Industrial Automation Machines Microsoft PDF. The topics addressed in these templates are Annual Installation Data, Industrial Automation Machines. All the content presented in this PPT design is completely editable. Download it and make adjustments in color, background, font etc. as per your unique business setting.
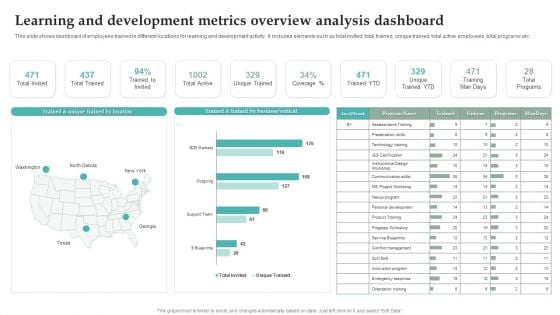
Learning And Development Metrics Overview Analysis Dashboard Graphics PDF
This slide shows dashboard of employees trained in different locations for learning and development activity. It includes elements such as total invited, total trained, unique trained, total active employees, total programs etc. Pitch your topic with ease and precision using this Learning And Development Metrics Overview Analysis Dashboard Graphics PDF. This layout presents information on Unique Trained YTD, Training Man Days, Total Programs. It is also available for immediate download and adjustment. So, changes can be made in the color, design, graphics or any other component to create a unique layout.
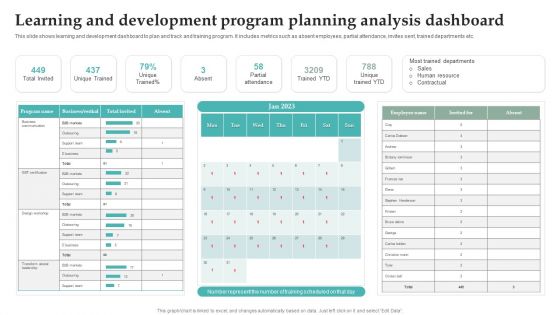
Learning And Development Program Planning Analysis Dashboard Information PDF
This slide shows learning and development dashboard to plan and track and training program. It includes metrics such as absent employees, partial attendance, invites sent, trained departments etc. Showcasing this set of slides titled Learning And Development Program Planning Analysis Dashboard Information PDF. The topics addressed in these templates are Partial Attendance, Trained YTD, Unique Trained YTD. All the content presented in this PPT design is completely editable. Download it and make adjustments in color, background, font etc. as per your unique business setting.
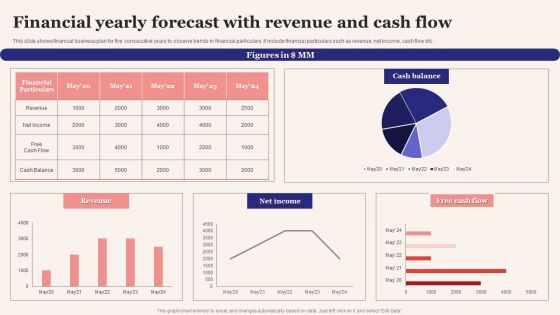
Financial Yearly Forecast With Revenue And Cash Flow Formats PDF
This slide shows financial business plan for five consecutive years to observe trends in financial particulars. It include financial particulars such as revenue, net income, cash flow etc. Pitch your topic with ease and precision using this Financial Yearly Forecast With Revenue And Cash Flow Formats PDF. This layout presents information on Financial Particulars, Cash Balance, Free Cash Flow. It is also available for immediate download and adjustment. So, changes can be made in the color, design, graphics or any other component to create a unique layout.
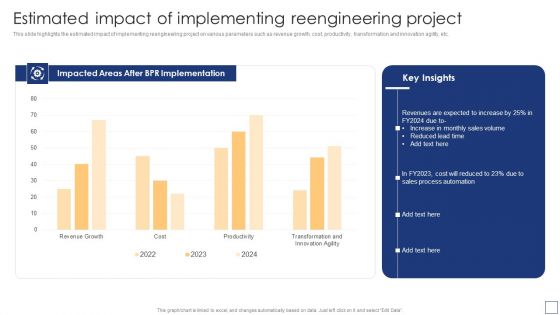
Business Process Redesigning Estimated Impact Of Implementing Reengineering Project Inspiration PDF
This slide highlights the estimated impact of implementing reengineering project on various parameters such as revenue growth, cost, productivity, transformation and innovation agility, etc. Get a simple yet stunning designed Business Process Redesigning Estimated Impact Of Implementing Reengineering Project Inspiration PDF. It is the best one to establish the tone in your meetings. It is an excellent way to make your presentations highly effective. So, download this PPT today from Slidegeeks and see the positive impacts. Our easy-to-edit Business Process Redesigning Estimated Impact Of Implementing Reengineering Project Inspiration PDF can be your go-to option for all upcoming conferences and meetings. So, what are you waiting for Grab this template today.
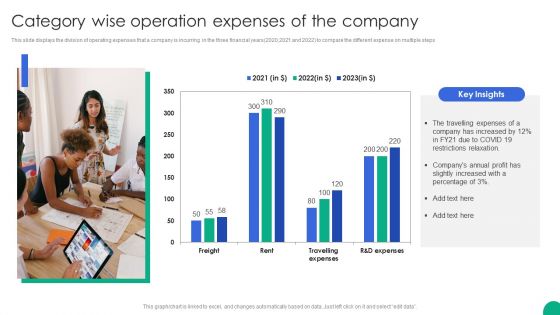
Category Wise Operation Expenses Of The Company Topics PDF
This slide displays the division of operating expenses that a company is incurring in the three financial years 2020,2021 and 2022 to compare the different expense on multiple steps.Pitch your topic with ease and precision using this Category Wise Operation Expenses Of The Company Topics PDF. This layout presents information on Travelling Expenses, Increased Restrictions, Relaxation. It is also available for immediate download and adjustment. So, changes can be made in the color, design, graphics or any other component to create a unique layout.
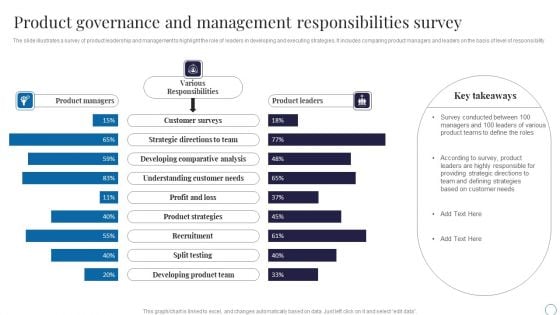
Product Governance And Management Responsibilities Survey Download PDF
The slide illustrates a survey of product leadership and management to highlight the role of leaders in developing and executing strategies. It includes comparing product managers and leaders on the basis of level of responsibility.Showcasing this set of slides titled Product Governance And Management Responsibilities Survey Download PDF. The topics addressed in these templates are Various Responsibilities, Developing Comparative, Developing Product. All the content presented in this PPT design is completely editable. Download it and make adjustments in color, background, font etc. as per your unique business setting.
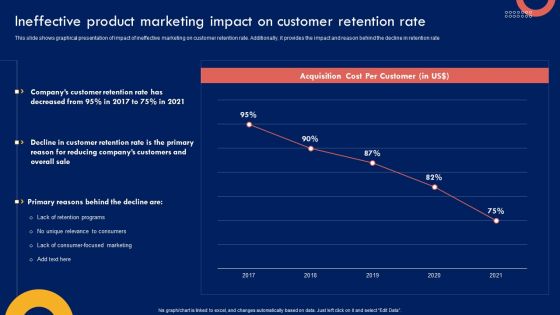
Ineffective Product Marketing Impact On Customer Product Marketing Leadership Ideas PDF
This slide shows graphical presentation of impact of ineffective marketing on customer retention rate. Additionally, it provides the impact and reason behind the decline in retention rate. Create an editable Ineffective Product Marketing Impact On Customer Product Marketing Leadership Ideas PDF that communicates your idea and engages your audience. Whether youre presenting a business or an educational presentation, pre-designed presentation templates help save time. Ineffective Product Marketing Impact On Customer Product Marketing Leadership Ideas PDF is highly customizable and very easy to edit, covering many different styles from creative to business presentations. Slidegeeks has creative team members who have crafted amazing templates. So, go and get them without any delay.
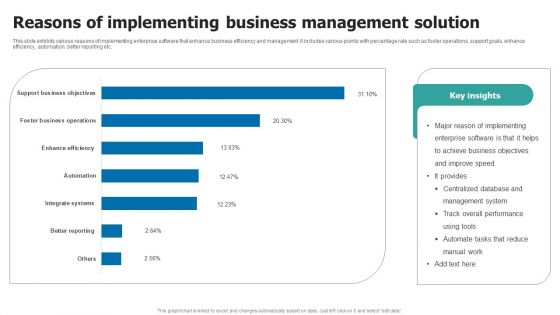
Reasons Of Implementing Business Management Solution Inspiration PDF
This slide exhibits various reasons of implementing enterprise software that enhance business efficiency and management. It includes various points with percentage rate such as foster operations, support goals, enhance efficiency, automation, better reporting etc. Showcasing this set of slides titled Reasons Of Implementing Business Management Solution Inspiration PDF. The topics addressed in these templates are Reasons Of Implementing, Business Management Solution. All the content presented in this PPT design is completely editable. Download it and make adjustments in color, background, font etc. as per your unique business setting.
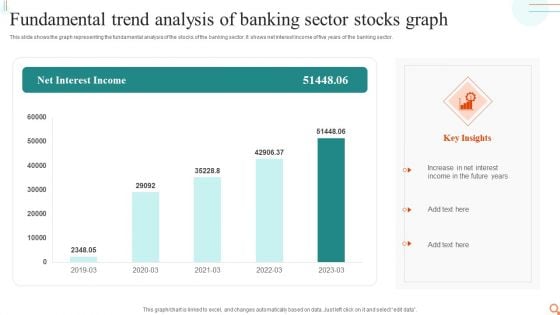
Fundamental Trend Analysis Of Banking Sector Stocks Graph Mockup PDF
This slide shows the graph representing the fundamental analysis of the stocks of the banking sector. It shows net interest income of five years of the banking sector.Pitch your topic with ease and precision using this Fundamental Trend Analysis Of Banking Sector Stocks Graph Mockup PDF. This layout presents information on Increase Interest, Income Future, Interest Income. It is also available for immediate download and adjustment. So, changes can be made in the color, design, graphics or any other component to create a unique layout.
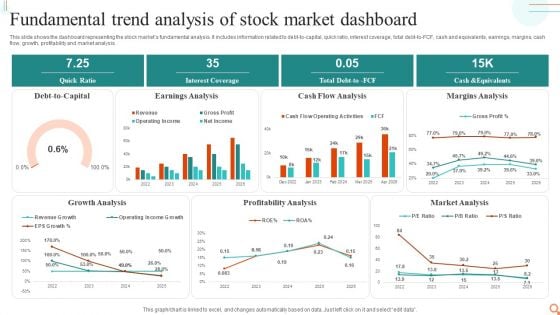
Fundamental Trend Analysis Of Stock Market Dashboard Professional PDF
This slide shows the dashboard representing the stock markets fundamental analysis. It includes information related to debt-to-capital, quick ratio, interest coverage, total debt-to-FCF, cash and equivalents, earnings, margins, cash flow, growth, profitability and market analysis.Showcasing this set of slides titled Fundamental Trend Analysis Of Stock Market Dashboard Professional PDF. The topics addressed in these templates are Earnings Analysis, Cash Flow Analysis, Margins Analysis. All the content presented in this PPT design is completely editable. Download it and make adjustments in color, background, font etc. as per your unique business setting.
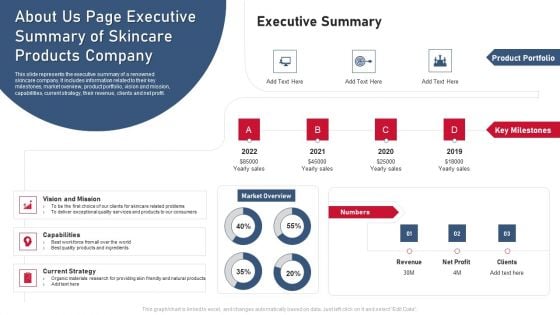
About Us Page Executive Summary Of Skincare Products Company Elements PDF
This slide represents the executive summary of a renowned skincare company. It includes information related to their key milestones, market overview, product portfolio, vision and mission, capabilities, current strategy, their revenue, clients and net profit.Pitch your topic with ease and precision using this About Us Page Executive Summary Of Skincare Products Company Elements PDF. This layout presents information on Choice Clients, Exceptional Quality, Products Ingredients. It is also available for immediate download and adjustment. So, changes can be made in the color, design, graphics or any other component to create a unique layout.
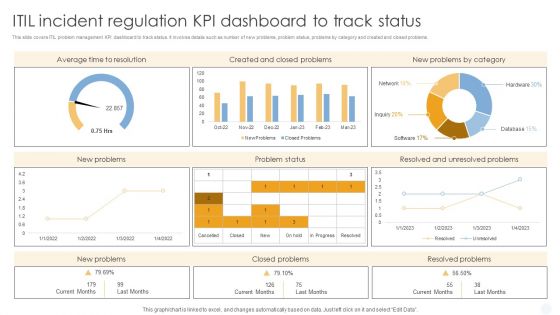
ITIL Incident Regulation Kpi Dashboard To Track Status Mockup PDF
This slide covers ITIL problem management KPI dashboard to track status. It involves details such as number of new problems, problem status, problems by category and created and closed problems.Showcasing this set of slides titled ITIL Incident Regulation Kpi Dashboard To Track Status Mockup PDF. The topics addressed in these templates are Average Time Resolution, Created Problems, Problems Category. All the content presented in this PPT design is completely editable. Download it and make adjustments in color, background, font etc. as per your unique business setting.
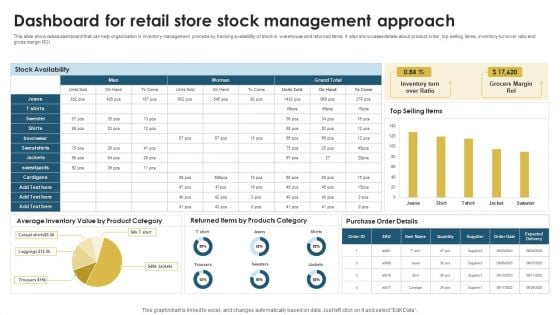
Dashboard For Retail Store Stock Management Approach Portrait PDF
This slide showcases dashboard that can help organization in inventory management process by tracking availability of stock in warehouse and returned items. It also showcases details about product order, top selling items, inventory turnover ratio and gross margin ROI. Showcasing this set of slides titled Dashboard For Retail Store Stock Management Approach Portrait PDF. The topics addressed in these templates are Average Inventory, Product Category, Inventory Turn. All the content presented in this PPT design is completely editable. Download it and make adjustments in color, background, font etc. as per your unique business setting.
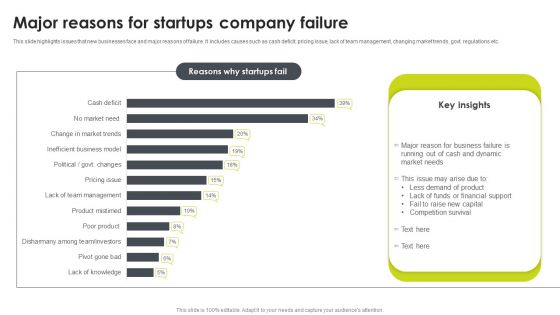
Major Reasons For Startups Company Failure Portrait PDF
This slide highlights issues that new businesses face and major reasons of failure. It includes causes such as cash deficit, pricing issue, lack of team management, changing market trends, govt. regulations etc. Showcasing this set of slides titled Major Reasons For Startups Company Failure Portrait PDF. The topics addressed in these templates are Market, Dynamic, Business Failure. All the content presented in this PPT design is completely editable. Download it and make adjustments in color, background, font etc. as per your unique business setting.
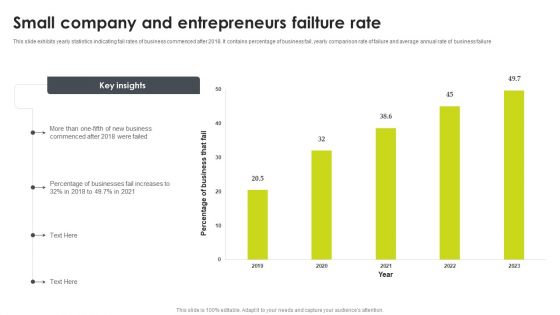
Small Company And Entrepreneurs Failture Rate Summary PDF
This slide exhibits yearly statistics indicating fail rates of business commenced after 2018. It contains percentage of business fail, yearly comparison rate of failure and average annual rate of business failure. Pitch your topic with ease and precision using this Small Company And Entrepreneurs Failture Rate Summary PDF. This layout presents information on Entrepreneurs Failture Rate, Business. It is also available for immediate download and adjustment. So, changes can be made in the color, design, graphics or any other component to create a unique layout.
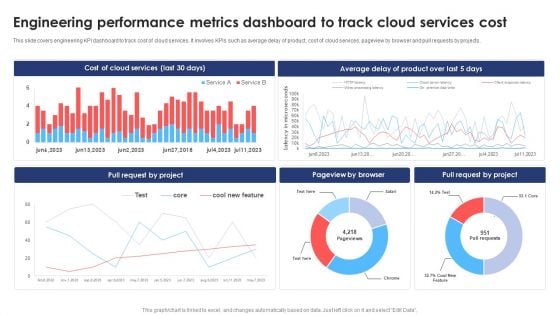
Engineering Performance Metrics Dashboard To Track Cloud Services Cost Clipart PDF
This slide covers engineering KPI dashboard to track cost of cloud services. It involves KPIs such as average delay of product, cost of cloud services, pageview by browser and pull requests by projects. Showcasing this set of slides titled Engineering Performance Metrics Dashboard To Track Cloud Services Cost Clipart PDF. The topics addressed in these templates are Cost Of Cloud Services, Average, Product. All the content presented in this PPT design is completely editable. Download it and make adjustments in color, background, font etc. as per your unique business setting.

Engineering Performance Metrics Dashboard To Track Pull Requests Background PDF
This slide covers engineering KPI dashboard to track pull request. It involves KPIs such as open time of average pull requests, average comment received, revision rounds, frequency of posting pull requests. Pitch your topic with ease and precision using this Engineering Performance Metrics Dashboard To Track Pull Requests Background PDF. This layout presents information on Dashboard Track Pull Requests, Engineering Performance Metrics. It is also available for immediate download and adjustment. So, changes can be made in the color, design, graphics or any other component to create a unique layout.
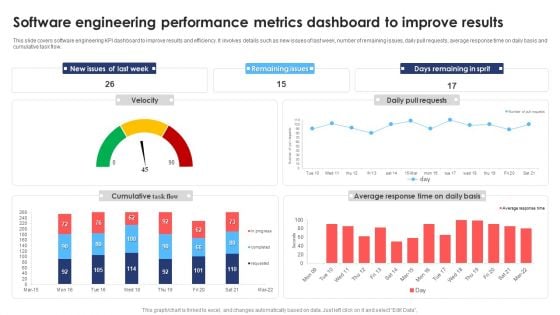
Software Engineering Performance Metrics Dashboard To Improve Results Infographics PDF
This slide covers software engineering KPI dashboard to improve results and efficiency. It involves details such as new issues of last week, number of remaining issues, daily pull requests, average response time on daily basis and cumulative task flow. Pitch your topic with ease and precision using this Software Engineering Performance Metrics Dashboard To Improve Results Infographics PDF. This layout presents information on Software Engineering Performance, Metrics Dashboard Improve Results. It is also available for immediate download and adjustment. So, changes can be made in the color, design, graphics or any other component to create a unique layout.
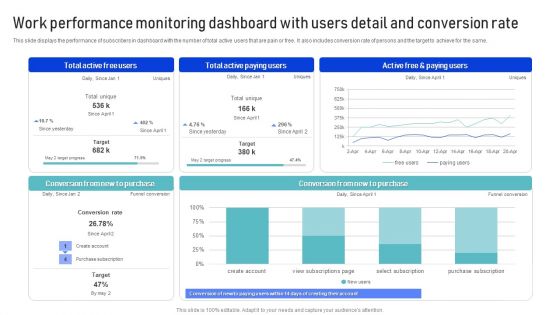
Work Performance Monitoring Dashboard With Users Detail And Conversion Rate Template PDF
This slide displays the performance of subscribers in dashboard with the number of total active users that are pain or free. It also includes conversion rate of persons and the target to achieve for the same. Showcasing this set of slides titled Work Performance Monitoring Dashboard With Users Detail And Conversion Rate Template PDF. The topics addressed in these templates are Purchase, Conversion Rate, Target. All the content presented in this PPT design is completely editable. Download it and make adjustments in color, background, font etc. as per your unique business setting.
Robotic Process Automation Shipping And Logistics Tracking Dashboard With Shipments Clipart PDF
This slide covers Key performance indicators to track the automation system of the company. This dashboard includes Logistics Efficiency Status, delivery time accuracy etc. If your project calls for a presentation, then Slidegeeks is your go-to partner because we have professionally designed, easy-to-edit templates that are perfect for any presentation. After downloading, you can easily edit Robotic Process Automation Shipping And Logistics Tracking Dashboard With Shipments Clipart PDF and make the changes accordingly. You can rearrange slides or fill them with different images. Check out all the handy templates
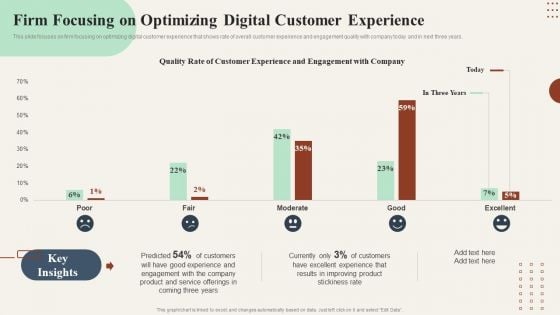
Action Plan To Enhance Firm Focusing On Optimizing Digital Customer Experience Clipart PDF
This slide focuses on firm focusing on optimizing digital customer experience that shows rate of overall customer experience and engagement quality with company today and in next three years. If your project calls for a presentation, then Slidegeeks is your go-to partner because we have professionally designed, easy-to-edit templates that are perfect for any presentation. After downloading, you can easily edit Action Plan To Enhance Firm Focusing On Optimizing Digital Customer Experience Clipart PDF and make the changes accordingly. You can rearrange slides or fill them with different images. Check out all the handy templates
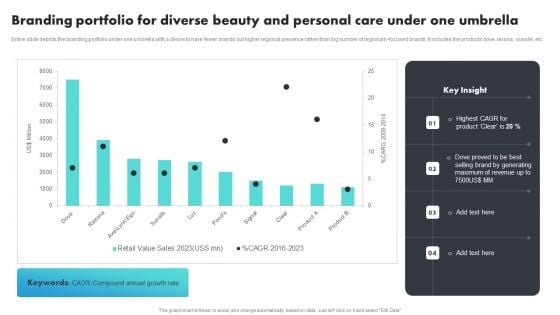
Branding Portfolio For Diverse Beauty And Personal Care Under One Umbrella Ideas PDF
Entire slide depicts the branding portfolio under one umbrella with a desire to have fewer brands but higher regional presence rather than big number of regionally focused brands. It includes the products dove, rexona, sunslik, etc. Showcasing this set of slides titled Branding Portfolio For Diverse Beauty And Personal Care Under One Umbrella Ideas PDF. The topics addressed in these templates are Branding Portfolio For Diverse, Beauty And Personal Care, Under One Umbrella. All the content presented in this PPT design is completely editable. Download it and make adjustments in color, background, font etc. as per your unique business setting.
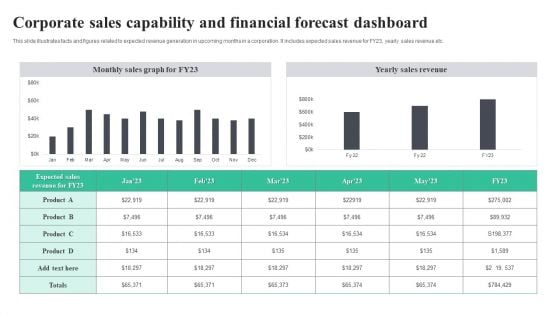
Corporate Sales Capability And Financial Forecast Dashboard Download PDF
This slide illustrates facts and figures related to expected revenue generation in upcoming months in a corporation. It includes expected sales revenue for FY23, yearly sales revenue etc. Showcasing this set of slides titled Corporate Sales Capability And Financial Forecast Dashboard Download PDF. The topics addressed in these templates are Corporate Sales, Capability And Financial, Forecast Dashboard. All the content presented in this PPT design is completely editable. Download it and make adjustments in color, background, font etc. as per your unique business setting
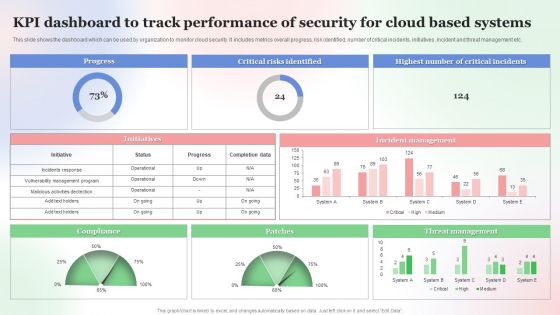
KPI Dashboard To Track Performance Of Security For Cloud Based Systems Clipart PDF
This slide shows the dashboard which can be used by organization to monitor cloud security. It includes metrics overall progress, risk identified, number of critical incidents, initiatives, incident and threat management etc. Showcasing this set of slides titled KPI Dashboard To Track Performance Of Security For Cloud Based Systems Clipart PDF. The topics addressed in these templates are Kpi Dashboard To Track, Performance Of Security, Cloud Based Systems . All the content presented in this PPT design is completely editable. Download it and make adjustments in color, background, font etc. as per your unique business setting.
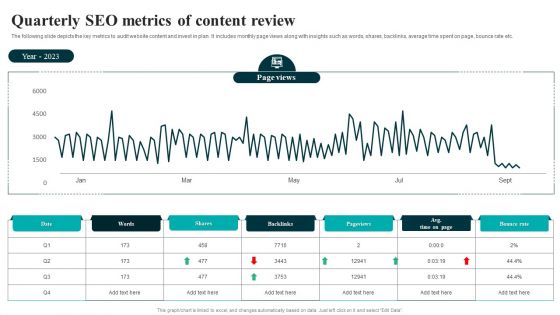
Quarterly SEO Metrics Of Content Review Structure PDF
The following slide depicts the key metrics to audit website content and invest in plan. It includes monthly page views along with insights such as words, shares, backlinks, average time spent on page, bounce rate etc. Pitch your topic with ease and precision using this Quarterly SEO Metrics Of Content Review Structure PDF. This layout presents information on Quarterly SEO, Metrics Of Content Review. It is also available for immediate download and adjustment. So, changes can be made in the color, design, graphics or any other component to create a unique layout.
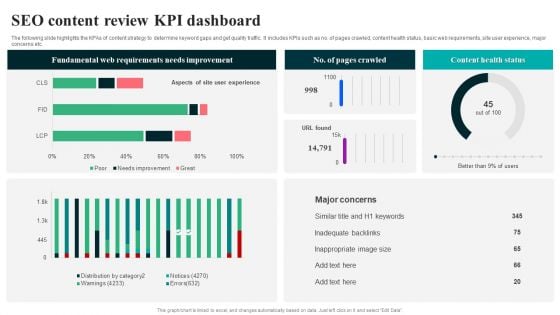
SEO Content Review KPI Dashboard Summary PDF
The following slide highlights the KPAs of content strategy to determine keyword gaps and get quality traffic. It includes KPIs such as no. of pages crawled, content health status, basic web requirements, site user experience, major concerns etc. Pitch your topic with ease and precision using this SEO Content Review KPI Dashboard Summary PDF. This layout presents information on Fundamental Web Requirements, Needs Improvement. It is also available for immediate download and adjustment. So, changes can be made in the color, design, graphics or any other component to create a unique layout.
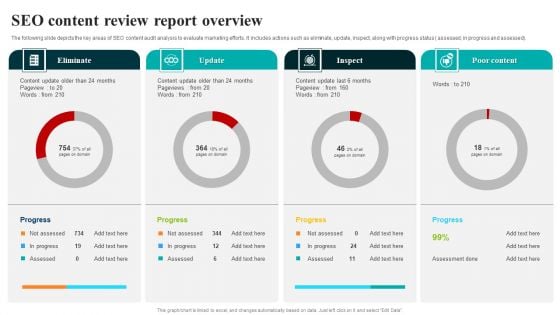
SEO Content Review Report Overview Formats PDF
The following slide depicts the key areas of SEO content audit analysis to evaluate marketing efforts. It includes actions such as eliminate, update, inspect, along with progress status assessed, in progress and assessed. Showcasing this set of slides titled SEO Content Review Report Overview Formats PDF. The topics addressed in these templates are Content Review, Report Overview. All the content presented in this PPT design is completely editable. Download it and make adjustments in color, background, font etc. as per your unique business setting.

Pre Launch Activities Marketing Campaign To Enhance Lead Generation Rules PDF
This slide signifies the pre launch activities marketing platform to increase lead generation rate. It covers information about social media, email, search engine, printed media and influencer marketing. Showcasing this set of slides titled Pre Launch Activities Marketing Campaign To Enhance Lead Generation Rules PDF. The topics addressed in these templates are Marketing Campaign, Enhance Lead Generation. All the content presented in this PPT design is completely editable. Download it and make adjustments in color, background, font etc. as per your unique business setting.

Pre Launch Activities Marketing Platform For Effective Lead Generation Structure PDF
This slide signifies the key statistics for pre launch activities marketing platform to enhance lead generation rate. It covers information about direct mail, trade show, email marketing, telemarketing, blogs and social media. Showcasing this set of slides titled Pre Launch Activities Marketing Platform For Effective Lead Generation Structure PDF. The topics addressed in these templates are Direct Mail Campaign Leads, Compare To Estimated. All the content presented in this PPT design is completely editable. Download it and make adjustments in color, background, font etc. as per your unique business setting.
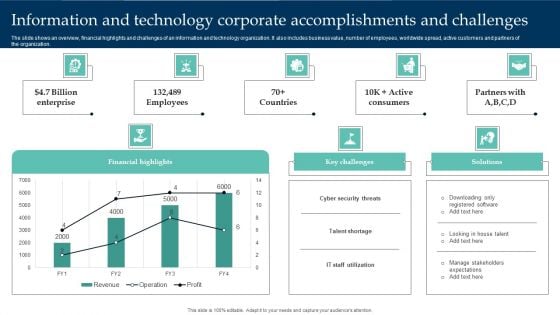
Information And Technology Corporate Accomplishments And Challenges Structure PDF
The slide shows an overview, financial highlights and challenges of an information and technology organization. It also includes business value, number of employees, worldwide spread, active customers and partners of the organization. Pitch your topic with ease and precision using this Information And Technology Corporate Accomplishments And Challenges Structure PDF. This layout presents information on Financial Highlights, Cyber Security Threats, Enterprise. It is also available for immediate download and adjustment. So, changes can be made in the color, design, graphics or any other component to create a unique layout.
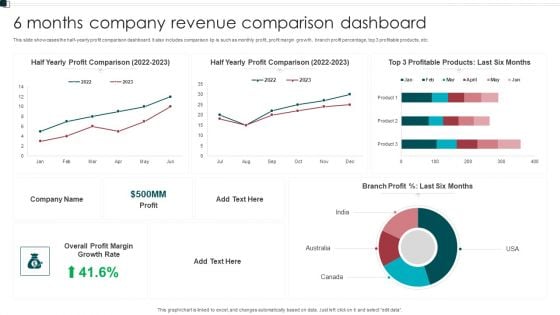
6 Months Company Revenue Comparison Dashboard Graphics PDF
This slide showcases the half yearly profit comparison dashboard. It also includes comparison kp is such as monthly profit, profit margin growth, branch profit percentage, top 3 profitable products, etc. Showcasing this set of slides titled 6 Months Company Revenue Comparison Dashboard Graphics PDF. The topics addressed in these templates are Growth Rate, Overall Profit Margin, Branch Profit. All the content presented in this PPT design is completely editable. Download it and make adjustments in color, background, font etc. as per your unique business setting.
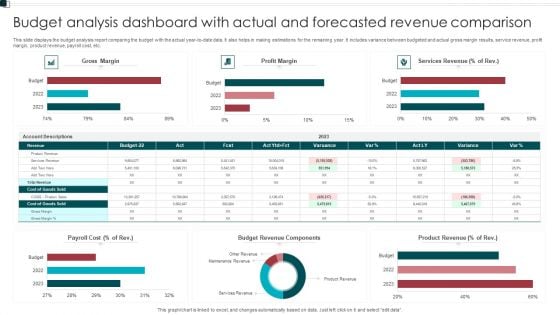
Budget Analysis Dashboard With Actual And Forecasted Revenue Comparison Structure PDF
This slide displays the budget analysis report comparing the budget with the actual year to date data. It also helps in making estimations for the remaining year. It includes variance between budgeted and actual gross margin results, service revenue, profit margin, product revenue, payroll cost, etc. Pitch your topic with ease and precision using this Budget Analysis Dashboard With Actual And Forecasted Revenue Comparison Structure PDF. This layout presents information on Payroll Cost, Budget Revenue Components, Product Revenue. It is also available for immediate download and adjustment. So, changes can be made in the color, design, graphics or any other component to create a unique layout.
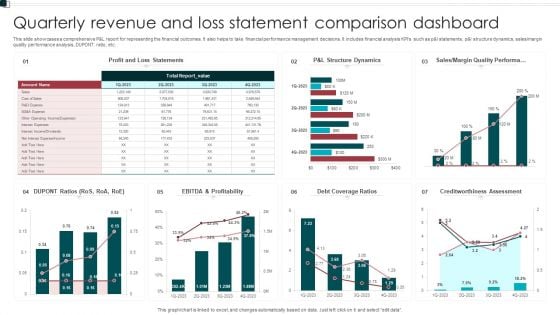
Quarterly Revenue And Loss Statement Comparison Dashboard Portrait PDF
This slide showcases a comprehensive P and L report for representing the financial outcomes. It also helps to take financial performance management decisions. It includes financial analysis KPIs such as p and l statements, p and l structure dynamics, sales or margin quality performance analysis, DUPONT ratio, etc. Showcasing this set of slides titled Quarterly Revenue And Loss Statement Comparison Dashboard Portrait PDF. The topics addressed in these templates are Profitability, Debt Coverage Ratios, Margin Quality Performa. All the content presented in this PPT design is completely editable. Download it and make adjustments in color, background, font etc. as per your unique business setting.
Robotic Process Automation Metrics Dashboard For Tracking Business Return On Investment Information PDF
This slide illustrates KPI Dashboard for measuring time and money saved after RPA deployment. It also include metrics for analysis such as productivity in robot hours, hours saved per process, money saved per process, etc. Pitch your topic with ease and precision using this Robotic Process Automation Metrics Dashboard For Tracking Business Return On Investment Information PDF. This layout presents information on Management, Goal, Productivity. It is also available for immediate download and adjustment. So, changes can be made in the color, design, graphics or any other component to create a unique layout.
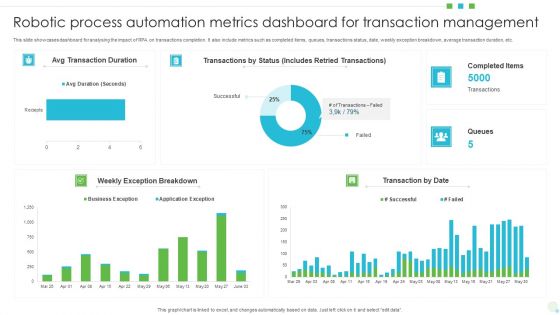
Robotic Process Automation Metrics Dashboard For Transaction Management Ideas PDF
This slide showcases dashboard for analysing the impact of RPA on transactions completion. It also include metrics such as completed items, queues, transactions status, date, weekly exception breakdown, average transaction duration, etc. Showcasing this set of slides titled Robotic Process Automation Metrics Dashboard For Transaction Management Ideas PDF. The topics addressed in these templates are Dashboard For Transaction Management, Robotic Process Automation Metrics. All the content presented in this PPT design is completely editable. Download it and make adjustments in color, background, font etc. as per your unique business setting.
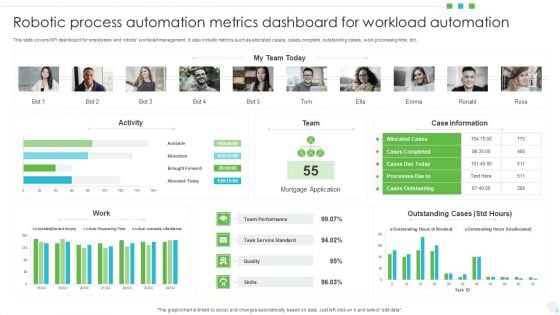
Robotic Process Automation Metrics Dashboard For Workload Automation Mockup PDF
This slide covers KPI dashboard for employees and robots workload management. It also include metrics such as allocated cases, cases complete, outstanding cases, work processing time, etc. Pitch your topic with ease and precision using this Robotic Process Automation Metrics Dashboard For Workload Automation Mockup PDF. This layout presents information on Mortgage Application, Team Performance, Case Information. It is also available for immediate download and adjustment. So, changes can be made in the color, design, graphics or any other component to create a unique layout.
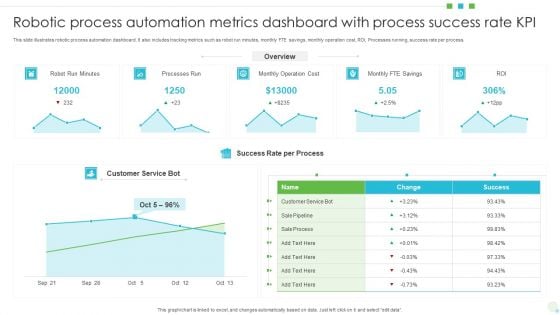
Robotic Process Automation Metrics Dashboard With Process Success Rate KPI Professional PDF
This slide illustrates robotic process automation dashboard. It also includes tracking metrics such as robot run minutes, monthly FTE savings, monthly operation cost, ROI, Processes running, success rate per process. Showcasing this set of slides titled Robotic Process Automation Metrics Dashboard With Process Success Rate KPI Professional PDF The topics addressed in these templates are Processes Run, Monthly Operation Cost, Customer Service Bot. All the content presented in this PPT design is completely editable. Download it and make adjustments in color, background, font etc. as per your unique business setting.
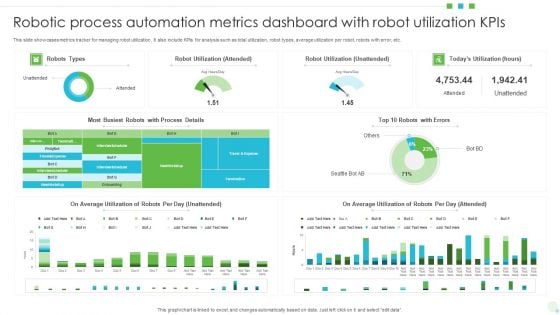
Robotic Process Automation Metrics Dashboard With Robot Utilization Kpis Background PDF
This slide showcases metrics tracker for managing robot utilization. It also include KPIs for analysis such as total utilization, robot types, average utilization per robot, robots with error, etc. Pitch your topic with ease and precision using this Robotic Process Automation Metrics Dashboard With Robot Utilization Kpis Background PDF. This layout presents information on Average Utilization, Robot Utilization, Automation Metrics Dashboard. It is also available for immediate download and adjustment. So, changes can be made in the color, design, graphics or any other component to create a unique layout.
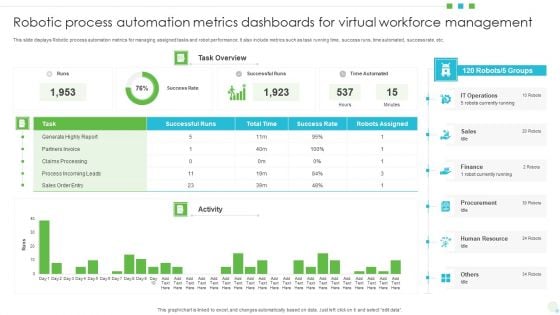
Robotic Process Automation Metrics Dashboards For Virtual Workforce Management Background PDF
This slide displays Robotic process automation metrics for managing assigned tasks and robot performance. It also include metrics such as task running time, success runs, time automated, success rate, etc. Showcasing this set of slides titled Robotic Process Automation Metrics Dashboards For Virtual Workforce Management Background PDF. The topics addressed in these templates are Finance, Sales, Human Resource. All the content presented in this PPT design is completely editable. Download it and make adjustments in color, background, font etc. as per your unique business setting.
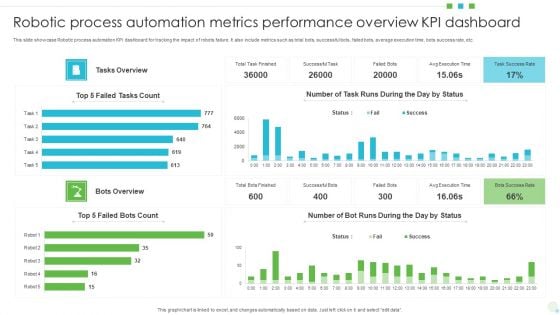
Robotic Process Automation Metrics Performance Overview KPI Dashboard Download PDF
This slide showcase Robotic process automation KPI dashboard for tracking the impact of robots failure. It also include metrics such as total bots, successful bots, failed bots, average execution time, bots success rate, etc. Showcasing this set of slides titled Robotic Process Automation Metrics Performance Overview KPI Dashboard Download PDF. The topics addressed in these templates are Robotic Process Automation, Metrics Performance Overview, Kpi Dashboard. All the content presented in this PPT design is completely editable. Download it and make adjustments in color, background, font etc. as per your unique business setting.
Robotic Process Automation Metrics Tracker With Work Item Statistics Information PDF
This slide covers the RPA dashboard for analysing process data status. It also includes process details such as run success rate, inputs, processing, fail, output, robotic run minutes, total value generated, work items processed. Pitch your topic with ease and precision using this Robotic Process Automation Metrics Tracker With Work Item Statistics Information PDF. This layout presents information on Robotic Process Automation, Metrics Tracker, Work Item Statistics. It is also available for immediate download and adjustment. So, changes can be made in the color, design, graphics or any other component to create a unique layout.
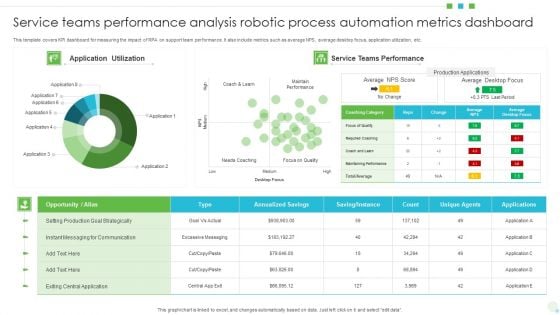
Service Teams Performance Analysis Robotic Process Automation Metrics Dashboard Brochure PDF
This template covers KPI dashboard for measuring the impact of RPA on support team performance. It also include metrics such as average NPS, average desktop focus, application utilization, etc. Showcasing this set of slides titled Service Teams Performance Analysis Robotic Process Automation Metrics Dashboard Brochure PDF. The topics addressed in these templates are Opportunity, Production Goal Strategically, Application Utilization. All the content presented in this PPT design is completely editable. Download it and make adjustments in color, background, font etc. as per your unique business setting.
Cloud Based Computing Analysis Cloud Performance Tracking Dashboard Structure PDF
This slide covers the key performance indicators for tracking performance of the cloud such as violations break down, sources, rules and severity. Get a simple yet stunning designed Cloud Based Computing Analysis Cloud Performance Tracking Dashboard Structure PDF. It is the best one to establish the tone in your meetings. It is an excellent way to make your presentations highly effective. So, download this PPT today from Slidegeeks and see the positive impacts. Our easy-to-edit Cloud Based Computing Analysis Cloud Performance Tracking Dashboard Structure PDF can be your go-to option for all upcoming conferences and meetings. So, what are you waiting for Grab this template today.
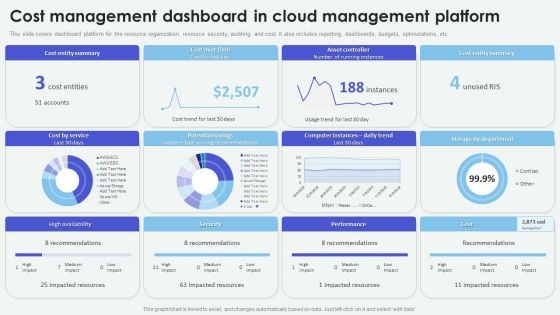
Cloud Based Computing Analysis Cost Management Dashboard In Cloud Management Formats PDF
Slidegeeks is here to make your presentations a breeze with Cloud Based Computing Analysis Cost Management Dashboard In Cloud Management Formats PDF With our easy-to-use and customizable templates, you can focus on delivering your ideas rather than worrying about formatting. With a variety of designs to choose from, youre sure to find one that suits your needs. And with animations and unique photos, illustrations, and fonts, you can make your presentation pop. So whether youre giving a sales pitch or presenting to the board, make sure to check out Slidegeeks first
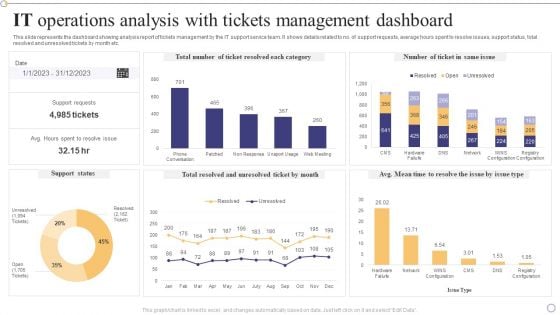
IT Operations Analysis With Tickets Management Dashboard Formats PDF
This slide represents the dashboard showing analysis report of tickets management by the IT support service team. It shows details related to no. of support requests, average hours spent to resolve issues, support status, total resolved and unresolved tickets by month etc.Showcasing this set of slides titled IT Operations Analysis With Tickets Management Dashboard Formats PDF. The topics addressed in these templates are Support Requests, Unresolved Ticket, Support Status. All the content presented in this PPT design is completely editable. Download it and make adjustments in color, background, font etc. as per your unique business setting.
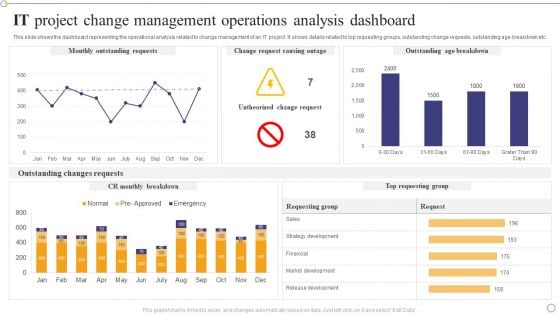
IT Project Change Management Operations Analysis Dashboard Infographics PDF
This slide shows the dashboard representing the operational analysis related to change management of an IT project. It shows details related to top requesting groups, outstanding change requests, outstanding age breakdown etc.Pitch your topic with ease and precision using this IT Project Change Management Operations Analysis Dashboard Infographics PDF. This layout presents information on Outstanding Requests, Outstanding Breakdown, Outstanding Changes. It is also available for immediate download and adjustment. So, changes can be made in the color, design, graphics or any other component to create a unique layout.
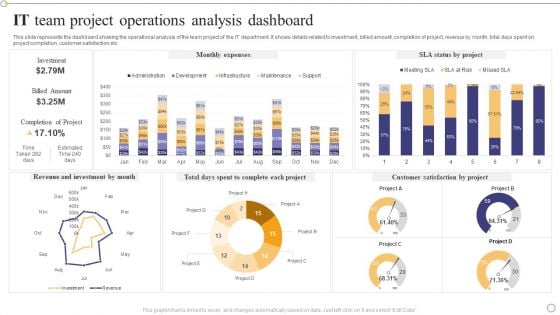
IT Team Project Operations Analysis Dashboard Clipart PDF
This slide represents the dashboard showing the operational analysis of the team project of the IT department. It shows details related to investment, billed amount, completion of project, revenue by month, total days spent on project completion, customer satisfaction etc.Showcasing this set of slides titled IT Team Project Operations Analysis Dashboard Clipart PDF. The topics addressed in these templates are Revenue Investment, Complete Each Project, Customer Satisfaction. All the content presented in this PPT design is completely editable. Download it and make adjustments in color, background, font etc. as per your unique business setting.
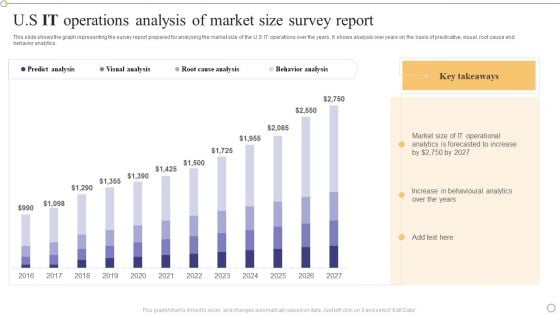
U S IT Operations Analysis Of Market Size Survey Report Guidelines PDF
This slide shows the graph representing the survey report prepared for analysing the market size of the U.S IT operations over the years. It shows analysis over years on the basis of predicative, visual, root cause and behavior analytics. Showcasing this set of slides titled U S IT Operations Analysis Of Market Size Survey Report Guidelines PDF. The topics addressed in these templates are Predict Analysis, Visual Analysis, Behavior Analysis. All the content presented in this PPT design is completely editable. Download it and make adjustments in color, background, font etc. as per your unique business setting.
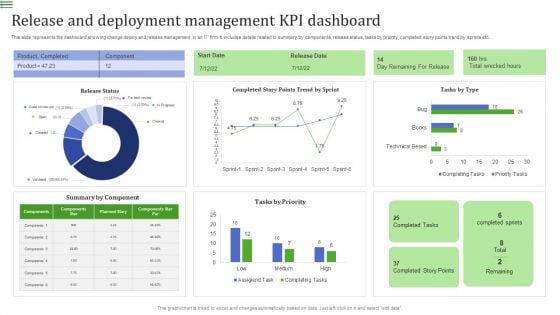
Release And Deployment Management KPI Dashboard Summary PDF
This slide represents the dashboard showing change deploy and release management in an IT firm. It includes details related to summary by components, release status, tasks by priority, completed story points trend by sprints etc.Showcasing this set of slides titled Release And Deployment Management KPI Dashboard Summary PDF. The topics addressed in these templates are Product Completed, Summary Component, Completed Story. All the content presented in this PPT design is completely editable. Download it and make adjustments in color, background, font etc. as per your unique business setting.
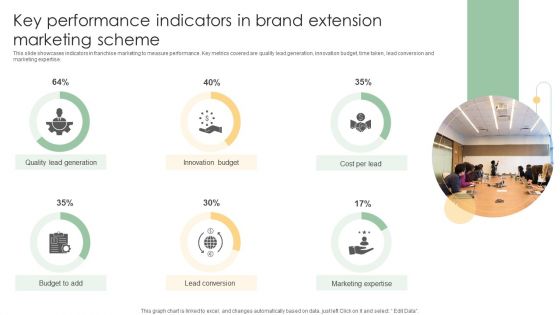
Key Performance Indicators In Brand Extension Marketing Scheme Ideas PDF
This slide showcases indicators in franchise marketing to measure performance. Key metrics covered are quality lead generation, innovation budget, time taken, lead conversion and marketing expertise.Pitch your topic with ease and precision using this Key Performance Indicators In Brand Extension Marketing Scheme Ideas PDF. This layout presents information on Quality Lead Generation, Innovation Budget, Lead Conversion. It is also available for immediate download and adjustment. So, changes can be made in the color, design, graphics or any other component to create a unique layout.

Digital Marketing Campaign Performance Monitoring Dashboard Pictures PDF
This slide represents the dashboard for measuring and monitoring the performance of digital marketing campaign. It includes information related to the advertisement cost, cost per conversion, no. of clicks, conversion rate, impressions, cost per click, click through rate and cost per thousand impressions of the project.Pitch your topic with ease and precision using this Digital Marketing Campaign Performance Monitoring Dashboard Pictures PDF. This layout presents information on Conversion Rate, Per Conversion, Cost Per Thousand. It is also available for immediate download and adjustment. So, changes can be made in the color, design, graphics or any other component to create a unique layout.
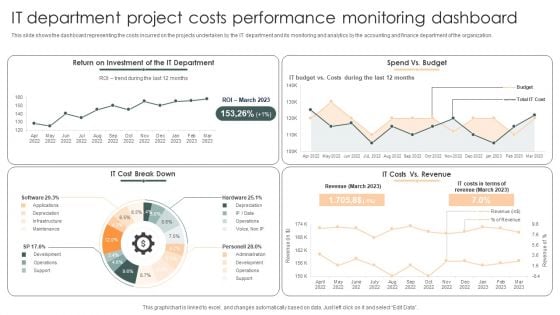
IT Department Project Costs Performance Monitoring Dashboard Demonstration PDF
This slide shows the dashboard representing the costs incurred on the projects undertaken by the IT department and its monitoring and analytics by the accounting and finance department of the organization.Showcasing this set of slides titled IT Department Project Costs Performance Monitoring Dashboard Demonstration PDF. The topics addressed in these templates are Return Investment, Cost Break, Costs Revenue. All the content presented in this PPT design is completely editable. Download it and make adjustments in color, background, font etc. as per your unique business setting.

Manufactured Products Sales Performance Monitoring Dashboard Information PDF
This slide shows the dashboard the data related to the sales performance of the products manufactured by the organization in order to effectively measure and monitor the performance of the sales team. It shows details related to revenue generated and units sold etc.Pitch your topic with ease and precision using this Manufactured Products Sales Performance Monitoring Dashboard Information PDF. This layout presents information on Monthly Revenue, Manufactured Products, Sales Performance Monitoring. It is also available for immediate download and adjustment. So, changes can be made in the color, design, graphics or any other component to create a unique layout.
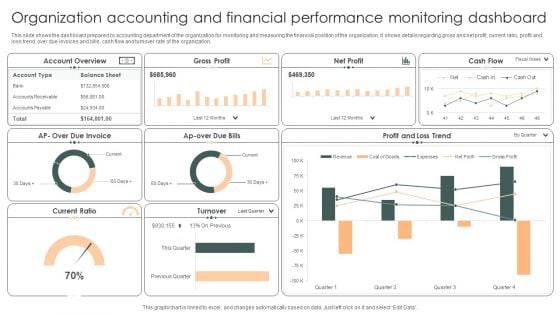
Organization Accounting And Financial Performance Monitoring Dashboard Pictures PDF
This slide shows the dashboard prepared by accounting department of the organization for monitoring and measuring the financial position of the organization. It shows details regarding gross and net profit, current ratio, profit and loss trend, over due invoices and bills, cash flow and turnover rate of the organization.Showcasing this set of slides titled Organization Accounting And Financial Performance Monitoring Dashboard Pictures PDF. The topics addressed in these templates are Account Overview, Due Invoice, Loss Trend. All the content presented in this PPT design is completely editable. Download it and make adjustments in color, background, font etc. as per your unique business setting.
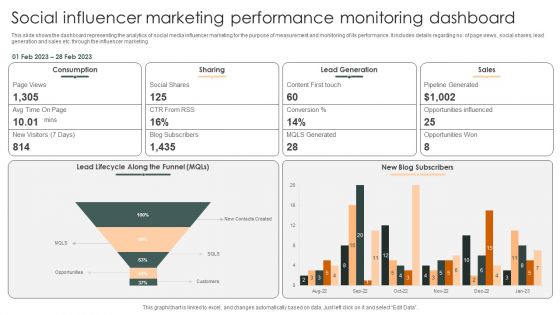
Social Influencer Marketing Performance Monitoring Dashboard Slides PDF
This slide shows the dashboard representing the analytics of social media influencer marketing for the purpose of measurement and monitoring of its performance. It includes details regarding no. of page views, social shares, lead generation and sales etc. through the influencer marketing.Pitch your topic with ease and precision using this Social Influencer Marketing Performance Monitoring Dashboard Slides PDF. This layout presents information on Lead Generation, Pipeline Generated, Opportunities Influenced. It is also available for immediate download and adjustment. So, changes can be made in the color, design, graphics or any other component to create a unique layout.
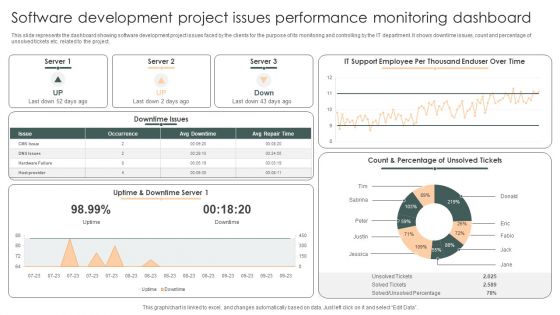
Software Development Project Issues Performance Monitoring Dashboard Structure PDF
This slide represents the dashboard showing software development project issues faced by the clients for the purpose of its monitoring and controlling by the IT department. It shows downtime issues, count and percentage of unsolved tickets etc. related to the project.Showcasing this set of slides titled Software Development Project Issues Performance Monitoring Dashboard Structure PDF. The topics addressed in these templates are Downtime Issues, Count Percentage, Unsolved Percentage. All the content presented in this PPT design is completely editable. Download it and make adjustments in color, background, font etc. as per your unique business setting.

Website Elements To Enhance Purchasing Experience For Customers Summary PDF
The slide shows various website elements that develop a great purchasing experience for a customer. It includes features like clear product images, product reviews, product description, easy checkout process, easy search, simple navigation, payment options, product videos, etc. Showcasing this set of slides titled Website Elements To Enhance Purchasing Experience For Customers Summary PDF. The topics addressed in these templates are Website Elements To Enhance, Purchasing Experience For Customers. All the content presented in this PPT design is completely editable. Download it and make adjustments in color, background, font etc. as per your unique business setting.
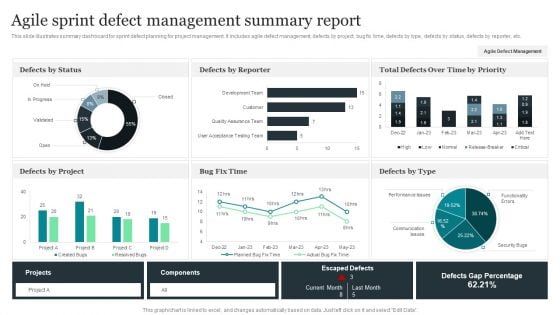
Agile Sprint Defect Management Summary Report Structure PDF
This slide illustrates summary dashboard for sprint defect planning for project management. It includes agile defect management, defects by project, bug fix time, defects by type, defects by status, defects by reporter, etc. Showcasing this set of slides titled Agile Sprint Defect Management Summary Report Structure PDF. The topics addressed in these templates are Defects By Status, Defects By Reporter, Bug Fix Time. All the content presented in this PPT design is completely editable. Download it and make adjustments in color, background, font etc. as per your unique business setting.
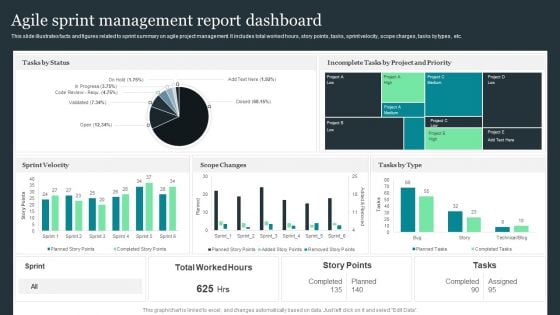
Agile Sprint Management Report Dashboard Pictures PDF
This slide illustrates facts and figures related to sprint summary on agile project management. It includes total worked hours, story points, tasks, sprint velocity, scope charges, tasks by types, etc. Pitch your topic with ease and precision using this Agile Sprint Management Report Dashboard Pictures PDF. This layout presents information on Tasks By Status, Sprint Velocity, Scope Changes. It is also available for immediate download and adjustment. So, changes can be made in the color, design, graphics or any other component to create a unique layout.
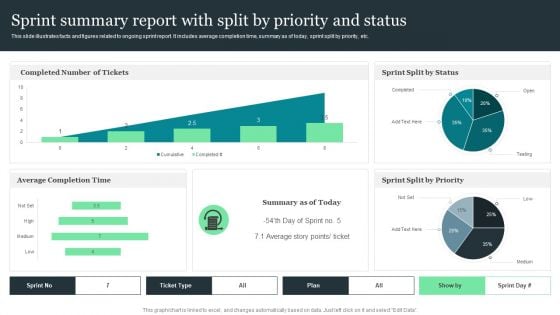
Sprint Summary Report With Split By Priority And Status Brochure PDF
This slide illustrates facts and figures related to ongoing sprint report. It includes average completion time, summary as of today, sprint split by priority, etc. Showcasing this set of slides titled Sprint Summary Report With Split By Priority And Status Brochure PDF. The topics addressed in these templates are Average Completion Time, Sprint Split By Priority, Sprint Split By Status. All the content presented in this PPT design is completely editable. Download it and make adjustments in color, background, font etc. as per your unique business setting.
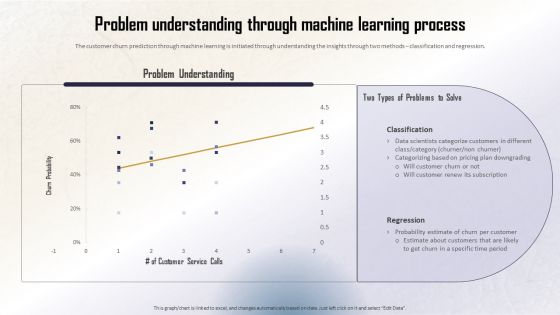
Identifying Direct And Indirect Problem Understanding Through Machine Learning Summary PDF
The customer churn prediction through machine learning is initiated through understanding the insights through two methods classification and regression. The Identifying Direct And Indirect Problem Understanding Through Machine Learning Summary PDF is a compilation of the most recent design trends as a series of slides. It is suitable for any subject or industry presentation, containing attractive visuals and photo spots for businesses to clearly express their messages. This template contains a variety of slides for the user to input data, such as structures to contrast two elements, bullet points, and slides for written information. Slidegeeks is prepared to create an impression.
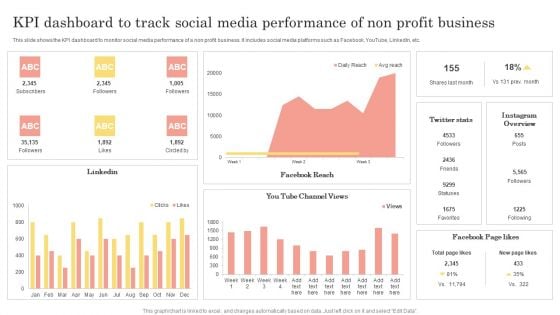
Kpi Dashboard To Track Social Media Performance Of Non Profit Business Portrait PDF
This slide shows the KPI dashboard to monitor social media performance of a non profit business. It includes social media platforms such as Facebook, YouTube, LinkedIn, etc. Showcasing this set of slides titled Kpi Dashboard To Track Social Media Performance Of Non Profit Business Portrait PDF. The topics addressed in these templates are Channel Views, Instagram Overview, Favorites. All the content presented in this PPT design is completely editable. Download it and make adjustments in color, background, font etc. as per your unique business setting.
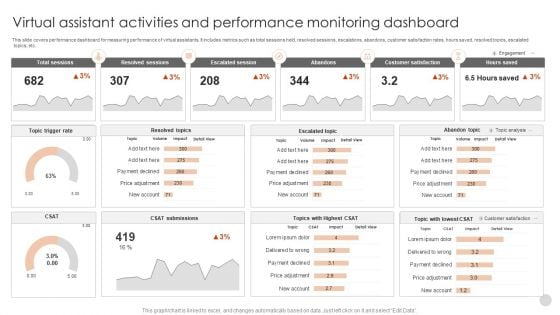
Virtual Assistant Activities And Performance Monitoring Dashboard Guidelines PDF
This slide covers performance dashboard for measuring performance of virtual assistants. It includes metrics such as total sessions held, resolved sessions, escalations, abandons, customer satisfaction rates, hours saved, resolved topics, escalated topics, etc.Pitch your topic with ease and precision using this Virtual Assistant Activities And Performance Monitoring Dashboard Guidelines PDF. This layout presents information on Total Sessions, Resolved Sessions, Escalated Session. It is also available for immediate download and adjustment. So, changes can be made in the color, design, graphics or any other component to create a unique layout.
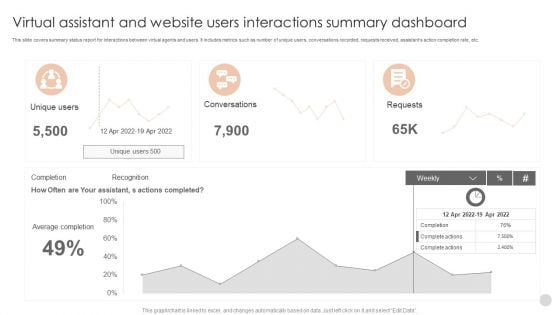
Virtual Assistant And Website Users Interactions Summary Dashboard Formats PDF
This slide covers summary status report for interactions between virtual agents and users. It includes metrics such as number of unique users, conversations recorded, requests received, assistants action completion rate, etc.Showcasing this set of slides titled Virtual Assistant And Website Users Interactions Summary Dashboard Formats PDF. The topics addressed in these templates are Actions Completed, Conversations, Complete Actions. All the content presented in this PPT design is completely editable. Download it and make adjustments in color, background, font etc. as per your unique business setting.
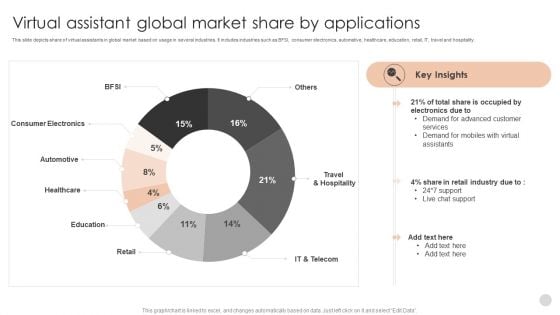
Virtual Assistant Global Market Share By Applications Infographics PDF
This slide depicts share of virtual assistants in global market based on usage in several industries. It includes industries such as BFSI, consumer electronics, automative, healthcare, education, retail, IT, travel and hospitality. Showcasing this set of slides titled Virtual Assistant Global Market Share By Applications Infographics PDF. The topics addressed in these templates are Consumer Electronics, Automotive, Demand Advanced. All the content presented in this PPT design is completely editable. Download it and make adjustments in color, background, font etc. as per your unique business setting.
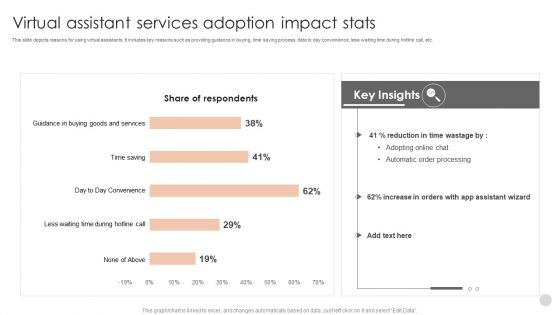
Virtual Assistant Services Adoption Impact Stats Structure PDF
This slide depicts reasons for using virtual assistants. It includes key reasons such as providing guidance in buying, time saving process, data to day convenience, less waiting time during hotline call, etc.Pitch your topic with ease and precision using this Virtual Assistant Services Adoption Impact Stats Structure PDF. This layout presents information on Automatic Order Processing, Assistant Wizard, Guidance Buying. It is also available for immediate download and adjustment. So, changes can be made in the color, design, graphics or any other component to create a unique layout.
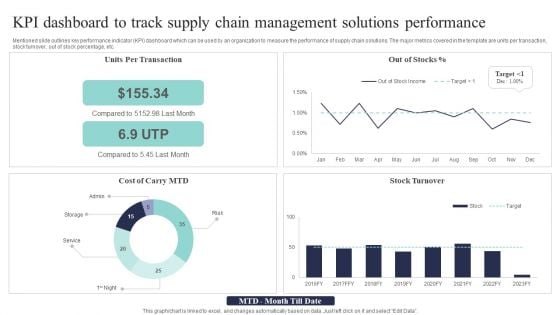
KPI Dashboard To Track Supply Chain Management Solutions Performance Background PDF
Mentioned slide outlines key performance indicator KPI dashboard which can be used by an organization to measure the performance of supply chain solutions. The major metrics covered in the template are units per transaction, stock turnover, out of stock percentage, etc. Pitch your topic with ease and precision using this KPI Dashboard To Track Supply Chain Management Solutions Performance Background PDF. This layout presents information on Per Transaction, Compared Last, Stock Turnover. It is also available for immediate download and adjustment. So, changes can be made in the color, design, graphics or any other component to create a unique layout.
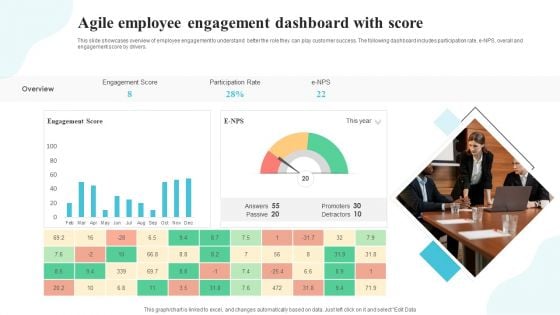
Agile Employee Engagement Dashboard With Score Introduction PDF
This slide showcases overview of employee engagement to understand better the role they can play customer success. The following dashboard includes participation rate, e-NPS, overall and engagement score by drivers. Showcasing this set of slides titled Agile Employee Engagement Dashboard With Score Introduction PDF. The topics addressed in these templates are Agile Employee Engagement, Dashboard With Score. All the content presented in this PPT design is completely editable. Download it and make adjustments in color, background, font etc. as per your unique business setting.

Employee Performance Assessment Survey Conclusion Portrait PDF
This slide illustrates the statistical results of a survey conducted by an organization to assess an employee on the basis of their soft skills to make required improvements. The skills include communication, organization, teamwork, and so on. Showcasing this set of slides titled Employee Performance Assessment Survey Conclusion Portrait PDF. The topics addressed in these templates are Teamwork, Organization, Communication All the content presented in this PPT design is completely editable. Download it and make adjustments in color, background, font etc. as per your unique business setting.
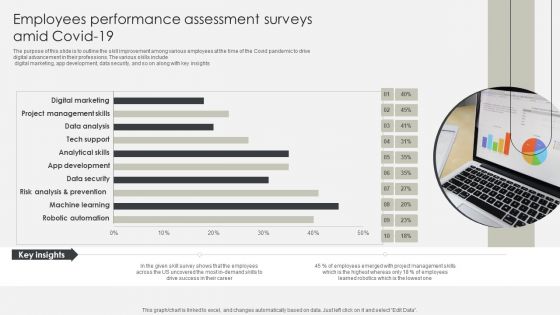
Employees Performance Assessment Surveys Amid Covid 19 Information PDF
The purpose of this slide is to outline the skill improvement among various employees at the time of the Covid pandemic to drive digital advancement in their professions. The various skills include digital marketing, app development, data security, and so on along with key insights. Showcasing this set of slides titled Employees Performance Assessment Surveys Amid Covid 19 Information PDF. The topics addressed in these templates are Skill Survey, Employees, Project Management. All the content presented in this PPT design is completely editable. Download it and make adjustments in color, background, font etc. as per your unique business setting.
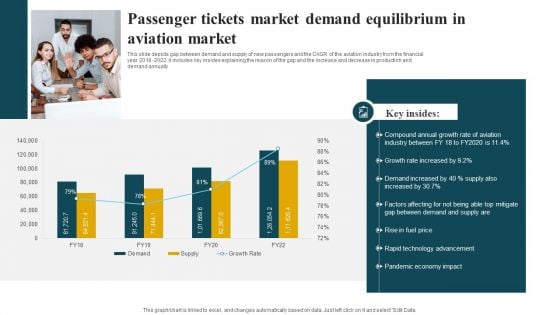
Passenger Tickets Market Demand Equilibrium In Aviation Market Guidelines PDF
This slide depicts gap between demand and supply of new passengers and the CAGR of the aviation industry from the financial year 2018 2022. it includes key insides explaining the reason of the gap and the increase and decrease in production and demand annually. Showcasing this set of slides titled Passenger Tickets Market Demand Equilibrium In Aviation Market Guidelines PDF. The topics addressed in these templates are Growth Rate, Industry, Demand. All the content presented in this PPT design is completely editable. Download it and make adjustments in color, background, font etc. as per your unique business setting.
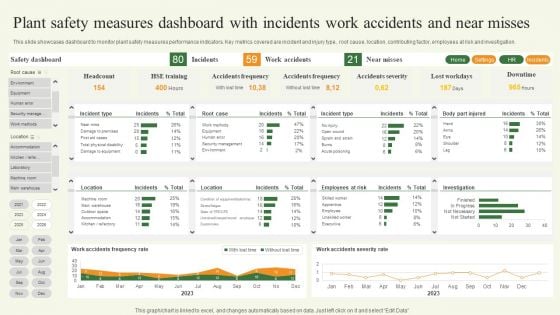
Plant Safety Measures Dashboard With Incidents Work Accidents And Near Misses Template PDF
This slide showcases dashboard to monitor plant safety measures performance indicators. Key metrics covered are incident and injury type, root cause, location, contributing factor, employees at risk and investigation. Pitch your topic with ease and precision using this Plant Safety Measures Dashboard With Incidents Work Accidents And Near Misses Template PDF. This layout presents information on Plant Safety Measures Dashboard, Incidents Work Accidents. It is also available for immediate download and adjustment. So, changes can be made in the color, design, graphics or any other component to create a unique layout.
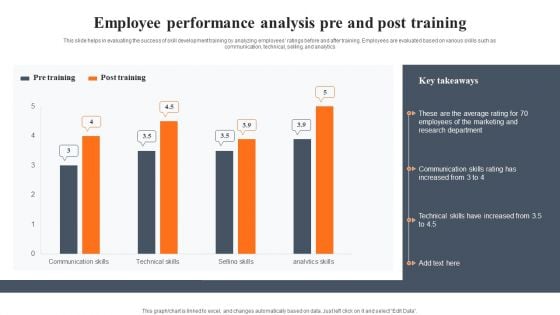
Employee Performance Analysis Pre And Post Training Information PDF
This slide helps in evaluating the success of skill development training by analyzing employees ratings before and after training. Employees are evaluated based on various skills such as communication, technical, selling, and analytics. Showcasing this set of slides titled Employee Performance Analysis Pre And Post Training Information PDF. The topics addressed in these templates are Average, Marketing, Employees. All the content presented in this PPT design is completely editable. Download it and make adjustments in color, background, font etc. as per your unique business setting.
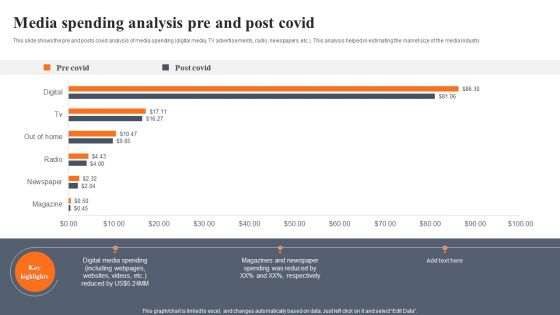
Media Spending Analysis Pre And Post Covid Elements PDF
This slide shows the pre and posts covid analysis of media spending digital media, TV advertisements, radio, newspapers, etc. This analysis helped in estimating the market size of the media industry. Pitch your topic with ease and precision using this Media Spending Analysis Pre And Post Covid Elements PDF. This layout presents information on Media Spending Analysis, Pre And Post Covid. It is also available for immediate download and adjustment. So, changes can be made in the color, design, graphics or any other component to create a unique layout.
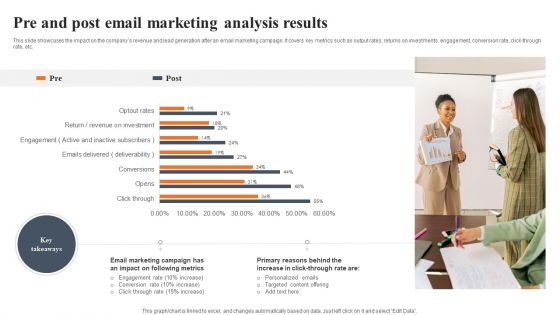
Pre And Post Email Marketing Analysis Results Slides PDF
This slide showcases the impact on the companys revenue and lead generation after an email marketing campaign. It covers key metrics such as output rates, returns on investments, engagement, conversion rate, click through rate, etc. Pitch your topic with ease and precision using this Pre And Post Email Marketing Analysis Results Slides PDF. This layout presents information on Email Marketing Campaign, Following Metrics, Targeted Content Offering. It is also available for immediate download and adjustment. So, changes can be made in the color, design, graphics or any other component to create a unique layout.
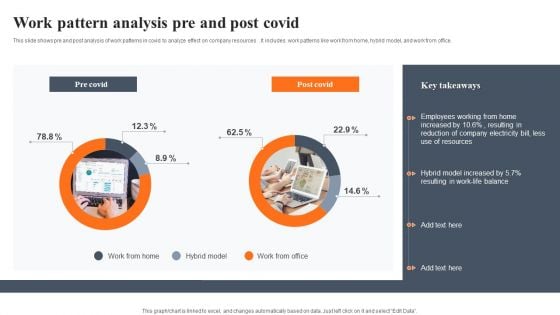
Work Pattern Analysis Pre And Post Covid Pictures PDF
This slide shows pre and post analysis of work patterns in covid to analyze effect on company resources . It includes work patterns like work from home, hybrid model, and work from office. Pitch your topic with ease and precision using this Work Pattern Analysis Pre And Post Covid Pictures PDF. This layout presents information on Work Pattern Analysis, Pre And Post Covid. It is also available for immediate download and adjustment. So, changes can be made in the color, design, graphics or any other component to create a unique layout.
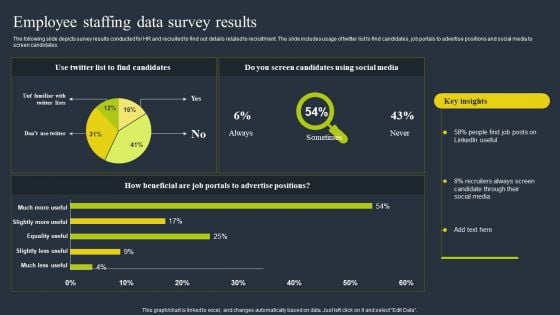
Employee Staffing Data Survey Results Mockup PDF
The following slide depicts survey results conducted for HR and recruited to find out details related to recruitment. The slide includes usage of twitter list to find candidates, job portals to advertise positions and social media to screen candidates. Showcasing this set of slides titled Employee Staffing Data Survey Results Mockup PDF. The topics addressed in these templates are Social Media, Recruiters, Advertise. All the content presented in this PPT design is completely editable. Download it and make adjustments in color, background, font etc. as per your unique business setting.
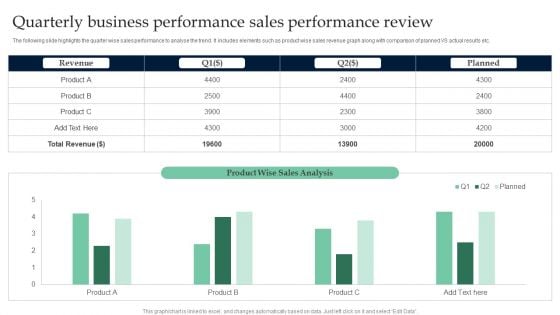
Quarterly Business Performance Sales Performance Review Clipart PDF
The following slide highlights the quarter wise sales performance to analyse the trend. It includes elements such as product wise sales revenue graph along with comparison of planned VS actual results etc. Showcasing this set of slides titled Quarterly Business Performance Sales Performance Review Clipart PDF. The topics addressed in these templates are Quarterly Business, Performance Sales Performance. All the content presented in this PPT design is completely editable. Download it and make adjustments in color, background, font etc. as per your unique business setting.
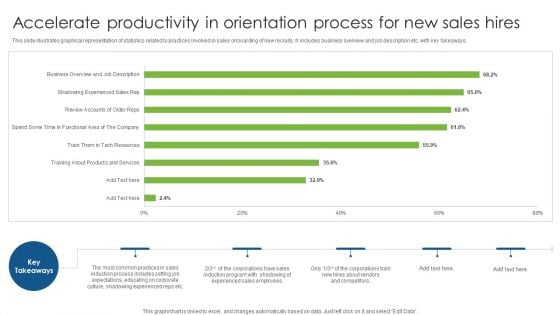
Accelerate Productivity In Orientation Process For New Sales Hires Structure PDF
This slide illustrates graphical representation of statistics related to practices involved in sales onboarding of new recruits. It includes business overview and job description etc. with key takeaways. Pitch your topic with ease and precision using this Accelerate Productivity In Orientation Process For New Sales Hires Structure PDF. This layout presents information on Accelerate Productivity In Orientation, Process For New, Sales Hires. It is also available for immediate download and adjustment. So, changes can be made in the color, design, graphics or any other component to create a unique layout.
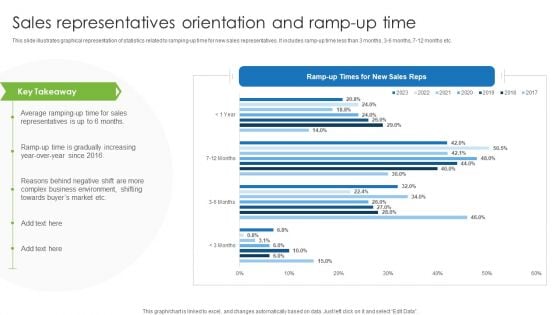
Sales Representatives Orientation And Ramp Up Time Summary PDF
This slide illustrates graphical representation of statistics related to ramping up time for new sales representatives. It includes ramp up time less than 3 months, 3 6 months, 7 12 months etc. Pitch your topic with ease and precision using this Sales Representatives Orientation And Ramp Up Time Summary PDF. This layout presents information on Sales Representatives Orientation, Ramp Up Time. It is also available for immediate download and adjustment. So, changes can be made in the color, design, graphics or any other component to create a unique layout.
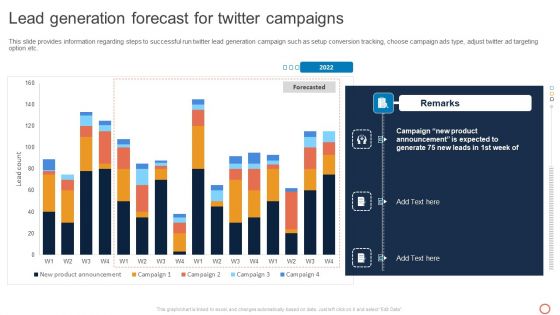
Leveraging Twitter For Social Lead Generation Forecast For Twitter Campaigns Download PDF
This slide provides information regarding steps to successful run twitter lead generation campaign such as setup conversion tracking, choose campaign ads type, adjust twitter ad targeting option etc. If your project calls for a presentation, then Slidegeeks is your go-to partner because we have professionally designed, easy-to-edit templates that are perfect for any presentation. After downloading, you can easily edit Leveraging Twitter For Social Lead Generation Forecast For Twitter Campaigns Download PDF and make the changes accordingly. You can rearrange slides or fill them with different images. Check out all the handy templates
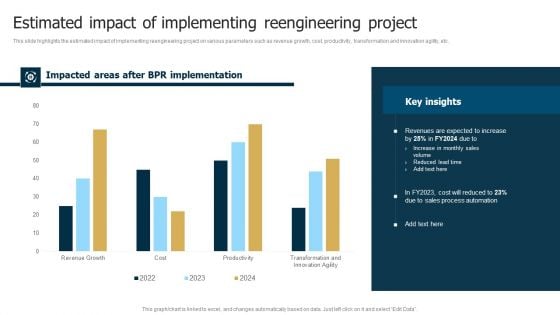
Business Restructuring Process Estimated Impact Of Implementing Reengineering Microsoft PDF
This slide highlights the estimated impact of implementing reengineering project on various parameters such as revenue growth, cost, productivity, transformation and innovation agility, etc. Get a simple yet stunning designed Business Restructuring Process Estimated Impact Of Implementing Reengineering Microsoft PDF. It is the best one to establish the tone in your meetings. It is an excellent way to make your presentations highly effective. So, download this PPT today from Slidegeeks and see the positive impacts. Our easy-to-edit Business Restructuring Process Estimated Impact Of Implementing Reengineering Microsoft PDF can be your go-to option for all upcoming conferences and meetings. So, what are you waiting for Grab this template today.
Developing Appealing Persona Social Media Marketing Performance Tracking Guidelines PDF
Following slide displays KPI dashboard that can be used to monitor the performance of social media marketing campaign. Metrics covered are related to fans number, engagement rate and page impressions. Create an editable Developing Appealing Persona Social Media Marketing Performance Tracking Guidelines PDF that communicates your idea and engages your audience. Whether youre presenting a business or an educational presentation, pre-designed presentation templates help save time. Developing Appealing Persona Social Media Marketing Performance Tracking Guidelines PDF is highly customizable and very easy to edit, covering many different styles from creative to business presentations. Slidegeeks has creative team members who have crafted amazing templates. So, go and get them without any delay.
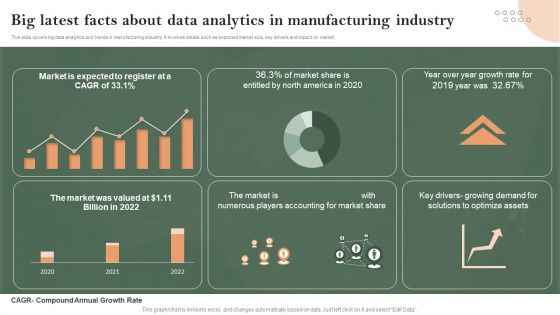
Big Latest Facts About Data Analytics In Manufacturing Industry Infographics PDF
This slide covers big data analytics and trends in manufacturing industry. It involves details such as expected market size, key drivers and impact on market. Pitch your topic with ease and precision using this Big Latest Facts About Data Analytics In Manufacturing Industry Infographics PDF. This layout presents information on Big Latest Facts, About Data Analytics, Manufacturing Industry. It is also available for immediate download and adjustment. So, changes can be made in the color, design, graphics or any other component to create a unique layout.
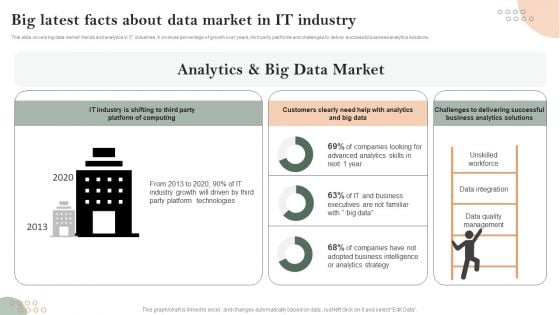
Big Latest Facts About Data Market In IT Industry Pictures PDF
This slide covers big data market trends and analytics in IT industries. It involves percentage of growth over years, third party platforms and challenges to deliver successful business analytics solutions. Showcasing this set of slides titled Big Latest Facts About Data Market In IT Industry Pictures PDF. The topics addressed in these templates are Unskilled Workforce, Data Integration, Data Quality Management. All the content presented in this PPT design is completely editable. Download it and make adjustments in color, background, font etc. as per your unique business setting.
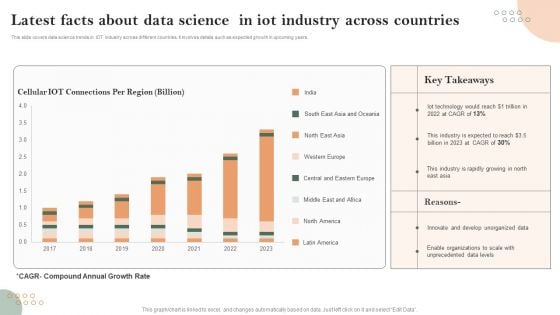
Latest Facts About Data Science In Iot Industry Across Countries Professional PDF
This slide covers data science trends in IOT industry across different countries. It involves details such as expected growth in upcoming years. Pitch your topic with ease and precision using this Latest Facts About Data Science In Iot Industry Across Countries Professional PDF. This layout presents information on Latest Facts, About Data Science, Iot Industry Across Countries. It is also available for immediate download and adjustment. So, changes can be made in the color, design, graphics or any other component to create a unique layout.

PIM Software Solution Report Dashboard Mockup PDF
This slide covers the dashboard with active product information and performance report. It also includes product KPIs such as active products, missing products, items sold by category, and top 5 products. Pitch your topic with ease and precision using this PIM Software Solution Report Dashboard Mockup PDF. This layout presents information on Product Information, Product Performance, Missing Product Details. It is also available for immediate download and adjustment. So, changes can be made in the color, design, graphics or any other component to create a unique layout.

Inventory Overview Dashboard In Supply Chain Management To Enhance Logistics Operations Summary PDF
This slide showcases the inventory management dashboard. It include KPIs such as inventory value, re-order products, restocking cost, inventory value by vendor, item name, last order date, warehouse, etc. Showcasing this set of slides titled Inventory Overview Dashboard In Supply Chain Management To Enhance Logistics Operations Summary PDF. The topics addressed in these templates are Inventory Overview Dashboard, Supply Chain Management, Enhance Logistics Operations. All the content presented in this PPT design is completely editable. Download it and make adjustments in color, background, font etc. as per your unique business setting.
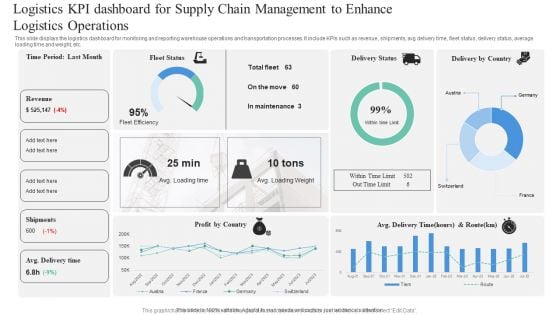
Logistics KPI Dashboard For Supply Chain Management To Enhance Logistics Operations Professional PDF
This slide displays the logistics dashboard for monitoring and reporting warehouse operations and transportation processes. It include KPIs such as revenue, shipments, avg delivery time, fleet status, delivery status, average loading time and weight, etc. Pitch your topic with ease and precision using this Logistics KPI Dashboard For Supply Chain Management To Enhance Logistics Operations Professional PDF. This layout presents information on Logistics KPI, Dashboard For Supply Chain, Management To Enhance, Logistics Operations. It is also available for immediate download and adjustment. So, changes can be made in the color, design, graphics or any other component to create a unique layout.
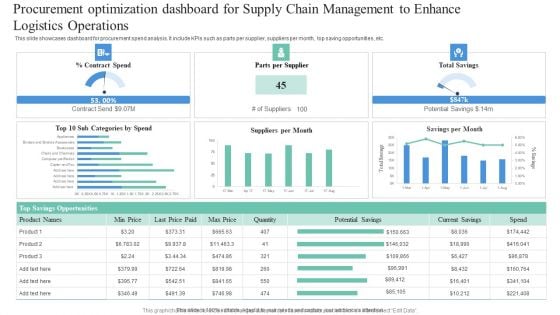
Procurement Optimization Dashboard For Supply Chain Management To Enhance Logistics Operations Elements PDF
This slide showcases dashboard for procurement spend analysis. It include KPIs such as parts per supplier, suppliers per month, top saving opportunities, etc. Pitch your topic with ease and precision using this Procurement Optimization Dashboard For Supply Chain Management To Enhance Logistics Operations Elements PDF. This layout presents information on Procurement Optimization Dashboard, Supply Chain Management, Enhance Logistic Operations. It is also available for immediate download and adjustment. So, changes can be made in the color, design, graphics or any other component to create a unique layout.
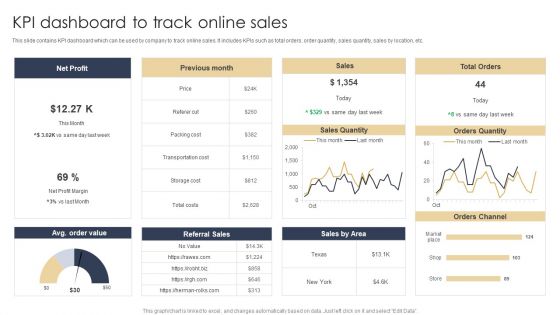
KPI Dashboard To Track Online Sales Structure PDF
This slide contains KPI dashboard which can be used by company to track online sales. It includes KPIs such as total orders, order quantity, sales quantity, sales by location, etc. Pitch your topic with ease and precision using this KPI Dashboard To Track Online Sales Structure PDF. This layout presents information on Net Profit, Sales, Orders Quantity. It is also available for immediate download and adjustment. So, changes can be made in the color, design, graphics or any other component to create a unique layout.
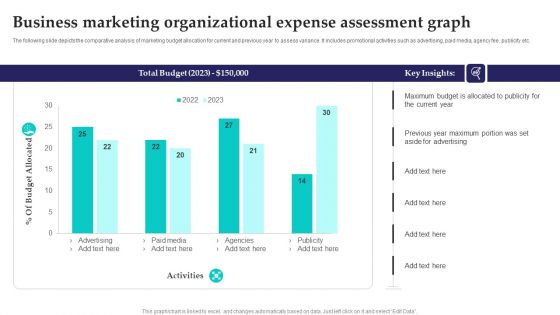
Business Marketing Organizational Expense Assessment Graph Information PDF
The following slide depicts the comparative analysis of marketing budget allocation for current and previous year to assess variance. It includes promotional activities such as advertising, paid media, agency fee, publicity etc. Showcasing this set of slides titled Business Marketing Organizational Expense Assessment Graph Information PDF. The topics addressed in these templates are Paid Media, Advertising, Budget Allocated. All the content presented in this PPT design is completely editable. Download it and make adjustments in color, background, font etc. as per your unique business setting.
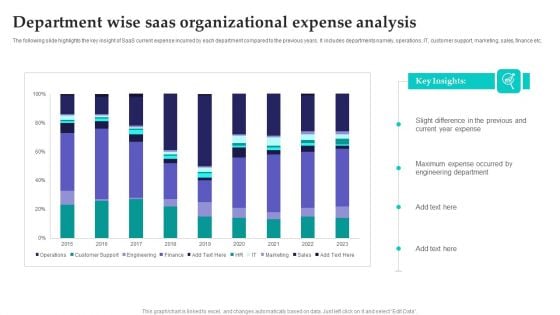
Department Wise Saas Organizational Expense Analysis Rules PDF
The following slide highlights the key insight of SaaS current expense incurred by each department compared to the previous years. It includes departments namely, operations, IT, customer support, marketing, sales, finance etc. Pitch your topic with ease and precision using this Department Wise Saas Organizational Expense Analysis Rules PDF. This layout presents information on Department Wise Saas Organizational, Expense Analysis. It is also available for immediate download and adjustment. So, changes can be made in the color, design, graphics or any other component to create a unique layout.

Digital Marketing Organizational Expense Assessment For Online Business Slides PDF
The below slide highlights the comparative analysis of current and planned digital marketing expense to operate web based business. It constitutes of expense breakdown into various marketing channels such as YouTube, Instagram, Facebook, LinkedIn, etc. along with key insights. Showcasing this set of slides titled Digital Marketing Organizational Expense Assessment For Online Business Slides PDF. The topics addressed in these templates are Marketing Expense, Planned Expense, Key Insights. All the content presented in this PPT design is completely editable. Download it and make adjustments in color, background, font etc. as per your unique business setting.
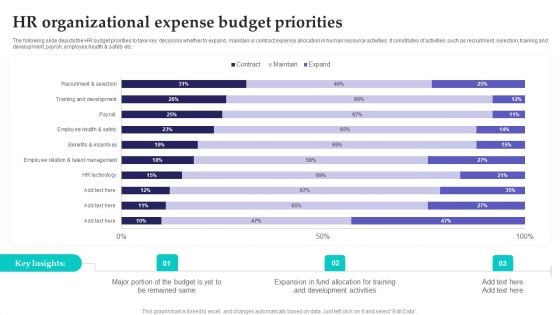
HR Organizational Expense Budget Priorities Template PDF
The following slide depicts the HR budget priorities to take key decisions whether to expand, maintain or contract expense allocation in human resource activities. It constitutes of activities such as recruitment, selection, training and development, payroll, employee health and safety etc. Pitch your topic with ease and precision using this HR Organizational Expense Budget Priorities Template PDF. This layout presents information on Budget, Development Activities, Fund Allocation. It is also available for immediate download and adjustment. So, changes can be made in the color, design, graphics or any other component to create a unique layout.
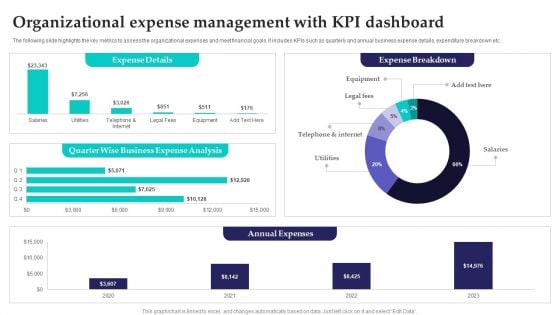
Organizational Expense Management With Kpi Dashboard Slides PDF
The following slide highlights the key metrics to assess the organizational expenses and meet financial goals. It includes KPIs such as quarterly and annual business expense details, expenditure breakdown etc. Showcasing this set of slides titled Organizational Expense Management With Kpi Dashboard Slides PDF. The topics addressed in these templates are Annual Expenses, Expense Details, Expense Breakdown. All the content presented in this PPT design is completely editable. Download it and make adjustments in color, background, font etc. as per your unique business setting.
Project Tracking Budget Risk And Health Tracker Inspiration PDF
The following slide depicts the tracker to trace the progress of project tracking at the same time. It includes various kpis such as task, budget, resource, issues and risk status etc. Showcasing this set of slides titled Project Tracking Budget Risk And Health Tracker Inspiration PDF. The topics addressed in these templates are Risk And Health Tracker, Project Tracking Budget. All the content presented in this PPT design is completely editable. Download it and make adjustments in color, background, font etc. as per your unique business setting.
Project Tracking Bug And Progress Tracker Dashboard Elements PDF
The following slide showcases the progress status of project tracking activities to achieve objectives. It constitutes of elements such as number of projects, features, work items, number of bugs along with the progress status etc. Pitch your topic with ease and precision using this Project Tracking Bug And Progress Tracker Dashboard Elements PDF. This layout presents information on Project Tracking, Progress Tracker Dashboard. It is also available for immediate download and adjustment. So, changes can be made in the color, design, graphics or any other component to create a unique layout.
Project Tracking Issue Tracker Dashboard Rules PDF
The following slide highlights the project tracking issues in project management to determine and resolve them quickly. It includes metrics such as issue summary, priorities, responsible head, reporting and closing date etc. Showcasing this set of slides titled Project Tracking Issue Tracker Dashboard Rules PDF. The topics addressed in these templates are Inappropriate Supplies, Project, Tracker Dashboard. All the content presented in this PPT design is completely editable. Download it and make adjustments in color, background, font etc. as per your unique business setting.
Project Tracking Planned Vs Actual Project Progress Tracker Pictures PDF
The following slide highlights the variations in the project progress to manage the its and ensure timely delivery. It includes KPIs such as completion percentage and the gap in the planned versus actual hours. Pitch your topic with ease and precision using this Project Tracking Planned Vs Actual Project Progress Tracker Pictures PDF. This layout presents information on Project Tracking Planned, Project Progress Tracker. It is also available for immediate download and adjustment. So, changes can be made in the color, design, graphics or any other component to create a unique layout.
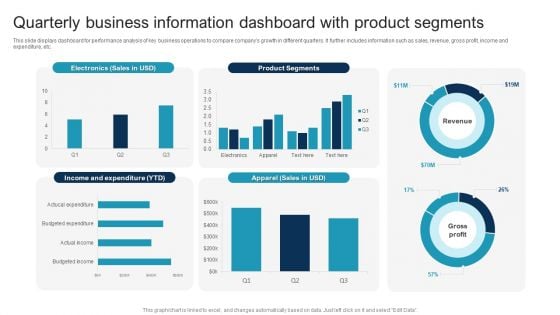
Quarterly Business Information Dashboard With Product Segments Slides PDF
This slide displays dashboard for performance analysis of key business operations to compare companys growth in different quarters. It further includes information such as sales, revenue, gross profit, income and expenditure, etc. Showcasing this set of slides titled Quarterly Business Information Dashboard With Product Segments Slides PDF. The topics addressed in these templates are Quarterly Business Information, Dashboard With Product Segments. All the content presented in this PPT design is completely editable. Download it and make adjustments in color, background, font etc. as per your unique business setting.
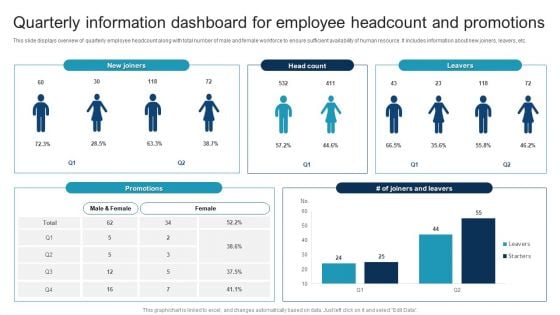
Quarterly Information Dashboard For Employee Headcount And Promotions Portrait PDF
This slide displays overview of quarterly employee headcount along with total number of male and female workforce to ensure sufficient availability of human resource. It includes information about new joiners, leavers, etc. Showcasing this set of slides titled Quarterly Information Dashboard For Employee Headcount And Promotions Portrait PDF. The topics addressed in these templates are Quarterly Information Dashboard, Employee Headcount And Promotions All the content presented in this PPT design is completely editable. Download it and make adjustments in color, background, font etc. as per your unique business setting.
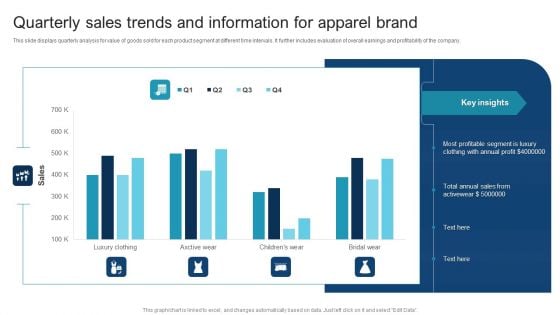
Quarterly Sales Trends And Information For Apparel Brand Pictures PDF
This slide displays quarterly analysis for value of goods sold for each product segment at different time intervals. It further includes evaluation of overall earnings and profitability of the company. Pitch your topic with ease and precision using this Quarterly Sales Trends And Information For Apparel Brand Pictures PDF. This layout presents information on Quarterly Sales, Trends And Information, Apparel Brand. It is also available for immediate download and adjustment. So, changes can be made in the color, design, graphics or any other component to create a unique layout.
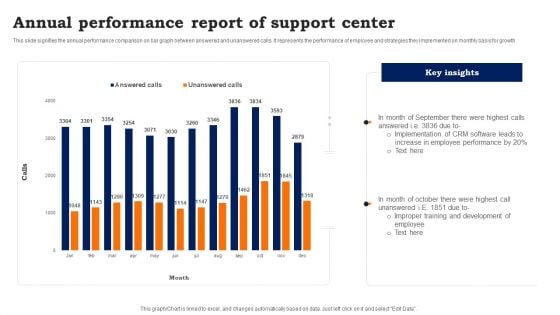
Annual Performance Report Of Support Center Inspiration PDF
This slide signifies the annual performance comparison on bar graph between answered and unanswered calls. It represents the performance of employee and strategies they implemented on monthly basis for growth. Showcasing this set of slides titled Annual Performance Report Of Support Center Inspiration PDF. The topics addressed in these templates are Annual Performance, Report Of Support Center. All the content presented in this PPT design is completely editable. Download it and make adjustments in color, background, font etc. as per your unique business setting.

Benefits Of Pharmacy Information System Platform Portrait PDF
This slide showcases a graphical representation of PMS platform advantages to pharmacists. Key benefits covered are faster prescription processing, improved inventory accuracy and customer retention, less paperwork and greater control over expenses. Showcasing this set of slides titled Benefits Of Pharmacy Information System Platform Portrait PDF. The topics addressed in these templates are Benefits Of Pharmacy, Information System Platform. All the content presented in this PPT design is completely editable. Download it and make adjustments in color, background, font etc. as per your unique business setting.
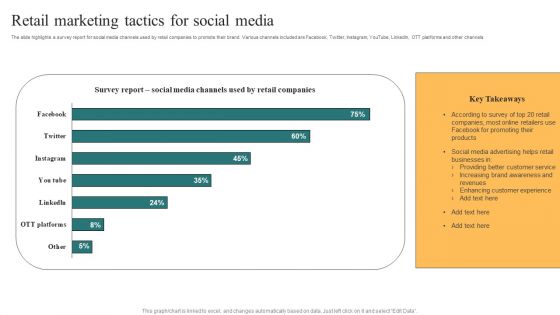
Retail Marketing Tactics For Social Media Portrait PDF
The slide highlights a survey report for social media channels used by retail companies to promote their brand. Various channels included are Facebook, Twitter, Instagram, YouTube, LinkedIn, OTT platforms and other channels. Showcasing this set of slides titled Retail Marketing Tactics For Social Media Portrait PDF. The topics addressed in these templates are Retail Marketing, Tactics For Social Media. All the content presented in this PPT design is completely editable. Download it and make adjustments in color, background, font etc. as per your unique business setting.
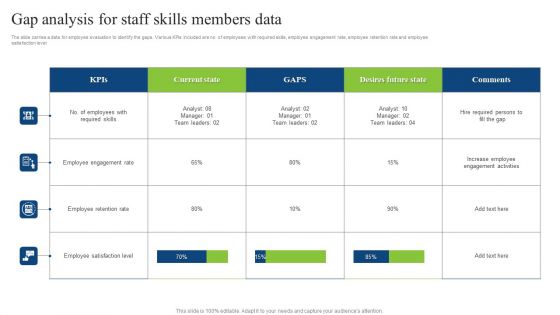
Gap Analysis For Staff Skills Members Data Guidelines PDF
The slide carries a data for employee evaluation to identify the gaps. Various KPIs included are no. of employees with required skills, employee engagement rate, employee retention rate and employee satisfaction level. Showcasing this set of slides titled Gap Analysis For Staff Skills Members Data Guidelines PDF. The topics addressed in these templates are Employee Engagement Rate, Employee Retention Rate. All the content presented in this PPT design is completely editable. Download it and make adjustments in color, background, font etc. as per your unique business setting.
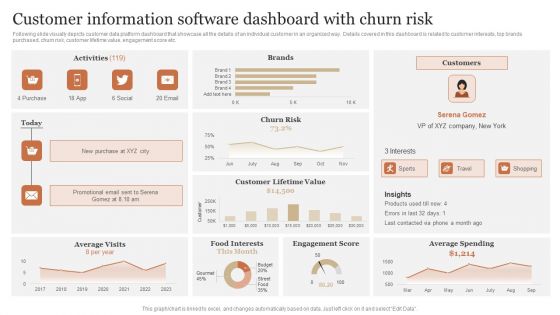
Customer Information Software Dashboard With Churn Risk Information PDF
Following slide visually depicts customer data platform dashboard that showcase all the details of an individual customer in an organized way. Details covered in this dashboard is related to customer interests, top brands purchased, churn risk, customer lifetime value, engagement score etc. Pitch your topic with ease and precision using this Customer Information Software Dashboard With Churn Risk Information PDF. This layout presents information on Customer Lifetime, Engagement Score, Average Spending. It is also available for immediate download and adjustment. So, changes can be made in the color, design, graphics or any other component to create a unique layout.
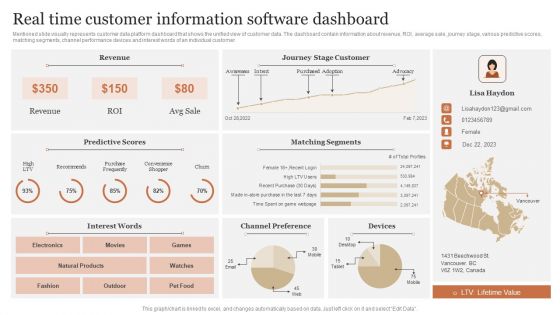
Real Time Customer Information Software Dashboard Portrait PDF
Mentioned slide visually represents customer data platform dashboard that shows the unified view of customer data. The dashboard contain information about revenue, ROI, average sale, journey stage, various predictive scores, matching segments, channel performance devices and interest words of an individual customer. Showcasing this set of slides titled Real Time Customer Information Software Dashboard Portrait PDF. The topics addressed in these templates are Predictive Scores, Matching Segments, Channel Preference. All the content presented in this PPT design is completely editable. Download it and make adjustments in color, background, font etc. as per your unique business setting.
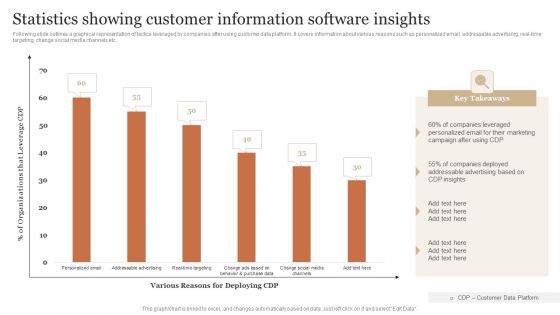
Statistics Showing Customer Information Software Insights Portrait PDF
Following slide outlines a graphical representation of tactics leveraged by companies after using customer data platform. It covers information about various reasons such as personalized email, addressable advertising, real-time targeting, change social media channels etc. Showcasing this set of slides titled Statistics Showing Customer Information Software Insights Portrait PDF. The topics addressed in these templates are Companies Leveraged, Personalized Marketing, Addressable Advertising. All the content presented in this PPT design is completely editable. Download it and make adjustments in color, background, font etc. as per your unique business setting.

Benefits Of Enterprise Risk Management Experienced By Organizations Template PDF
This slide represents the ways in which enterprise risk management helps organizations to improve decision quality, reduce business liability and frame regulatory issues. It includes details related to results of survey conducted to analyze benefits of ERM experienced by various organizations.Find a pre-designed and impeccable Benefits Of Enterprise Risk Management Experienced By Organizations Template PDF. The templates can ace your presentation without additional effort. You can download these easy-to-edit presentation templates to make your presentation stand out from others. So, what are you waiting for Download the template from Slidegeeks today and give a unique touch to your presentation.
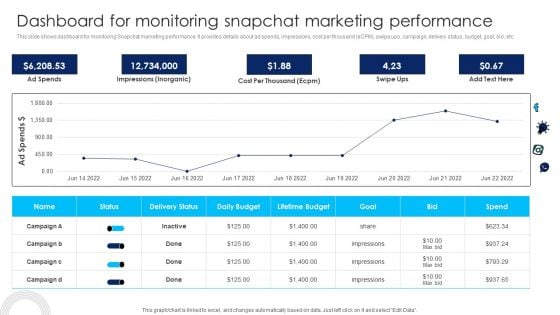
Using Social Media Platforms To Enhance Dashboard For Monitoring Snapchat Marketing Introduction PDF
This slide shows dashboard for monitoring Snapchat marketing performance. It provides details about ad spends, impressions, cost per thousand eCPM, swipe ups, campaign, delivery status, budget, goal, bid, etc. If your project calls for a presentation, then Slidegeeks is your go-to partner because we have professionally designed, easy-to-edit templates that are perfect for any presentation. After downloading, you can easily edit Using Social Media Platforms To Enhance Dashboard For Monitoring Snapchat Marketing Introduction PDF and make the changes accordingly. You can rearrange slides or fill them with different images. Check out all the handy templates
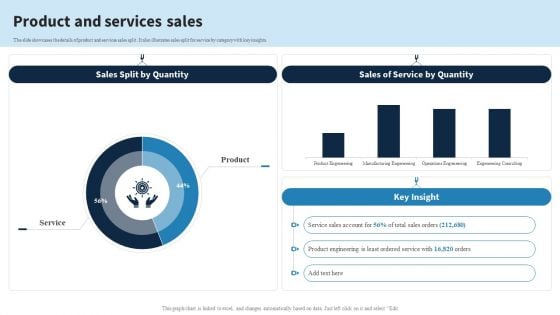
Engineering Services Company Report Product And Services Sales Ppt PowerPoint Presentation File Deck PDF
The slide showcases the details of product and services sales split. It also illustrates sales split for service by category with key insights. Find a pre-designed and impeccable Engineering Services Company Report Product And Services Sales Ppt PowerPoint Presentation File Deck PDF. The templates can ace your presentation without additional effort. You can download these easy-to-edit presentation templates to make your presentation stand out from others. So, what are you waiting for Download the template from Slidegeeks today and give a unique touch to your presentation.
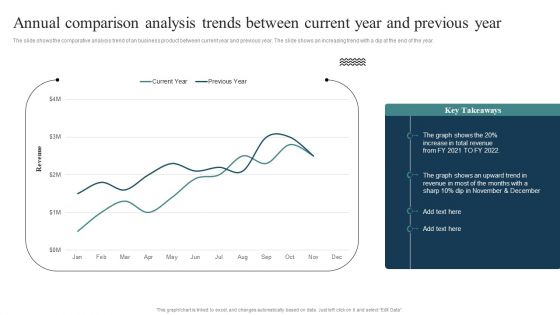
Annual Comparison Analysis Trends Between Current Year And Previous Year Rules PDF
The slide shows the comparative analysis trend of an business product between current year and previous year. The slide shows an increasing trend with a dip at the end of the year. Showcasing this set of slides titled Annual Comparison Analysis Trends Between Current Year And Previous Year Rules PDF. The topics addressed in these templates are Annual Comparison, Analysis Trends, Between Current . All the content presented in this PPT design is completely editable. Download it and make adjustments in color, background, font etc. as per your unique business setting.
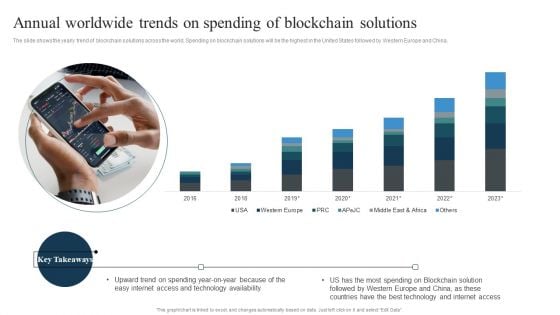
Annual Worldwide Trends On Spending Of Blockchain Solutions Introduction PDF
The slide shows the yearly trend of blockchain solutions across the world. Spending on blockchain solutions will be the highest in the United States followed by Western Europe and China.Pitch your topic with ease and precision using this Annual Worldwide Trends On Spending Of Blockchain Solutions Introduction PDF. This layout presents information on Technology Availability, Upward Trend Spending, Technology Internet Access. It is also available for immediate download and adjustment. So, changes can be made in the color, design, graphics or any other component to create a unique layout.
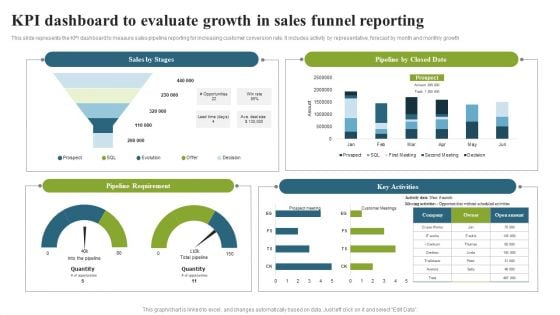
KPI Dashboard To Evaluate Growth In Sales Funnel Reporting Topics PDF
This slide represents the KPI dashboard to measure sales pipeline reporting for increasing customer conversion rate. It includes activity by representative, forecast by month and monthly growth. Pitch your topic with ease and precision using this KPI Dashboard To Evaluate Growth In Sales Funnel Reporting Topics PDF. This layout presents information on Pipeline Requirement, Key Activities, Pipeline Closed Date. It is also available for immediate download and adjustment. So, changes can be made in the color, design, graphics or any other component to create a unique layout.

Credit Risk Management Credit Risk Recovery Management Details Introduction PDF
This slide covers credit recovery details of the bank from clients such as loans issued, recovered and outstanding. Do you have an important presentation coming up Are you looking for something that will make your presentation stand out from the rest Look no further than Credit Risk Management Credit Risk Recovery Management Details Introduction PDF. With our professional designs, you can trust that your presentation will pop and make delivering it a smooth process. And with Slidegeeks, you can trust that your presentation will be unique and memorable. So why wait Grab Credit Risk Management Credit Risk Recovery Management Details Introduction PDF today and make your presentation stand out from the rest.
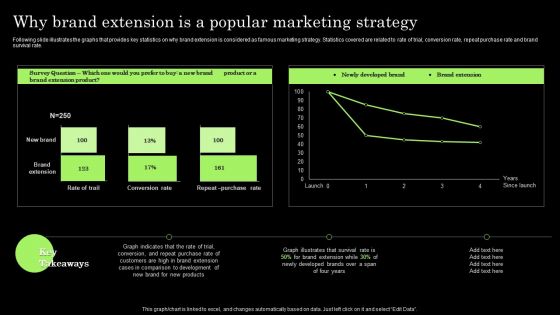
Tactical Brand Extension Launching Why Brand Extension Is A Popular Marketing Strategy Template PDF
Following slide illustrates the graphs that provides key statistics on why brand extension is considered as famous marketing strategy. Statistics covered are related to rate of trial, conversion rate, repeat purchase rate and brand survival rate. If your project calls for a presentation, then Slidegeeks is your go-to partner because we have professionally designed, easy-to-edit templates that are perfect for any presentation. After downloading, you can easily edit Tactical Brand Extension Launching Why Brand Extension Is A Popular Marketing Strategy Template PDF and make the changes accordingly. You can rearrange slides or fill them with different images. Check out all the handy templates.
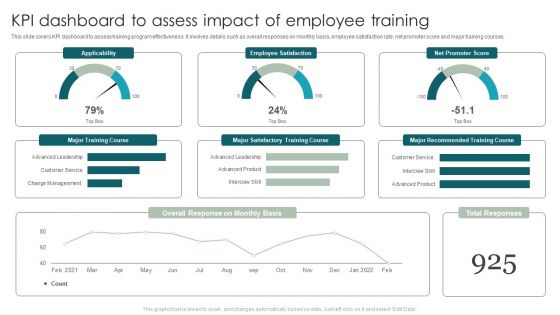
KPI Dashboard To Assess Impact Of Employee Training Brochure PDF
This slide covers KPI dashboard to assess training program effectiveness. It involves details such as overall responses on monthly basis, employee satisfaction rate, net promoter score and major training courses. Showcasing this set of slides titled KPI Dashboard To Assess Impact Of Employee Training Brochure PDF. The topics addressed in these templates are Major Training Course, Major Satisfactory Training Course, Major Recommended Training Course . All the content presented in this PPT design is completely editable. Download it and make adjustments in color, background, font etc. as per your unique business setting.

 Home
Home