Content Calendar
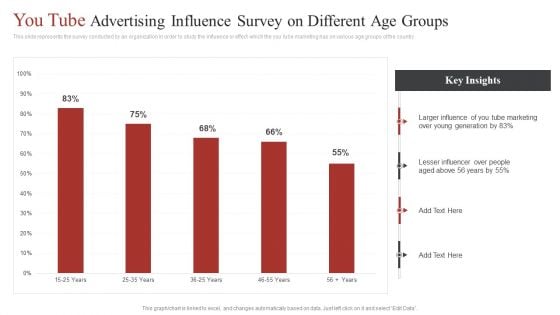
You Tube Advertising Influence Survey On Different Age Groups Ppt Diagram Ppt PDF
This slide represents the survey conducted by an organization in order to study the influence or effect which the you tube marketing has on various age groups of the country. Pitch your topic with ease and precision using this You Tube Advertising Influence Survey On Different Age Groups Ppt Diagram Ppt PDF. This layout presents information on Larger Influence, You Tube Marketing, Young Generation. It is also available for immediate download and adjustment. So, changes can be made in the color, design, graphics or any other component to create a unique layout.

Effect Of Pandemic On Remote Education Learning Platforms Sample PDF
The slide contains various remote learning platforms used by different income-level groups to face COVID effects. Various platforms included are online and broadcasts, television, radio, etc. Pitch your topic with ease and precision using this Effect Of Pandemic On Remote Education Learning Platforms Sample PDF. This layout presents information on Pandemic Situation, High Income Level, Technical Platforms. It is also available for immediate download and adjustment. So, changes can be made in the color, design, graphics or any other component to create a unique layout.
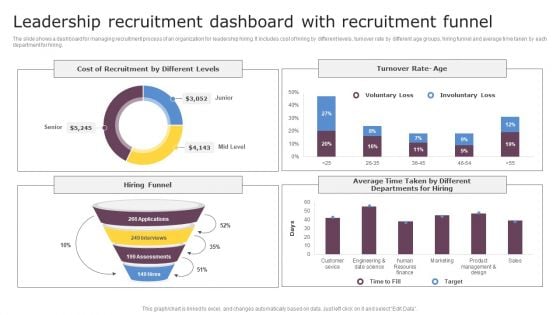
Leadership Recruitment Dashboard With Recruitment Funnel Slides PDF
The slide shows a dashboard for managing recruitment process of an organization for leadership hiring. It includes cost of hiring by different levels, turnover rate by different age groups, hiring funnel and average time taken by each department for hiring. Pitch your topic with ease and precision using this Leadership Recruitment Dashboard With Recruitment Funnel Slides PDF. This layout presents information on Leadership Recruitment, Dashboard With Recruitment. It is also available for immediate download and adjustment. So, changes can be made in the color, design, graphics or any other component to create a unique layout.
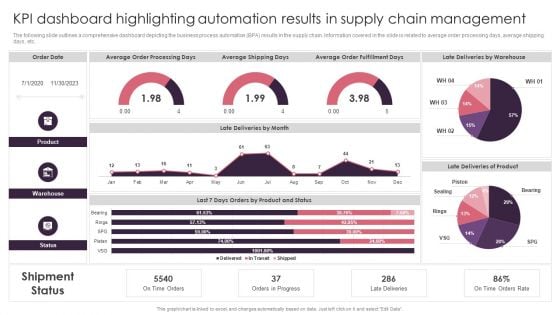
KPI Dashboard Highlighting Automation Results In Supply Chain Management Brochure PDF
The following slide outlines a comprehensive dashboard depicting the business process automation BPA results in the supply chain. Information covered in the slide is related to average order processing days, average shipping days, etc. From laying roadmaps to briefing everything in detail, our templates are perfect for you. You can set the stage with your presentation slides. All you have to do is download these easy to edit and customizable templates. KPI Dashboard Highlighting Automation Results In Supply Chain Management Brochure PDF will help you deliver an outstanding performance that everyone would remember and praise you for. Do download this presentation today.
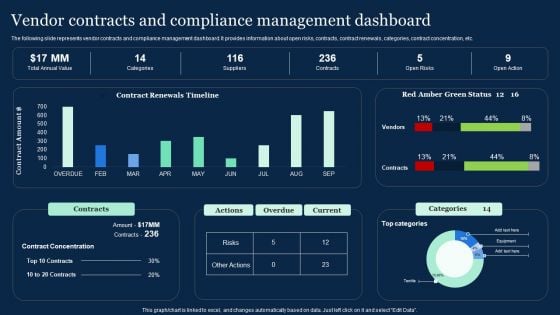
Vendor Contracts And Compliance Management Dashboard Effective Vendor Management For Enhancing Download PDF
The following slide represents vendor contracts and compliance management dashboard. It provides information about open risks, contracts, contract renewals, categories, contract concentration, etc. Get a simple yet stunning designed Vendor Contracts And Compliance Management Dashboard Effective Vendor Management For Enhancing Download PDF. It is the best one to establish the tone in your meetings. It is an excellent way to make your presentations highly effective. So, download this PPT today from Slidegeeks and see the positive impacts. Our easy-to-edit Vendor Contracts And Compliance Management Dashboard Effective Vendor Management For Enhancing Download PDF can be your go-to option for all upcoming conferences and meetings. So, what are you waiting for Grab this template today.
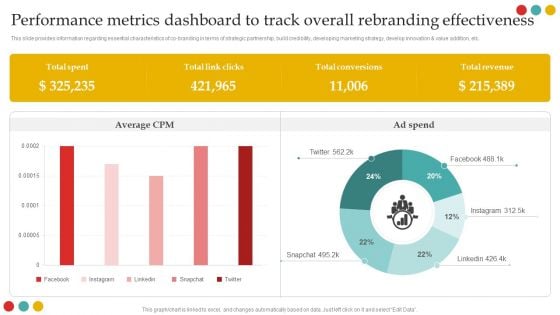
Successful Rebranding Guide Performance Metrics Dashboard To Track Overall Rebranding Effectiveness Guidelines PDF
This slide provides information regarding essential characteristics of co-branding in terms of strategic partnership, build credibility, developing marketing strategy, develop innovation value addition, etc.Want to ace your presentation in front of a live audience Our Successful Rebranding Guide Performance Metrics Dashboard To Track Overall Rebranding Effectiveness Guidelines PDF can help you do that by engaging all the users towards you. Slidegeeks experts have put their efforts and expertise into creating these impeccable powerpoint presentations so that you can communicate your ideas clearly. Moreover, all the templates are customizable, and easy-to-edit and downloadable. Use these for both personal and commercial use.

Guide To Develop And Estimate Brand Value Structure PDF
Mentioned slide illustrates information about young rubicam brand asset valuator model. It also covers sample model along with key benefits and brand health performance.Crafting an eye-catching presentation has never been more straightforward. Let your presentation shine with this tasteful yet straightforward Guide To Develop And Estimate Brand Value Structure PDF template. It offers a minimalistic and classy look that is great for making a statement. The colors have been employed intelligently to add a bit of playfulness while still remaining professional. Construct the ideal Guide To Develop And Estimate Brand Value Structure PDF that effortlessly grabs the attention of your audience Begin now and be certain to wow your customers.
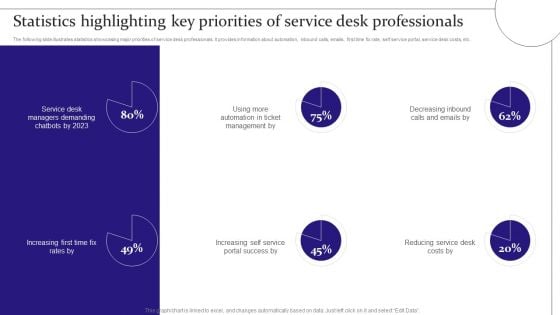
Digitalization Of Service Desk Statistics Highlighting Key Priorities Of Service Desk Professionals Ppt Gallery Grid PDF
The following slide illustrates statistics showcasing major priorities of service desk professionals. It provides information about automation, inbound calls, emails, first time fix rate, self service portal, service desk costs, etc. Take your projects to the next level with our ultimate collection of Digitalization Of Service Desk Statistics Highlighting Key Priorities Of Service Desk Professionals Ppt Gallery Grid PDF. Slidegeeks has designed a range of layouts that are perfect for representing task or activity duration, keeping track of all your deadlines at a glance. Tailor these designs to your exact needs and give them a truly corporate look with your own brand colors they will make your projects stand out from the rest.
Rebranding Project Progress Tracking Dashboard Strategies For Rebranding Without Losing Template PDF
This slide provides information regarding essential characteristics of co branding in terms of strategic partnership, build credibility, developing marketing strategy, develop innovation and value addition, etc. If your project calls for a presentation, then Slidegeeks is your go-to partner because we have professionally designed, easy-to-edit templates that are perfect for any presentation. After downloading, you can easily edit Rebranding Project Progress Tracking Dashboard Strategies For Rebranding Without Losing Template PDF and make the changes accordingly. You can rearrange slides or fill them with different images. Check out all the handy templates
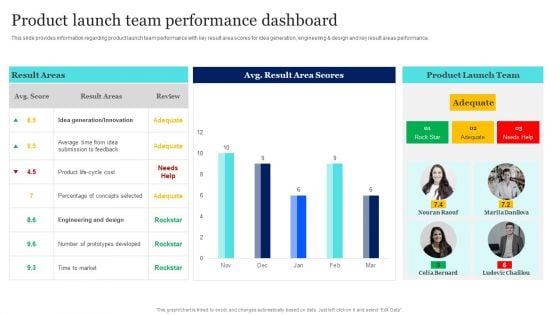
New Product Launch To Market Playbook Product Launch Team Performance Dashboard Introduction PDF
This slide provides information regarding product launch team performance with key result area scores for idea generation, engineering and design and key result areas performance. From laying roadmaps to briefing everything in detail, our templates are perfect for you. You can set the stage with your presentation slides. All you have to do is download these easy to edit and customizable templates. New Product Launch To Market Playbook Product Launch Team Performance Dashboard Introduction PDF will help you deliver an outstanding performance that everyone would remember and praise you for. Do download this presentation today.
Deploying Cloud Technology Tracking Progress Of Project Management Tasks Ppt Ideas Example Introduction PDF
The following slide illustrates task management tool for tracking project status. It provides information about requirements, coding, development, knowledge, user acceptance testing, standup meeting, etc. The best PPT templates are a great way to save time, energy, and resources. Slidegeeks have 100 percent editable powerpoint slides making them incredibly versatile. With these quality presentation templates, you can create a captivating and memorable presentation by combining visually appealing slides and effectively communicating your message. Download Deploying Cloud Technology Tracking Progress Of Project Management Tasks Ppt Ideas Example Introduction PDF from Slidegeeks and deliver a wonderful presentation.
Introduction To New Product Portfolio Determining Top Initiatives For Effective Product Portfolio Ppt Icon Objects PDF
Following slide shows information about various initiatives that may contribute to effective product portfolio management in new region. Most contributing factor is balancing the product development projects with development capacity which contributes 55 percent. Make sure to capture your audiences attention in your business displays with our gratis customizable Introduction To New Product Portfolio Determining Top Initiatives For Effective Product Portfolio Ppt Icon Objects PDF. These are great for business strategies, office conferences, capital raising or task suggestions. If you desire to acquire more customers for your tech business and ensure they stay satisfied, create your own sales presentation with these plain slides.
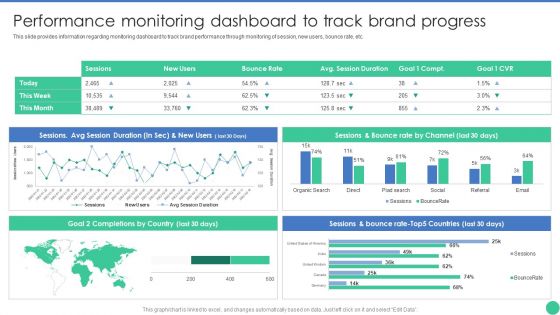
Brand Management To Enhance Performance Monitoring Dashboard To Track Brand Pictures PDF
This slide provides information regarding monitoring dashboard to track brand performance through monitoring of session, new users, bounce rate, etc. Do you know about Slidesgeeks Brand Management To Enhance Performance Monitoring Dashboard To Track Brand Pictures PDF These are perfect for delivering any kind od presentation. Using it, create PowerPoint presentations that communicate your ideas and engage audiences. Save time and effort by using our pre-designed presentation templates that are perfect for a wide range of topic. Our vast selection of designs covers a range of styles, from creative to business, and are all highly customizable and easy to edit. Download as a PowerPoint template or use them as Google Slides themes.
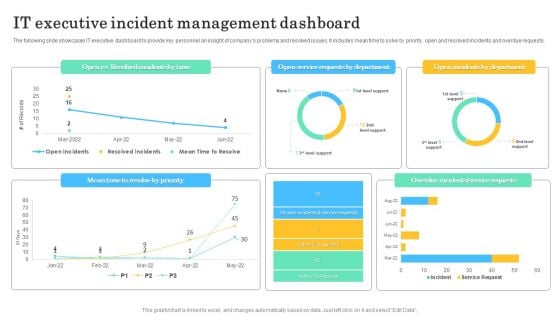
IT Executive Incident Management Dashboard Microsoft PDF
The following slide showcases IT executive dashboard to provide key personnel an insight of companys problems and resolved issues. It includes mean time to solve by priority, open and resolved incidents and overdue requests. Pitch your topic with ease and precision using this IT Executive Incident Management Dashboard Microsoft PDF. This layout presents information on IT Executive Incident, Management Dashboard. It is also available for immediate download and adjustment. So, changes can be made in the color, design, graphics or any other component to create a unique layout.
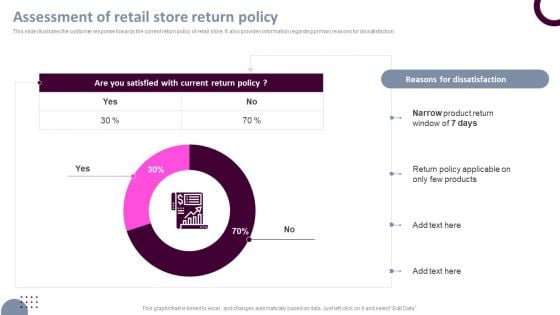
Retail Store Operations Assessment Of Retail Store Return Policy Introduction PDF
This slide illustrates the customer response towards the current return policy of retail store. It also provides information regarding primary reasons for dissatisfaction. Present like a pro with Retail Store Operations Assessment Of Retail Store Return Policy Introduction PDF Create beautiful presentations together with your team, using our easy-to-use presentation slides. Share your ideas in real-time and make changes on the fly by downloading our templates. So whether youre in the office, on the go, or in a remote location, you can stay in sync with your team and present your ideas with confidence. With Slidegeeks presentation got a whole lot easier. Grab these presentations today.
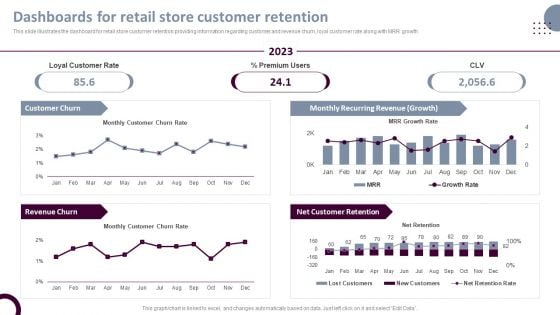
Retail Store Operations Dashboards For Retail Store Customer Retention Clipart PDF
This slide illustrates the dashboard for retail store customer retention providing information regarding customer and revenue churn, loyal customer rate along with MRR growth. Make sure to capture your audiences attention in your business displays with our gratis customizable Retail Store Operations Dashboards For Retail Store Customer Retention Clipart PDF. These are great for business strategies, office conferences, capital raising or task suggestions. If you desire to acquire more customers for your tech business and ensure they stay satisfied, create your own sales presentation with these plain slides.
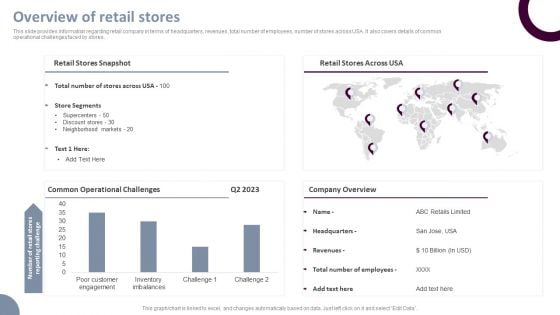
Retail Store Operations Overview Of Retail Stores Ppt Infographic Template File Formats PDF
This slide provides information regarding retail company in terms of headquarters, revenues, total number of employees, number of stores across USA. It also covers details of common operational challenges faced by stores. Take your projects to the next level with our ultimate collection of Retail Store Operations Overview Of Retail Stores Ppt Infographic Template File Formats PDF. Slidegeeks has designed a range of layouts that are perfect for representing task or activity duration, keeping track of all your deadlines at a glance. Tailor these designs to your exact needs and give them a truly corporate look with your own brand colors theyll make your projects stand out from the rest.
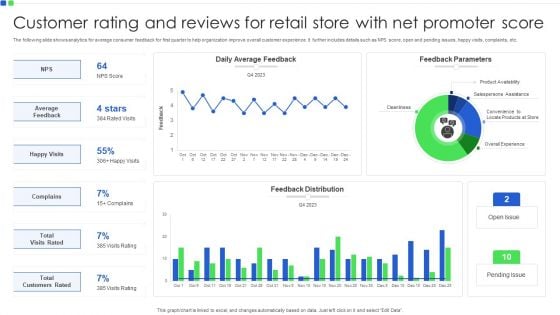
Customer Rating And Reviews For Retail Store With Net Promoter Score Demonstration PDF
The following slide shows analytics for average consumer feedback for first quarter to help organization improve overall customer experience. It further includes details such as NPS score, open and pending issues, happy visits, complaints, etc. Pitch your topic with ease and precision using this Customer Rating And Reviews For Retail Store With Net Promoter Score Demonstration PDF. This layout presents information on Average Feedback, Happy Visits, Complains. It is also available for immediate download and adjustment. So, changes can be made in the color, design, graphics or any other component to create a unique layout.
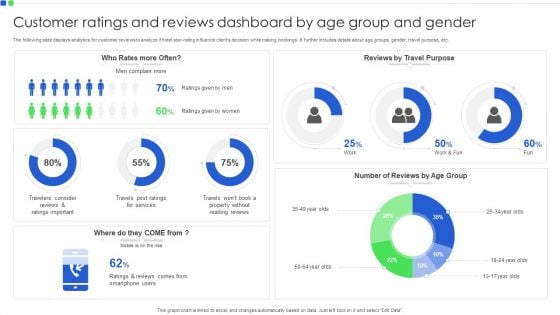
Customer Ratings And Reviews Dashboard By Age Group And Gender Introduction PDF
The following slide displays analytics for customer reviews to analyze if hotel star rating influence clients decision while making bookings. It further includes details about age groups, gender, travel purpose, etc. Pitch your topic with ease and precision using this Customer Ratings And Reviews Dashboard By Age Group And Gender Introduction PDF. This layout presents information on Customer Ratings And Reviews, Age Group And Gender. It is also available for immediate download and adjustment. So, changes can be made in the color, design, graphics or any other component to create a unique layout.
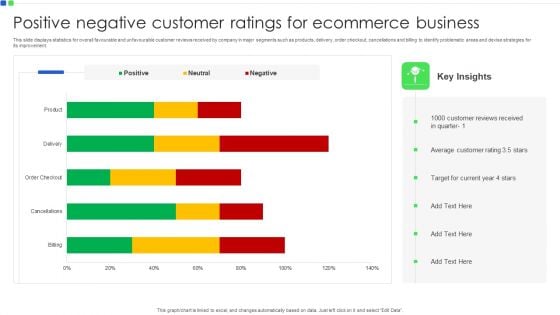
Positive Negative Customer Ratings For Ecommerce Business Rules PDF
This slide displays statistics for overall favourable and unfavourable customer reviews received by company in major segments such as products, delivery, order checkout, cancellations and billing to identify problematic areas and devise strategies for its improvement. Pitch your topic with ease and precision using this Positive Negative Customer Ratings For Ecommerce Business Rules PDF. This layout presents information on Customer Reviews Received, Average Customer Rating, Target For Current Year. It is also available for immediate download and adjustment. So, changes can be made in the color, design, graphics or any other component to create a unique layout.
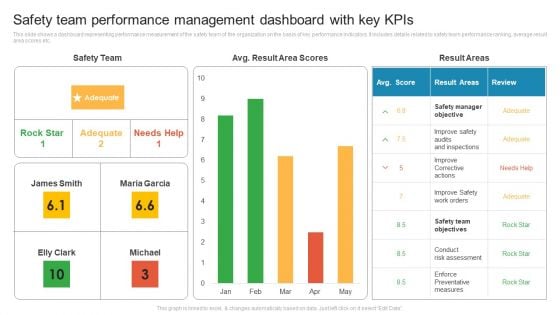
Safety Team Performance Management Dashboard With Key Kpis Rules PDF
This slide shows a dashboard representing performance measurement of the safety team of the organization on the basis of key performance indicators. It includes details related to safety team performance ranking, average result area scores etc. Pitch your topic with ease and precision using this Safety Team Performance Management Dashboard With Key Kpis Rules PDF. This layout presents information on Improve Corrective Actions, Safety Manager Objective, Conduct Risk Assessment. It is also available for immediate download and adjustment. So, changes can be made in the color, design, graphics or any other component to create a unique layout.
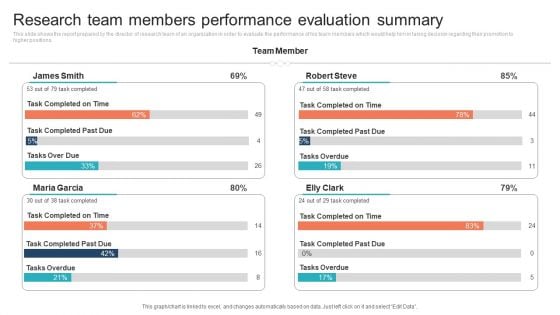
Research Team Members Performance Evaluation Summary Portrait PDF
This slide shows the report prepared by the director of research team of an organization in order to evaluate the performance of his team members which would help him in taking decision regarding their promotion to higher positions. Pitch your topic with ease and precision using this Research Team Members Performance Evaluation Summary Portrait PDF. This layout presents information on Research Team Members, Performance Evaluation Summary. It is also available for immediate download and adjustment. So, changes can be made in the color, design, graphics or any other component to create a unique layout.
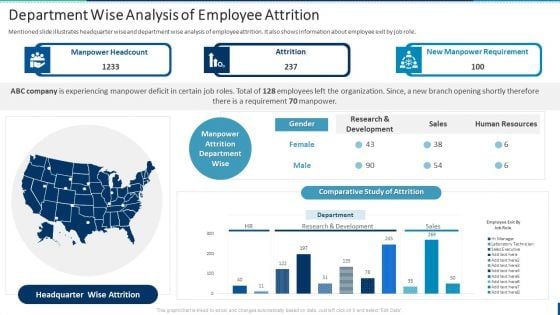
Internal Employee Succession Department Wise Analysis Of Employee Attrition Elements PDF
Mentioned slide illustrates headquarter wise and department wise analysis of employee attrition. It also shows information about employee exit by job role. From laying roadmaps to briefing everything in detail, our templates are perfect for you. You can set the stage with your presentation slides. All you have to do is download these easy-to-edit and customizable templates. Internal Employee Succession Department Wise Analysis Of Employee Attrition Elements PDF will help you deliver an outstanding performance that everyone would remember and praise you for. Do download this presentation today.
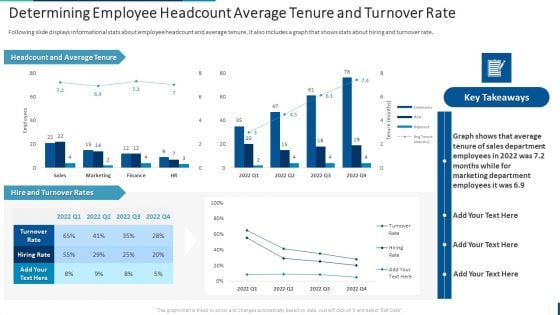
Internal Employee Succession Determining Employee Headcount Average Tenure Inspiration PDF
Following slide displays informational stats about employee headcount and average tenure. It also includes a graph that shows stats about hiring and turnover rate. Present like a pro with Internal Employee Succession Determining Employee Headcount Average Tenure Inspiration PDF Create beautiful presentations together with your team, using our easy-to-use presentation slides. Share your ideas in real-time and make changes on the fly by downloading our templates. So whether youre in the office, on the go, or in a remote location, you can stay in sync with your team and present your ideas with confidence. With Slidegeeks presentation got a whole lot easier. Grab these presentations today.
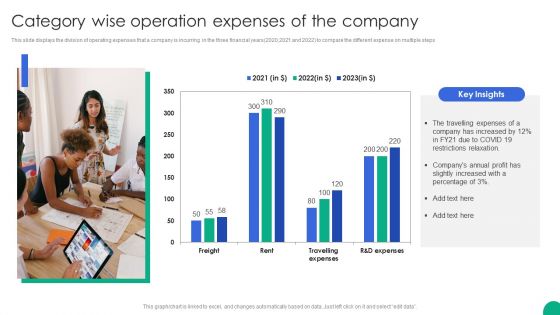
Category Wise Operation Expenses Of The Company Topics PDF
This slide displays the division of operating expenses that a company is incurring in the three financial years 2020,2021 and 2022 to compare the different expense on multiple steps.Pitch your topic with ease and precision using this Category Wise Operation Expenses Of The Company Topics PDF. This layout presents information on Travelling Expenses, Increased Restrictions, Relaxation. It is also available for immediate download and adjustment. So, changes can be made in the color, design, graphics or any other component to create a unique layout.
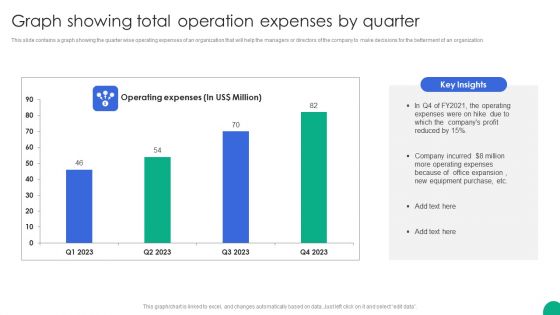
Graph Showing Total Operation Expenses By Quarter Themes PDF
This slide contains a graph showing the quarter wise operating expenses of an organization that will help the managers or directors of the company to make decisions for the betterment of an organization.Pitch your topic with ease and precision using this Graph Showing Total Operation Expenses By Quarter Themes PDF. This layout presents information on Operating Expenses, Equipment Purchase, Office Expansion. It is also available for immediate download and adjustment. So, changes can be made in the color, design, graphics or any other component to create a unique layout.
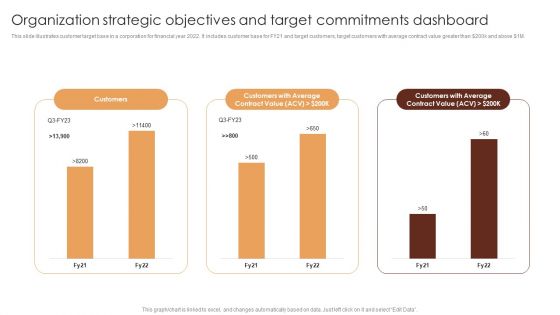
Organization Strategic Objectives And Target Commitments Dashboard Themes PDF
This slide illustrates customer target base in a corporation for financial year 2022. It includes customer base for FY21 and target customers, target customers with average contract value greater than dollar 200k and above dollar 1M. Pitch your topic with ease and precision using this Organization Strategic Objectives And Target Commitments Dashboard Themes PDF. This layout presents information on Customers Average, Contract Value, Customers. It is also available for immediate download and adjustment. So, changes can be made in the color, design, graphics or any other component to create a unique layout.
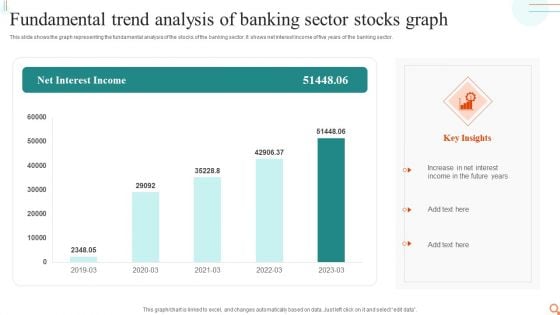
Fundamental Trend Analysis Of Banking Sector Stocks Graph Mockup PDF
This slide shows the graph representing the fundamental analysis of the stocks of the banking sector. It shows net interest income of five years of the banking sector.Pitch your topic with ease and precision using this Fundamental Trend Analysis Of Banking Sector Stocks Graph Mockup PDF. This layout presents information on Increase Interest, Income Future, Interest Income. It is also available for immediate download and adjustment. So, changes can be made in the color, design, graphics or any other component to create a unique layout.
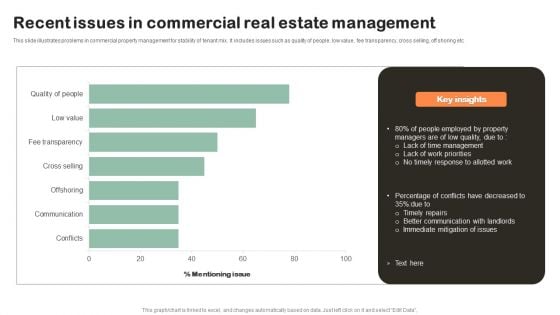
Recent Issues In Commercial Real Estate Management Ideas PDF
This slide illustrates problems in commercial property management for stability of tenant mix. It includes issues such as quality of people, low value, fee transparency, cross selling, off shoring etc. Pitch your topic with ease and precision using this Recent Issues In Commercial Real Estate Management Ideas PDF. This layout presents information on Management, Low Quality, Communication. It is also available for immediate download and adjustment. So, changes can be made in the color, design, graphics or any other component to create a unique layout.
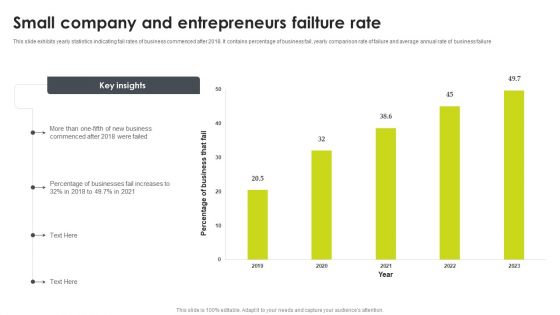
Small Company And Entrepreneurs Failture Rate Summary PDF
This slide exhibits yearly statistics indicating fail rates of business commenced after 2018. It contains percentage of business fail, yearly comparison rate of failure and average annual rate of business failure. Pitch your topic with ease and precision using this Small Company And Entrepreneurs Failture Rate Summary PDF. This layout presents information on Entrepreneurs Failture Rate, Business. It is also available for immediate download and adjustment. So, changes can be made in the color, design, graphics or any other component to create a unique layout.

Engineering Performance Metrics Dashboard To Track Pull Requests Background PDF
This slide covers engineering KPI dashboard to track pull request. It involves KPIs such as open time of average pull requests, average comment received, revision rounds, frequency of posting pull requests. Pitch your topic with ease and precision using this Engineering Performance Metrics Dashboard To Track Pull Requests Background PDF. This layout presents information on Dashboard Track Pull Requests, Engineering Performance Metrics. It is also available for immediate download and adjustment. So, changes can be made in the color, design, graphics or any other component to create a unique layout.
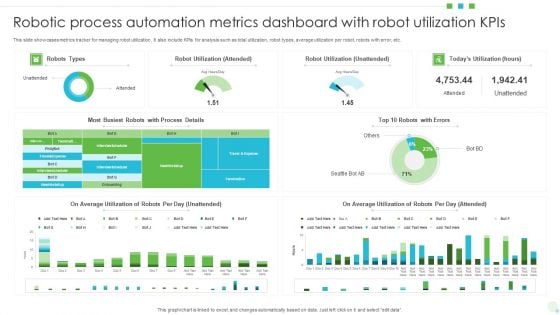
Robotic Process Automation Metrics Dashboard With Robot Utilization Kpis Background PDF
This slide showcases metrics tracker for managing robot utilization. It also include KPIs for analysis such as total utilization, robot types, average utilization per robot, robots with error, etc. Pitch your topic with ease and precision using this Robotic Process Automation Metrics Dashboard With Robot Utilization Kpis Background PDF. This layout presents information on Average Utilization, Robot Utilization, Automation Metrics Dashboard. It is also available for immediate download and adjustment. So, changes can be made in the color, design, graphics or any other component to create a unique layout.
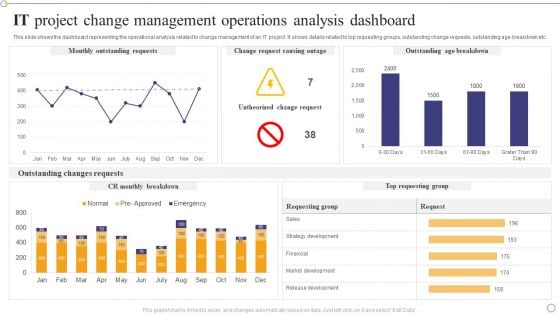
IT Project Change Management Operations Analysis Dashboard Infographics PDF
This slide shows the dashboard representing the operational analysis related to change management of an IT project. It shows details related to top requesting groups, outstanding change requests, outstanding age breakdown etc.Pitch your topic with ease and precision using this IT Project Change Management Operations Analysis Dashboard Infographics PDF. This layout presents information on Outstanding Requests, Outstanding Breakdown, Outstanding Changes. It is also available for immediate download and adjustment. So, changes can be made in the color, design, graphics or any other component to create a unique layout.
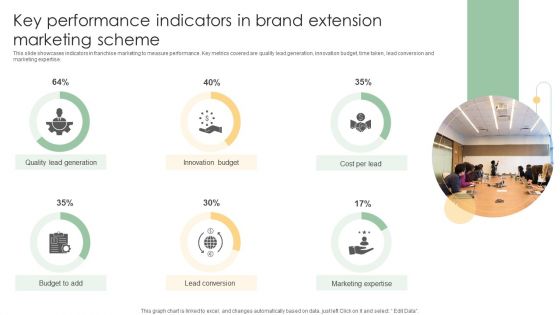
Key Performance Indicators In Brand Extension Marketing Scheme Ideas PDF
This slide showcases indicators in franchise marketing to measure performance. Key metrics covered are quality lead generation, innovation budget, time taken, lead conversion and marketing expertise.Pitch your topic with ease and precision using this Key Performance Indicators In Brand Extension Marketing Scheme Ideas PDF. This layout presents information on Quality Lead Generation, Innovation Budget, Lead Conversion. It is also available for immediate download and adjustment. So, changes can be made in the color, design, graphics or any other component to create a unique layout.
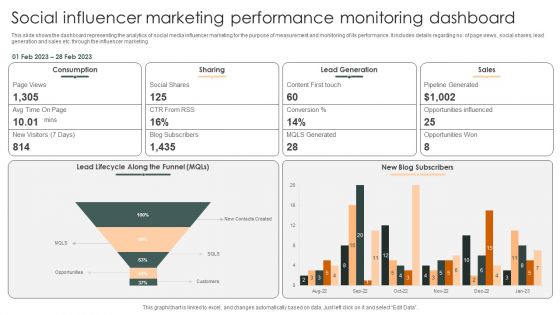
Social Influencer Marketing Performance Monitoring Dashboard Slides PDF
This slide shows the dashboard representing the analytics of social media influencer marketing for the purpose of measurement and monitoring of its performance. It includes details regarding no. of page views, social shares, lead generation and sales etc. through the influencer marketing.Pitch your topic with ease and precision using this Social Influencer Marketing Performance Monitoring Dashboard Slides PDF. This layout presents information on Lead Generation, Pipeline Generated, Opportunities Influenced. It is also available for immediate download and adjustment. So, changes can be made in the color, design, graphics or any other component to create a unique layout.
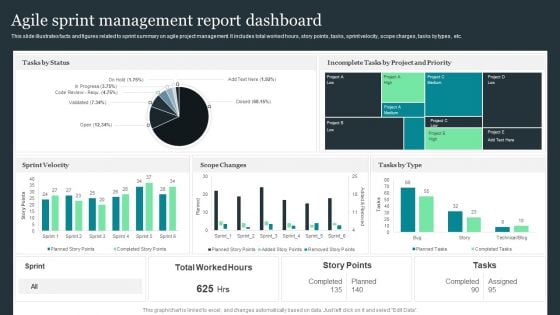
Agile Sprint Management Report Dashboard Pictures PDF
This slide illustrates facts and figures related to sprint summary on agile project management. It includes total worked hours, story points, tasks, sprint velocity, scope charges, tasks by types, etc. Pitch your topic with ease and precision using this Agile Sprint Management Report Dashboard Pictures PDF. This layout presents information on Tasks By Status, Sprint Velocity, Scope Changes. It is also available for immediate download and adjustment. So, changes can be made in the color, design, graphics or any other component to create a unique layout.
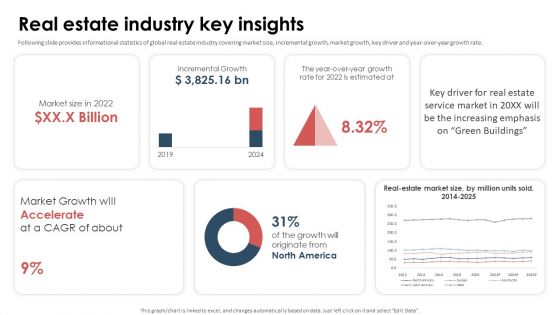
Series A Capital Funding Elevator Real Estate Industry Key Insights Ideas PDF
Following slide provides informational statistics of global real estate industry covering market size, incremental growth, market growth, key driver and year-over-year growth rate. Create an editable Series A Capital Funding Elevator Real Estate Industry Key Insights Ideas PDF that communicates your idea and engages your audience. Whether youre presenting a business or an educational presentation, pre-designed presentation templates help save time. Series A Capital Funding Elevator Real Estate Industry Key Insights Ideas PDF is highly customizable and very easy to edit, covering many different styles from creative to business presentations. Slidegeeks has creative team members who have crafted amazing templates. So, go and get them without any delay.
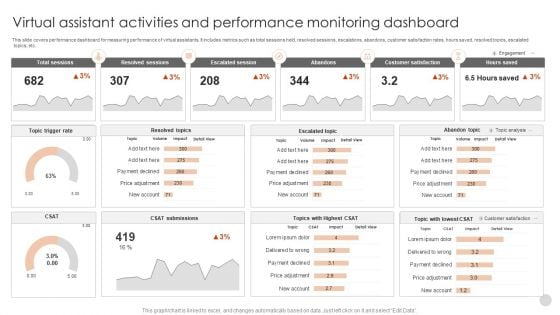
Virtual Assistant Activities And Performance Monitoring Dashboard Guidelines PDF
This slide covers performance dashboard for measuring performance of virtual assistants. It includes metrics such as total sessions held, resolved sessions, escalations, abandons, customer satisfaction rates, hours saved, resolved topics, escalated topics, etc.Pitch your topic with ease and precision using this Virtual Assistant Activities And Performance Monitoring Dashboard Guidelines PDF. This layout presents information on Total Sessions, Resolved Sessions, Escalated Session. It is also available for immediate download and adjustment. So, changes can be made in the color, design, graphics or any other component to create a unique layout.
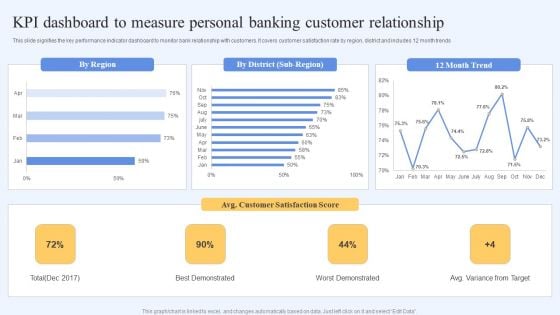
Kpi Dashboard To Measure Personal Banking Customer Relationship Themes PDF
This slide signifies the key performance indicator dashboard to monitor bank relationship with customers. It covers customer satisfaction rate by region, district and includes 12 month trends. Pitch your topic with ease and precision using this Kpi Dashboard To Measure Personal Banking Customer Relationship Themes PDF. This layout presents information on Customer Satisfaction, Best Demonstrated, Worst Demonstrated. It is also available for immediate download and adjustment. So, changes can be made in the color, design, graphics or any other component to create a unique layout.
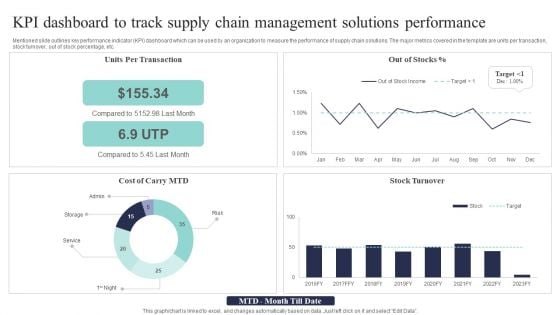
KPI Dashboard To Track Supply Chain Management Solutions Performance Background PDF
Mentioned slide outlines key performance indicator KPI dashboard which can be used by an organization to measure the performance of supply chain solutions. The major metrics covered in the template are units per transaction, stock turnover, out of stock percentage, etc. Pitch your topic with ease and precision using this KPI Dashboard To Track Supply Chain Management Solutions Performance Background PDF. This layout presents information on Per Transaction, Compared Last, Stock Turnover. It is also available for immediate download and adjustment. So, changes can be made in the color, design, graphics or any other component to create a unique layout.
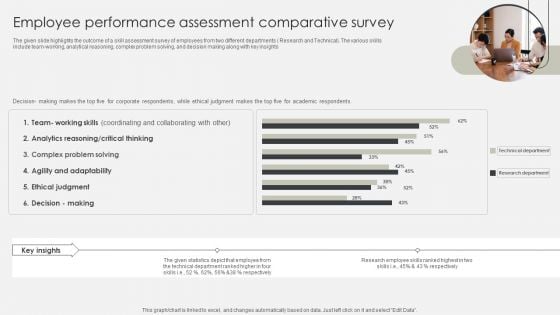
Employee Performance Assessment Comparative Survey Ideas PDF
The given slide highlights the outcome of a skill assessment survey of employees from two different departments Research and Technical. The various skills include team-working, analytical reasoning, complex problem solving, and decision making along with key insights. Pitch your topic with ease and precision using this Employee Performance Assessment Comparative Survey Ideas PDF. This layout presents information on Agility And Adaptability, Team, Research Department. It is also available for immediate download and adjustment. So, changes can be made in the color, design, graphics or any other component to create a unique layout.
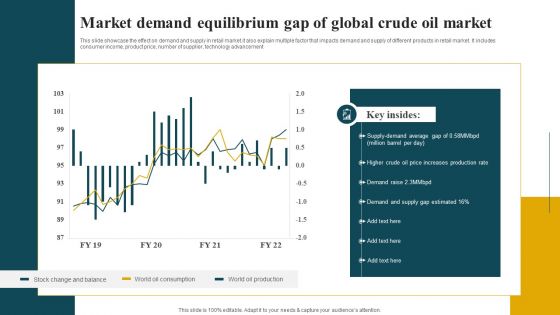
Market Demand Equilibrium Gap Of Global Crude Oil Market Diagrams PDF
This slide showcase the effect on demand and supply in retail market.it also explain multiple factor that impacts demand and supply of different products in retail market. It includes consumer income, product price, number of supplier, technology advancement. Pitch your topic with ease and precision using this Market Demand Equilibrium Gap Of Global Crude Oil Market Diagrams PDF. This layout presents information on Demand And Supply, Production Rate, Average. It is also available for immediate download and adjustment. So, changes can be made in the color, design, graphics or any other component to create a unique layout.
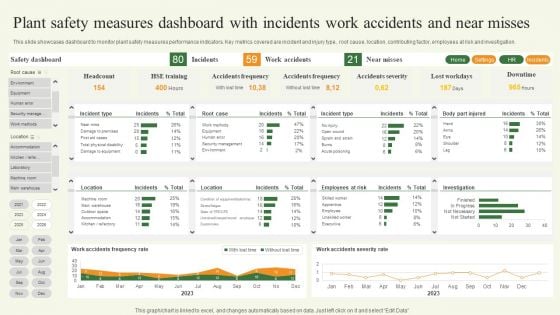
Plant Safety Measures Dashboard With Incidents Work Accidents And Near Misses Template PDF
This slide showcases dashboard to monitor plant safety measures performance indicators. Key metrics covered are incident and injury type, root cause, location, contributing factor, employees at risk and investigation. Pitch your topic with ease and precision using this Plant Safety Measures Dashboard With Incidents Work Accidents And Near Misses Template PDF. This layout presents information on Plant Safety Measures Dashboard, Incidents Work Accidents. It is also available for immediate download and adjustment. So, changes can be made in the color, design, graphics or any other component to create a unique layout.
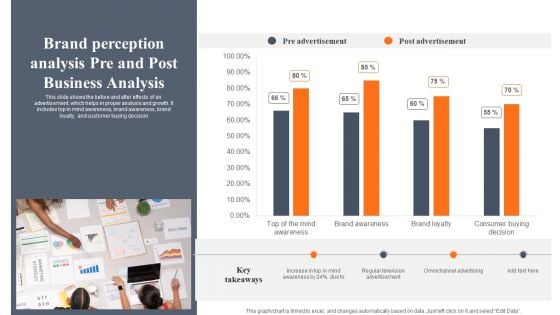
Brand Perception Analysis Pre And Post Business Analysis Designs PDF
This slide shows the before and after effects of an advertisement, which helps in proper analysis and growth. It includes top in mind awareness, brand awareness, brand loyalty, and customer buying decision. Pitch your topic with ease and precision using this Brand Perception Analysis Pre And Post Business Analysis Designs PDF. This layout presents information on Pre Advertisement, Post Advertisement, Awareness. It is also available for immediate download and adjustment. So, changes can be made in the color, design, graphics or any other component to create a unique layout.
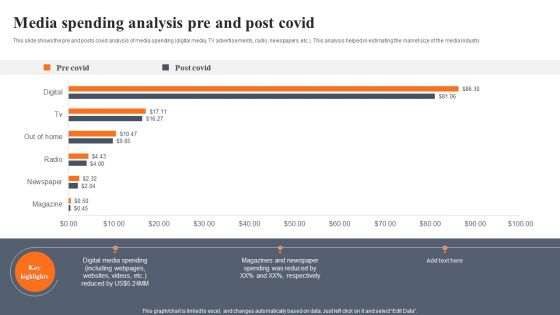
Media Spending Analysis Pre And Post Covid Elements PDF
This slide shows the pre and posts covid analysis of media spending digital media, TV advertisements, radio, newspapers, etc. This analysis helped in estimating the market size of the media industry. Pitch your topic with ease and precision using this Media Spending Analysis Pre And Post Covid Elements PDF. This layout presents information on Media Spending Analysis, Pre And Post Covid. It is also available for immediate download and adjustment. So, changes can be made in the color, design, graphics or any other component to create a unique layout.
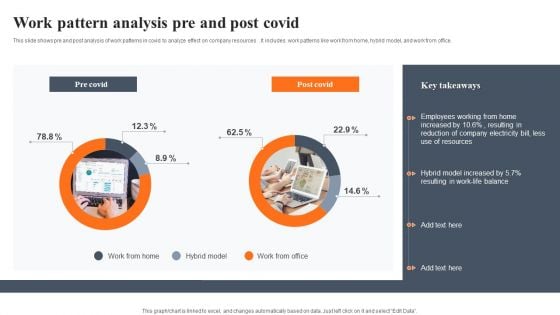
Work Pattern Analysis Pre And Post Covid Pictures PDF
This slide shows pre and post analysis of work patterns in covid to analyze effect on company resources . It includes work patterns like work from home, hybrid model, and work from office. Pitch your topic with ease and precision using this Work Pattern Analysis Pre And Post Covid Pictures PDF. This layout presents information on Work Pattern Analysis, Pre And Post Covid. It is also available for immediate download and adjustment. So, changes can be made in the color, design, graphics or any other component to create a unique layout.
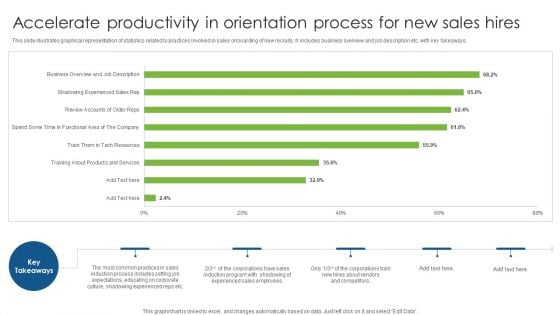
Accelerate Productivity In Orientation Process For New Sales Hires Structure PDF
This slide illustrates graphical representation of statistics related to practices involved in sales onboarding of new recruits. It includes business overview and job description etc. with key takeaways. Pitch your topic with ease and precision using this Accelerate Productivity In Orientation Process For New Sales Hires Structure PDF. This layout presents information on Accelerate Productivity In Orientation, Process For New, Sales Hires. It is also available for immediate download and adjustment. So, changes can be made in the color, design, graphics or any other component to create a unique layout.
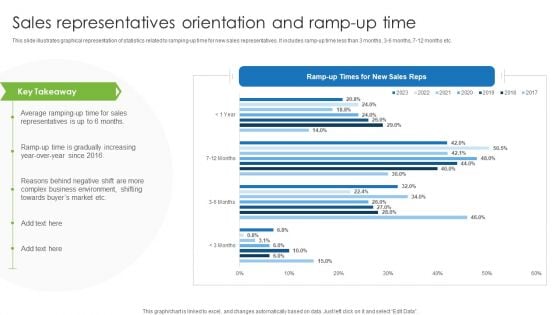
Sales Representatives Orientation And Ramp Up Time Summary PDF
This slide illustrates graphical representation of statistics related to ramping up time for new sales representatives. It includes ramp up time less than 3 months, 3 6 months, 7 12 months etc. Pitch your topic with ease and precision using this Sales Representatives Orientation And Ramp Up Time Summary PDF. This layout presents information on Sales Representatives Orientation, Ramp Up Time. It is also available for immediate download and adjustment. So, changes can be made in the color, design, graphics or any other component to create a unique layout.
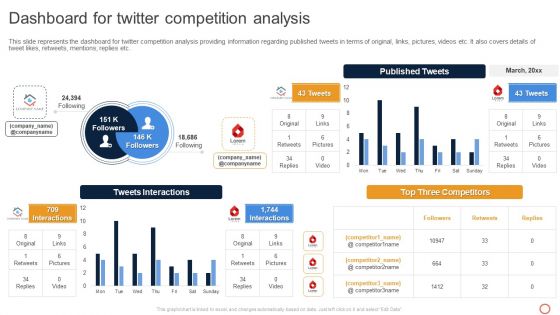
Leveraging Twitter For Social Dashboard For Twitter Competition Analysis Inspiration PDF
This slide represents the dashboard for twitter competition analysis providing information regarding published tweets in terms of original, links, pictures, videos etc. It also covers details of tweet likes, retweets, mentions, replies etc. From laying roadmaps to briefing everything in detail, our templates are perfect for you. You can set the stage with your presentation slides. All you have to do is download these easy-to-edit and customizable templates. Leveraging Twitter For Social Dashboard For Twitter Competition Analysis Inspiration PDF will help you deliver an outstanding performance that everyone would remember and praise you for. Do download this presentation today.
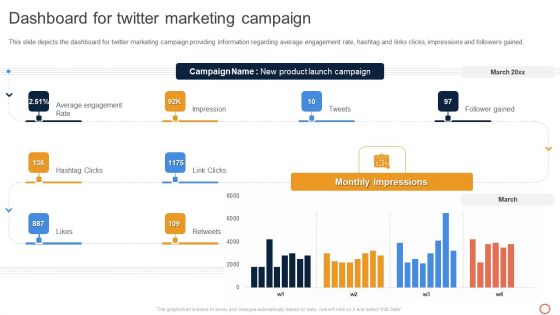
Leveraging Twitter For Social Dashboard For Twitter Marketing Campaign Summary PDF
This slide depicts the dashboard for twitter marketing campaign providing information regarding average engagement rate, hashtag and links clicks, impressions and followers gained. Present like a pro with Leveraging Twitter For Social Dashboard For Twitter Marketing Campaign Summary PDF Create beautiful presentations together with your team, using our easy-to-use presentation slides. Share your ideas in real-time and make changes on the fly by downloading our templates. So whether youre in the office, on the go, or in a remote location, you can stay in sync with your team and present your ideas with confidence. With Slidegeeks presentation got a whole lot easier. Grab these presentations today.
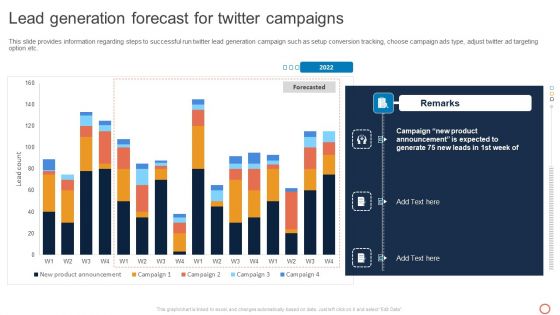
Leveraging Twitter For Social Lead Generation Forecast For Twitter Campaigns Download PDF
This slide provides information regarding steps to successful run twitter lead generation campaign such as setup conversion tracking, choose campaign ads type, adjust twitter ad targeting option etc. If your project calls for a presentation, then Slidegeeks is your go-to partner because we have professionally designed, easy-to-edit templates that are perfect for any presentation. After downloading, you can easily edit Leveraging Twitter For Social Lead Generation Forecast For Twitter Campaigns Download PDF and make the changes accordingly. You can rearrange slides or fill them with different images. Check out all the handy templates
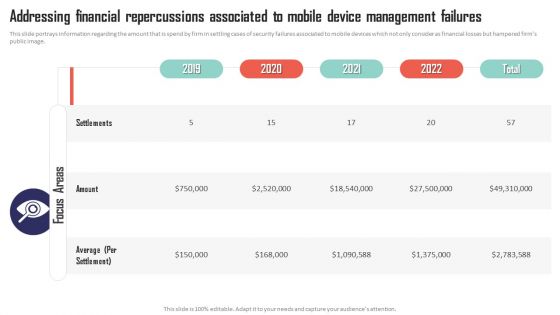
Addressing Financial Repercussions Associated To Mobile Device Management Failures Summary PDF
This slide portrays information regarding the amount that is spend by firm in settling cases of security failures associated to mobile devices which not only consider as financial losses but hampered firms public image. There are so many reasons you need a Addressing Financial Repercussions Associated To Mobile Device Management Failures Summary PDF. The first reason is you cant spend time making everything from scratch, Thus, Slidegeeks has made presentation templates for you too. You can easily download these templates from our website easily.
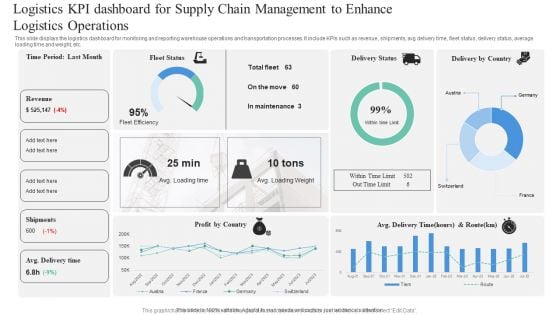
Logistics KPI Dashboard For Supply Chain Management To Enhance Logistics Operations Professional PDF
This slide displays the logistics dashboard for monitoring and reporting warehouse operations and transportation processes. It include KPIs such as revenue, shipments, avg delivery time, fleet status, delivery status, average loading time and weight, etc. Pitch your topic with ease and precision using this Logistics KPI Dashboard For Supply Chain Management To Enhance Logistics Operations Professional PDF. This layout presents information on Logistics KPI, Dashboard For Supply Chain, Management To Enhance, Logistics Operations. It is also available for immediate download and adjustment. So, changes can be made in the color, design, graphics or any other component to create a unique layout.
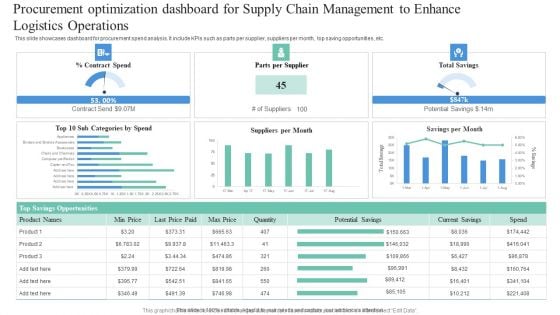
Procurement Optimization Dashboard For Supply Chain Management To Enhance Logistics Operations Elements PDF
This slide showcases dashboard for procurement spend analysis. It include KPIs such as parts per supplier, suppliers per month, top saving opportunities, etc. Pitch your topic with ease and precision using this Procurement Optimization Dashboard For Supply Chain Management To Enhance Logistics Operations Elements PDF. This layout presents information on Procurement Optimization Dashboard, Supply Chain Management, Enhance Logistic Operations. It is also available for immediate download and adjustment. So, changes can be made in the color, design, graphics or any other component to create a unique layout.
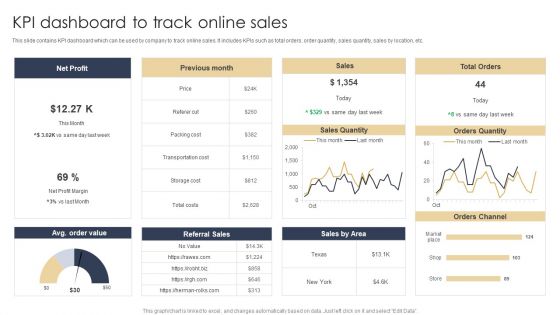
KPI Dashboard To Track Online Sales Structure PDF
This slide contains KPI dashboard which can be used by company to track online sales. It includes KPIs such as total orders, order quantity, sales quantity, sales by location, etc. Pitch your topic with ease and precision using this KPI Dashboard To Track Online Sales Structure PDF. This layout presents information on Net Profit, Sales, Orders Quantity. It is also available for immediate download and adjustment. So, changes can be made in the color, design, graphics or any other component to create a unique layout.
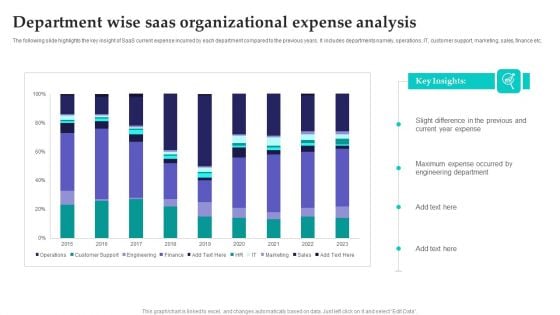
Department Wise Saas Organizational Expense Analysis Rules PDF
The following slide highlights the key insight of SaaS current expense incurred by each department compared to the previous years. It includes departments namely, operations, IT, customer support, marketing, sales, finance etc. Pitch your topic with ease and precision using this Department Wise Saas Organizational Expense Analysis Rules PDF. This layout presents information on Department Wise Saas Organizational, Expense Analysis. It is also available for immediate download and adjustment. So, changes can be made in the color, design, graphics or any other component to create a unique layout.
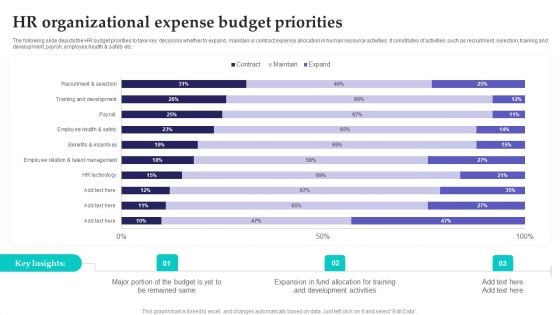
HR Organizational Expense Budget Priorities Template PDF
The following slide depicts the HR budget priorities to take key decisions whether to expand, maintain or contract expense allocation in human resource activities. It constitutes of activities such as recruitment, selection, training and development, payroll, employee health and safety etc. Pitch your topic with ease and precision using this HR Organizational Expense Budget Priorities Template PDF. This layout presents information on Budget, Development Activities, Fund Allocation. It is also available for immediate download and adjustment. So, changes can be made in the color, design, graphics or any other component to create a unique layout.
Project Tracking Bug And Progress Tracker Dashboard Elements PDF
The following slide showcases the progress status of project tracking activities to achieve objectives. It constitutes of elements such as number of projects, features, work items, number of bugs along with the progress status etc. Pitch your topic with ease and precision using this Project Tracking Bug And Progress Tracker Dashboard Elements PDF. This layout presents information on Project Tracking, Progress Tracker Dashboard. It is also available for immediate download and adjustment. So, changes can be made in the color, design, graphics or any other component to create a unique layout.

Quarterly Financial Report With Profit And Loss Statement Themes PDF
This slide shows quarter on quarter revenue and profit status to analyze companys efficiency at generating sales. It further include key financials such as depreciation and amortization expenses, profit before tax and attributable to shareholders, etc. Pitch your topic with ease and precision using this Quarterly Financial Report With Profit And Loss Statement Themes PDF. This layout presents information on Quarterly Financial Report, Profit And Loss Statement. It is also available for immediate download and adjustment. So, changes can be made in the color, design, graphics or any other component to create a unique layout.
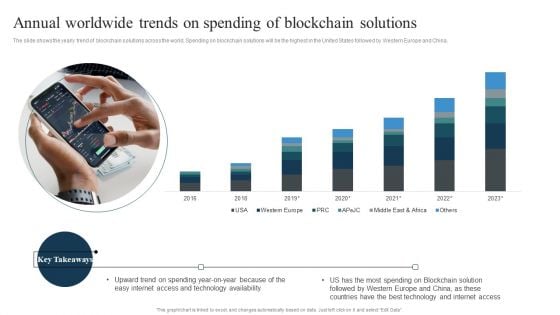
Annual Worldwide Trends On Spending Of Blockchain Solutions Introduction PDF
The slide shows the yearly trend of blockchain solutions across the world. Spending on blockchain solutions will be the highest in the United States followed by Western Europe and China.Pitch your topic with ease and precision using this Annual Worldwide Trends On Spending Of Blockchain Solutions Introduction PDF. This layout presents information on Technology Availability, Upward Trend Spending, Technology Internet Access. It is also available for immediate download and adjustment. So, changes can be made in the color, design, graphics or any other component to create a unique layout.


 Continue with Email

 Home
Home


