Control Chart
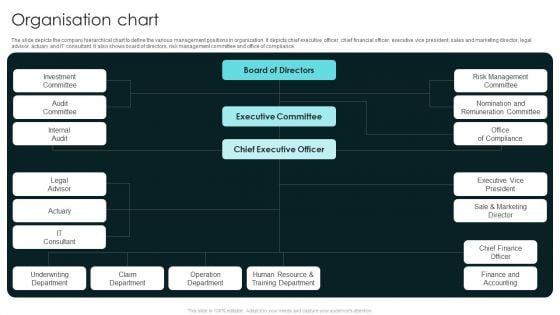
Term Life And General Insurance Company Profile Organisation Chart Formats PDF
The slide depicts the company hierarchical chart to define the various management positions in organization. It depicts chief executive officer, chief financial officer, executive vice president, sales and marketing director, legal advisor, actuary and IT consultant. It also shows board of directors, risk management committee and office of compliance. Deliver and pitch your topic in the best possible manner with this Term Life And General Insurance Company Profile Organisation Chart Formats PDF. Use them to share invaluable insights on Executive Committee, Chief Executive Officer, Risk Management Committee and impress your audience. This template can be altered and modified as per your expectations. So, grab it now.
Business Diagram Pie Chart With Icons For Result Analysis Presentation Template
This business slide contains graphics of pie chart with business icons. Download this impressive diagram to present marketing performance measurement. This image slide is best to present your newer thoughts.
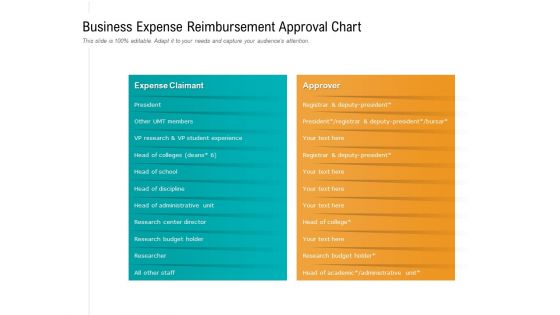
Business Expense Reimbursement Approval Chart Ppt PowerPoint Presentation Inspiration Shapes PDF
Presenting this set of slides with name business expense reimbursement approval chart ppt powerpoint presentation inspiration shapes pdf. The topics discussed in these slides are expense claimant, approver, president, vp research and vp student experience, head of administrative unit, research center director. This is a completely editable PowerPoint presentation and is available for immediate download. Download now and impress your audience.
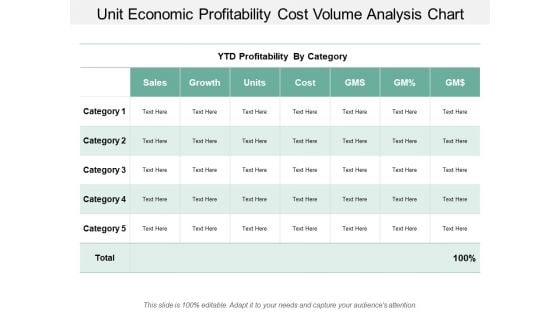
Unit Economic Profitability Cost Volume Analysis Chart Ppt PowerPoint Presentation Styles Graphics Design
This is a unit economic profitability cost volume analysis chart ppt powerpoint presentation styles graphics design. This is a five stage process. The stages in this process are business unit profitability, profitable organization, corporate unit profitability.
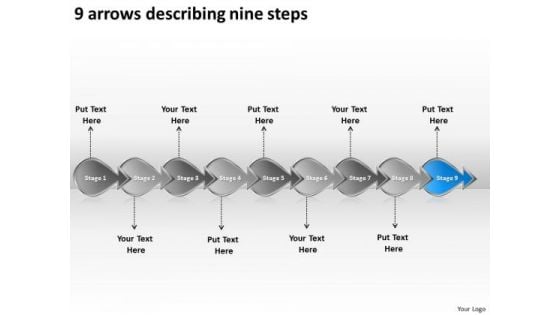
9 Arrows Describing Nine Steps Ppt Flow Chart Creator Online PowerPoint Templates
We present our 9 arrows describing nine steps ppt flow chart creator online PowerPoint templates.Use our Arrows PowerPoint Templates because this diagram has the unique ability to drive home your ideas and show how they mesh to guarantee success. Download and present our Business PowerPoint Templates because your thoughts are pointed and sharp as arrows. Download and present our Competition PowerPoint Templates because you will be able to Highlight the various ways in which we can maintain its efficiency. Download our Design PowerPoint Templates because this slide shows each path to the smallest detail. Use our Shapes PowerPoint Templates because it shows you the vision of a desired destination and the best road to take to reach that goal.Use these PowerPoint slides for presentations relating to arrow, arrows, block, business, chart, design, development, diagram, direction, element, flow, flowchart, graph, linear, management, organization, process, program, section, sign, solution, symbol. The prominent colors used in the PowerPoint template are Blue, Gray, Black. Professionals tell us our 9 arrows describing nine steps ppt flow chart creator online PowerPoint templates are Fancy. The feedback we get is that our chart PowerPoint templates and PPT Slides are Vintage. We assure you our 9 arrows describing nine steps ppt flow chart creator online PowerPoint templates are Romantic. Customers tell us our chart PowerPoint templates and PPT Slides are Multicolored. Presenters tell us our 9 arrows describing nine steps ppt flow chart creator online PowerPoint templates are Cheerful. People tell us our design PowerPoint templates and PPT Slides are Adorable. Become a leader with our 9 Arrows Describing Nine Steps Ppt Flow Chart Creator Online PowerPoint Templates. You will come out on top.
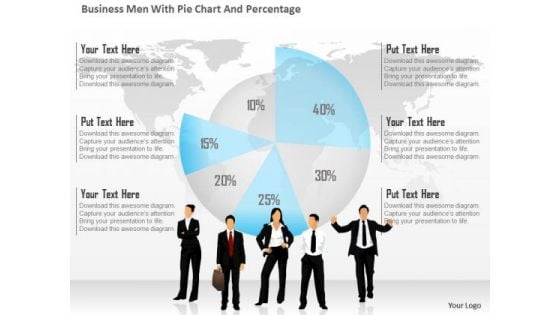
Business Diagram Business Men With Pie Chart And Percentage Presentation Template
This business diagram has been designed with graphic of business people and pie chart with percentage. This diagram is designed to depict team meeting on financial matter. This diagram offers a way for your audience to visually conceptualize the process.
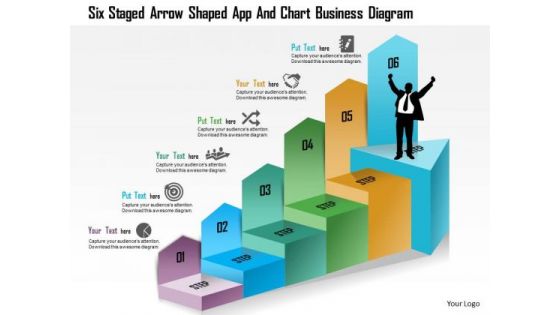
Business Diagram Six Staged Arrow Shaped App And Chart Business Diagram Presentation Template
Six staged arrow shaped aap and chart has been used to decorate this power point template. This PPT contains the concept of text representation. This PPT can be used for business and technology related topics in any presentation.
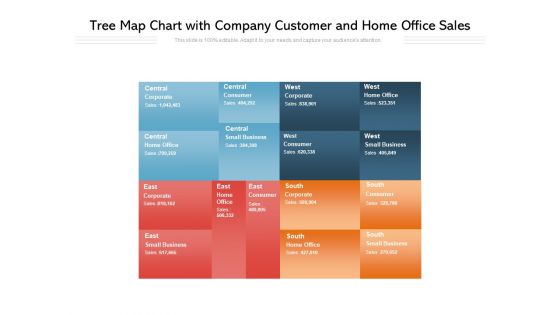
Tree Map Chart With Company Customer And Home Office Sales Ppt PowerPoint Presentation Summary Layout Ideas
Showcasing this set of slides titled tree map chart with company customer and home office sales ppt powerpoint presentation summary layout ideas. The topics addressed in these templates are corporate, consumer, small business, home office . All the content presented in this PPT design is completely editable. Download it and make adjustments in color, background, font etc. as per your unique business setting.
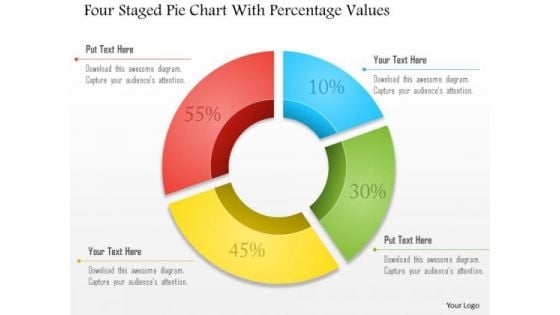
Business Diagram Four Staged Pie Chart With Percentage Values Presentation Template
Four staged pie chart and percentage values are used to design this business slide. Download this diagram to make business and financial reports. Use our above diagram to express information in a visual way.
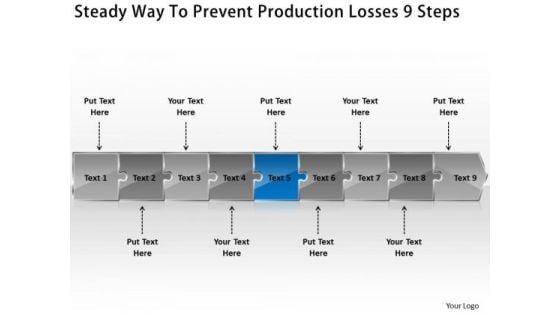
Steady Way To Prevent Production Losses 9 Steps What Is Flow Chart Used For PowerPoint Slides
We present our steady way to prevent production losses 9 steps what is flow chart used for PowerPoint Slides.Use our Arrows PowerPoint Templates because,you have the ability to judge Which out of late have been proving to be a hassle. Use our Leadership PowerPoint Templates because,This diagram can be used to illustrate the logical path or system Use our Business PowerPoint Templates because, A brainwave has occurred to you after review. You know just how to push the graph skyward Use our Symbol PowerPoint Templates because,This one depicts the popular chart. Use our Process and Flows PowerPoint Templates because,Your business and plans for its growth consist of processes that are highly co-related.Use these PowerPoint slides for presentations relating to Abstract, Action, Attach, Box, Business, Center, Chain, Chart, Color, Communication, Concept, Connection, Cube, Cycle, Data, Diagram, Flow, Globe, Horizontal, Idea, Illustration, Information, Interaction, Jigsaw, Join, Link, Pieces, Process, Puzzle, Relation, Relationship, Shape, Success. The prominent colors used in the PowerPoint template are Blue, Black, Gray. People tell us our steady way to prevent production losses 9 steps what is flow chart used for PowerPoint Slides are Royal. PowerPoint presentation experts tell us our Chart PowerPoint templates and PPT Slides are Great. PowerPoint presentation experts tell us our steady way to prevent production losses 9 steps what is flow chart used for PowerPoint Slides are Graceful. Professionals tell us our Center PowerPoint templates and PPT Slides are Amazing. Professionals tell us our steady way to prevent production losses 9 steps what is flow chart used for PowerPoint Slides are readymade to fit into any presentation structure. People tell us our Business PowerPoint templates and PPT Slides are Glamorous. Address problems with our Steady Way To Prevent Production Losses 9 Steps What Is Flow Chart Used For PowerPoint Slides. Download without worries with our money back guaranteee.
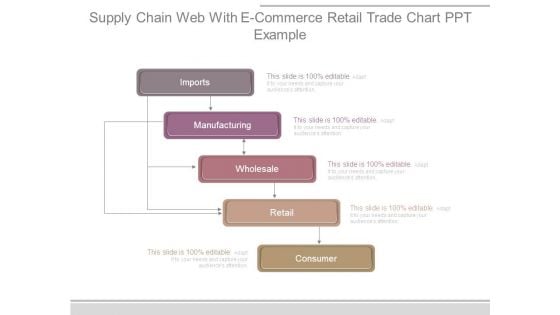
Supply Chain Web With E Commerce Retail Trade Chart Ppt Example
This is a supply chain web with e commerce retail trade chart ppt example. This is a five stage process. The stages in this process are imports, manufacturing, wholesale, retail, consumer.
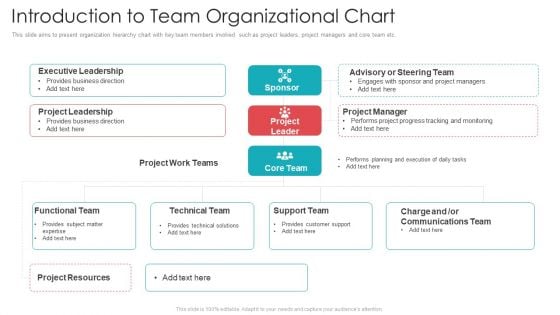
Official Team Collaboration Plan Introduction To Team Organizational Chart Ideas PDF
This slide aims to present organization hierarchy chart with key team members involved such as project leaders, project managers and core team etc. Deliver an awe-inspiring pitch with this creative official team collaboration plan introduction to team organizational chart ideas pdf bundle. Topics like functional team, technical team, support team, project resources, communications team can be discussed with this completely editable template. It is available for immediate download depending on the needs and requirements of the user.
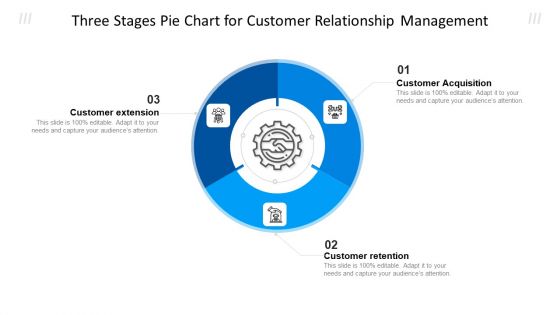
Three Stages Pie Chart For Customer Relationship Management Ppt Outline Structure PDF
Presenting three stages pie chart for customer relationship management ppt outline structure pdf to dispense important information. This template comprises three stages. It also presents valuable insights into the topics including customer acquisition, customer retention, customer extension. This is a completely customizable PowerPoint theme that can be put to use immediately. So, download it and address the topic impactfully.
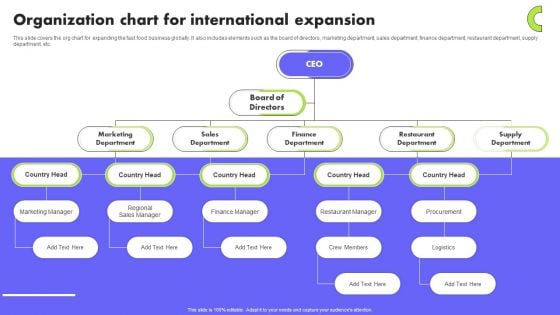
Planning Transnational Technique To Improve International Scope Organization Chart For International Expansion Introduction PDF
This slide covers the org chart for expanding the fast food business globally. It also includes elements such as the board of directors, marketing department, sales department, finance department, restaurant department, supply department, etc. Are you searching for a Planning Transnational Technique To Improve International Scope Organization Chart For International Expansion Introduction PDF that is uncluttered, straightforward, and original Its easy to edit, and you can change the colors to suit your personal or business branding. For a presentation that expresses how much effort you have put in, this template is ideal. With all of its features, including tables, diagrams, statistics, and lists, its perfect for a business plan presentation. Make your ideas more appealing with these professional slides. Download Planning Transnational Technique To Improve International Scope Organization Chart For International Expansion Introduction PDF from Slidegeeks today.
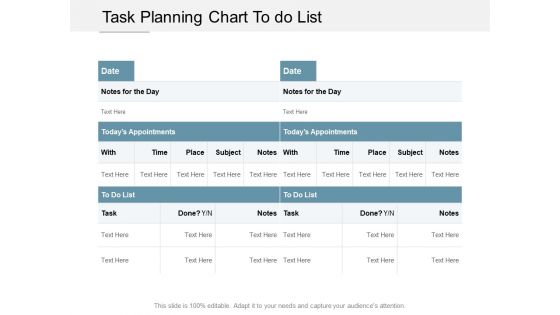
Task Planning Chart To Do List Ppt PowerPoint Presentation Infographics Picture Cpb
This is a task planning chart to do list ppt powerpoint presentation infographics picture cpb. This is a three stage process. The stages in this process are key activities, key highlights, list of activities.
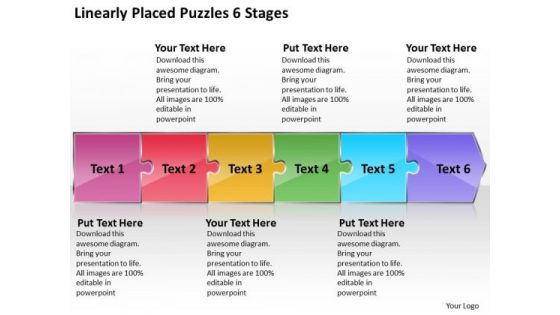
Linearly Placed Puzzles 6 Stages Work Process Flow Chart PowerPoint Slides
We present our linearly placed puzzles 6 stages work process flow chart PowerPoint Slides.Use our Business PowerPoint Templates because, You have analysed many global markets and come up with possibilities. Highlight the pros and cons of other likely business oppurtunities Use our Puzzles or Jigsaws PowerPoint Templates because,This diagram helps you to develop your marketing strategy and communicate your enthusiasm and motivation to raise the bar. Use our Shapes PowerPoint Templates because, You have churned your mind and come up with effective ways and means to further refine it. Use our Arrows PowerPoint Templates because, You understand how each drives the next to motor the entire sequence. Use our Process and Flows PowerPoint Templates because,You require care and diligence to function well.Use these PowerPoint slides for presentations relating to abstract, arrow, arrows, business, chart, design, development, diagram, direction, element, flow, flowchart, graph, linear, management, model, motion, organization, plan, process, program, section, segment, set, sign, solution, strategy, symbol, technology. The prominent colors used in the PowerPoint template are Pink, Yellow, Red. People tell us our linearly placed puzzles 6 stages work process flow chart PowerPoint Slides are Fancy. The feedback we get is that our business PowerPoint templates and PPT Slides are Tasteful. People tell us our linearly placed puzzles 6 stages work process flow chart PowerPoint Slides are Excellent. Presenters tell us our diagram PowerPoint templates and PPT Slides will make the presenter successul in his career/life. The feedback we get is that our linearly placed puzzles 6 stages work process flow chart PowerPoint Slides have awesome images to get your point across. Professionals tell us our business PowerPoint templates and PPT Slides are Liberated. Start driving customer loyalty initiatives with our Linearly Placed Puzzles 6 Stages Work Process Flow Chart PowerPoint Slides. They will make you look good.
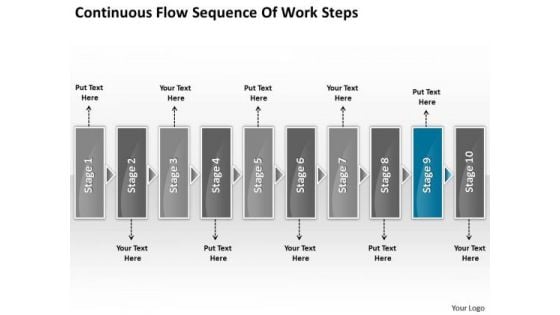
Continuous Flow Sequence Of Work Steps Business Chart For Process PowerPoint Slides
We present our continuous flow sequence of work steps business chart for process PowerPoint Slides.Use our Advertising PowerPoint Templates because you can Raise your Company stocks at the Opening Bell. Download and present our Success PowerPoint Templates because the success of your venture depends on the performance of every team member. Present our Business PowerPoint Templates because your thoughts are pointed and sharp as arrows. Use our Boxes PowerPoint Templates because leading from the front is your preferred style. Download our Arrows PowerPoint Templates because the concept and strategy is your strength.Use these PowerPoint slides for presentations relating to Arrow, Chart, Concept, Connection, Diagram, Direction, Duplicate, Flow, Four, Manage, Method, Order, Phase, Presentation, Procedure, Process, React, Recycle, Refresh, Relate, Repeat, Repetition, Report, Review, Ring, Rotation, Round, Section, Sequence, Simple, Stage, Step, Strategy, Success. The prominent colors used in the PowerPoint template are Blue, Gray, Black. Customers tell us our continuous flow sequence of work steps business chart for process PowerPoint Slides are Nice. You can be sure our Duplicate PowerPoint templates and PPT Slides are visually appealing. Presenters tell us our continuous flow sequence of work steps business chart for process PowerPoint Slides are Festive. Professionals tell us our Flow PowerPoint templates and PPT Slides are Royal. Presenters tell us our continuous flow sequence of work steps business chart for process PowerPoint Slides help you meet deadlines which are an element of today's workplace. Just browse and pick the slides that appeal to your intuitive senses. Professionals tell us our Concept PowerPoint templates and PPT Slides will get their audience's attention. Benefit from diverse contributions with our Continuous Flow Sequence Of Work Steps Business Chart For Process PowerPoint Slides. They contain the best from all around.
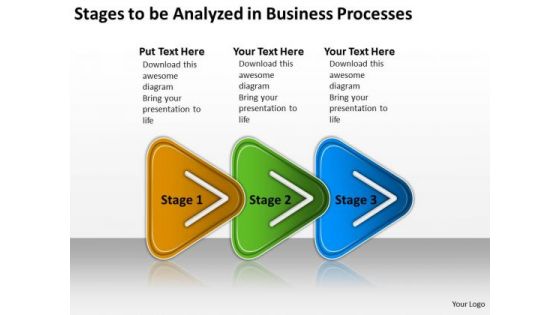
Be Analyzed In Business PowerPoint Theme Processes Flow Chart Creator Online Templates
We present our be analyzed in business powerpoint theme processes flow chart creator online templates.Download our Arrows PowerPoint Templates because our PowerPoint templates give this step by step process to acheive the aim. Download our Marketing PowerPoint Templates because networking is an imperative in todays world. You need to access the views of others. Similarly you need to give access to them of your abilities. Download our Success PowerPoint Templates because your quest has taken you well onto the path of success. Present our Process and Flows PowerPoint Templates because clear thnking is your strength, transmit your thoughts to your eager team. Use our Business PowerPoint Templates because the fruits of your labour are beginning to show.Enlighten them on the great plans you have for their enjoyment.Use these PowerPoint slides for presentations relating to Abstract, Arrow, Arrows, Business, Chart, Design, Development, Diagram, Direction, Element, Flow, Flowchart, Graph, Linear, Management, Model, Motion, Organization, Plan, Process, Program, Section, Segment, Set, Sign, Solution, Strategy, Symbol, Technology. The prominent colors used in the PowerPoint template are Blue, Green, Yellow. Customers tell us our be analyzed in business powerpoint theme processes flow chart creator online templates are Precious. The feedback we get is that our Chart PowerPoint templates and PPT Slides are Wistful. Professionals tell us our be analyzed in business powerpoint theme processes flow chart creator online templates are Second to none. People tell us our Arrows PowerPoint templates and PPT Slides are Tranquil. Customers tell us our be analyzed in business powerpoint theme processes flow chart creator online templates are Colorful. Professionals tell us our Diagram PowerPoint templates and PPT Slides are Dynamic. Beat the crowd with our Be Analyzed In Business PowerPoint Theme Processes Flow Chart Creator Online Templates. You will come out on top.
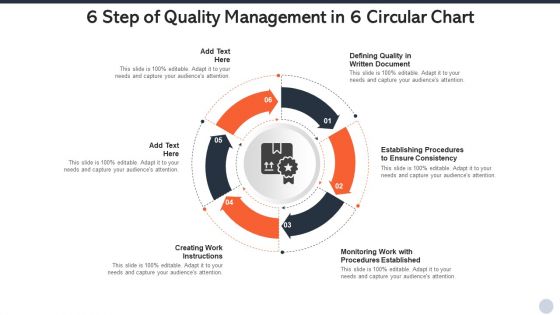
6 Step Of Quality Management In 6 Circular Chart Rules PDF
Presenting 6 step of quality management in 6 circular chart rules pdf to dispense important information. This template comprises six stages. It also presents valuable insights into the topics including monitoring, creating work instructions, procedures to ensure consistency. This is a completely customizable PowerPoint theme that can be put to use immediately. So, download it and address the topic impactfully.
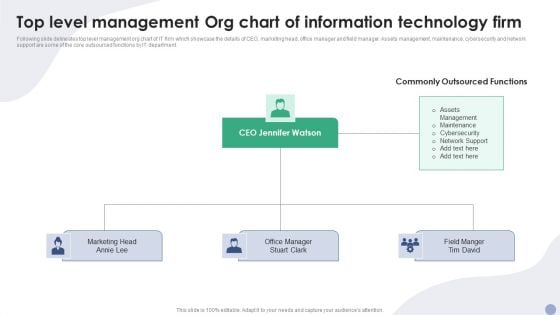
Top Level Management Org Chart Of Information Technology Firm Ppt Summary Slide Download PDF
Following slide delineates top level management org chart of IT firm which showcase the details of CEO, marketing head, office manager and field manager. Assets management, maintenance, cybersecurity and network support are some of the core outsourced functions by IT department. Presenting Top Level Management Org Chart Of Information Technology Firm Ppt Summary Slide Download PDF to dispense important information. This template comprises four stages. It also presents valuable insights into the topics including Marketing Head, CEO Jennifer Watson, Office Manager. This is a completely customizable PowerPoint theme that can be put to use immediately. So, download it and address the topic impactfully.
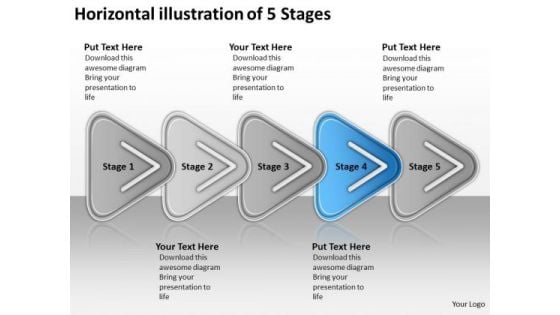
Horizontal Illustration Of 5 Stages Flowchart Order Process Flow Chart PowerPoint Slides
We present our horizontal illustration of 5 stages flowchart order process flow chart PowerPoint Slides.Use our Arrows PowerPoint Templates because this slide illuminates the spiritual brilliance of Jesus and showers the love for mankind he showed even while being crucified. Present our Shapes PowerPoint Templates because your findings are here to help arrive at an accurate diagnosis. Present our Business PowerPoint Templates because your group can behave steady in the top bracket. Present our Signs PowerPoint Templates because you understand the ailment and how to fight it. Present our Process and Flows PowerPoint Templates because it enlightens your team and colleagues on the critical factors involved.Use these PowerPoint slides for presentations relating to abstract, arrow, blank, business, chart, circular, circulation, concept, conceptual, design, diagram, executive, flow, horizontal, icon, idea, illustration, management, model, numbers, organization, process, progression, resource, sequence, stages, steps, strategy. The prominent colors used in the PowerPoint template are Blue, Gray, White. The feedback we get is that our horizontal illustration of 5 stages flowchart order process flow chart PowerPoint Slides are Wistful. PowerPoint presentation experts tell us our concept PowerPoint templates and PPT Slides are Spiffy. People tell us our horizontal illustration of 5 stages flowchart order process flow chart PowerPoint Slides are Chic. Professionals tell us our concept PowerPoint templates and PPT Slides are Bold. You can be sure our horizontal illustration of 5 stages flowchart order process flow chart PowerPoint Slides are topically designed to provide an attractive backdrop to any subject. We assure you our chart PowerPoint templates and PPT Slides are Youthful. Address the need of the hour with our Horizontal Illustration Of 5 Stages Flowchart Order Process Flow Chart PowerPoint Slides. Deliver your ideas at the right time.
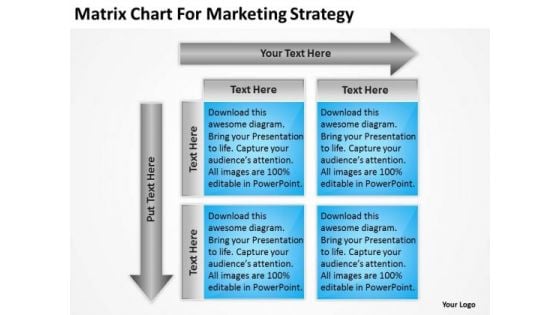
Matrix Chart For Marketing Strategy Ppt Business Proposal Examples PowerPoint Slides
Analyse ailments on our matrix chart for marketing strategy ppt business proposal examples PowerPoint Slides. Bring out the thinking doctor in you. Dock your thoughts with our Boxes Powerpoint templates. They will launch them into orbit. Get out of the dock with our Arrows Powerpoint templates. Your mind will be set free. Get classy with our Matrix Chart For Marketing Strategy Ppt Business Proposal Examples PowerPoint Slides. They ensure A-list clients.
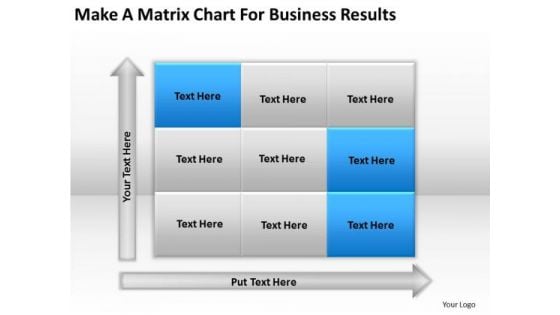
Make Matrix Chart For Business Results Ppt Realtor Plan PowerPoint Templates
However dull the topic maybe. Our make matrix chart for business results ppt realtor plan PowerPoint templates will arouse interest. Ask for assistance from our Boxes Powerpoint templates. You will be duly satisfied. Dump your doubt in the trash bin. Get certitude with our Arrows Powerpoint templates. Bend it better with our Make Matrix Chart For Business Results Ppt Realtor Plan PowerPoint Templates. Your thoughts will hit the correct curve.
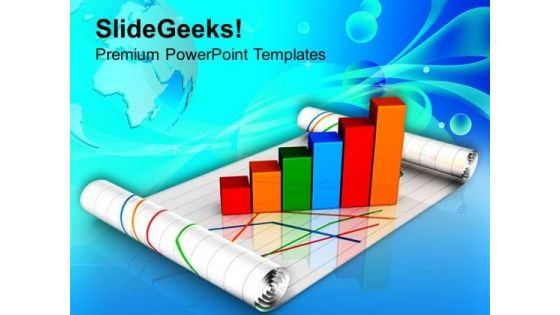
Business Growth Graph With Chart Success PowerPoint Templates Ppt Backgrounds For Slides 0613
Our Business Growth Graph With Chart Success PowerPoint Templates PPT Backgrounds For Slides deliver at your doorstep. Let them in for a wonderful experience. Dig out the dope with our Finance PowerPoint Templates. Your thoughts will expose the truth. Knock on the door to success with our Marketing PowerPoint Templates. Be assured of gaining entry. Ensure success with our Business Growth Graph With Chart Success PowerPoint Templates Ppt Backgrounds For Slides 0613. Download without worries with our money back guaranteee.
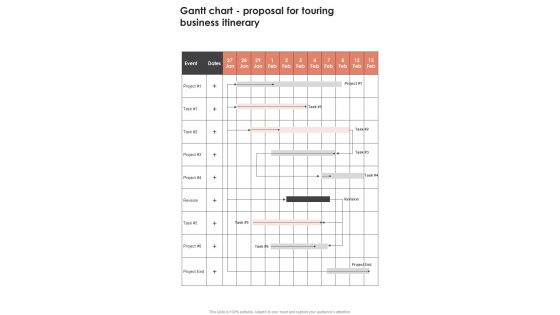
Gantt Chart Proposal For Touring Business Itinerary One Pager Sample Example Document
Presenting you an exemplary Gantt Chart Proposal For Touring Business Itinerary One Pager Sample Example Document Our one pager comprises all the must have essentials of an inclusive document. You can edit it with ease, as its layout is completely editable. With such freedom, you can tweak its design and other elements to your requirements. Download this Gantt Chart Proposal For Touring Business Itinerary One Pager Sample Example Document brilliant piece now.
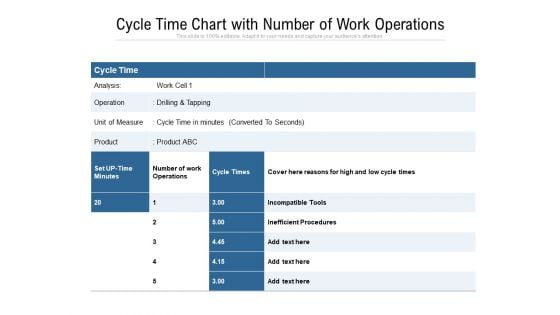
Cycle Time Chart With Number Of Work Operations Ppt PowerPoint Presentation Pictures Information PDF
Pitch your topic with ease and precision using this cycle time chart with number of work operations ppt powerpoint presentation pictures information pdf. This layout presents information on analysis, operation, product, inefficient procedures, drilling and tapping. It is also available for immediate download and adjustment. So, changes can be made in the color, design, graphics or any other component to create a unique layout.
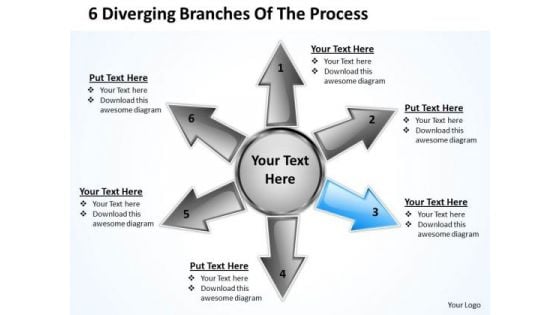
6 Diverging Branches Of The Process Relative Circular Arrow Chart PowerPoint Templates
We present our 6 diverging branches of the process Relative Circular Arrow Chart PowerPoint templates.Download and present our Communication PowerPoint Templates because it can convey all the options that present themselves. Use our Business PowerPoint Templates because you are ready to flap your wings and launch off. All poised are you to touch the sky with glory. Present our Process and Flows PowerPoint Templates because you can expound on how you plan to gain their confidence and assure them of continued and consistent excellence in quality of service. Download and present our Shapes PowerPoint Templates because they are Gauranteed to focus the minds of your team. Present our Arrows PowerPoint Templates because there is a crucial aspect that requires extra attention.Use these PowerPoint slides for presentations relating to Arrow, Brochure, Business, Chart, Circle, Cyclic, Data, Diagram, Financial, Goal, Graph, Illustration, Info, Information, Investment, Manage, Marketing, Model, Option, Part, Pie, Presentation, Process, Result, Sphere, Statistics, Stock, Strategy, Template, Wheel. The prominent colors used in the PowerPoint template are Blue, Gray, Black. The feedback we get is that our 6 diverging branches of the process Relative Circular Arrow Chart PowerPoint templates are the best it can get when it comes to presenting. People tell us our Cyclic PowerPoint templates and PPT Slides are Dazzling. Presenters tell us our 6 diverging branches of the process Relative Circular Arrow Chart PowerPoint templates are One-of-a-kind. Use our Circle PowerPoint templates and PPT Slides are Fancy. Use our 6 diverging branches of the process Relative Circular Arrow Chart PowerPoint templates are Majestic. Use our Chart PowerPoint templates and PPT Slides are designed by a team of presentation professionals. Play your cards well with our 6 Diverging Branches Of The Process Relative Circular Arrow Chart PowerPoint Templates. Give your thoughts a good deal.
Product Features Comparison Chart With Icons Ppt Powerpoint Presentation Portfolio Diagrams
This is a product features comparison chart with icons ppt powerpoint presentation portfolio diagrams. This is a four stage process. The stages in this process are product differentiation, product comparison, brand differentiation.
Demonstration Icon Man Showing Bar Chart Ppt Powerpoint Presentation Styles Ideas
This is a demonstration icon man showing bar chart ppt powerpoint presentation styles ideas. This is a three stage process. The stages in this process are illustration, show, demo.
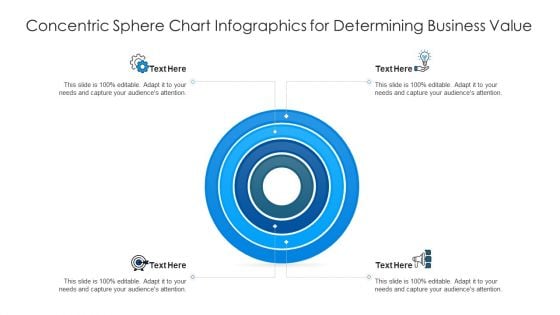
Concentric Sphere Chart Infographics For Determining Business Value Ppt Professional Template PDF
Persuade your audience using this concentric sphere chart infographics for determining business value ppt professional template pdf. This PPT design covers four stages, thus making it a great tool to use. It also caters to a variety of topics including concentric sphere chart infographics for determining business value. Download this PPT design now to present a convincing pitch that not only emphasizes the topic but also showcases your presentation skills.
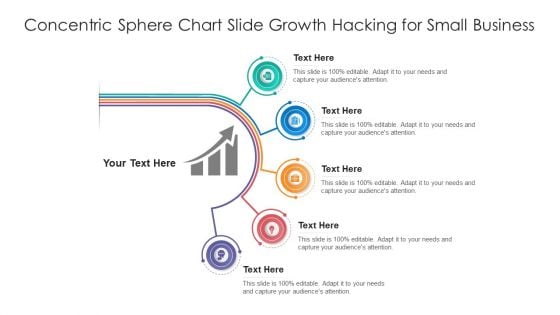
Concentric Sphere Chart Slide Growth Hacking For Small Business Ppt Ideas Designs PDF
Persuade your audience using this concentric sphere chart slide growth hacking for small business ppt ideas designs pdf. This PPT design covers five stages, thus making it a great tool to use. It also caters to a variety of topics including concentric sphere chart slide growth hacking for small business. Download this PPT design now to present a convincing pitch that not only emphasizes the topic but also showcases your presentation skills.
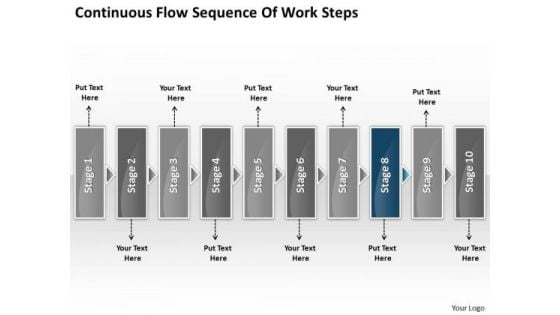
Continuous Flow Sequence Of Work Steps Chart For Process PowerPoint Slides
We present our continuous flow sequence of work steps chart for process PowerPoint Slides.Download our Advertising PowerPoint Templates because to achieve sureshot success you need to come together at the right time, place and manner. Download and present our Success PowerPoint Templates because the success of your venture depends on the performance of every team member. Present our Business PowerPoint Templates because this slide will fire away with all the accuracy at your command. Download our Boxes PowerPoint Templates because to achieve sureshot success you need to come together at the right time, place and manner. Download and present our Arrows PowerPoint Templates because it gives a core idea about various enveloping layers.Use these PowerPoint slides for presentations relating to Arrow, Chart, Concept, Connection, Diagram, Direction, Duplicate, Flow, Four, Manage, Method, Order, Phase, Presentation, Procedure, Process, React, Recycle, Refresh, Relate, Repeat, Repetition, Report, Review, Ring, Rotation, Round, Section, Sequence, Simple, Stage, Step, Strategy, Success. The prominent colors used in the PowerPoint template are Blue navy, Gray, Black. Customers tell us our continuous flow sequence of work steps chart for process PowerPoint Slides are Splendid. You can be sure our Duplicate PowerPoint templates and PPT Slides provide you with a vast range of viable options. Select the appropriate ones and just fill in your text. Presenters tell us our continuous flow sequence of work steps chart for process PowerPoint Slides are Stunning. Professionals tell us our Diagram PowerPoint templates and PPT Slides are Spectacular. Presenters tell us our continuous flow sequence of work steps chart for process PowerPoint Slides are Zippy. Professionals tell us our Concept PowerPoint templates and PPT Slides are Majestic. Convincing an audience can be demanding. Assert your credibilitywith our Continuous Flow Sequence Of Work Steps Chart For Process PowerPoint Slides.

Breakeven Assessment Chart With Unit Produced Ppt PowerPoint Presentation Infographics Clipart Images PDF
Presenting breakeven assessment chart with unit produced ppt powerpoint presentation infographics clipart images pdf to dispense important information. This template comprises four stages. It also presents valuable insights into the topics including key metric, pmo, fmo, difference, fixed costs, retail price per unit, unit produced, variable costs per unit. This is a completely customizable PowerPoint theme that can be put to use immediately. So, download it and address the topic impactfully.

Tender Management Process Flow Chart Ppt PowerPoint Presentation Visual Aids Ideas
Presenting this set of slides with name tender management process flow chart ppt powerpoint presentation visual aids ideas. This is a one stage process. The stages in this process are request for quotation, request for proposal, project management office. This is a completely editable PowerPoint presentation and is available for immediate download. Download now and impress your audience.
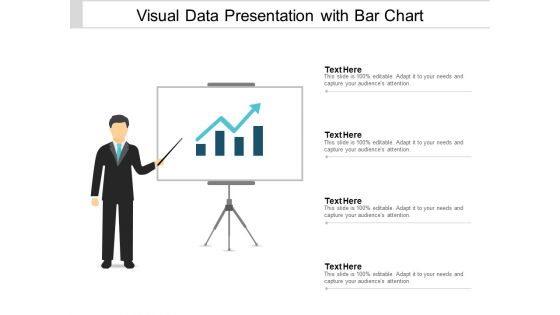
Visual Data Presentation With Bar Chart Ppt PowerPoint Presentation Portfolio Brochure
This is a visual data presentation with bar chart ppt powerpoint presentation portfolio brochure. This is a four stage process. The stages in this process are visual aids, communication, business.
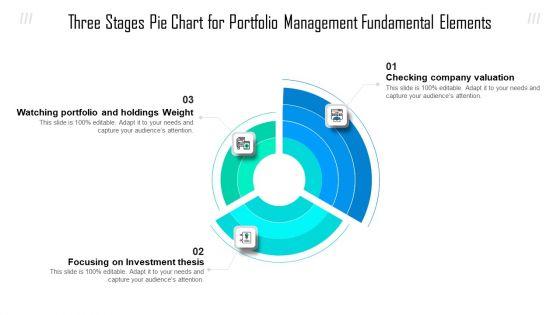
Three Stages Pie Chart For Portfolio Management Fundamental Elements Ppt Show Graphic Tips PDF
Presenting three stages pie chart for portfolio management fundamental elements ppt show graphic tips pdf to dispense important information. This template comprises three stages. It also presents valuable insights into the topics including company valuation, investment thesis, portfolio and holdings weight. This is a completely customizable PowerPoint theme that can be put to use immediately. So, download it and address the topic impactfully.
Arrow Puzzle 3d Column Chart With Icons Ppt Powerpoint Presentation Icon Deck
This is a arrow puzzle 3d column chart with icons ppt powerpoint presentation icon deck. This is a five stage process. The stages in this process are strategy, problem solution, arrow puzzle.
Pie Chart For Measuring Marketing Performance Ppt PowerPoint Presentation Icon Format
This is a pie chart for measuring marketing performance ppt powerpoint presentation icon format. This is a eight stage process. The stages in this process are b2b marketing strategy, b2b marketing plan, b2b marketing approach.
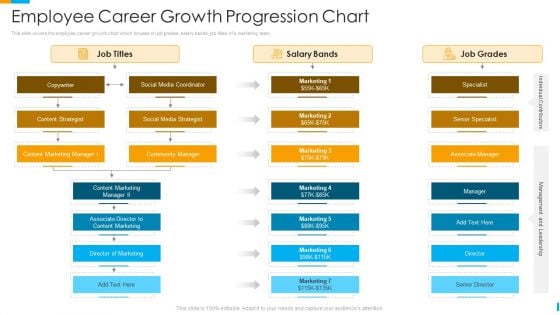
Business Journey Employee Career Growth Progression Chart Ppt Show Vector PDF
This slide covers the employee career growth chart which focuses on job grades, salary bands, job titles of a marketing team. Deliver an awe inspiring pitch with this creative business journey employee career growth progression chart ppt show vector pdf bundle. Topics like strategist, social media, coordinator, community manager, content marketing can be discussed with this completely editable template. It is available for immediate download depending on the needs and requirements of the user.
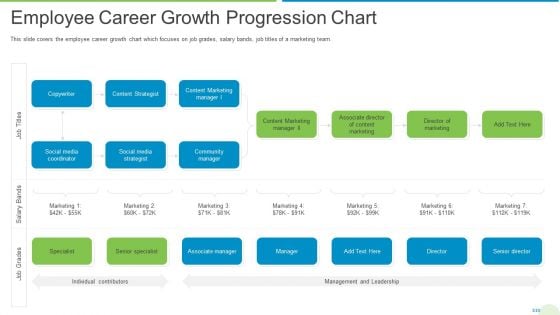
Employee Journey In Company Employee Career Growth Progression Chart Structure PDF
This slide covers the employee career growth chart which focuses on job grades, salary bands, job titles of a marketing team. Deliver an awe inspiring pitch with this creative employee journey in company employee career growth progression chart structure pdf bundle. Topics like strategist, social media, coordinator, community manager, content marketing can be discussed with this completely editable template. It is available for immediate download depending on the needs and requirements of the user.
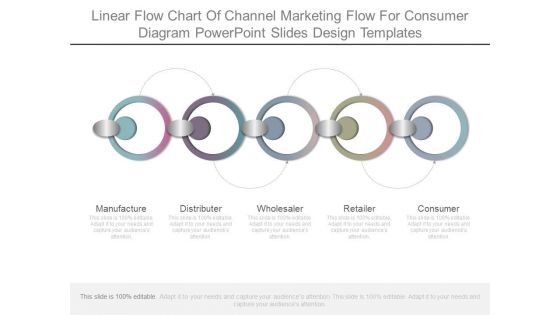
Linear Flow Chart Of Channel Marketing Flow For Consumer Diagram Powerpoint Slides Design Templates
This is a linear flow chart of channel marketing flow for consumer diagram powerpoint slides design templates. This is a five stage process. The stages in this process are manufacture, distributor, wholesaler, retailer, consumer.
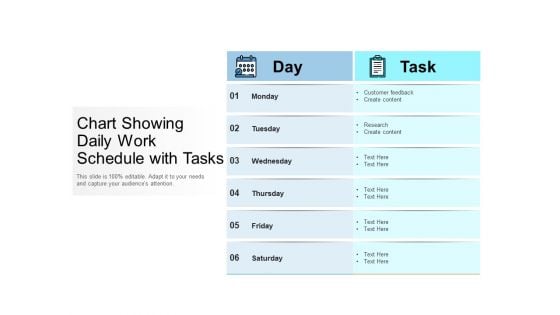
Chart Showing Daily Work Schedule With Tasks Ppt PowerPoint Presentation Gallery Slides PDF
Presenting this set of slides with name chart showing daily work schedule with tasks ppt powerpoint presentation gallery slides pdf. The topics discussed in these slides are day, task. This is a completely editable PowerPoint presentation and is available for immediate download. Download now and impress your audience.
Percentage Value Comparison Pie Chart Icon Ppt PowerPoint Presentation Model Clipart Images
This is a percentage value comparison pie chart icon ppt powerpoint presentation model clipart images. This is a three stage process. The stages in this process are percentage icon, dividend icon, portion icon.
Competitive Analysis Template 6 Scatter Chart Ppt PowerPoint Presentation Icon Example Topics
This is a competitive analysis template 6 scatter chart ppt powerpoint presentation icon example topics. This is a eight stage process. The stages in this process are users interface, data import, example, pricing, support, update, tutorials, easy to use.
Volume Open High Low Close Chart Ppt PowerPoint Presentation Icon Design Inspiration
This is a volume open high low close chart ppt powerpoint presentation icon design inspiration. This is a three stage process. The stages in this process are close, high, low, volume, open.
3D Bar Chart To Display Data Ppt PowerPoint Presentation Icon Design Inspiration
This is a 3d bar chart to display data ppt powerpoint presentation icon design inspiration. This is a four stage process. The stages in this process are art, colouring, paint brush.
3D Chart For Graphical Display Of Data Ppt PowerPoint Presentation Styles Icon
This is a 3d chart for graphical display of data ppt powerpoint presentation styles icon. This is a four stage process. The stages in this process are art, colouring, paint brush.
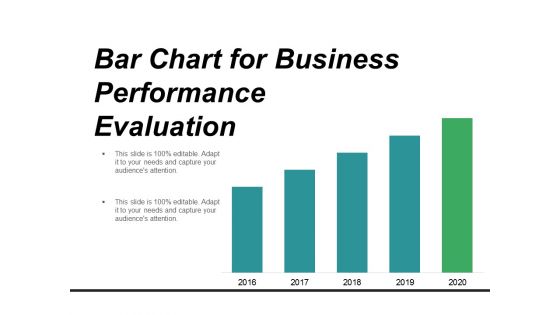
Bar Chart For Business Performance Evaluation Ppt PowerPoint Presentation Infographics Professional
This is a bar chart for business performance evaluation ppt powerpoint presentation infographics professional. This is a five stage process. The stages in this process are metrics icon, kpis icon, statistics icon.
Chart With Magnifying Glass For Business Research Ppt PowerPoint Presentation Inspiration Shapes
This is a chart with magnifying glass for business research ppt powerpoint presentation inspiration shapes. This is a two stage process. The stages in this process are metrics icon, kpis icon, statistics icon.
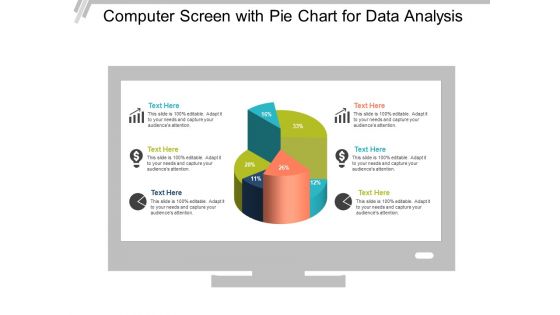
Computer Screen With Pie Chart For Data Analysis Ppt PowerPoint Presentation Show Picture
This is a computer screen with pie chart for data analysis ppt powerpoint presentation show picture. This is a six stage process. The stages in this process are computer icon, desktop icon, laptop screen icon.
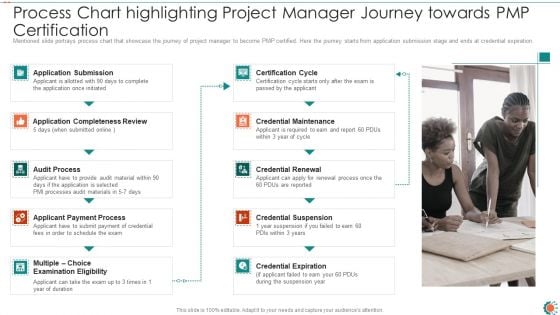
Process Chart Highlighting Project Manager Journey Towards PMP Certification Ppt Portfolio Guidelines PDF
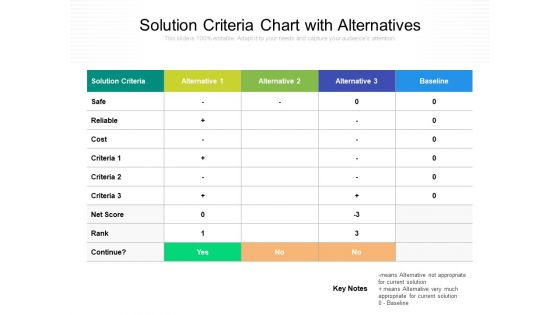
Solution Criteria Chart With Alternatives Ppt PowerPoint Presentation Outline Master Slide PDF
Presenting this set of slides with name solution criteria chart with alternatives ppt powerpoint presentation outline master slide pdf. The topics discussed in these slides are solution criteria, alternative, reliable, cost, net score, rank, continue. This is a completely editable PowerPoint presentation and is available for immediate download. Download now and impress your audience.
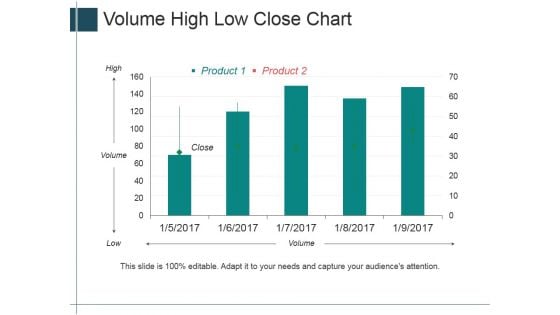
Volume High Low Close Chart Ppt PowerPoint Presentation Summary Layout Ideas
This is a volume high low close chart ppt powerpoint presentation summary layout ideas. This is a five stage process. The stages in this process are high, volume, low, close, product.
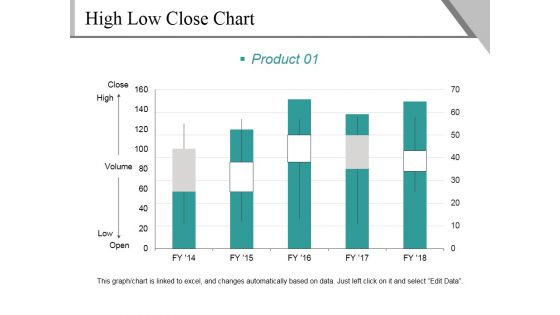
High Low Close Chart Template 1 Ppt PowerPoint Presentation Infographics Graphics Design
This is a high low close chart template 1 ppt powerpoint presentation infographics graphics design. This is a five stage process. The stages in this process are close, high, volume, low, open, product.
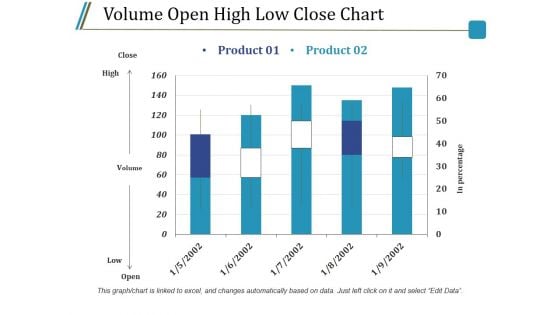
Volume Open High Low Close Chart Ppt PowerPoint Presentation Infographics Guide
This is a volume open high low close chart ppt powerpoint presentation infographics guide. This is a two stage process. The stages in this process are close, high, volume, low, open, product.
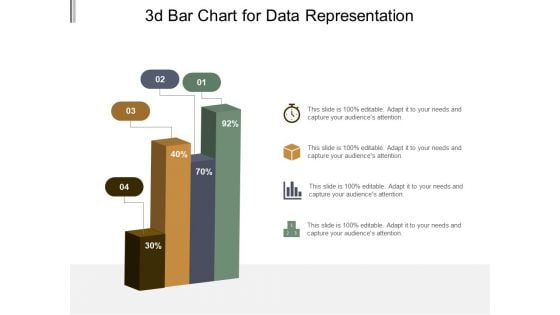
3D Bar Chart For Data Representation Ppt PowerPoint Presentation Model Graphic Tips
This is a 3d bar chart for data representation ppt powerpoint presentation model graphic tips. This is a four stage process. The stages in this process are art, colouring, paint brush.
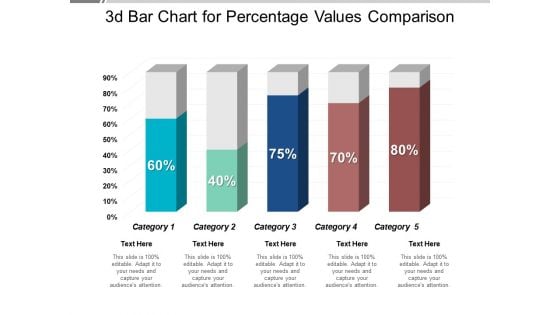
3D Bar Chart For Percentage Values Comparison Ppt PowerPoint Presentation Professional Visual Aids
This is a 3d bar chart for percentage values comparison ppt powerpoint presentation professional visual aids. This is a five stage process. The stages in this process are art, colouring, paint brush.
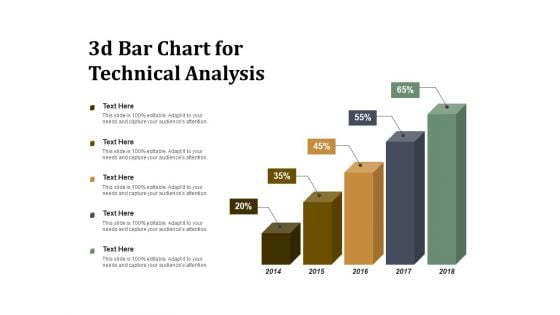
3D Bar Chart For Technical Analysis Ppt PowerPoint Presentation Summary Visuals
This is a 3d bar chart for technical analysis ppt powerpoint presentation summary visuals. This is a five stage process. The stages in this process are art, colouring, paint brush.
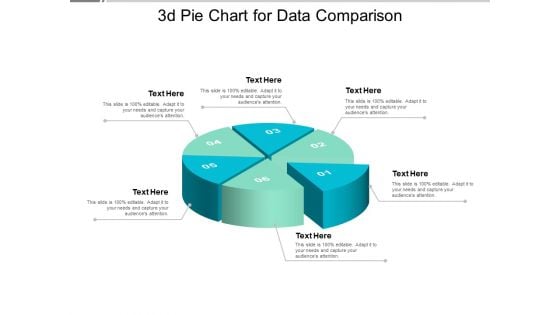
3D Pie Chart For Data Comparison Ppt PowerPoint Presentation Model Design Ideas
This is a 3d pie chart for data comparison ppt powerpoint presentation model design ideas. This is a six stage process. The stages in this process are art, colouring, paint brush.
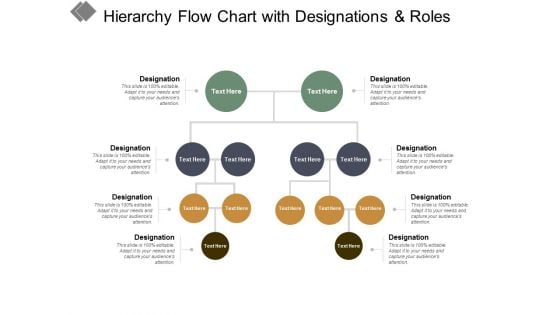
Hierarchy Flow Chart With Designations And Roles Ppt PowerPoint Presentation Styles Format Ideas
This is a hierarchy flow chart with designations and roles ppt powerpoint presentation styles format ideas. This is a four stage process. The stages in this process are business ownership, family business, owned business.


 Continue with Email

 Home
Home


