Control Chart
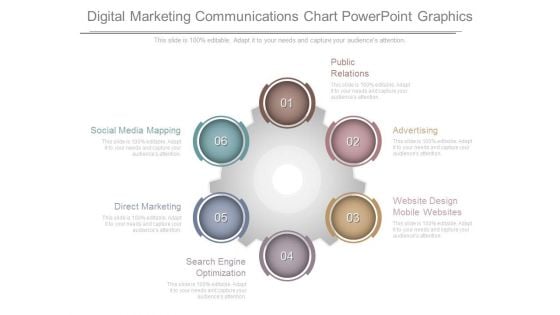
Digital Marketing Communications Chart Powerpoint Graphics
This is a digital marketing communications chart powerpoint graphics. This is a six stage process. The stages in this process are public relations, advertising, website design mobile websites, search engine optimization, direct marketing, social media mapping.
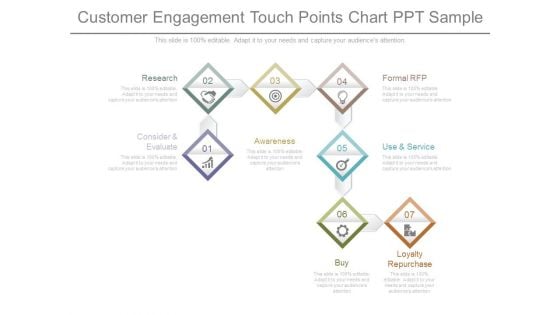
Customer Engagement Touch Points Chart Ppt Sample
This is a customer engagement touch points chart ppt sample. This is a seven stage process. The stages in this process are research, consider and evaluate, awareness, formal rfp, use and service, buy, loyalty repurchase.
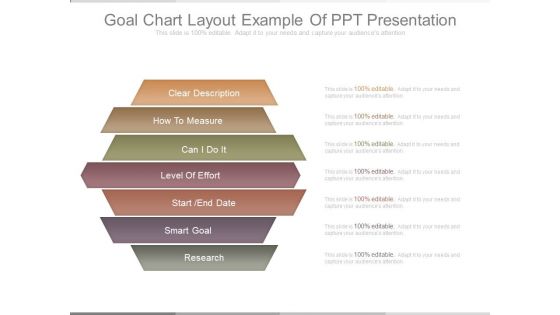
Goal Chart Layout Example Of Ppt Presentation
This is a goal chart layout example of ppt presentation. This is a seven stage process. The stages in this process are clear description, how to measure, can i do it, level of effort, start end date, smart goal, research.
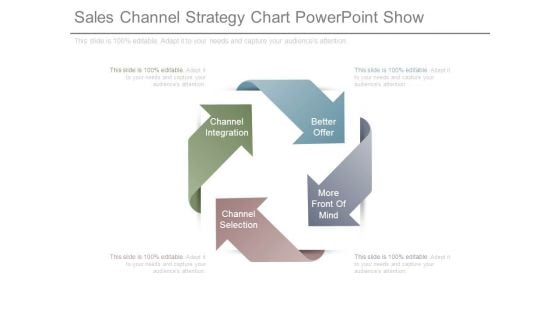
Sales Channel Strategy Chart Powerpoint Show
This is a sales channel strategy chart powerpoint show. This is a four stage process. The stages in this process are channel integration, better offer, channel selection, more front of mind.
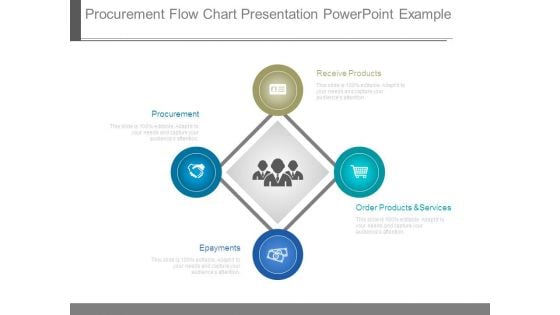
Procurement Flow Chart Presentation Powerpoint Example
This is a procurement flow chart presentation powerpoint example. This is a four stage process. The stages in this process are procurement, epayments, order products and services, receive products.
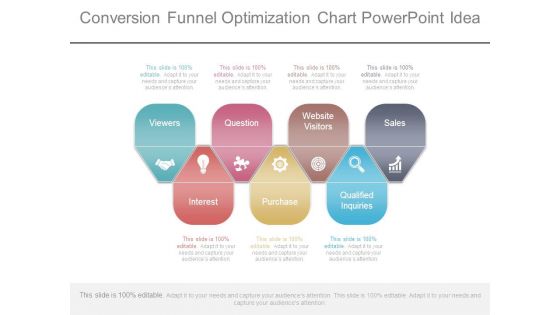
Conversion Funnel Optimization Chart Powerpoint Idea
This is a conversion funnel optimization chart powerpoint idea. This is a seven stage process. The stages in this process are viewers, question, website visitors, sales, interest, purchase, qualified inquiries.
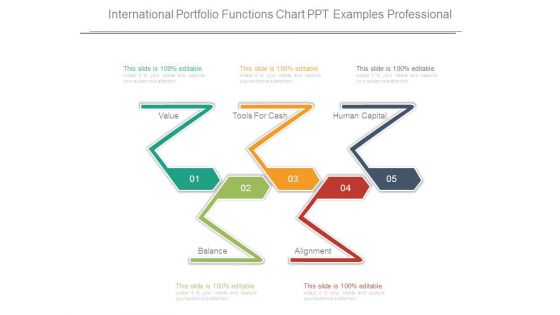
International Portfolio Functions Chart Ppt Examples Professional
This is a international portfolio functions chart ppt examples professional. This is a five stage process. The stages in this process are value, tools for cash, human capital, alignment, balance.
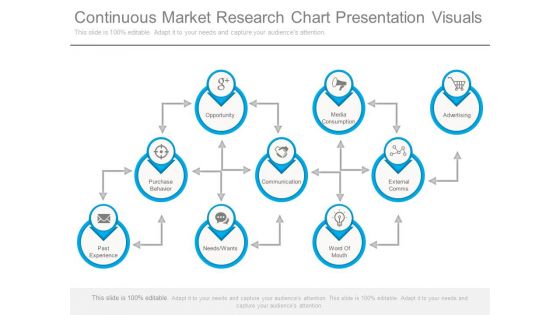
Continuous Market Research Chart Presentation Visuals
This is a continuous market research chart presentation visuals. This is a nine stage process. The stages in this process are opportunity, purchase behavior, past experience, needs wants, word of mouth, external comms, advertising, media consumption, communication.

Business Solutions Development Chart Powerpoint Slide Show
This is a business solutions development chart powerpoint slide show. This is a six stage process. The stages in this process are business value, resource leveraging, strategic positioning, developing people, creativity and innovation, focus on performance.
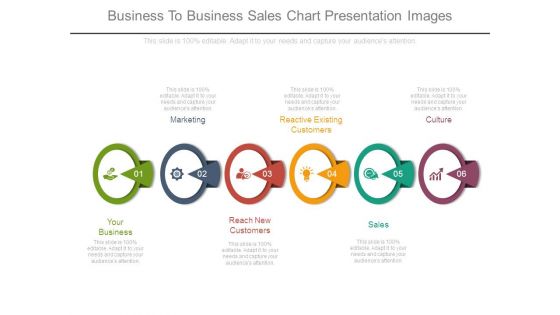
Business To Business Sales Chart Presentation Images
This is a business to business sales chart presentation images. This is a six stage process. The stages in this process are your business, marketing, reactive existing customers, culture, reach new customers, sales.
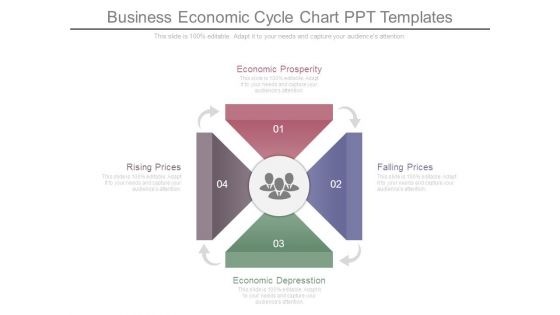
Business Economic Cycle Chart Ppt Templates
This is a business economic cycle chart ppt templates. This is a four stage process. The stages in this process are economic prosperity, falling prices, economic depression, rising prices.
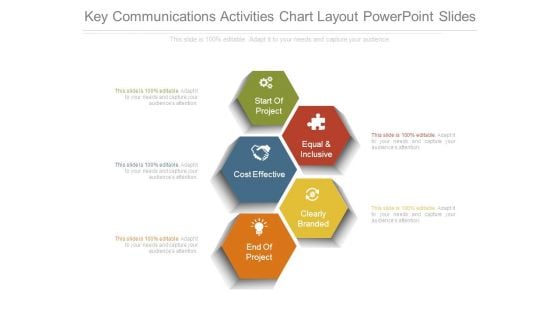
Key Communications Activities Chart Layout Powerpoint Slides
This is a key communications activities chart layout powerpoint slides. This is a five stage process. The stages in this process are start of project, cost effective, equal and inclusive, clearly branded, end of project.
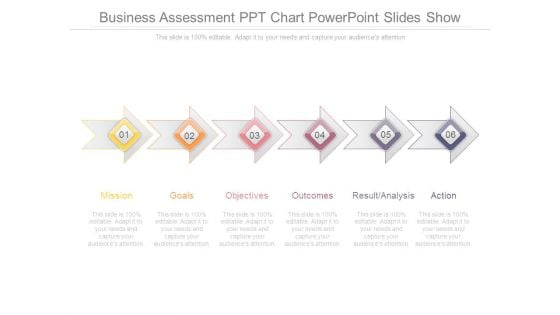
Business Assessment Ppt Chart Powerpoint Slides Show
This is a business assessment ppt chart powerpoint slides show. This is a six stage process. The stages in this process are mission, goals, objectives, outcomes, result analysis, action.
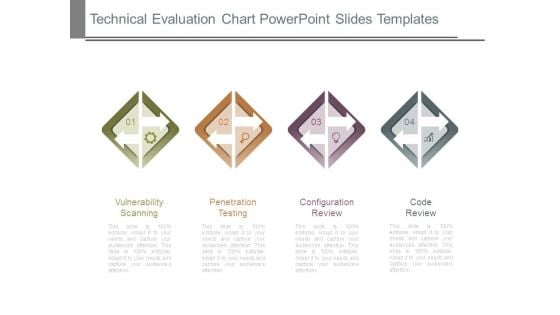
Technical Evaluation Chart Powerpoint Slides Templates
This is a technical evaluation chart powerpoint slides templates. This is a four stage process. The stages in this process are vulnerability scanning, penetration testing, configuration review, code review.
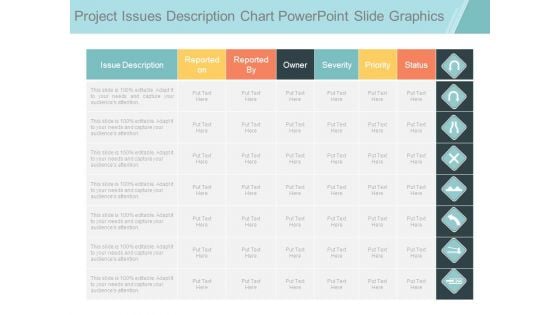
Project Issues Description Chart Powerpoint Slide Graphics
This is a project issues description chart powerpoint slide graphics. This is a seven stage process. The stages in this process are issue description, reported on, reported by, owner, severity, priority, status.
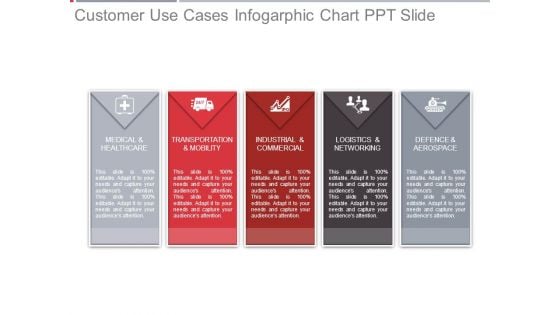
Customer Use Cases Infogarphic Chart Ppt Slide
This is a customer use cases infogarphic chart ppt slide. This is a five stage process. The stages in this process are medical and healthcare, transportation and mobility, industrial and commercial, logistics and networking, defence and aerospace.

Project Issues Infogarphic Chart Ppt Examples Slides
This is a project issues infogarphic chart ppt examples slides. This is a seven stage process. The stages in this process are issue description, reported on, reported by, owner, severity, priority, status.
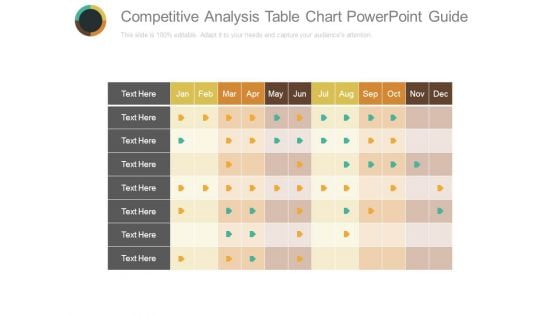
Competitive Analysis Table Chart Powerpoint Guide
This is a competitive analysis table chart powerpoint guide. This is a twelve stage process. The stages in this process are jan,feb, mar, apr, may, jun, jul, aug, sep, oct, nov, dec.
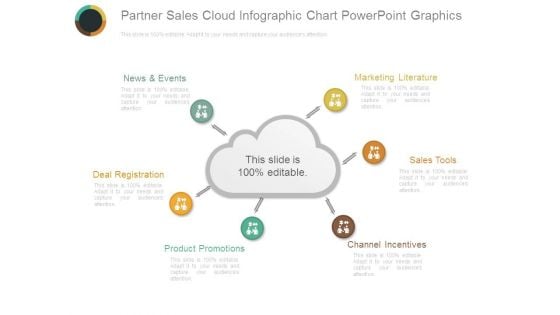
Partner Sales Cloud Infographic Chart Powerpoint Graphics
This is a partner sales cloud infographic chart powerpoint graphics. This is a six stage process. The stages in this process are news and events, marketing literature, sales tools, channel incentives, product promotions, deal registration.
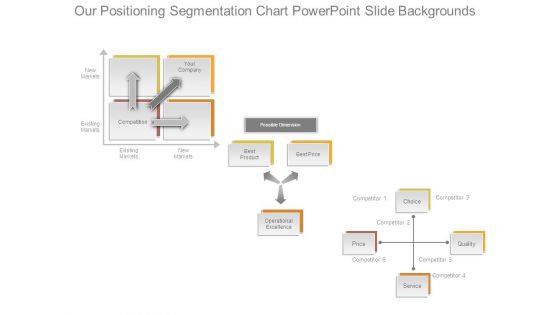
Our Positioning Segmentation Chart Powerpoint Slide Backgrounds
This is a our positioning segmentation chart powerpoint slide backgrounds. This is a three stage process. The stages in this process are new markets, existing markets, your company, competition, possible dimension, best product, operational excellence, service, price, choice.
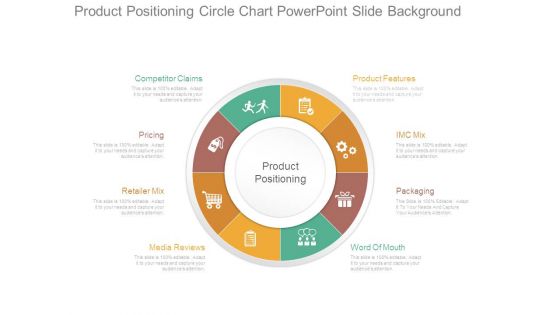
Product Positioning Circle Chart Powerpoint Slide Background
This is a product positioning circle chart powerpoint slide background. This is a eight stage process. The stages in this process are competitor claims, pricing, retailer mix, media reviews, product positioning, product features, imc mix, packaging, word of mouth.
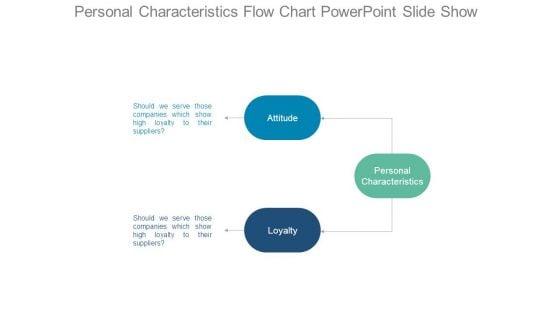
Personal Characteristics Flow Chart Powerpoint Slide Show
This is a personal characteristics flow chart powerpoint slide show. This is a three stage process. The stages in this process are should we serve those companies which show high loyalty to their suppliers, attitude, loyalty, personal characteristics.
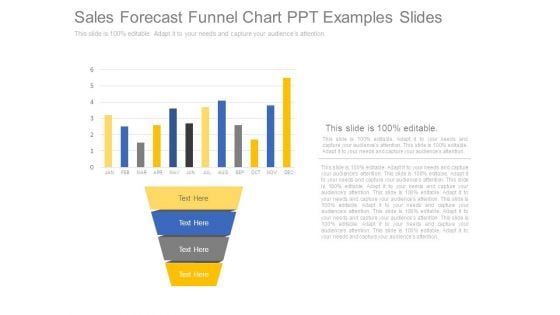
Sales Forecast Funnel Chart Ppt Examples Slides
This is a sales forecast funnel chart ppt examples slides. This is a four stage process. The stages in this process are jan, feb, mar, apr, may, jun, jul, aug, sep, oct, nov, dec.
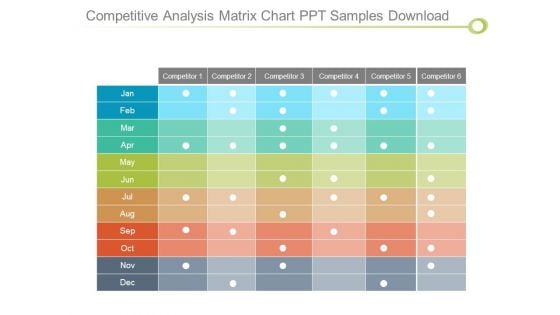
Competitive Analysis Matrix Chart Ppt Samples Download
This is a competitive analysis matrix chart ppt samples download. This is a six stage process. The stages in this process are competitor, jan, feb, mar, apr, may, jun, jul, aug, sep, oct, nov, dec.
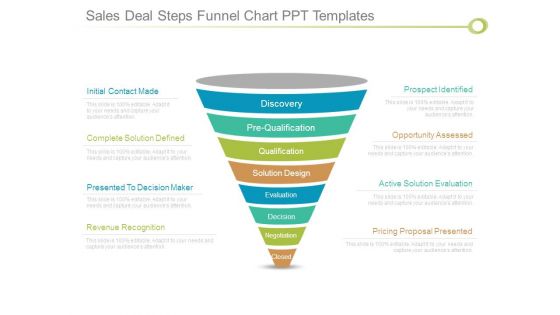
Sales Deal Steps Funnel Chart Ppt Templates
This is a sales deal steps funnel chart ppt templates. This is a eight stage process. The stages in this process are discovery, pre qualification, qualification, solution design, evaluation, decision, negotiation, closed.
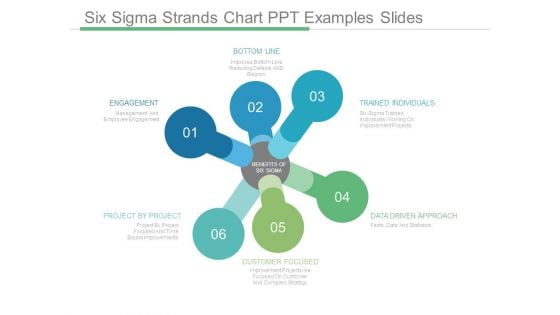
Six Sigma Strands Chart Ppt Examples Slides
This is a six sigma strands chart ppt examples slides. This is a six stage process. The stages in this process are bottom line, trained individuals, data driven approach, customer focused, project by project, engagement, benefits of six sigma.
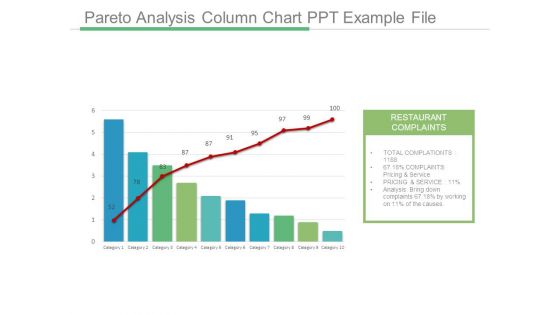
Pareto Analysis Column Chart Ppt Example File
This is a pareto analysis column chart ppt example file. This is a ten stage process. The stages in this process are restaurant complaints, total complaints, complaints pricing and service, pricing and service, analysis bring down complaints, category.

Six Sigma Circle Chart Powerpoint Slide Information
This is a six sigma circle chart powerpoint slide information. This is a five stage process. The stages in this process are bottom line, trained individuals, engagement, project by project, customer focused.
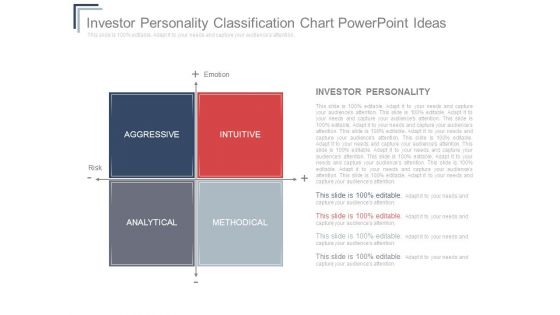
Investor Personality Classification Chart Powerpoint Ideas
This is a investor personality classification chart powerpoint ideas. This is a four stage process. The stages in this process are aggressive, intuitive, analytical, methodical, emotion, risk, investor personality.
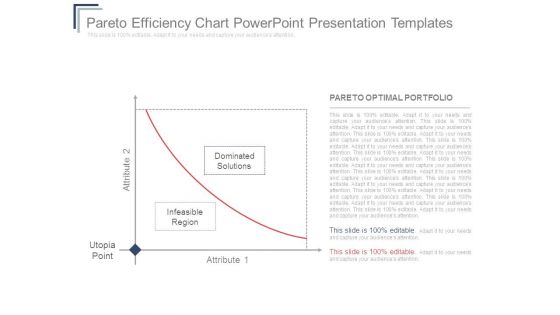
Pareto Efficiency Chart Powerpoint Presentation Templates
This is a pareto efficiency chart powerpoint presentation templates. This is a two stage process. The stages in this process are attribute 2, utopia, point, infeasible region, dominated, solutions, attribute 1, pareto optimal portfolio.
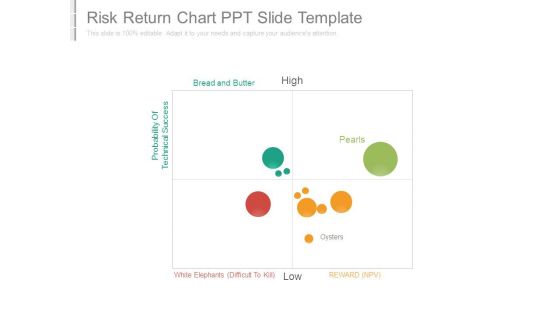
Risk Return Chart Ppt Slide Template
This is a risk return chart ppt slide template. This is a four stage process. The stages in this process are probability of technical success, bread and butter, pearls, oysters.
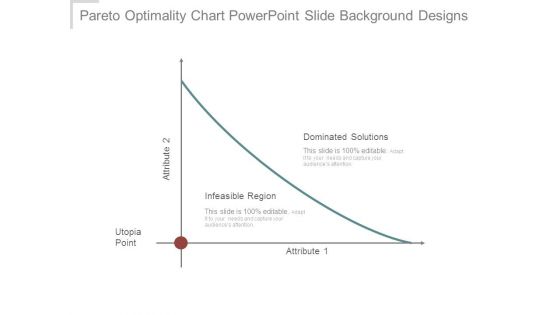
Pareto Optimality Chart Powerpoint Slide Background Designs
This is a pareto optimality chart powerpoint slide background designs. This is a one stage process. The stages in this process are dominated solutions, infeasible region, utopia point, attribute.
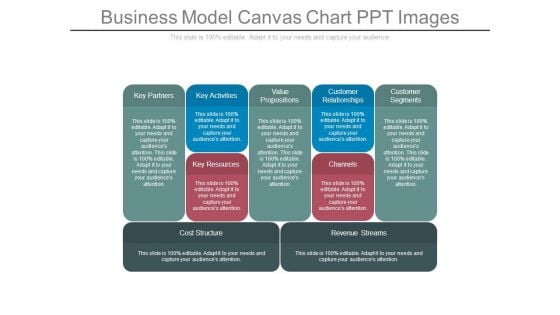
Business Model Canvas Chart Ppt Images
This is a business model canvas chart ppt images. This is a five stage process. The stages in this process are key partners, key activities, value propositions, customer relationships, customer segments, key resources, channels, cost structure, revenue streams.
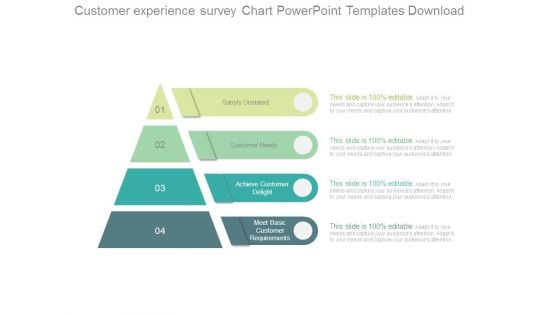
Customer Experience Survey Chart Powerpoint Templates Download
This is a customer experience survey chart powerpoint templates download. This is a four stage process. The stages in this process are satisfy unstated, customer needs, achieve customer delight, meet basic, customer requirements.
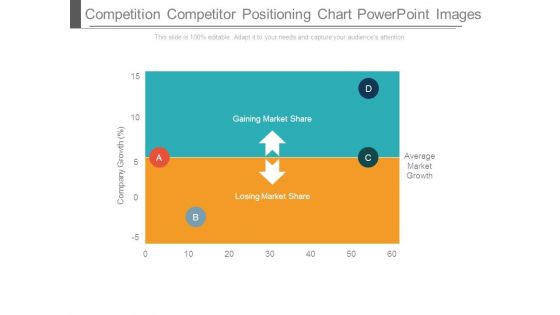
Competition Competitor Positioning Chart Powerpoint Images
This is a competition competitor positioning chart powerpoint images. This is a four stage process. The stages in this process are gaining market share, losing market share, average market growth, company growth.
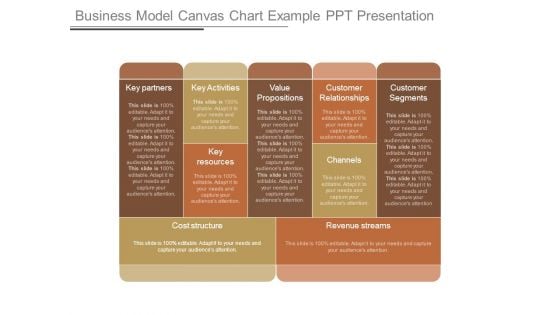
Business Model Canvas Chart Example Ppt Presentation
This is a business model canvas chart example ppt presentation. This is a five stage process. The stages in this process are key partners, key activities, value propositions, customer relationships, customer segments, key resources, channels, cost structure, revenue streams.
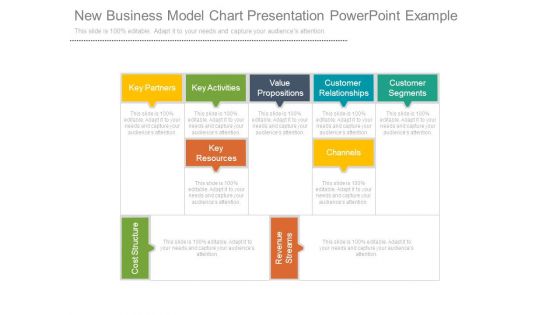
New Business Model Chart Presentation Powerpoint Example
This is a new business model chart presentation powerpoint example. This is a five stage process. The stages in this process are key partners, key activities, value propositions, customer, relationships, customer segments, key resources, channels, cost structure, revenue streams.
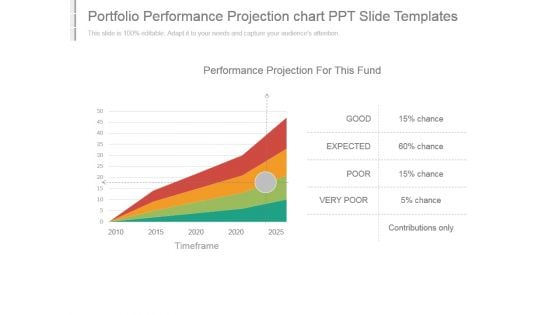
Portfolio Performance Projection Chart Ppt Slide Templates
This is a portfolio performance projection chart ppt slide templates. This is a four stage process. The stages in this process are performance projection for this fund, good, expected, poor, very poor, contributions only, timeframe.
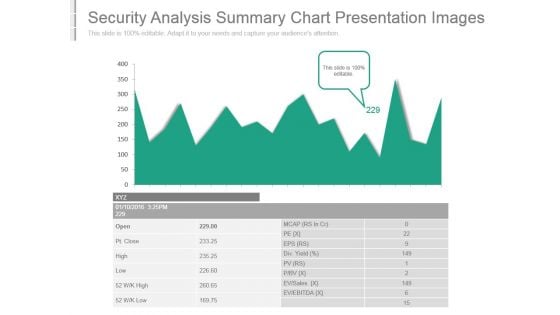
Security Analysis Summary Chart Presentation Images
This is a security analysis summary chart presentation images. This is a one stage process. The stages in this process are ev ebitda, ev sales, div yield, open, pt close, high, low, mcap, eps.
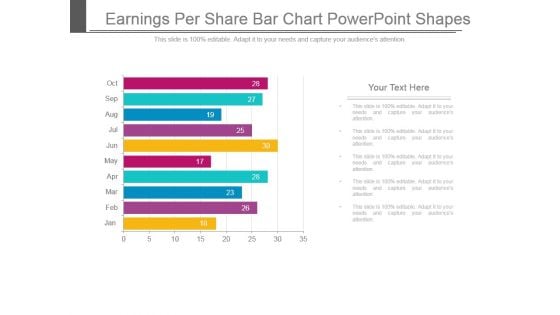
Earnings Per Share Bar Chart Powerpoint Shapes
This is a earnings per share bar chart powerpoint shapes. This is a ten stage process. The stages in this process are jan, feb, mar, apr, may, jun, jul, aug, sep, oct.
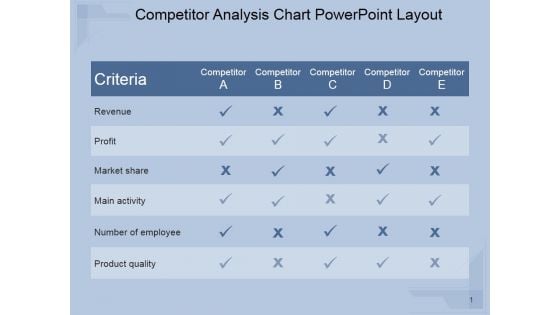
Competitor Analysis Chart Ppt PowerPoint Presentation Visuals
This is a competitor analysis chart ppt powerpoint presentation visuals. This is a five stage process. The stages in this process are revenue, profit, market share, main activity, number of employee, product quality.
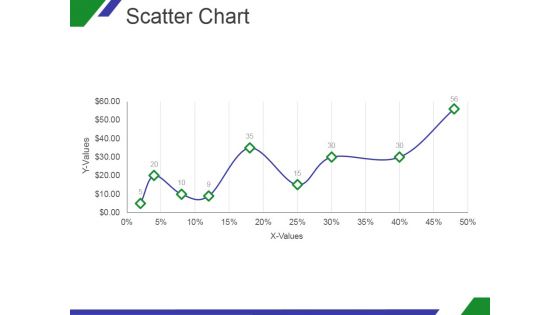
Scatter Chart Ppt PowerPoint Presentation Designs Download
This is a scatter chart ppt powerpoint presentation designs download. This is a nine stage process. The stages in this process are x values, y values, graph, growth, success.
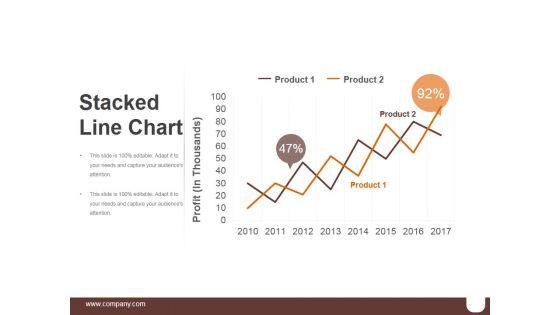
Stacked Line Chart Ppt PowerPoint Presentation Shapes
This is a stacked line chart ppt powerpoint presentation shapes. This is a two stage process. The stages in this process are product, profit in thousands, finance, analysis, growth.
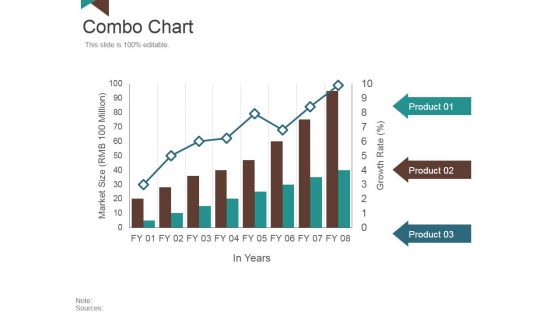
Combo Chart Ppt PowerPoint Presentation Inspiration Images
This is a combo chart ppt powerpoint presentation inspiration images. This is a three stage process. The stages in this process are market size, in years, growth rate, product.
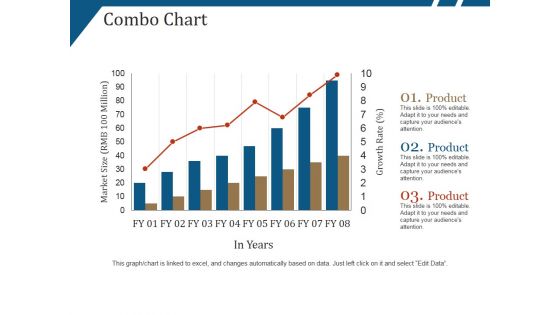
Combo Chart Ppt PowerPoint Presentation Summary Ideas
This is a combo chart ppt powerpoint presentation summary ideas. This is a eight stage process. The stages in this process are market size, growth rate, product, in years.
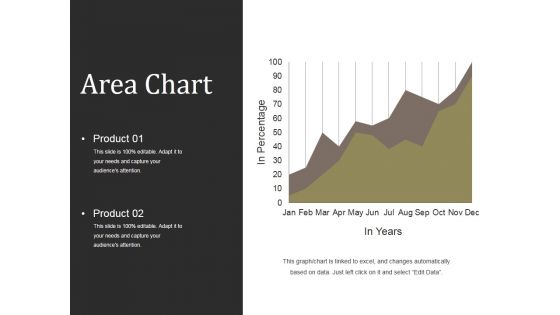
Area Chart Ppt PowerPoint Presentation Professional Designs
This is a area chart ppt powerpoint presentation professional designs. This is a two stage process. The stages in this process are in percentage, product, in years, strategy, business, marketing.
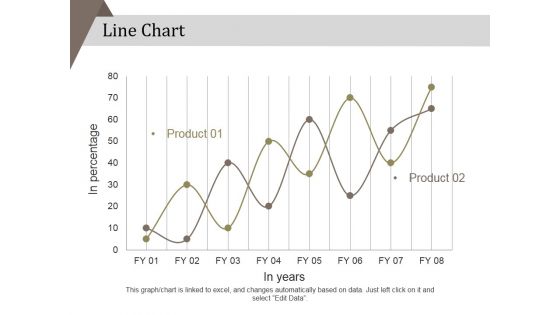
Line Chart Ppt PowerPoint Presentation Layouts Professional
This is a line chart ppt powerpoint presentation layouts professional. This is a two stage process. The stages in this process are in percentage, product, in years, strategy, marketing, business.
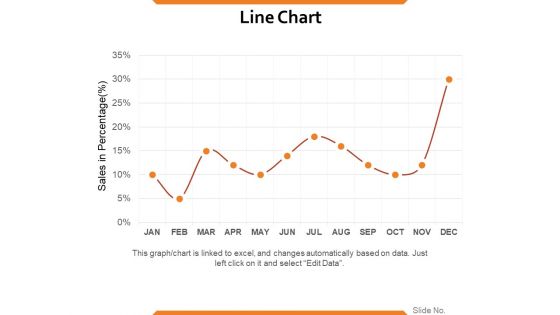
Line Chart Ppt PowerPoint Presentation Summary Samples
This is a line chart ppt powerpoint presentation summary samples. This is a one stage process. The stages in this process are sales in percentage, percentage, business, marketing, strategy.
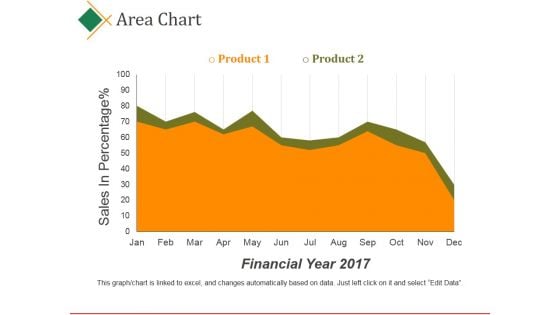
Area Chart Ppt PowerPoint Presentation Pictures Files
This is a area chart ppt powerpoint presentation pictures files. This is a two stage process. The stages in this process are product, sales, in percentage, financial year, business.
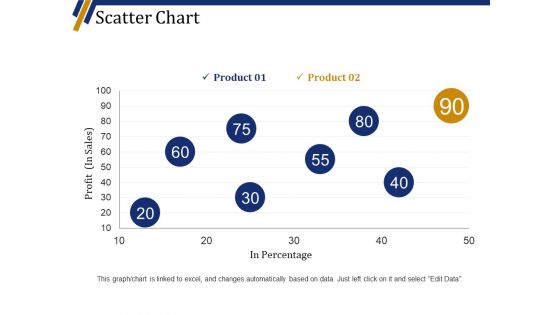
Scatter Chart Ppt PowerPoint Presentation Summary Visuals
This is a scatter chart ppt powerpoint presentation summary visuals. This is a eight stage process. The stages in this process are product, profit in sales, in percentage, finance, business.
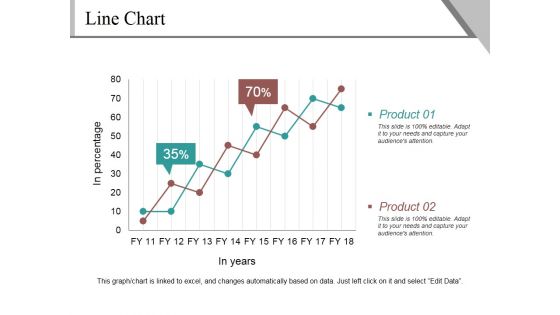
Line Chart Ppt PowerPoint Presentation Infographics Example
This is a line chart ppt powerpoint presentation infographics example. This is a two stage process. The stages in this process are product, in percentage, in years, finance, growth.
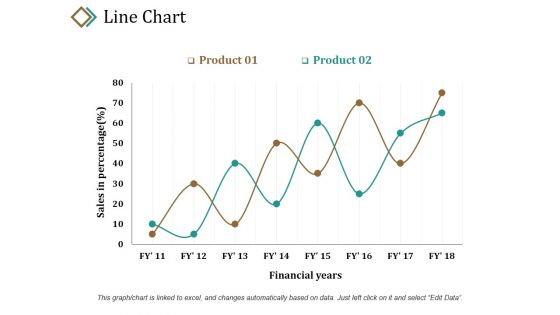
Line Chart Ppt PowerPoint Presentation Layouts Example
This is a line chart ppt powerpoint presentation layouts example. This is a two stage process. The stages in this process are sales in percentage, product, financial years, growth, success.
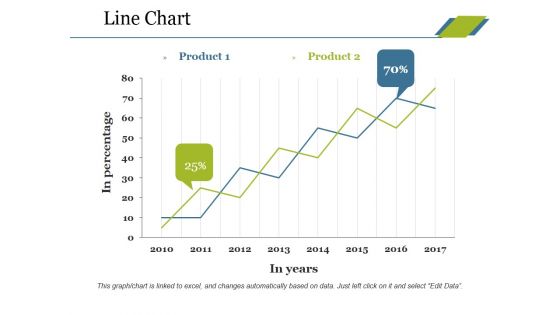
Line Chart Ppt PowerPoint Presentation Professional Tips
This is a line chart ppt powerpoint presentation professional tips. This is a two stage process. The stages in this process are product, in percentage, in years, growth, success.
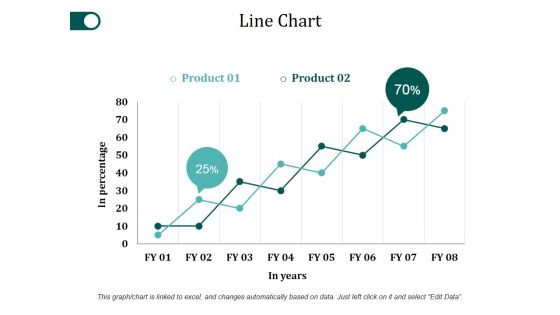
Line Chart Ppt PowerPoint Presentation Slides Ideas
This is a line chart ppt powerpoint presentation slides ideas. This is a two stage process. The stages in this process are product, in percentage, in years, growth, success.

Line Chart Ppt PowerPoint Presentation Show Guide
This is a line chart ppt powerpoint presentation show guide. This is a two stage process. The stages in this process are product, sales in percentage, financial years, growth, success.
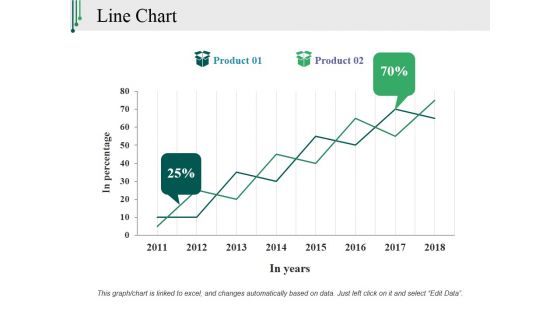
Line Chart Ppt PowerPoint Presentation Slides Mockup
This is a line chart ppt powerpoint presentation slides mockup. This is a two stage process. The stages in this process are in percentage, in years, product, growth, success.
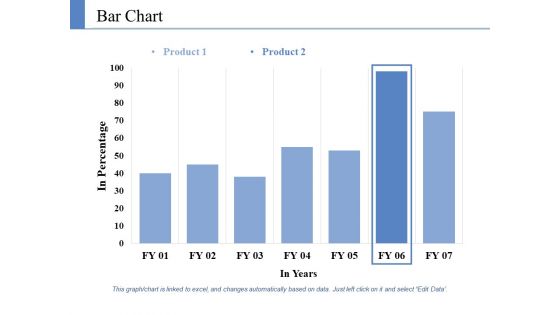
Bar Chart Ppt PowerPoint Presentation Ideas Deck
This is a bar chart ppt powerpoint presentation ideas deck. This is a two stage process. The stages in this process are product, in percentage, in years, financial, business.
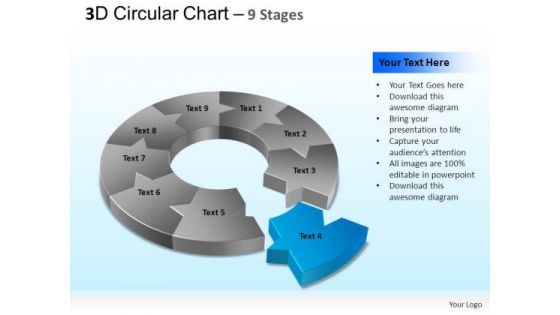
PowerPoint Layout Process Circular Chart Ppt Backgrounds
PowerPoint_Layout_Process_circular_chart_PPT_Backgrounds Business Power Points-The Circle of Life - a concept emmbedded in our minds and hence easy to comprehend. Life and Business is made up of processes comprising stages that flow from one to another. An excellent graphic to attract the attention of and understanding by your audience to improve earnings.-These amazing PowerPoint pre-designed slides and PowerPoint templates have been carefully created by our team of experts to help you impress your audience. Our stunning collection of Powerpoint slides are 100% editable and can easily fit in any PowerPoint presentations. By using these animations and graphics in PowerPoint and you can easily make professional presentations. Any text can be entered at any point in the PowerPoint template or slide. Just DOWNLOAD our awesome PowerPoint templates and you are ready to go. Give credit where its due. Just download, type and present.
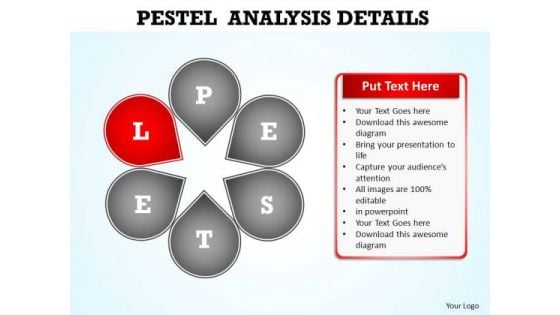
PowerPoint Layout Chart Pestel Analysis Ppt Design
PowerPoint Layout Chart Pestel Analysis PPT Design-The Circle of Life - a concept emmbedded in our minds and hence easy to comprehend. Life and Business is made up of processes comprising stages that flow from one to another. An excellent graphic to attract the attention of and understanding by your audience to improve earnings. Integrate teams with our PowerPoint Layout Chart Pestel Analysis Ppt Design. Download without worries with our money back guaranteee.
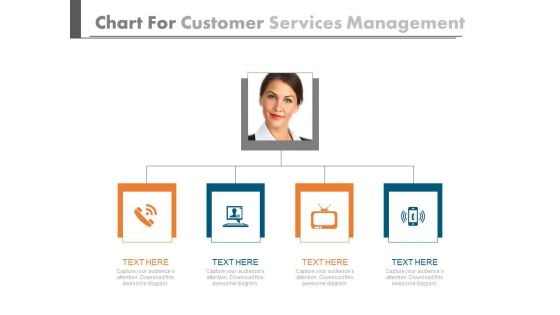
Chart For Technical Support Services Powerpoint Template
Our above PPT slide contains flow chart of technical support services. This PowerPoint template helps to exhibit communication and support services. Enlighten others on the process with this innovative PowerPoint template.


 Continue with Email

 Home
Home


