Control Chart
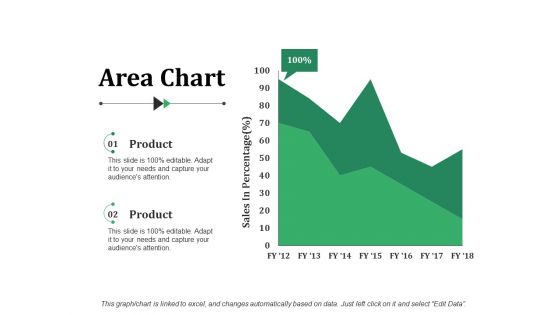
Area Chart Ppt PowerPoint Presentation Visual Aids Gallery
This is a area chart ppt powerpoint presentation visual aids gallery. This is a two stage process. The stages in this process are area chart, finance, marketing, analysis, business.
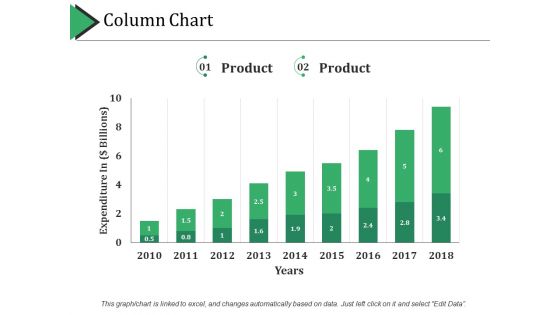
Column Chart Ppt PowerPoint Presentation Professional Example Topics
This is a column chart ppt powerpoint presentation professional example topics. This is a two stage process. The stages in this process are column chart, finance, marketing, strategy, analysis, business.
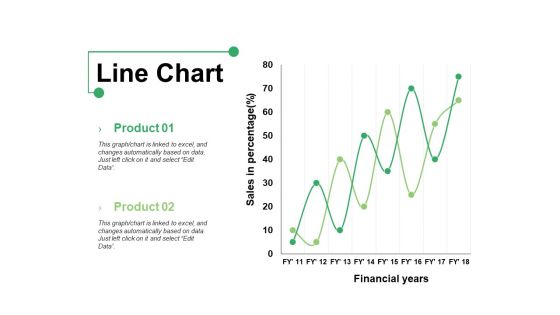
Line Chart Ppt PowerPoint Presentation Show Graphics Example
This is a line chart ppt powerpoint presentation show graphics example. This is a two stage process. The stages in this process are product, line chart, financial years, sales in percentage.
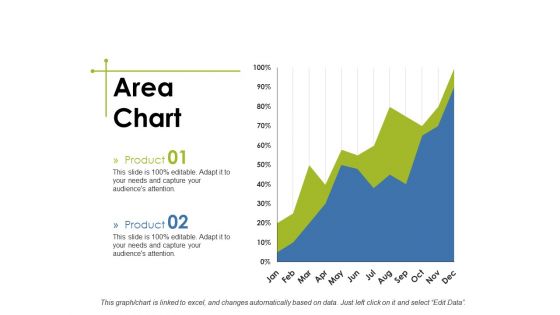
Area Chart Ppt PowerPoint Presentation Slides Master Slide
This is a area chart ppt powerpoint presentation slides master slide. This is a two stage process. The stages in this process are business, marketing, area chart, finance, strategy.
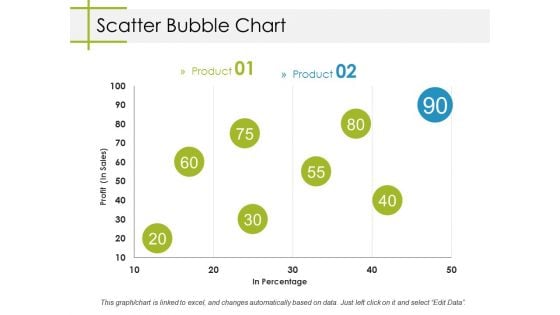
Scatter Bubble Chart Ppt PowerPoint Presentation Model Designs
This is a scatter bubble chart ppt powerpoint presentation model designs. This is a two stage process. The stages in this process are business, profit, in percentage, bubble chart, marketing.
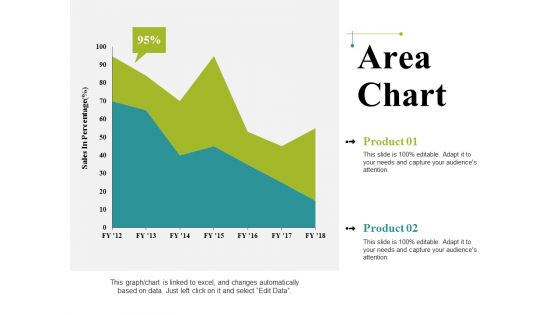
Area Chart Ppt PowerPoint Presentation Infographics Graphics Pictures
This is a area chart ppt powerpoint presentation infographics graphics pictures. This is a two stage process. The stages in this process are business, sales in percentage, area chart, marketing, graph.
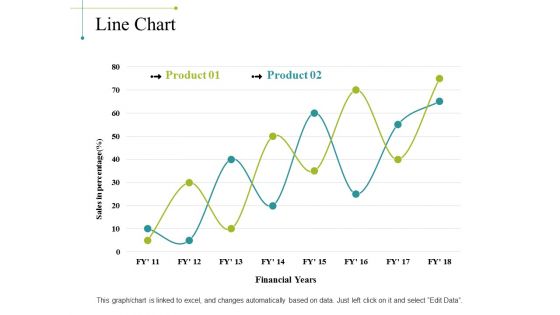
Line Chart Ppt PowerPoint Presentation Portfolio Background Image
This is a line chart ppt powerpoint presentation portfolio background image. This is a two stage process. The stages in this process are sales in percentage, financial years, chart, business, marketing, finance.
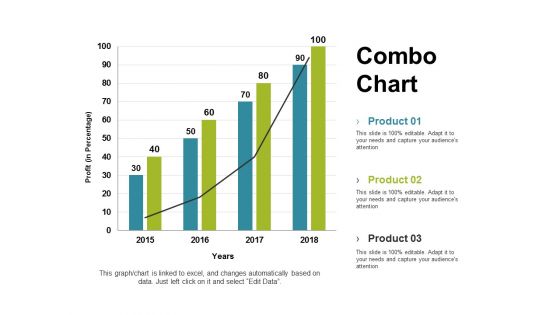
Combo Chart Ppt PowerPoint Presentation Gallery Graphics Tutorials
This is a Combo Chart Ppt PowerPoint Presentation Gallery Graphics Tutorials. This is a three stage process. The stages in this process are combo chart, finance, marketing, strategy, analysis.
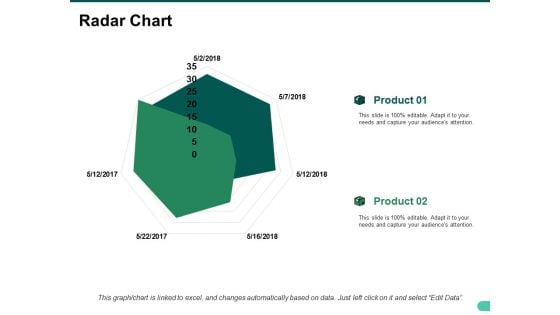
Radar Chart Ppt PowerPoint Presentation Show Graphic Images
This is a radar chart ppt powerpoint presentation show graphic images. This is a two stage process. The stages in this process are business, radar chart, marketing, graph, strategy.
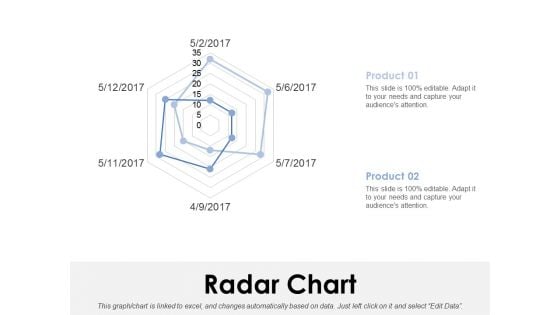
Radar Chart Ppt PowerPoint Presentation Model Clipart Images
This is a radar chart ppt powerpoint presentation model clipart images. This is a two stage process. The stages in this process are radar chart, finance, analysis, marketing, strategy, business.
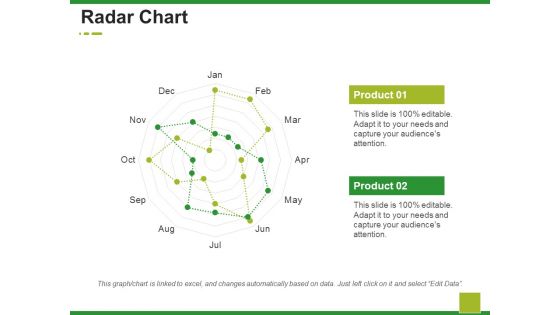
Radar Chart Ppt PowerPoint Presentation Ideas Design Ideas
This is a radar chart ppt powerpoint presentation ideas design ideas. This is a two stage process. The stages in this process are business, marketing, radar chart, finance, strategy.
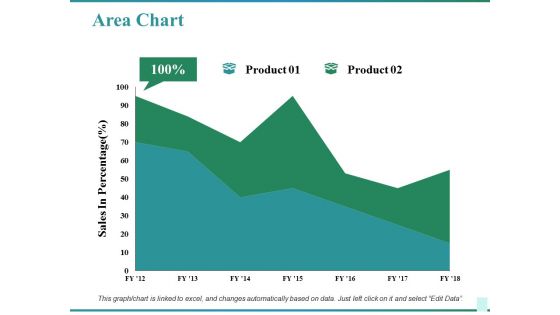
Area Chart Ppt PowerPoint Presentation Inspiration Background Designs
This is a area chart ppt powerpoint presentation inspiration background designs. This is a two stage process. The stages in this process are business, sales in percentage, area chart, marketing, finance.
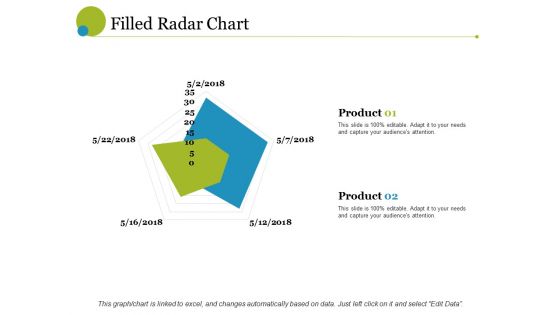
filled radar chart ppt powerpoint presentation ideas brochure
This is a filled radar chart ppt powerpoint presentation ideas brochure. This is a two stage process. The stages in this process are radar chart, finance, analysis, business, marketing, strategy.
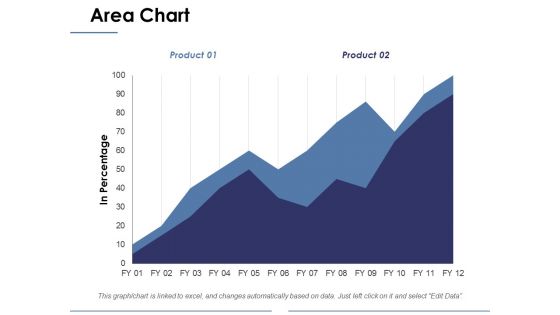
Area Chart Ppt PowerPoint Presentation Layouts Background Designs
This is a area chart ppt powerpoint presentation layouts background designs. This is a two stage process. The stages in this process are business, marketing, in percentage, area chart, finance.
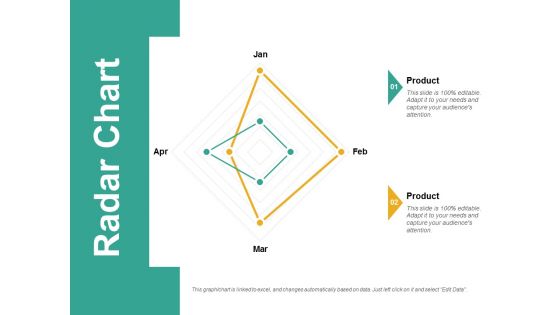
Radar Chart Ppt PowerPoint Presentation Visual Aids Professional
This is a radar chart ppt powerpoint presentation visual aids professional. This is a two stage process. The stages in this process are radar chart, finance, marketing, strategy, business.

Combo Chart Ppt PowerPoint Presentation Inspiration Slide Download
This is a combo chart ppt powerpoint presentation inspiration slide download. This is a two stage process. The stages in this process are Combo chart, finance, marketing, strategy, analysis.
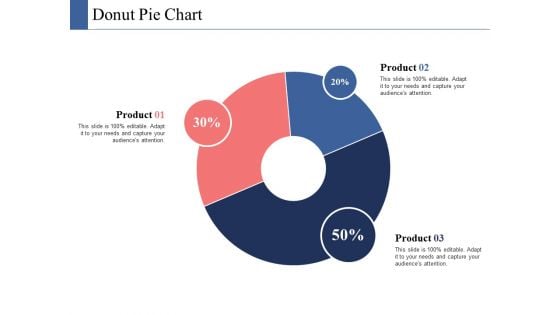
Donut Pie Chart Ppt PowerPoint Presentation Infographics Ideas
This is a donut pie chart ppt powerpoint presentation infographics ideas. This is a three stage process. The stages in this process are donut pie chart, finance, marketing, strategy, analysis.
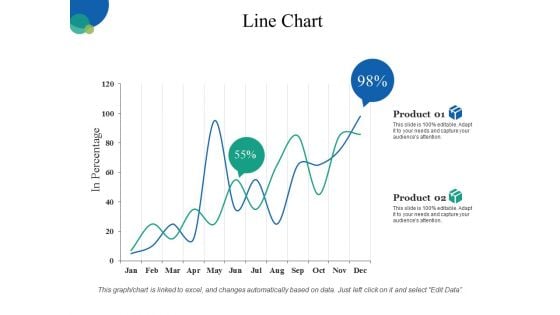
Line Chart Ppt PowerPoint Presentation Gallery Clipart Images
This is a line chart ppt powerpoint presentation gallery clipart images. This is a two stage process. The stages in this process are business, line chart, finance, marketing, strategy.
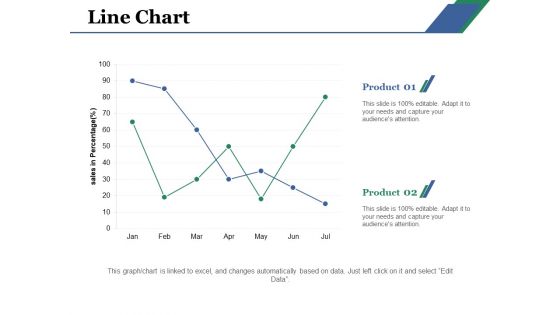
Line Chart Ppt PowerPoint Presentation Layouts Example File
This is a line chart ppt powerpoint presentation layouts example file. This is a two stage process. The stages in this process are line chart, product, business, sales, analysis.
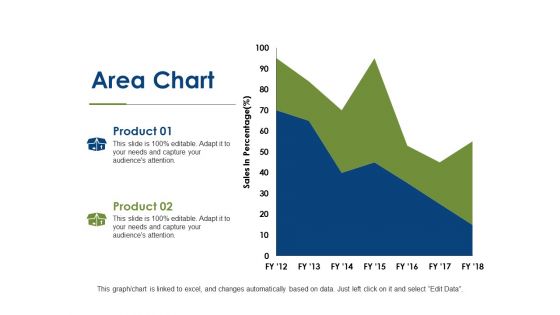
Area Chart Finance Ppt PowerPoint Presentation Show Visual Aids
This is a area chart finance ppt powerpoint presentation show visual aids. This is a two stage process. The stages in this process are area chart, business, finance, investment, strategy.
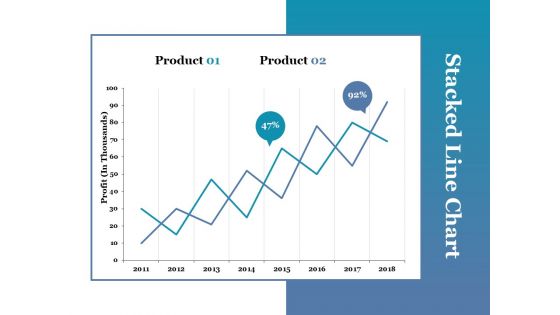
Stacked Line Chart Ppt PowerPoint Presentation Portfolio Picture
This is a stacked line chart ppt powerpoint presentation portfolio picture. This is a two stage process. The stages in this process are stacked line chart, product, profit, growth.
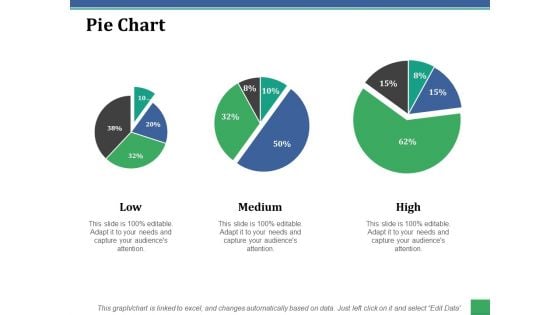
Pie Chart Ppt PowerPoint Presentation File Graphics Download
This is a pie chart ppt powerpoint presentation file graphics download. This is a three stage process. The stages in this process are low, medium, high, pie chart, finance.
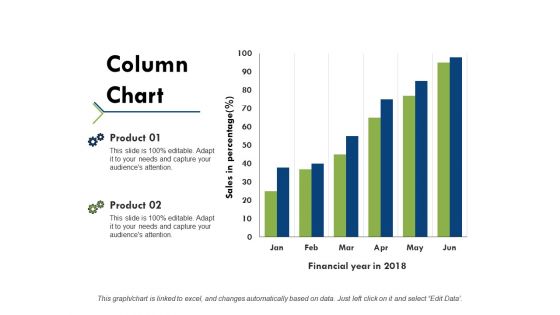
Column Chart Ppt PowerPoint Presentation Portfolio Example Topics
This is a column chart ppt powerpoint presentation portfolio example topics. This is a two stage process. The stages in this process are product, financial year, sales in percentage, column chart.
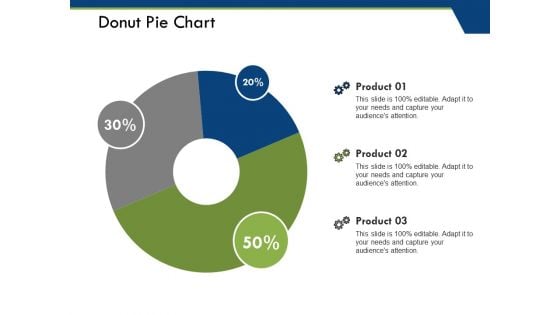
Donut Pie Chart Ppt PowerPoint Presentation Pictures File Formats
This is a donut pie chart ppt powerpoint presentation pictures file formats. This is a three stage process. The stages in this process are product, donut pie chart, percentage, business, marketing.
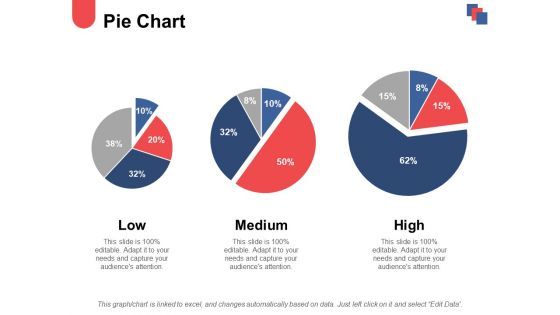
Pie Chart And Finance Ppt PowerPoint Presentation Ideas Demonstration
This is a pie chart and finance ppt powerpoint presentation ideas demonstration. This is a three stage process. The stages in this process are low, medium, high, pie chart, finance.
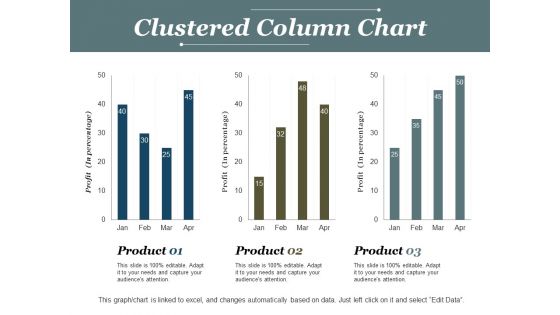
Clustered Column Chart Ppt PowerPoint Presentation Model Deck
This is a clustered column chart ppt powerpoint presentation model deck. This is a three stage process. The stages in this process are clustered column chart, product, finance, profit, business.
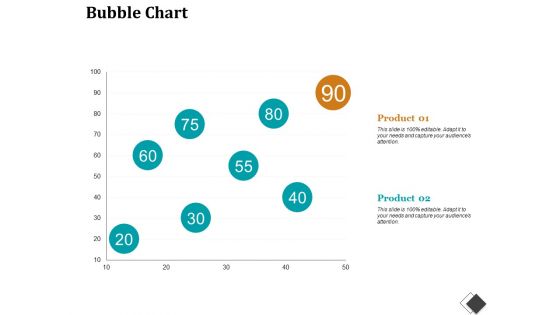
Bubble Chart Enterprise Model Canvas Ppt PowerPoint Presentation File Structure
This is a bubble chart enterprise model canvas ppt powerpoint presentation file structure. This is a two stage process. The stages in this process are bubble chart, finance, marketing, strategy, analysis, investment.
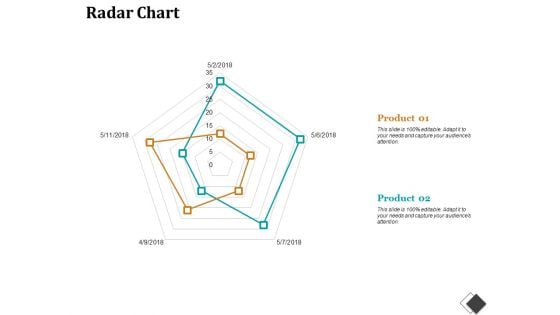
Radar Chart Enterprise Model Canvas Ppt PowerPoint Presentation File Slides
This is a radar chart enterprise model canvas ppt powerpoint presentation file slides. This is a two stage process. The stages in this process are radar chart, finance, marketing, strategy, business.
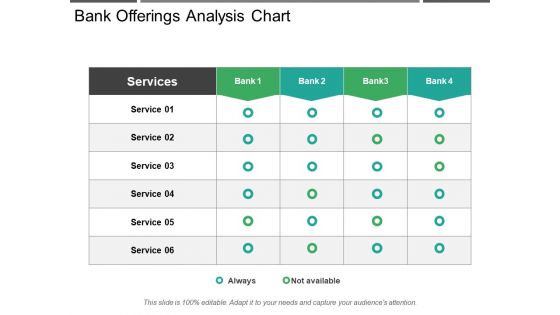
Bank Offerings Analysis Chart Ppt PowerPoint Presentation Slides Show
This is a bank offerings analysis chart ppt powerpoint presentation slides show. This is a five stage process. The stages in this process are comparison chart, comparison table, comparison matrix.
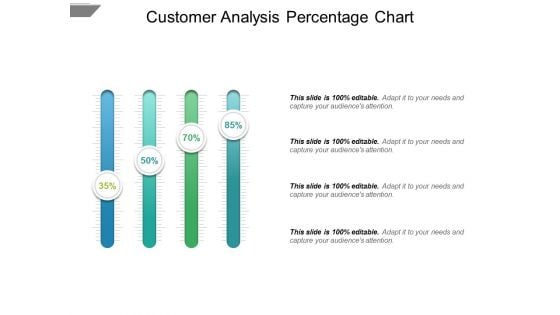
Customer Analysis Percentage Chart Ppt PowerPoint Presentation Infographics Master Slide
This is a customer analysis percentage chart ppt powerpoint presentation infographics master slide. This is a four stage process. The stages in this process are comparison chart, comparison table, comparison matrix.
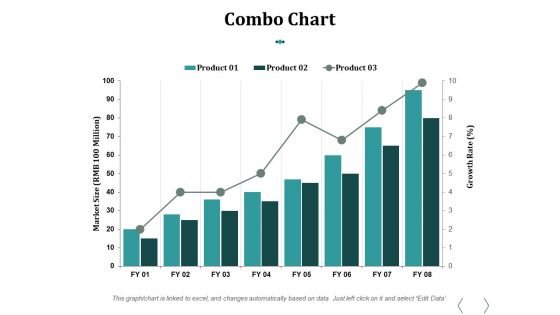
Combo Chart Ppt PowerPoint Presentation Summary Graphic Images
This is a combo chart ppt powerpoint presentation summary graphic images. This is a three stage process. The stages in this process are combo chart, product, growth, marketing, business.
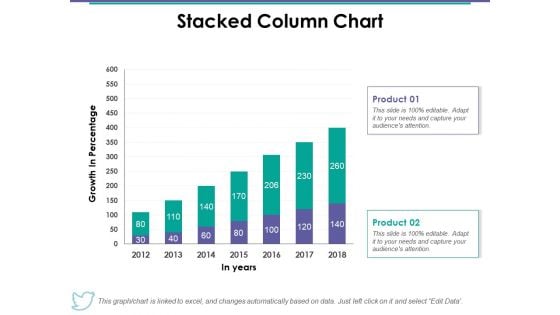
Stacked Column Chart Ppt PowerPoint Presentation Summary Gallery
This is a stacked column chart ppt powerpoint presentation summary gallery. This is a two stage process. The stages in this process are stacked column chart, product, in years, growth, percentage.
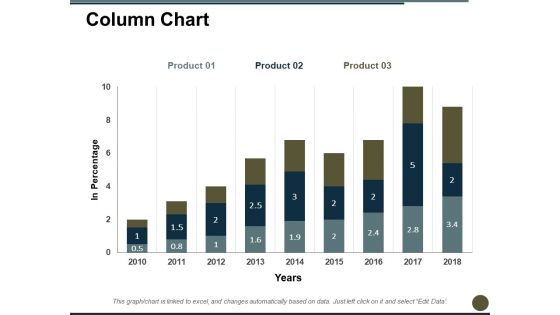
Column Chart Ppt PowerPoint Presentation Layouts File Formats
This is a column chart ppt powerpoint presentation layouts file formats. This is a three stage process. The stages in this process are column chart, product, in percentage, year, finance.
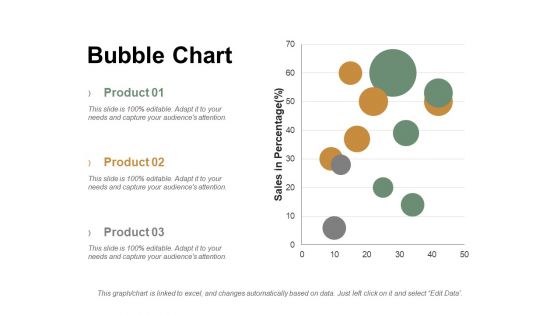
Bubble Chart Ppt PowerPoint Presentation Summary Graphics Tutorials
This is a bubble chart ppt powerpoint presentation summary graphics tutorials. This is a three stage process. The stages in this process are product, sales in percentage, bubble chart.
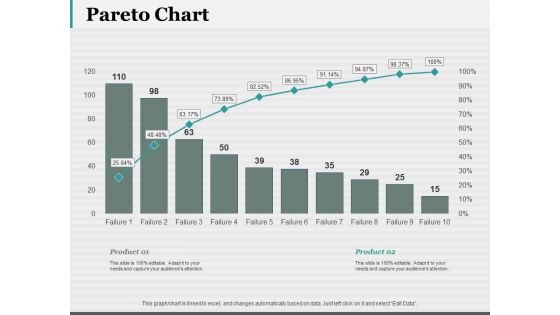
Pareto Chart Ppt PowerPoint Presentation Visual Aids Pictures
This is a pareto chart ppt powerpoint presentation visual aids pictures. This is a two stage process. The stages in this process are pareto chart, finance, marketing, strategy, business.

Bubble Chart Analysis Ppt PowerPoint Presentation Gallery Introduction
This is a bubble chart analysis ppt powerpoint presentation gallery introduction. This is a two stage process. The stages in this process are bubble chart, finance, marketing, strategy, business.
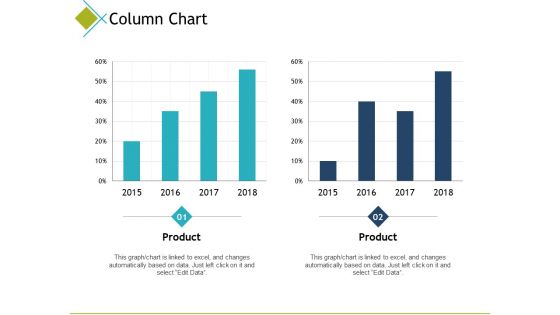
Column Chart Finance Ppt PowerPoint Presentation Model Examples
This is a column chart finance ppt powerpoint presentation model examples. This is a two stage process. The stages in this process are column chart, finance, marketing, analysis, investment.
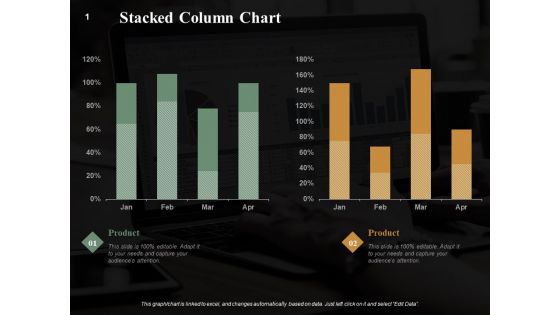
Stacked Column Chart Finance Ppt PowerPoint Presentation Summary Graphics Example
This is a stacked column chart finance ppt powerpoint presentation summary graphics example. This is a two stage process. The stages in this process are stacked column chart, marketing, analysis, business, investment.
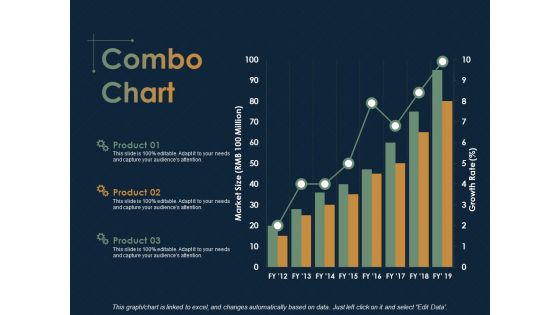
Combo Chart Finance Ppt PowerPoint Presentation Ideas Microsoft
This is a combo chart finance ppt powerpoint presentation ideas microsoft. This is a three stage process. The stages in this process are combo chart, Finance, Analysis, Business, Investment.

Area Chart Investment Ppt PowerPoint Presentation Styles Topics
This is a area chart investment ppt powerpoint presentation styles topics. This is a three stage process. The stages in this process are area chart, finance, marketing, analysis, investment.
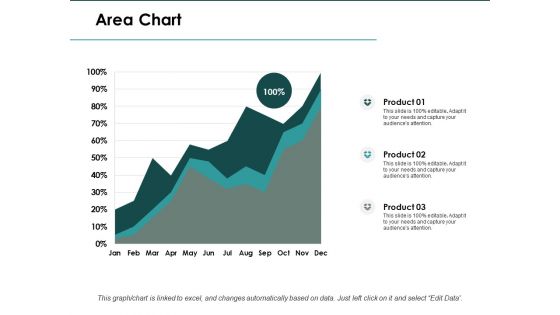
Area Chart Finance Ppt PowerPoint Presentation Infographics Slide
This is a area chart finance ppt powerpoint presentation infographics slide. This is a three stage process. The stages in this process are area chart, finance, marketing, analysis, investment.
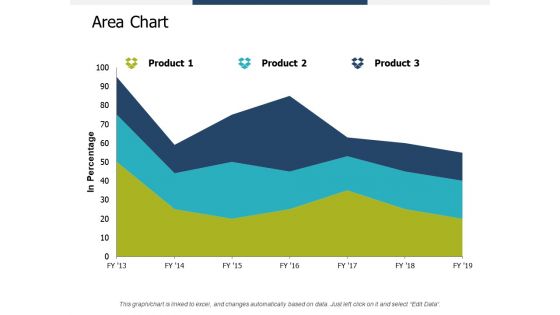
Area Chart Finance Marketing Ppt PowerPoint Presentation Gallery Styles
This is a area chart finance marketing ppt powerpoint presentation gallery styles. This is a three stage process. The stages in this process are area chart, finance, marketing, analysis, investment.
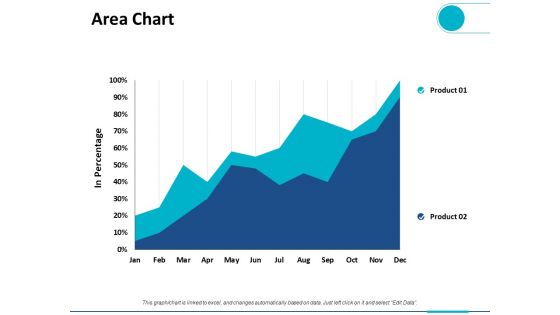
Area Chart Finance Ppt PowerPoint Presentation Pictures Clipart
This is a area chart finance ppt powerpoint presentation pictures clipart. This is a two stage process. The stages in this process are area chart, finance, marketing, analysis, investment.
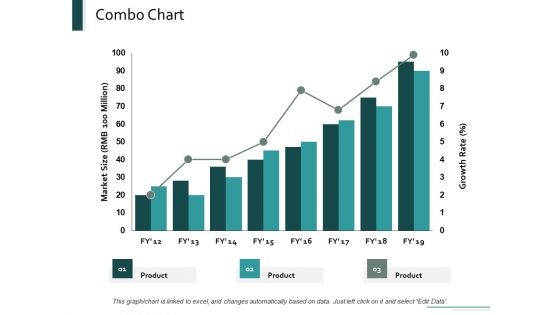
Combo Chart Marketing Ppt Powerpoint Presentation Layouts Designs Download
This is a combo chart marketing ppt powerpoint presentation layouts designs download. This is a three stage process. The stages in this process are combo chart, marketing, growth, product, finance.
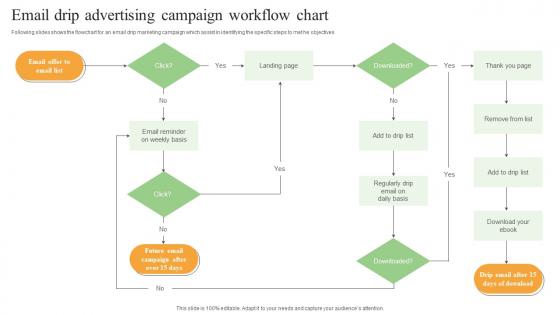
Email Drip Advertising Campaign Workflow Chart Inspiration Pdf
Following slides shows the flowchart for an email drip marketing campaign which assist in identifying the specific steps to met he objectives. Showcasing this set of slides titled Email Drip Advertising Campaign Workflow Chart Inspiration Pdf. The topics addressed in these templates are Landing Page, Email Offer, Email List. All the content presented in this PPT design is completely editable. Download it and make adjustments in color, background, font etc. as per your unique business setting. Following slides shows the flowchart for an email drip marketing campaign which assist in identifying the specific steps to met he objectives.
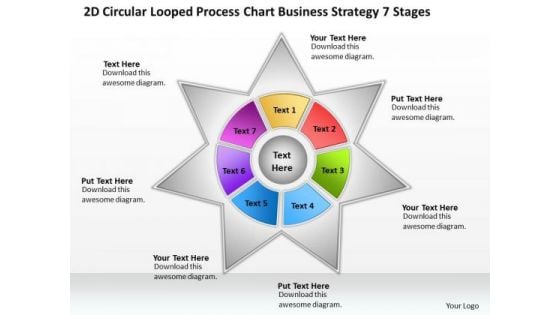
Timeline 2d Circular Looped Process Chart Business Strategy 7 Stages
Our Timeline 2D Circular Looped Process Chart Business Strategy 7 Stages are topically designed to provide an attractive backdrop to any subject. Use them to look like a presentation pro.Use our Timeline 2D Circular Looped Process Chart Business Strategy 7 Stages to effectively help you save your valuable time. They are readymade to fit into any presentation structure.
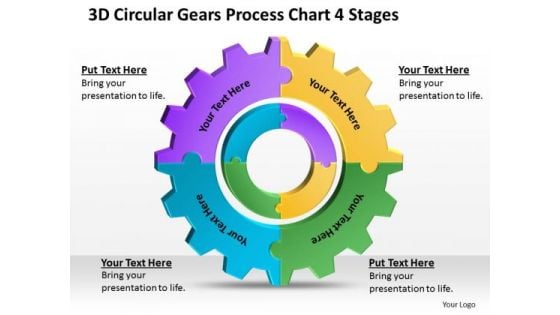
Timeline 3d Circular Gears Process Chart 4 Stages Timeline
Deadlines are an element of todays workplace. Our Timeline 3D Circular Gears Process Chart 4 Stages Timeline help you meet the demand. Just browse and pick the slides that appeal to your intuitive senses.Our Timeline 3D Circular Gears Process Chart 4 Stages Timeline will help you be quick off the draw. Just enter your specific text and see your points hit home.
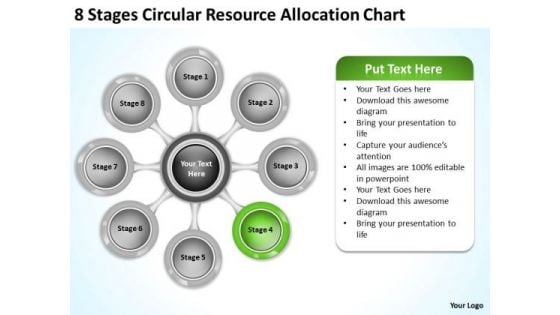
Business Planning Strategy Resource Allocation Chart Level Definition
We present our business planning strategy resource allocation chart level definition.Download and present our Process and Flows PowerPoint Templates because Our PowerPoint Templates and Slides will let you Leave a lasting impression to your audiences. They possess an inherent longstanding recall factor. Use our Circle Charts PowerPoint Templates because Our PowerPoint Templates and Slides are endowed to endure. Ideas conveyed through them will pass the test of time. Download our Ring Charts PowerPoint Templates because Our PowerPoint Templates and Slides has conjured up a web of all you need with the help of our great team. Use them to string together your glistening ideas. Download our Flow Charts PowerPoint Templates because Our PowerPoint Templates and Slides will let your words and thoughts hit bullseye everytime. Use our Marketing PowerPoint Templates because Our PowerPoint Templates and Slides are aesthetically designed to attract attention. We gaurantee that they will grab all the eyeballs you need.Use these PowerPoint slides for presentations relating to Abstract, arrows, business, central, centralized, chart, circle, circular,circulation, concept, conceptual, converging, design, diagram, eight, executive,icon, idea, illustration, management, map, mapping, mba, model, numbers,organization, outwards, pointing, procedure, process, radial, radiating,relationship, resource, sequence, sequential, square, strategy. The prominent colors used in the PowerPoint template are Green lime, Gray, White. Stop your audience's blank gaze. Get them interestedwith our Business Planning Strategy Resource Allocation Chart Level Definition. You'll deliver your best presentation yet.
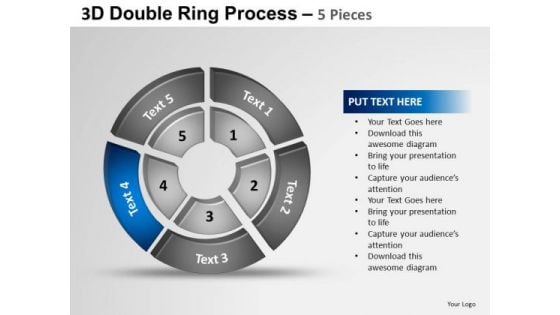
PowerPoint Slide Designs Chart Double Ring Ppt Theme
PowerPoint_Slide_Designs_Chart_Double_Ring_PPT_ThemeBusiness Power Points-Inspired by the indelible Olympic logo this graphic exemplifies the benefits of teamwork. Different people with differing ideas and priorities perform together to score. Hence this diagram has the unique ability to drive home your ideas and show how they mesh to guarantee success.- Put your customer in the spotlight with your thoughts. Centre it on him with our PowerPoint Slide Designs Chart Double Ring Ppt Theme.
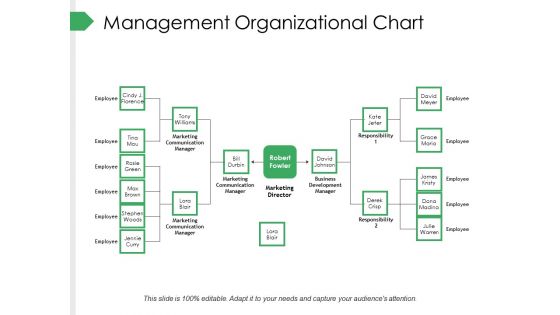
Management Organizational Chart Ppt PowerPoint Presentation Summary Gallery
This is a management organizational chart ppt powerpoint presentation summary gallery. This is a two stage process. The stages in this process are employee, marketing communication manager, marketing director, business development manager, responsibility, tony williams.
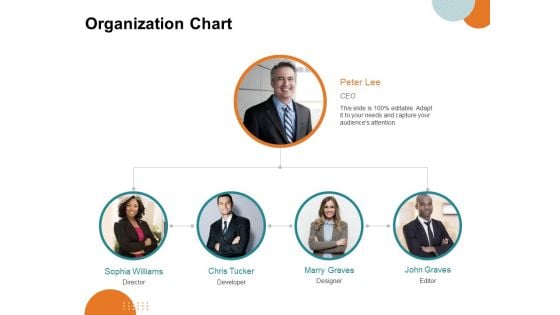
Key Product Distribution Channels Organization Chart Ppt Styles Infographics PDF
Presenting this set of slides with name key product distribution channels organization chart ppt styles infographics pdf. This is a five stage process. The stages in this process are organization chart. This is a completely editable PowerPoint presentation and is available for immediate download. Download now and impress your audience.
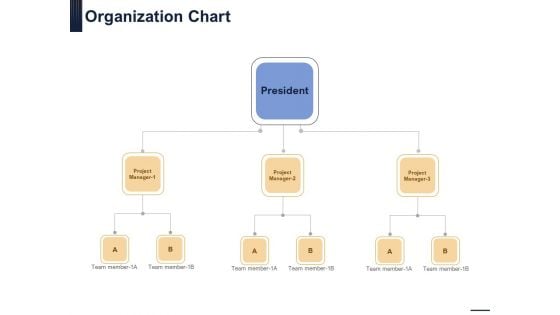
Guide Map Employee Experience Workplace Organization Chart Designs PDF
Presenting this set of slides with name guide map employee experience workplace organization chart designs pdf. This is a three stage process. The stages in this process are organization chart. This is a completely editable PowerPoint presentation and is available for immediate download. Download now and impress your audience.
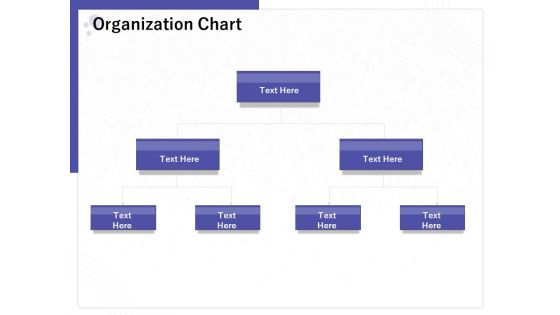
Determining Internalization Externalization Vendors Organization Chart Ppt File Deck PDF
Presenting this set of slides with name determining internalization externalization vendors organization chart ppt file deck pdf. This is a three stage process. The stages in this process are organization chart. This is a completely editable PowerPoint presentation and is available for immediate download. Download now and impress your audience.
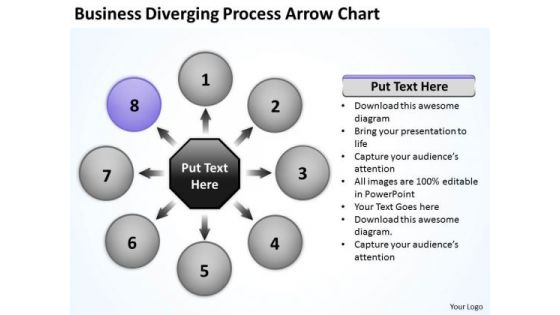
Business Diverging Process Arrows Chart Relative Cycle PowerPoint Slides
We present our business diverging process arrows chart Relative Cycle PowerPoint Slides.Use our Ring Charts PowerPoint Templates because in our day to day pursuits we tend to overlook the fundamentals. Use our Business PowerPoint Templates because your ideas too are pinpointedly focused on you goals. Download our Success PowerPoint Templates because your quest has taken you well onto the path of success. Use our Process and Flows PowerPoint Templates because you can Show them how to churn out fresh ideas. Download and present our Arrows PowerPoint Templates because this emphasises on the relevance and importance of all milestones along the way.Use these PowerPoint slides for presentations relating to Access, Arrow, Business, Chart, Circle, Concept, Conceptual, Connection, Design, Different, Element, Graphic, Group, Illustration, Process, Shape, Strategy, Symbol, Template, Vector, Web, Website. The prominent colors used in the PowerPoint template are Purple, Gray, Black. People tell us our business diverging process arrows chart Relative Cycle PowerPoint Slides are Handsome. Use our Concept PowerPoint templates and PPT Slides are Dynamic. Professionals tell us our business diverging process arrows chart Relative Cycle PowerPoint Slides are Nifty. Presenters tell us our Design PowerPoint templates and PPT Slides are Dazzling. Professionals tell us our business diverging process arrows chart Relative Cycle PowerPoint Slides will get their audience's attention. PowerPoint presentation experts tell us our Chart PowerPoint templates and PPT Slides are Energetic. Surpass your colleagues with our Business Diverging Process Arrows Chart Relative Cycle PowerPoint Slides. Download without worries with our money back guaranteee.
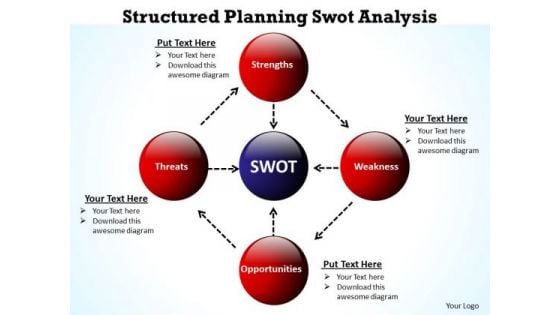
Business Organizational Chart Template Structured Planning Swot Analysis PowerPoint Slides
We present our business organizational chart template structured planning swot analysis PowerPoint Slides.Use our Circle Charts PowerPoint Templates because Our PowerPoint Templates and Slides are effectively colour coded to prioritise your plans They automatically highlight the sequence of events you desire. Download our Ring Charts PowerPoint Templates because Our PowerPoint Templates and Slides are created with admirable insight. Use them and give your group a sense of your logical mind. Download and present our Business PowerPoint Templates because Your ideas provide food for thought. Our PowerPoint Templates and Slides will help you create a dish to tickle the most discerning palate. Present our Flow Charts PowerPoint Templates because Our PowerPoint Templates and Slides are truly out of this world. Even the MIB duo has been keeping tabs on our team. Present our Process and Flows PowerPoint Templates because Our PowerPoint Templates and Slides are a sure bet. Gauranteed to win against all odds. Use these PowerPoint slides for presentations relating to Business, buy, clipart, commerce, concept, conceptual, consumer, customer, cycle, design, development, diagram, direction, guidelines, icon, illustration, know, life, lifecycle, like, manage, management, market, marketing, mix, model, optimize, organization, performance, process, refer, repeat, resource, sales, selling, stages. The prominent colors used in the PowerPoint template are Red, Blue navy, Black. People tell us our business organizational chart template structured planning swot analysis PowerPoint Slides are designed by a team of presentation professionals. PowerPoint presentation experts tell us our conceptual PowerPoint templates and PPT Slides will generate and maintain the level of interest you desire. They will create the impression you want to imprint on your audience. Presenters tell us our business organizational chart template structured planning swot analysis PowerPoint Slides are designed by professionals Use our cycle PowerPoint templates and PPT Slides are aesthetically designed to attract attention. We guarantee that they will grab all the eyeballs you need. Customers tell us our business organizational chart template structured planning swot analysis PowerPoint Slides will make the presenter look like a pro even if they are not computer savvy. People tell us our concept PowerPoint templates and PPT Slides will get their audience's attention. Make them feel up to it with our Business Organizational Chart Template Structured Planning Swot Analysis PowerPoint Slides. Assure them with your words.
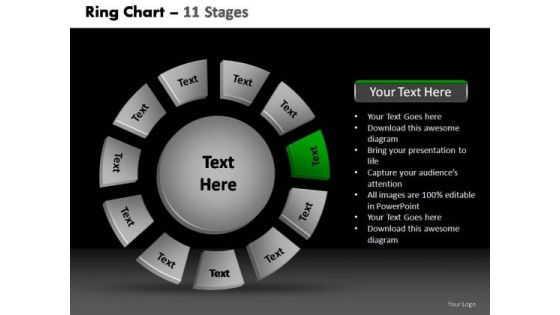
PowerPoint Process Chart Donut With Core Ppt Backgrounds
PowerPoint Process Chart Donut with Core PPT Backgrounds-These amazing PowerPoint pre-designed slides and PowerPoint templates have been carefully created by our team of experts to help you impress your audience. Our stunning collection of Powerpoint slides are 100% editable and can easily fit in any PowerPoint presentations. By using these animations and graphics in PowerPoint and you can easily make professional presentations. Any text can be entered at any point in the PowerPoint template or slide. Just DOWNLOAD our awesome PowerPoint templates and you are ready to go. The adaptability of our PowerPoint Process Chart Donut With Core Ppt Backgrounds is a fact. They will align with your bidding.
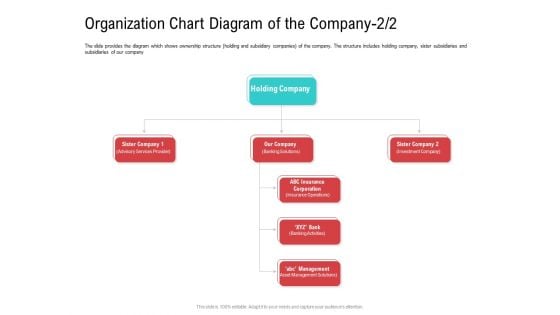
Organization Chart Diagram Of The Company Sister Mockup PDF
The slide provides the diagram which shows ownership structure holding and subsidiary companies of the company. The structure includes holding company, sister subsidiaries and subsidiaries of our company. Presenting organization chart diagram of the company sister mockup pdf to provide visual cues and insights. Share and navigate important information on two stages that need your due attention. This template can be used to pitch topics like organization chart diagram of the company. In addition, this PPT design contains high-resolution images, graphics, etc, that are easily editable and available for immediate download.
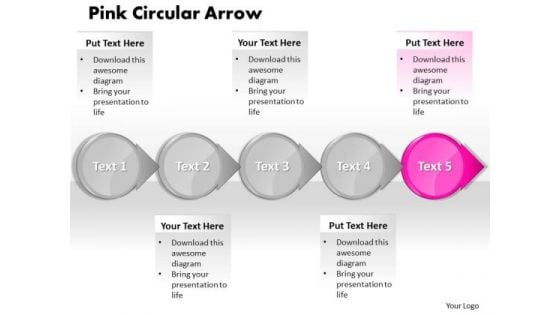
Ppt Pink Arrow Process Flow PowerPoint Template Chart Templates
PPT pink arrow process flow powerpoint template chart Templates-To display a structured combination of statements and achievements, our premium quality set of Circular Arrows - Horizontal for Microsoft PowerPoint describes the perfect tool. This compelling set consists of ready-made text layouts designed in the shape of arrows and text boxes. Those challenging charts offer a large variety of options. All elements are editable and can be changed e. g. in color or size.-PPT pink arrow process flow powerpoint template chart Templates-abstract, access, arrow, background, banner, business, chart, circle, color, concept, connection, corporate, creative, cycle, design, different, element, graphic, group, idea, illustration, process, red, shape, speech, strategy, symbol, template, text, usable, vector, Be superman with our Ppt Pink Arrow Process Flow PowerPoint Template Chart Templates. You will come out on top.
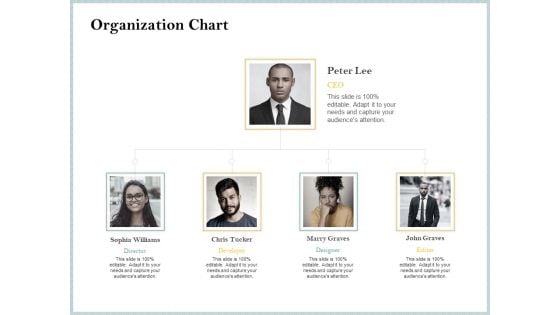
Steps To Create Ultimate Client Experience Organization Chart Themes PDF
Presenting steps to create ultimate client experience organization chart themes pdf to provide visual cues and insights. Share and navigate important information on five stages that need your due attention. This template can be used to pitch topics like organization chart. In addtion, this PPT design contains high resolution images, graphics, etc, that are easily editable and available for immediate download.
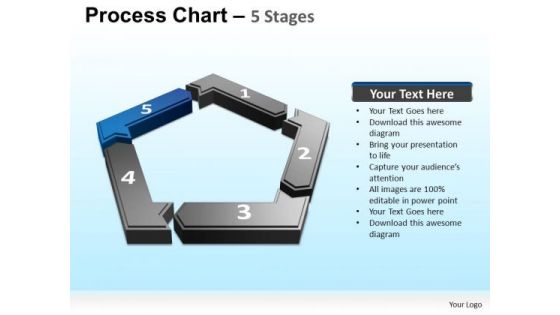
PowerPoint Presentation Teamwork Process Chart Ppt Presentation Designs
PowerPoint Presentation Teamwork process chart PPT Presentation Designs-These Fabulous PowerPoint slides and PowerPoint templates have been delicately designed by our professional team to leave long-lasting impressions on your audiences Analyse the effect of different factors. Our PowerPoint Presentation Teamwork Process Chart Ppt Presentation Designs will give them equal attention.


 Continue with Email

 Home
Home


