Control Chart
Vaccines Effectiveness Chart In Powerpoint And Google Slides Cpb
Presenting our innovatively designed set of slides titled Vaccines Effectiveness Chart In Powerpoint And Google Slides Cpb. This completely editable PowerPoint graphic exhibits Vaccines Effectiveness Chart that will help you convey the message impactfully. It can be accessed with Google Slides and is available in both standard screen and widescreen aspect ratios. Apart from this, you can download this well structured PowerPoint template design in different formats like PDF, JPG, and PNG. So, click the download button now to gain full access to this PPT design. Our Vaccines Effectiveness Chart In Powerpoint And Google Slides Cpb are topically designed to provide an attractive backdrop to any subject. Use them to look like a presentation pro.
Kindle Tablet Comparison Chart In Powerpoint And Google Slides Cpb
Introducing our well designed Kindle Tablet Comparison Chart In Powerpoint And Google Slides Cpb This PowerPoint design presents information on topics like Kindle Tablet Comparison Chart As it is predesigned it helps boost your confidence level. It also makes you a better presenter because of its high quality content and graphics. This PPT layout can be downloaded and used in different formats like PDF, PNG, and JPG. Not only this, it is available in both Standard Screen and Widescreen aspect ratios for your convenience. Therefore, click on the download button now to persuade and impress your audience. Our Kindle Tablet Comparison Chart In Powerpoint And Google Slides Cpb are topically designed to provide an attractive backdrop to any subject. Use them to look like a presentation pro.
Blood Pressure Chart In Powerpoint And Google Slides Cpb
Introducing our well designed Blood Pressure Chart In Powerpoint And Google Slides Cpb. This PowerPoint design presents information on topics like Blood Pressure Chart. As it is predesigned it helps boost your confidence level. It also makes you a better presenter because of its high quality content and graphics. This PPT layout can be downloaded and used in different formats like PDF, PNG, and JPG. Not only this, it is available in both Standard Screen and Widescreen aspect ratios for your convenience. Therefore, click on the download button now to persuade and impress your audience. Our Blood Pressure Chart In Powerpoint And Google Slides Cpb are topically designed to provide an attractive backdrop to any subject. Use them to look like a presentation pro.
Hockey Cage Size Chart In Powerpoint And Google Slides Cpb
Presenting our innovatively designed set of slides titled Hockey Cage Size Chart In Powerpoint And Google Slides Cpb. This completely editable PowerPoint graphic exhibits Hockey Cage Size Chart that will help you convey the message impactfully. It can be accessed with Google Slides and is available in both standard screen and widescreen aspect ratios. Apart from this, you can download this well structured PowerPoint template design in different formats like PDF, JPG, and PNG. So, click the download button now to gain full access to this PPT design. Our Hockey Cage Size Chart In Powerpoint And Google Slides Cpb are topically designed to provide an attractive backdrop to any subject. Use them to look like a presentation pro.
Dehydration Headache Location Chart In Powerpoint And Google Slides Cpb
Introducing our well designed Dehydration Headache Location Chart In Powerpoint And Google Slides Cpb. This PowerPoint design presents information on topics like Dehydration Headache Location Chart. As it is predesigned it helps boost your confidence level. It also makes you a better presenter because of its high quality content and graphics. This PPT layout can be downloaded and used in different formats like PDF, PNG, and JPG. Not only this, it is available in both Standard Screen and Widescreen aspect ratios for your convenience. Therefore, click on the download button now to persuade and impress your audience. Our Dehydration Headache Location Chart In Powerpoint And Google Slides Cpb are topically designed to provide an attractive backdrop to any subject. Use them to look like a presentation pro.
Contraceptive Methods Flow Chart In Powerpoint And Google Slides Cpb
Introducing our well-designed Contraceptive Methods Flow Chart In Powerpoint And Google Slides Cpb. This PowerPoint design presents information on topics like Contraceptive Methods Flow Chart. As it is predesigned it helps boost your confidence level. It also makes you a better presenter because of its high-quality content and graphics. This PPT layout can be downloaded and used in different formats like PDF, PNG, and JPG. Not only this, it is available in both Standard Screen and Widescreen aspect ratios for your convenience. Therefore, click on the download button now to persuade and impress your audience. Our Contraceptive Methods Flow Chart In Powerpoint And Google Slides Cpb are topically designed to provide an attractive backdrop to any subject. Use them to look like a presentation pro.
Should Oxygen Levels Chart In Powerpoint And Google Slides Cpb
Presenting our innovatively designed set of slides titled Should Oxygen Levels Chart In Powerpoint And Google Slides Cpb This completely editable PowerPoint graphic exhibits Should Oxygen Levels Chart that will help you convey the message impactfully. It can be accessed with Google Slides and is available in both standard screen and widescreen aspect ratios. Apart from this, you can download this well structured PowerPoint template design in different formats like PDF, JPG, and PNG. So, click the download button now to gain full access to this PPT design. Our Should Oxygen Levels Chart In Powerpoint And Google Slides Cpb are topically designed to provide an attractive backdrop to any subject. Use them to look like a presentation pro.
Comparison Chart Template Powerpoint In Powerpoint And Google Slides Cpb
Introducing our well-designed Comparison Chart Template Powerpoint In Powerpoint And Google Slides Cpb. This PowerPoint design presents information on topics like Comparison Chart Template Powerpoint. As it is predesigned it helps boost your confidence level. It also makes you a better presenter because of its high-quality content and graphics. This PPT layout can be downloaded and used in different formats like PDF, PNG, and JPG. Not only this, it is available in both Standard Screen and Widescreen aspect ratios for your convenience. Therefore, click on the download button now to persuade and impress your audience. Our Comparison Chart Template Powerpoint In Powerpoint And Google Slides Cpb are topically designed to provide an attractive backdrop to any subject. Use them to look like a presentation pro.
Language Milestone Timeline Chart In Powerpoint And Google Slides Cpb
Presenting our innovatively-designed set of slides titled Language Milestone Timeline Chart In Powerpoint And Google Slides Cpb. This completely editable PowerPoint graphic exhibits Language Milestone Timeline Chart that will help you convey the message impactfully. It can be accessed with Google Slides and is available in both standard screen and widescreen aspect ratios. Apart from this, you can download this well-structured PowerPoint template design in different formats like PDF, JPG, and PNG. So, click the download button now to gain full access to this PPT design. Our Language Milestone Timeline Chart In Powerpoint And Google Slides Cpb are topically designed to provide an attractive backdrop to any subject. Use them to look like a presentation pro.
Processor Comparison Chart In Powerpoint And Google Slides Cpb
Introducing our well-designed Processor Comparison Chart In Powerpoint And Google Slides Cpb. This PowerPoint design presents information on topics like Processor Comparison Chart. As it is predesigned it helps boost your confidence level. It also makes you a better presenter because of its high-quality content and graphics. This PPT layout can be downloaded and used in different formats like PDF, PNG, and JPG. Not only this, it is available in both Standard Screen and Widescreen aspect ratios for your convenience. Therefore, click on the download button now to persuade and impress your audience. Our Processor Comparison Chart In Powerpoint And Google Slides Cpb are topically designed to provide an attractive backdrop to any subject. Use them to look like a presentation pro.
Design Chart Paper In Powerpoint And Google Slides Cpb
Introducing our well designed Design Chart Paper In Powerpoint And Google Slides Cpb. This PowerPoint design presents information on topics like Design Chart Paper. As it is predesigned it helps boost your confidence level. It also makes you a better presenter because of its high quality content and graphics. This PPT layout can be downloaded and used in different formats like PDF, PNG, and JPG. Not only this, it is available in both Standard Screen and Widescreen aspect ratios for your convenience. Therefore, click on the download button now to persuade and impress your audience. Our Design Chart Paper In Powerpoint And Google Slides Cpb are topically designed to provide an attractive backdrop to any subject. Use them to look like a presentation pro.
Conversion Chart Calculator In Powerpoint And Google Slides Cpb
Introducing our well designed Conversion Chart Calculator In Powerpoint And Google Slides Cpb. This PowerPoint design presents information on topics like Conversion Chart Calculator. As it is predesigned it helps boost your confidence level. It also makes you a better presenter because of its high quality content and graphics. This PPT layout can be downloaded and used in different formats like PDF, PNG, and JPG. Not only this, it is available in both Standard Screen and Widescreen aspect ratios for your convenience. Therefore, click on the download button now to persuade and impress your audience. Our Conversion Chart Calculator In Powerpoint And Google Slides Cpb are topically designed to provide an attractive backdrop to any subject. Use them to look like a presentation pro.
Gantt Chart Of Project Tracking And Management Template PDF
This slide illustrates timeline for various tasks of project. It shows monthly time limit of tasks assigned. Showcasing this set of slides titled Gantt Chart Of Project Tracking And Management Template PDF. The topics addressed in these templates are Gantt Chart, Project Tracking And Management. All the content presented in this PPT design is completely editable. Download it and make adjustments in color, background, font etc. as per your unique business setting.
Management Vision And Policy Chart Powerpoint Slide Template
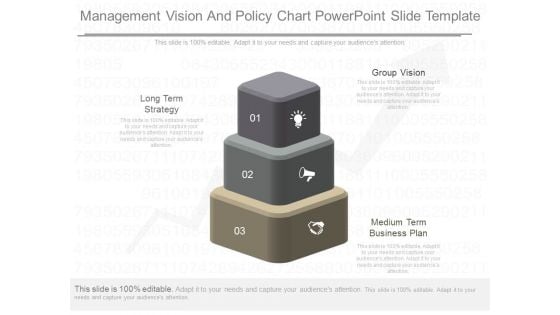
This is a management vision and policy chart powerpoint slide template. This is a three stage process. The stages in this process are long term strategy, group vision, medium term business plan.
Business Diagram Ring Chart Diagram 12 Stages Consulting Diagram
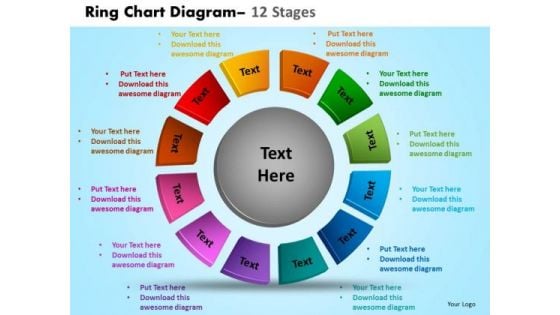
Be The Doer With Our Business Diagram Ring Chart Diagram 12 Stages Consulting Diagram Powerpoint Templates. Put Your Thoughts Into Practice. Your Ideas Will Do The Trick. Wave The Wand With Our Business Diagram Ring Chart Diagram 12 Stages Consulting Diagram Powerpoint Templates.
Business Development Process Flow Chart Ppt PowerPoint Presentation Icon Show
This is a business development process flow chart ppt powerpoint presentation icon show. This is a three stage process. The stages in this process are operational excellence, operational plan, operational process.
Business Diagram 3d Round Chart 5 Stages Sales Diagram
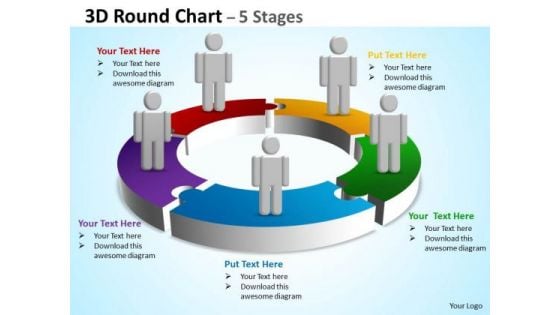
Be The Doer With Our Business Diagram 3d Round Chart 5 Stages Sales Diagram Powerpoint Templates. Put Your Thoughts Into Practice. Your Ideas Will Do The Trick. Wave The Wand With Our Business Diagram 3d Round Chart 5 Stages Sales Diagram Powerpoint Templates.
Strategy Diagram 3d Circular Chart 3 Stages Marketing Diagram
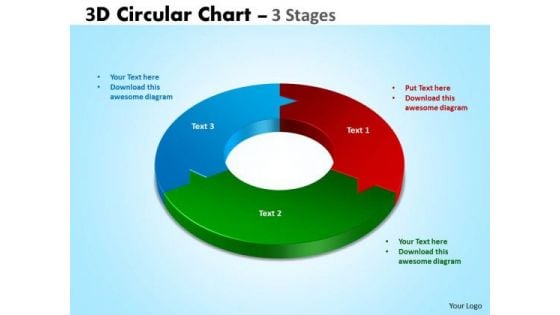
Our Strategy Diagram 3D Circular Chart 3 Stages Marketing Diagram Powerpoint Templates and your ideas make a great doubles pair. Play the net with assured hands. Transfer the dossier onto our Strategy Diagram 3D Circular Chart 3 Stages Marketing Diagram Powerpoint Templates. Share your views on an open platform.
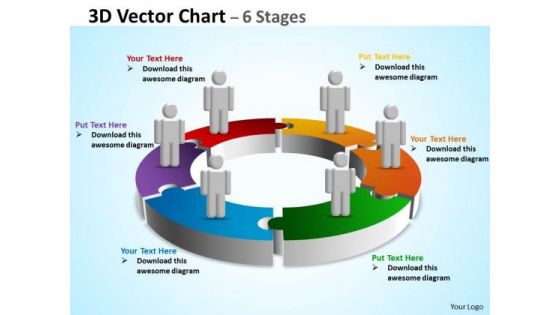
Sales Diagram 3d Vector Chart 6 Stages Consulting Diagram
Our Sales Diagram 3d Vector Chart 6 Stages Consulting Diagram Powerpoint Templates Leave No One In Doubt. Provide A Certainty To Your Views. Some Of Your Team Maybe A Little Doubtful. Assure Them With Certainty Through Our Sales Diagram 3d Vector Chart 6 Stages Consulting Diagram Powerpoint Templates.
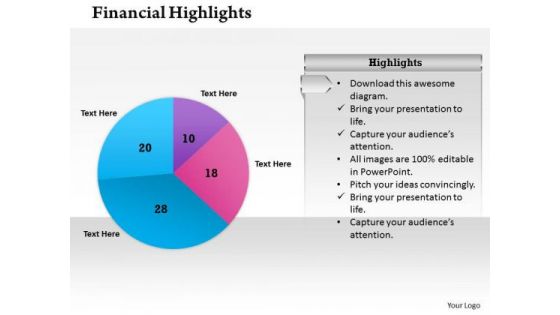
Sales Diagram Pie Chart For Financial Result Business Diagram
Knock On The Door To Success With Our Sales Diagram Pie Chart For Financial Result Business Diagram Powerpoint Templates. Be Assured Of Gaining Entry. Give Them A Dose Of Your Ability. It Will Go Down Well With Our Sales Diagram Pie Chart For Financial Result Business Diagram Powerpoint Templates.

Concentric Sphere Chart Slide For Comparison Ppt Portfolio Inspiration PDF
Presenting concentric sphere chart slide for comparison ppt portfolio inspiration pdf to dispense important information. This template comprises four stages. It also presents valuable insights into the topics including concentric sphere chart slide for comparison. This is a completely customizable PowerPoint theme that can be put to use immediately. So, download it and address the topic impactfully.
Business Finance Strategy Development Five Way Progress Chart Sales Diagram
Be the doer with our Business Finance Strategy Development Five Way Progress Chart Sales Diagram Powerpoint Templates. Put your thoughts into practice. Your ideas will do the trick. Wave the wand with our Business Finance Strategy Development Five Way Progress Chart Sales Diagram Powerpoint Templates.
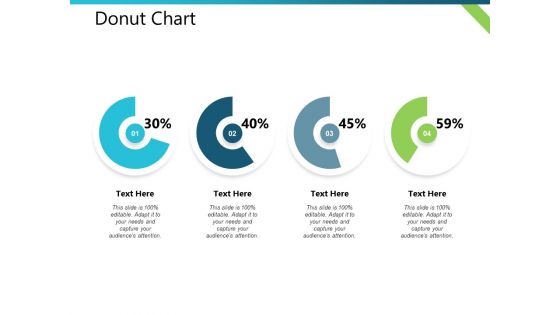
Donut Chart Distribution Plan Ppt PowerPoint Presentation Visual Aids Outline
This is a donut chart distribution plan ppt powerpoint presentation visual aids outline. This is a four stage process. The stages in this process are business, management, financial, marketing, strategy.

Organization Chart Template Ppt PowerPoint Presentation Infographic Template Styles
This is a organization chart template ppt powerpoint presentation infographic template styles. This is a four stage process. The stages in this process are john smith, anita carol, merry doe, jess parker.
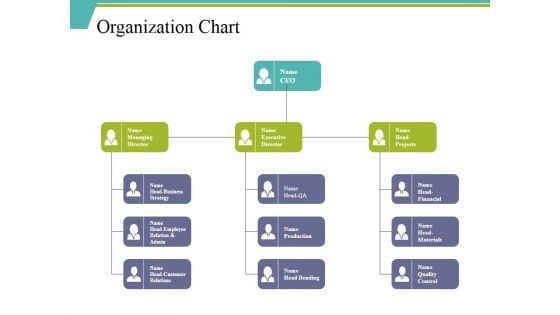
Organization Chart Ppt PowerPoint Presentation File Background Designs
This is a organization chart ppt powerpoint presentation file background designs. This is a three stage process. The stages in this process are ceo, executive director, head financial, production, head bending.
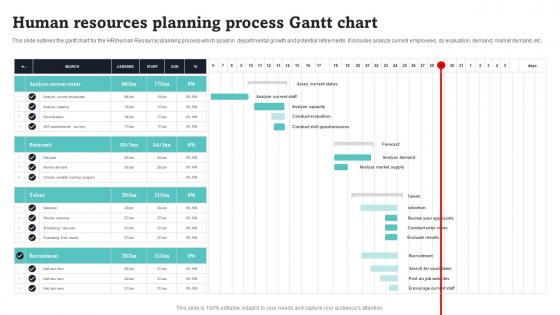
Human Resources Planning Process Gantt Chart Portrait Pdf
This slide outlines the gantt chart for the HRhuman Resource planning process which assist in departmental growth and potential retirements. It includes analyze current employees, do evaluation, demand, market demand, etc. Pitch your topic with ease and precision using this Human Resources Planning Process Gantt Chart Portrait Pdf. This layout presents information on Analyze Current Status, Forecast, Talent. It is also available for immediate download and adjustment. So, changes can be made in the color, design, graphics or any other component to create a unique layout. This slide outlines the gantt chart for the HRhuman Resource planning process which assist in departmental growth and potential retirements. It includes analyze current employees, do evaluation, demand, market demand, etc.
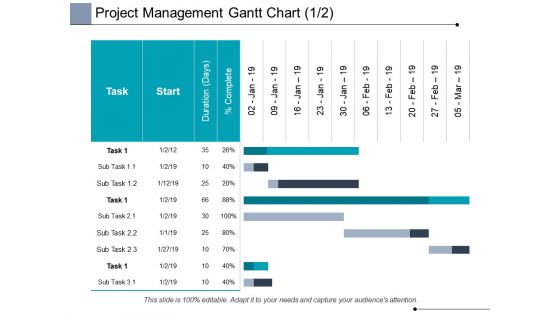
Project Management Gantt Chart Planning Ppt PowerPoint Presentation Visuals
This is a project management gantt chart planning ppt powerpoint presentation visuals. This is a three stage process. The stages in this process are business, planning, strategy, marketing, management.
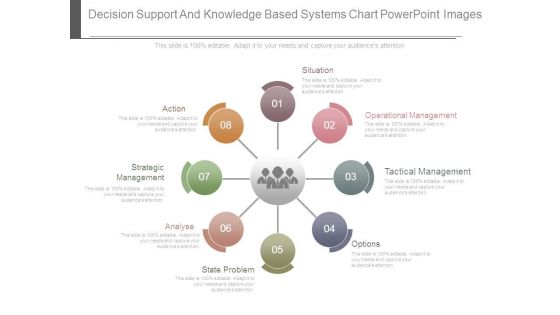
Decision Support And Knowledge Based Systems Chart Powerpoint Images
This is a decision support and knowledge based systems chart powerpoint images. This is a eight stage process. The stages in this process are situation, operational management, tactical management, options, state problem, analyse, strategic management, action.
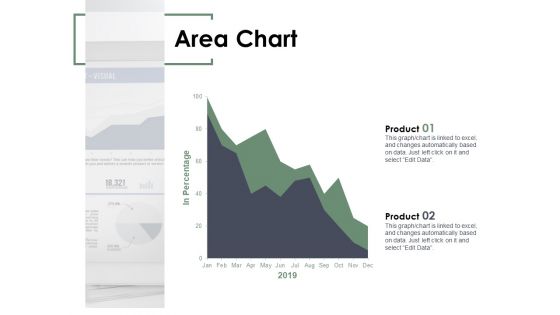
Area Chart Analysis Ppt PowerPoint Presentation Layouts Graphics Design
Presenting this set of slides with name area chart analysis ppt powerpoint presentation layouts graphics design. The topics discussed in these slides are area chart, finance, marketing, management, investment. This is a completely editable PowerPoint presentation and is available for immediate download. Download now and impress your audience.
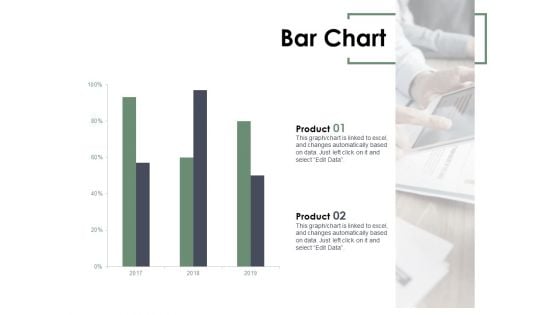
Bar Chart Analysis Ppt PowerPoint Presentation Infographic Template Infographics
Presenting this set of slides with name bar chart analysis ppt powerpoint presentation infographic template infographics. The topics discussed in these slides are bar chart, finance, marketing, management, investment. This is a completely editable PowerPoint presentation and is available for immediate download. Download now and impress your audience.
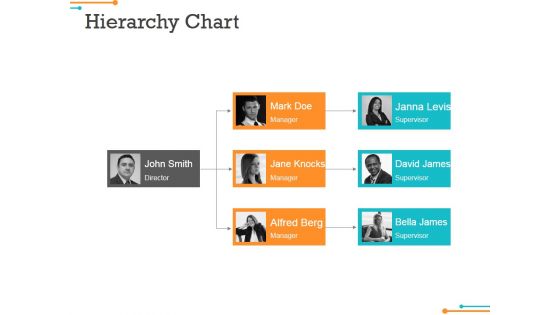
Hierarchy Chart Ppt Powerpoint Presentation Portfolio Slide Portrait
This is a hierarchy chart ppt powerpoint presentation portfolio slide portrait. This is a three stage process. The stages in this process are john smith director, mark doe manager, jane knocks manager.

Portfolio Gantt Chart Ppt PowerPoint Presentation Complete Deck With Slides
This is a portfolio gantt chart ppt powerpoint presentation complete deck with slides. This is a one stage process. The stages in this process are business, management, marketing, strategy, planning.
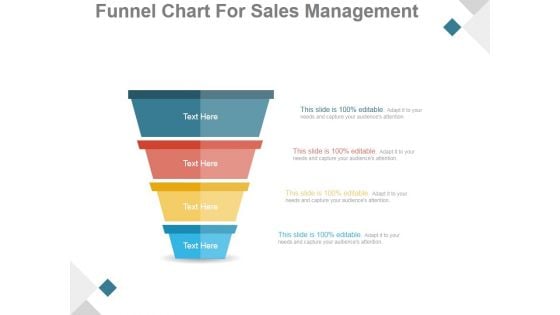
Funnel Chart For Sales Management Ppt PowerPoint Presentation Styles
This is a funnel chart for sales management ppt powerpoint presentation styles. This is a four stage process. The stages in this process are funnel, process, flow, business, sale.
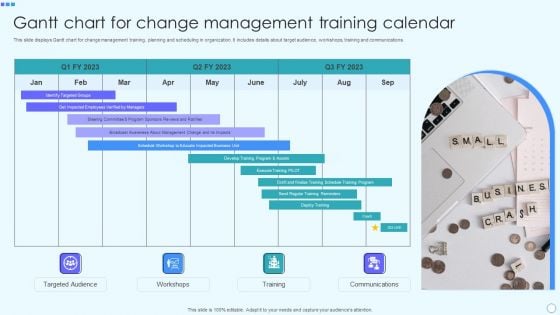
Gantt Chart For Change Management Training Calendar Diagrams PDF
This slide displays Gantt chart for change management training, planning and scheduling in organization. It includes details about target audience, workshops, training and communications. Presenting Gantt Chart For Change Management Training Calendar Diagrams PDF to dispense important information. This template comprises one stages. It also presents valuable insights into the topics including Targeted Audience, Workshops, Training, Communications. This is a completely customizable PowerPoint theme that can be put to use immediately. So, download it and address the topic impactfully.
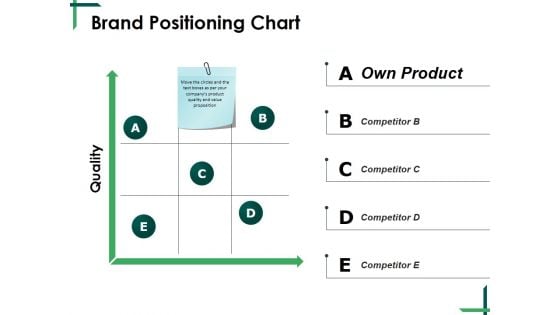
Brand Positioning Chart Ppt PowerPoint Presentation Outline Slide Download
This is a brand positioning chart ppt powerpoint presentation outline slide download. This is a five stage process. The stages in this process are quality, own product, business, management, matrix.
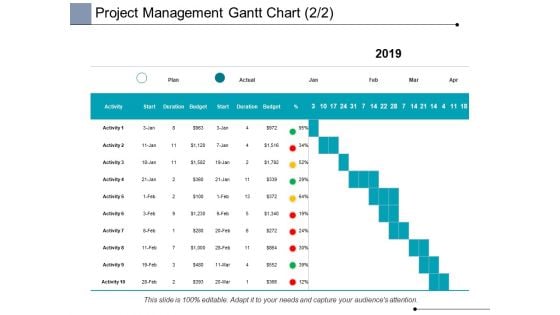
Project Management Gantt Chart Business Ppt PowerPoint Presentation Portfolio
This is a project management gantt chart business ppt powerpoint presentation portfolio. This is a four stage process. The stages in this process are business, planning, strategy, marketing, management.
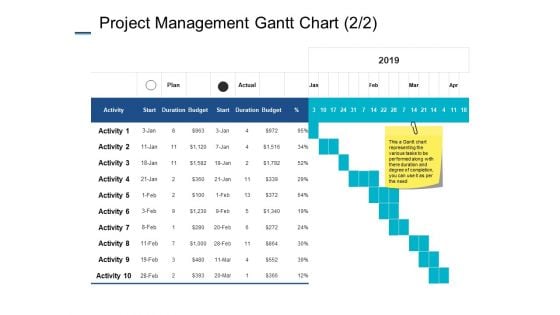
Project Management Gantt Chart Marketing Ppt PowerPoint Presentation Styles Files
This is a project management gantt chart marketing ppt powerpoint presentation styles files. This is a two stage process. The stages in this process are business, planning, strategy, marketing, management.
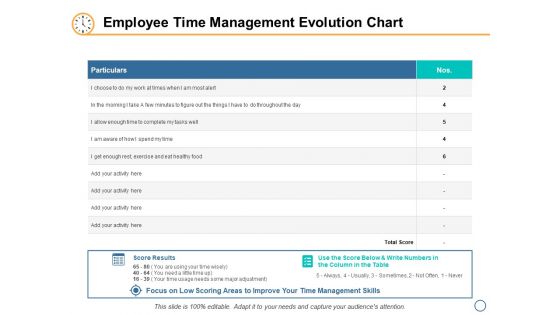
Employee Time Management Evolution Chart Ppt PowerPoint Presentation Slides Outfit
This is a employee time management evolution chart ppt powerpoint presentation slides outfit. This is a two stage process. The stages in this process are business, planning, strategy, marketing, management.
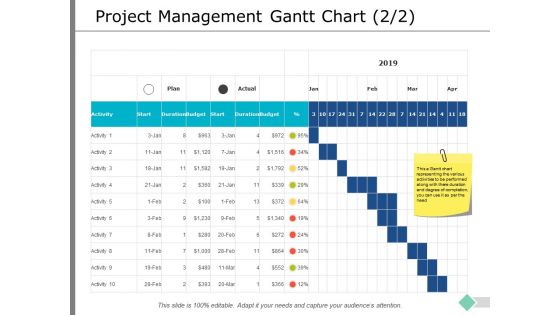
Project Management Gantt Chart Ppt PowerPoint Presentation Show Gridlines
This is a project management gantt chart ppt powerpoint presentation show gridlines. This is a two stage process. The stages in this process are business, planning, strategy, marketing, management.

Project Management Gantt Chart Finance Ppt PowerPoint Presentation Pictures Vector
This is a project management gantt chart finance ppt powerpoint presentation pictures vector. This is a four stage process. The stages in this process are compare, marketing, business, management, planning.
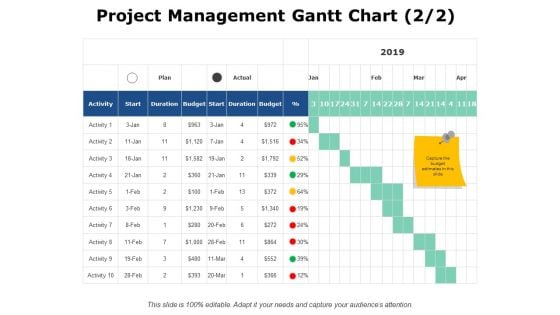
Project Management Gantt Chart Finance Ppt PowerPoint Presentation Infographics Files
This is a project management gantt chart finance ppt powerpoint presentation infographics files. This is a six stage process. The stages in this process are business, planning, strategy, marketing, management.
Project Management Gantt Chart Ppt PowerPoint Presentation Icon Example
This is a project management gantt chart ppt powerpoint presentation icon example. This is a ten stage process. The stages in this process are lists, table, data, management, marketing.
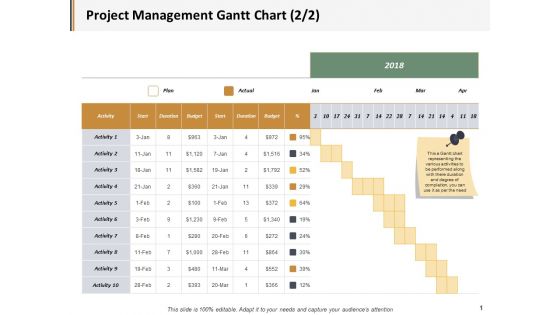
Project Management Gantt Chart Marketing Ppt PowerPoint Presentation Show Guide
This is a project management gantt chart marketing ppt powerpoint presentation show guide. This is a three stage process. The stages in this process are business, management, marketing, compare.
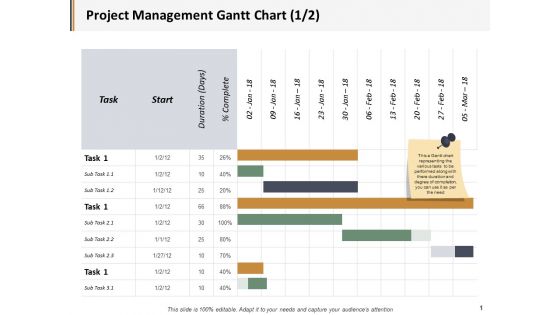
Project Management Gantt Chart Ppt PowerPoint Presentation File Graphic Images
This is a project management gantt chart ppt powerpoint presentation file graphic images. This is a three stage process. The stages in this process are business, management, marketing, compare.
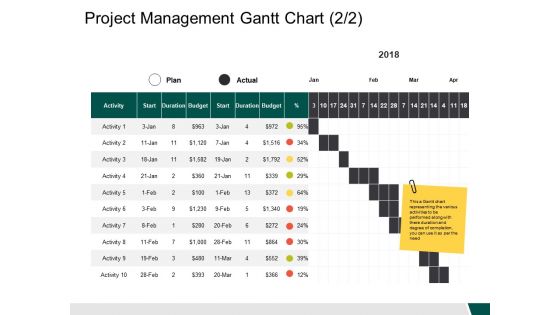
Project Management Gantt Chart Activity Ppt PowerPoint Presentation Inspiration Samples
This is a project management gantt chart activity ppt powerpoint presentation inspiration samples. This is a ten stage process. The stages in this process are business, management, strategy, analysis, marketing.
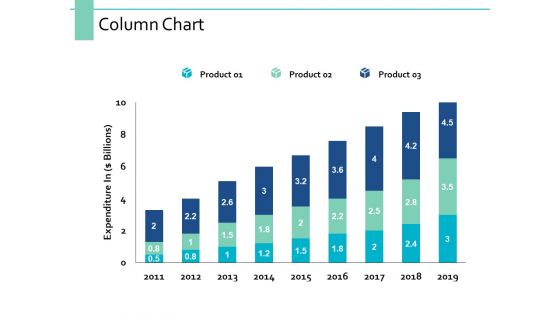
Column Chart Marketing Management Ppt PowerPoint Presentation Professional Images
This is a column chart marketing management ppt powerpoint presentation professional images. This is a three stage process. The stages in this process are finance, marketing, management, investment, analysis.
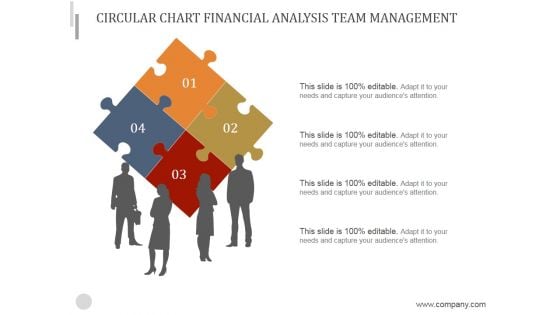
Circular Chart Financial Analysis Team Management Ppt PowerPoint Presentation Guide
This is a circular chart financial analysis team management ppt powerpoint presentation guide. This is a four stage process. The stages in this process are puzzle, teamwork, business, marketing, analysis.
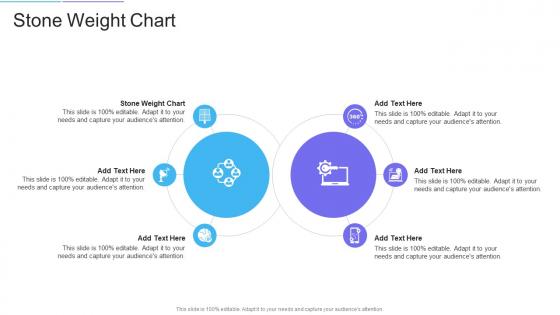
Stone Weight Chart In Powerpoint And Google Slides Cpb
Presenting our innovatively designed set of slides titled Stone Weight Chart In Powerpoint And Google Slides Cpb. This completely editable PowerPoint graphic exhibits Stone Weight Chart that will help you convey the message impactfully. It can be accessed with Google Slides and is available in both standard screen and widescreen aspect ratios. Apart from this, you can download this well-structured PowerPoint template design in different formats like PDF, JPG, and PNG. So, click the download button now to gain full access to this PPT design. Our Stone Weight Chart In Powerpoint And Google Slides Cpb are topically designed to provide an attractive backdrop to any subject. Use them to look like a presentation pro.
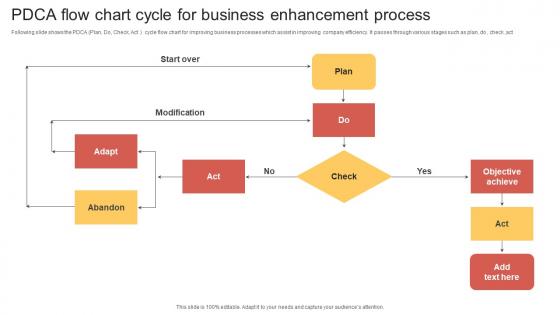
PDCA Flow Chart Cycle For Business Enhancement Process Clipart Pdf
Following slide shows the PDCA Plan, Do, Check, Act cycle flow chart for improving business processes which assist in improving company efficiency. It passes through various stages such as plan, do , check ,act Pitch your topic with ease and precision using this PDCA Flow Chart Cycle For Business Enhancement Process Clipart Pdf. This layout presents information on Modification, Abandon, Start Over. It is also available for immediate download and adjustment. So, changes can be made in the color, design, graphics or any other component to create a unique layout. Following slide shows the PDCA Plan, Do, Check, Act cycle flow chart for improving business processes which assist in improving company efficiency. It passes through various stages such as plan, do , check ,act
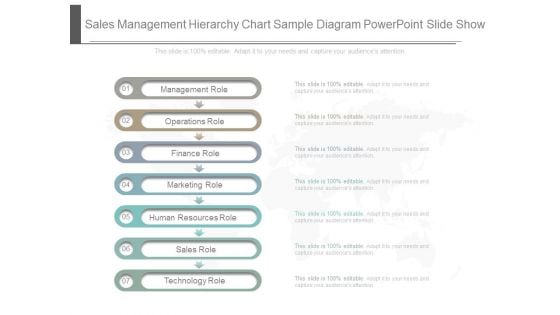
Sales Management Hierarchy Chart Sample Diagram Powerpoint Slide Show
This is a sales management hierarchy chart sample diagram powerpoint slide show. This is a seven stage process. The stages in this process are management role, operations role, finance role, marketing role, human resources role, sales role, technology role.
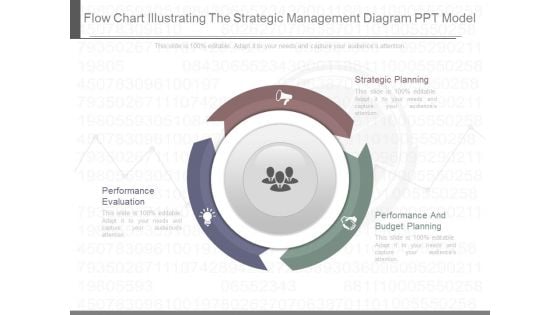
Flow Chart Illustrating The Strategic Management Diagram Ppt Model
This is a flow chart illustrating the strategic management diagram ppt model. This is a three stage process. The stages in this process are strategic planning, performance and budget planning, performance evaluation.
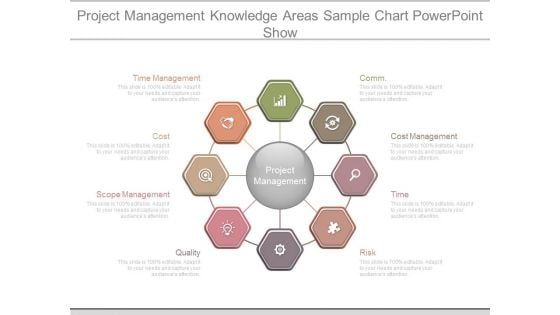
Project Management Knowledge Areas Sample Chart Powerpoint Show
This is a project management knowledge areas sample chart powerpoint show. This is a eight stage process. The stages in this process are comm, cost management, time, risk, quality, scope management, cost, time management, project management.
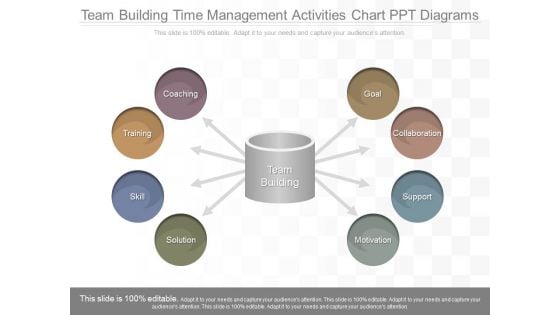
Team Building Time Management Activities Chart Ppt Diagrams
This is a team building time management activities chart ppt diagrams. This is a eight stage process. The stages in this process are goal, collaboration, support, motivation, solution, skill, training, coaching.
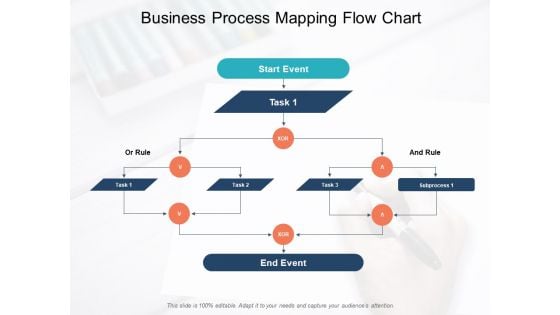
Business Process Mapping Flow Chart Ppt PowerPoint Presentation Professional Templates
This is a business process mapping flow chart ppt powerpoint presentation professional templates. This is a three stage process. The stages in this process are process management, end to end process, e2e process.
Management Organizational Chart Ppt PowerPoint Presentation Portfolio Icon
This is a management organizational chart ppt powerpoint presentation portfolio icon. This is a three stage process. The stages in this process are tony williams, bill durbin, david johnson, robert fowler, kate jeter.
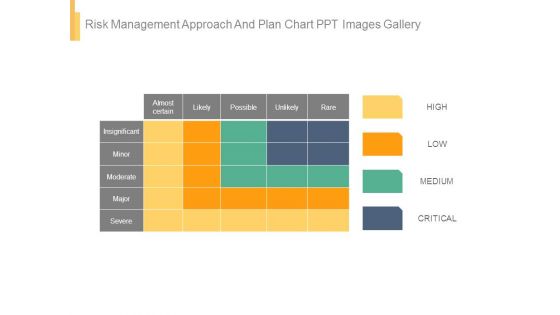
Risk Management Approach And Plan Chart Ppt Images Gallery
This is a risk management approach and plan chart ppt images gallery. This is a four stage process. The stages in this process are almost certain, likely, possible, unlikely, rare, insignificant, minor, moderate, major, severe, high, low, medium, critical.
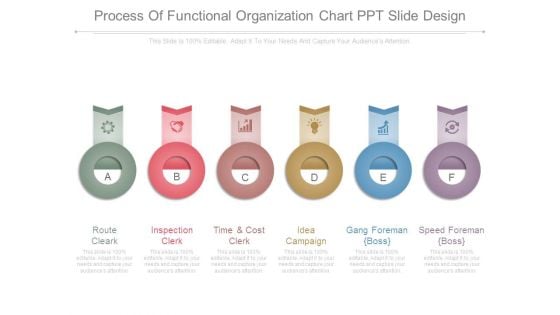
Process Of Functional Organization Chart Ppt Slide Design
This is a process of functional organization chart ppt slide design. This is a six stage process. The stages in this process are route cleark, inspection clerk, time and cost clerk, idea campaign, gang foreman boss, speed foreman boss.
Team Productivity Chart Vector Icon Ppt PowerPoint Presentation Portfolio Themes
Presenting this set of slides with name team productivity chart vector icon ppt powerpoint presentation portfolio themes. This is a three stage process. The stages in this process are team productivity chart vector icon. This is a completely editable PowerPoint presentation and is available for immediate download. Download now and impress your audience.
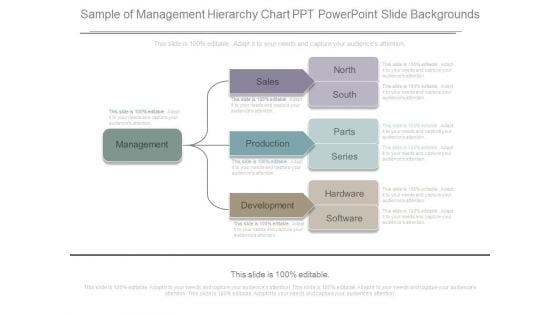
Sample Of Management Hierarchy Chart Ppt Powerpoint Slide Backgrounds
This is a sample of management hierarchy chart ppt powerpoint slide backgrounds. This is a one stage process. The stages in this process are management, sales, production, development, north, south, parts, series, hardware, software.
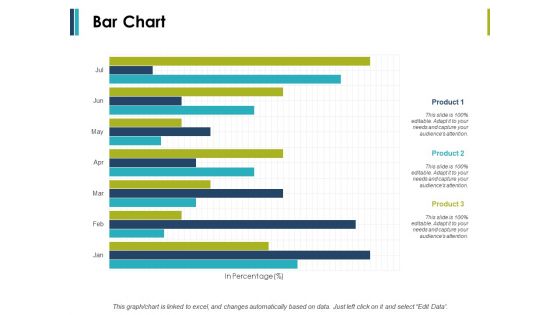
Bar Chart Business Management Ppt PowerPoint Presentation Ideas Example Introduction
This is a bar chart business management ppt powerpoint presentation ideas example introduction. This is a three stage process. The stages in this process are finance, marketing, management, investment, analysis.


 Continue with Email

 Home
Home


