Coordination
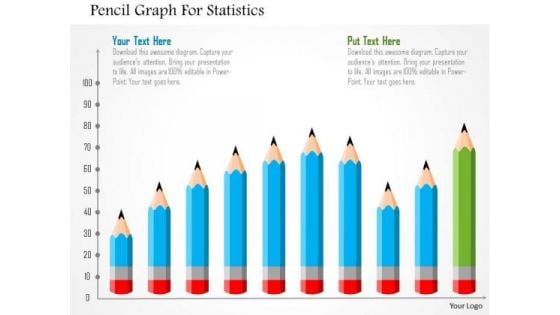
Business Diagram Pencil Graph For Statistics Presentation Template
The above template contains graphics of pencil graph. This diagram may be used to display statistical information. This diagram slide will
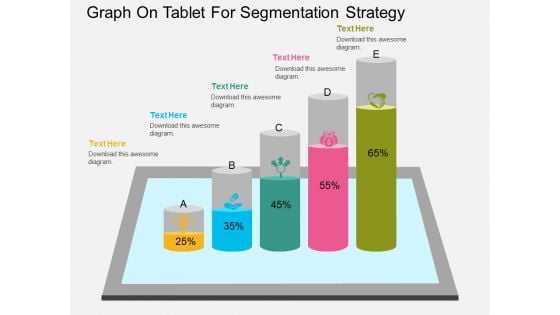
Graph On Tablet For Segmentation Strategy Powerpoint Template
Concept of segmentation strategy can be explained with this diagram. This PowerPoint template contains graph on computer tablet. Download this diagram slide to make interactive presentations.
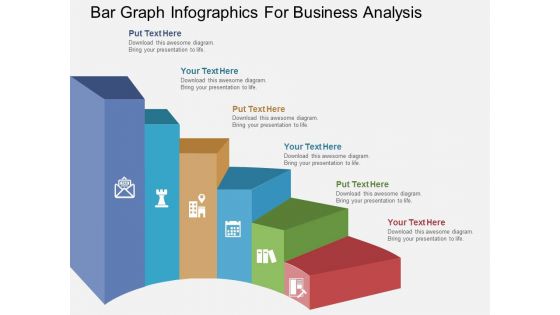
Bar Graph Infographics For Business Analysis Powerpoint Template
This PowerPoint template contains bar graph with icons. This PPT slide helps to exhibit concepts like strategy, direction and success. Use this business slide to make impressive presentations.
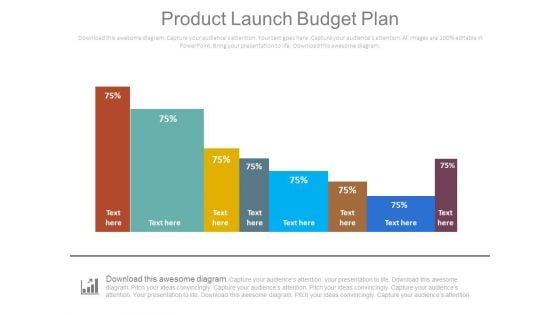
Product Launch Budget Plan Bar Graph Ppt Slides
This is a product launch budget plan bar graph ppt slides. This is a eight stage process. The stages in this process are business, finance, marketing.

Last 90 Days Results Bar Graph Ppt Slides
This is a last 90 days results bar graph ppt slides. This is a three stage process. The stages in this process are arrows, business, marketing.
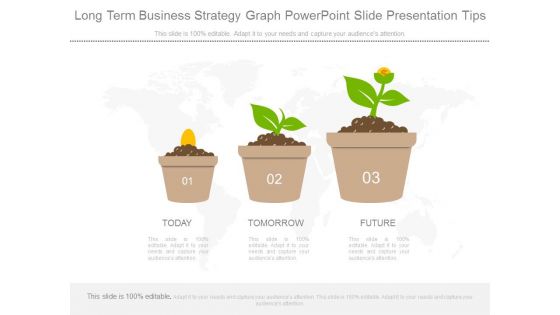
Long Term Business Strategy Graph Powerpoint Slide Presentation Tips
This is a long term business strategy graph powerpoint slide presentation tips. This is a three stage process. The stages in this process are today, tomorrow, future.

Curve Bar Graph For Process Capability Measurement Powerpoint Guide
This is a curve bar graph for process capability measurement powerpoint guide. This is a nine stage process. The stages in this process are target, lsl, usl, category.
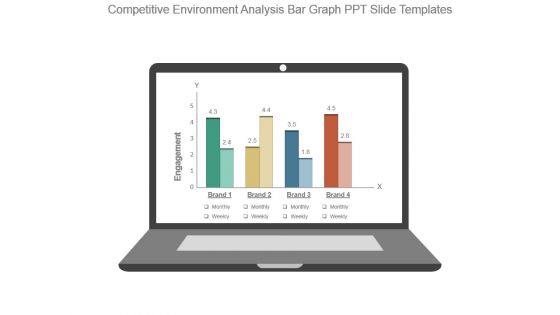
Competitive Environment Analysis Bar Graph Ppt Slide Templates
This is a competitive environment analysis bar graph ppt slide templates. This is a one stage process. The stages in this process are engagement, brand, monthly, weekly.
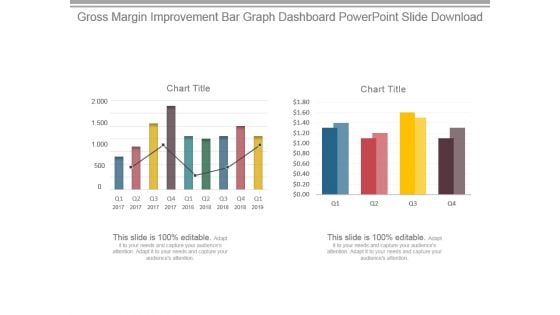
Gross Margin Improvement Bar Graph Dashboard Powerpoint Slide Download
This is a gross margin improvement bar graph dashboard powerpoint slide download. This is a two stage process. The stages in this process are chart title.
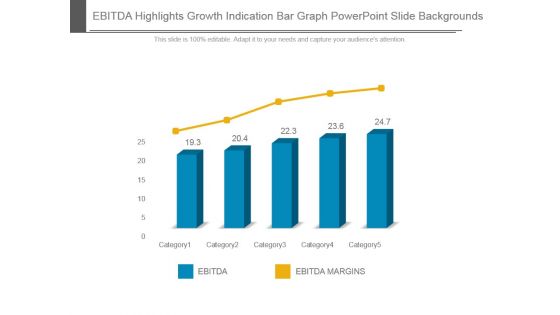
Ebitda Highlights Growth Indication Bar Graph Powerpoint Slide Backgrounds
This is a ebitda highlights growth indication bar graph powerpoint slide backgrounds. This is a five stage process. The stages in this process are ebitda, ebitda margins, category.
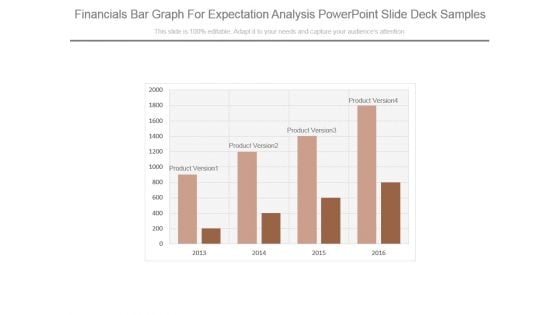
Financials Bar Graph For Expectation Analysis Powerpoint Slide Deck Samples
This is a financials bar graph for expectation analysis powerpoint slide deck samples. This is a four stage process. The stages in this process are product version.
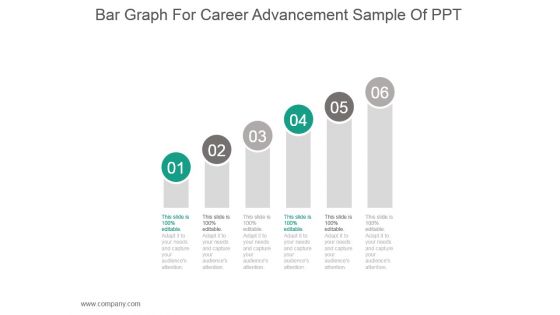
Bar Graph For Career Advancement Sample Of Ppt
This is a bar graph for career advancement sample of ppt. This is a six stage process. The stages in this process are business, strategy, management, growth, process.
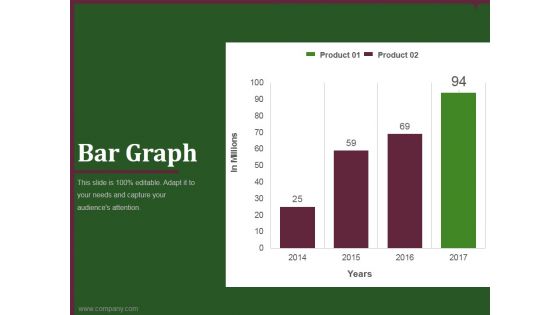
bar graph template 2 ppt powerpoint presentation gallery
This is a bar graph template 2 ppt powerpoint presentation gallery. This is a four stage process. The stages in this process are business, marketing, product, analysis, growth.
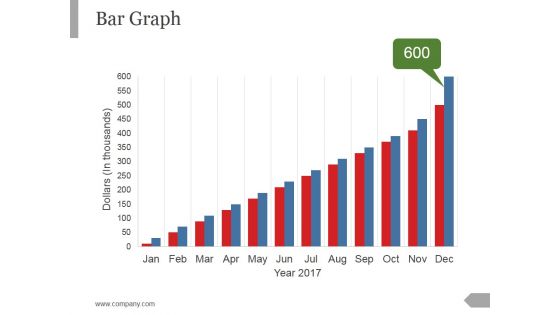
Bar Graph Ppt PowerPoint Presentation Infographic Template Visuals
This is a bar graph ppt powerpoint presentation infographic template visuals. This is a twelve stage process. The stages in this process are business, marketing, management, growth, planning.
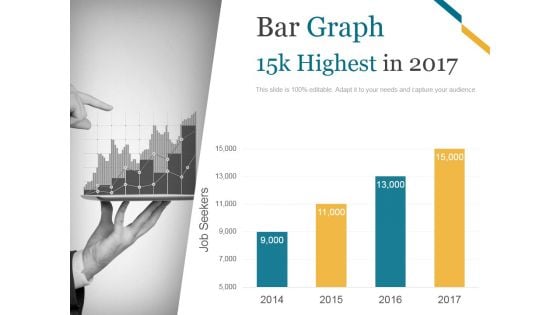
Bar Graph Ppt PowerPoint Presentation Outline Slide Download
This is a bar graph ppt powerpoint presentation outline slide download. This is a four stage process. The stages in this process are business, marketing, finance, timeline, growth.
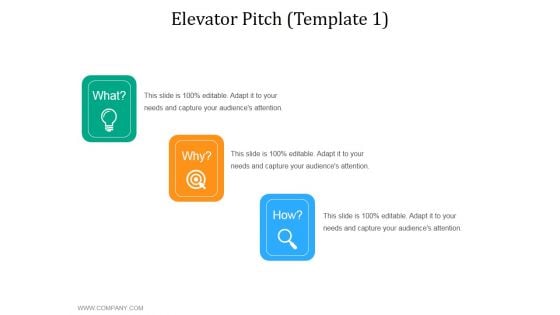
Elevator Pitch Template 1 Ppt PowerPoint Presentation Diagram Graph Charts
This is a elevator pitch template 1 ppt powerpoint presentation diagram graph charts. This is a three stage process. The stages in this process are what, why, how.

Bar Graph Ppt Powerpoint Presentation Inspiration Background Image
This is a bar graph ppt powerpoint presentation inspiration background image. This is a four stage process. The stages in this process are australia, china, brazil, united states.

Bar Graph Ppt PowerPoint Presentation Visual Aids Styles
This is a bar graph ppt powerpoint presentation visual aids styles. This is a five stage process. The stages in this process are finance, analysis, planning, business, process.
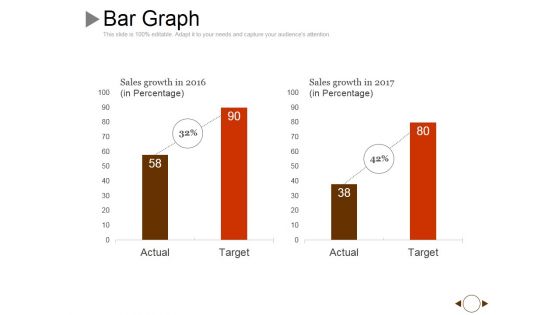
Bar Graph Ppt PowerPoint Presentation Pictures Graphic Images
This is a bar graph ppt powerpoint presentation pictures graphic images. This is a two stage process. The stages in this process are actual, target, growth, success.

Bar Graph Ppt PowerPoint Presentation Styles File Formats
This is a bar graph ppt powerpoint presentation styles file formats. This is a four stage process. The stages in this process are percentage, business, marketing, finance, strategy.
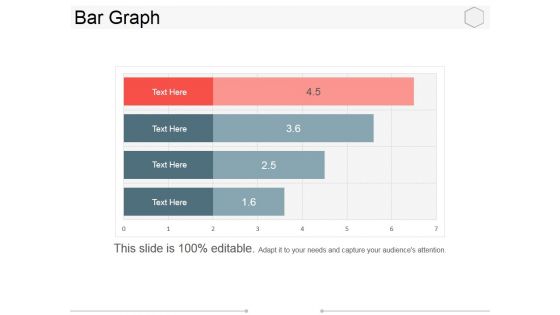
Bar Graph Ppt PowerPoint Presentation Portfolio Example Topics
This is a bar graph ppt powerpoint presentation portfolio example topics. This is a four stage process. The stages in this process are business, marketing, management, success, planning.
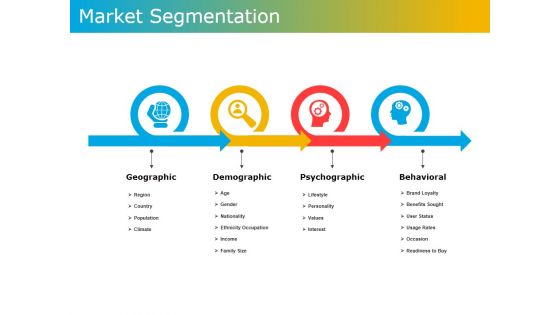
Market Segmentation Ppt PowerPoint Presentation Diagram Graph Charts
This is a market segmentation ppt powerpoint presentation diagram graph charts. This is a four stage process. The stages in this process are geographic, demographic, psychographic, behavioral.
Bar Graph Finance Ppt PowerPoint Presentation Icon Good
This is a bar graph finance ppt powerpoint presentation icon good. This is a two stage process. The stages in this process are analysis, finance, marketing, management, investment.
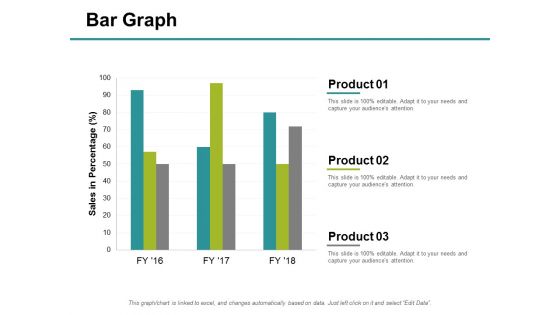
Bar Graph Finance Ppt PowerPoint Presentation Pictures Elements
This is a bar graph finance ppt powerpoint presentation pictures elements. This is a three stage process. The stages in this process are finance, marketing, management, investment, analysis.
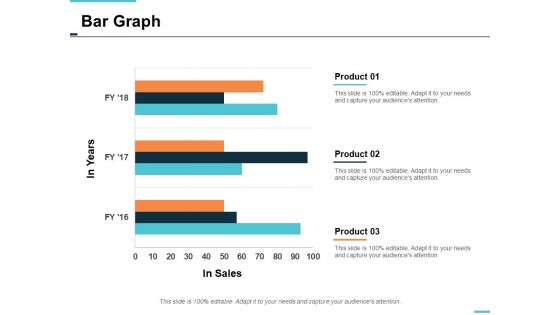
bar graph finance ppt powerpoint presentation portfolio summary
This is a bar graph finance ppt powerpoint presentation portfolio summary. This is a three stage process. The stages in this process are finance, marketing, management, investment, analysis.
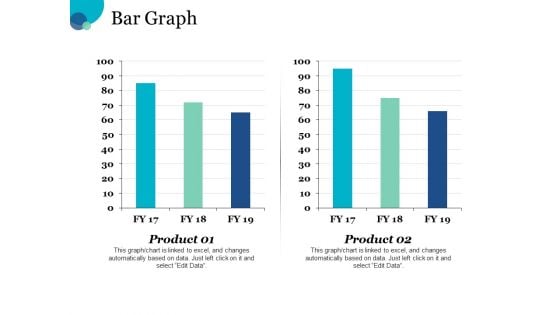
Bar Graph Chart Ppt PowerPoint Presentation Portfolio Templates
This is a bar graph chart ppt powerpoint presentation portfolio templates. This is a two stage process. The stages in this process are financial, minimum, medium, maximum.
Direct Sales Lead Ppt Powerpoint Presentation Diagram Graph Charts Cpb
This is a direct sales lead ppt powerpoint presentation diagram graph charts cpb. This is a two stage process. The stages in this process are direct sales lead.
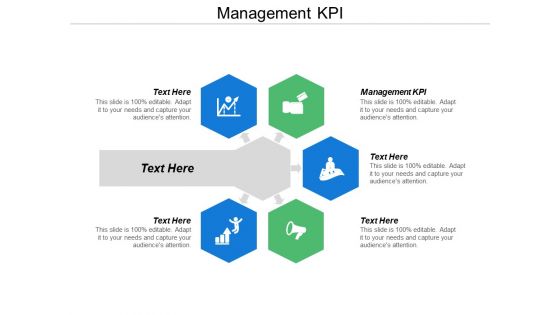
Management Kpi Ppt Powerpoint Presentation Diagram Graph Charts Cpb
This is a management kpi ppt powerpoint presentation diagram graph charts cpb. This is a five stage process. The stages in this process are management kpi.
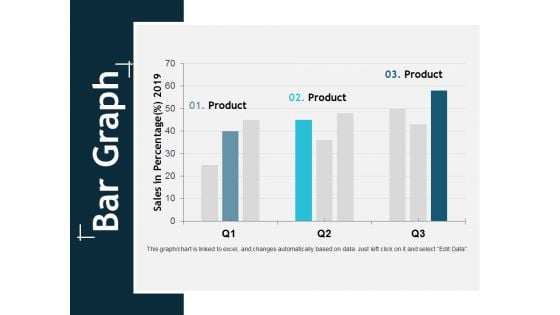
Bar Graph Finance Ppt Powerpoint Presentation Layouts Mockup
This is a bar graph finance ppt powerpoint presentation layouts mockup. This is a three stage process. The stages in this process are finance, marketing, management, investment, analysis.
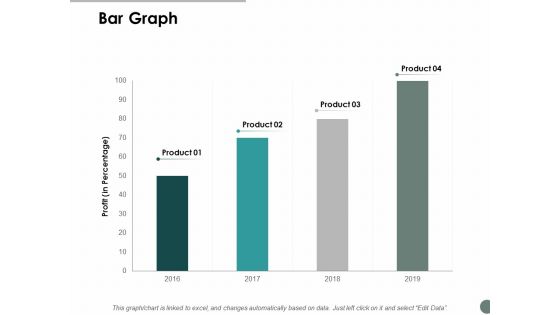
Bar Graph Finance Ppt Powerpoint Presentation File Ideas
This is a bar graph finance ppt powerpoint presentation file ideas. This is a four stage process. The stages in this process are finance, marketing, management, investment, analysis.
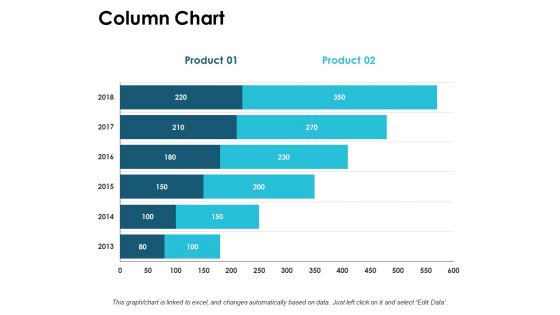
Column Chart Graph Ppt PowerPoint Presentation Outline Information
This is a column chart graph ppt powerpoint presentation outline information. This is a three stage process. The stages in this process are compare, marketing, business, management, planning.
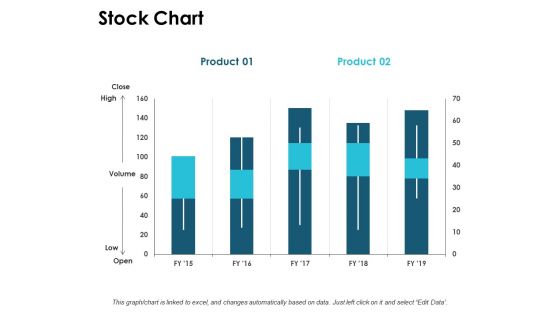
Stock Chart Graph Ppt PowerPoint Presentation Ideas Demonstration
This is a stock chart graph ppt powerpoint presentation ideas demonstration. This is a three stage process. The stages in this process are finance, marketing, management, investment, analysis.
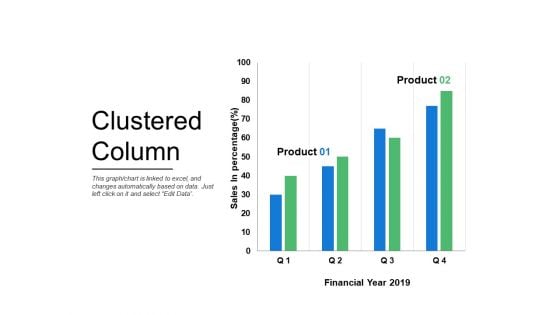
Clustered Column Graph Ppt PowerPoint Presentation Pictures Grid
This is a clustered column graph ppt powerpoint presentation pictures grid. This is a two stage process. The stages in this process are finance, marketing, management, investment, analysis.
Project Management Gantt Chart Graph Ppt PowerPoint Presentation Styles Icon
This is a project management gantt chart graph ppt powerpoint presentation styles icon. This is a four stage process. The stages in this process are four.
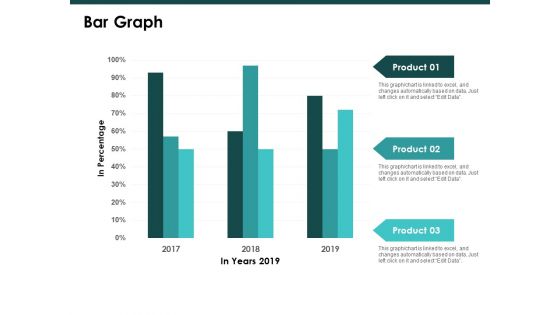
Bar Graph Finance Ppt PowerPoint Presentation Styles Slide
This is a bar graph finance ppt powerpoint presentation styles slide. This is a three stage process. The stages in this process are finance, marketing, management, investment, analysis.
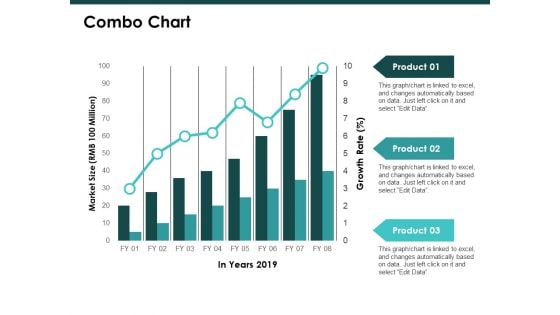
Combo Chart Graph Ppt PowerPoint Presentation Inspiration Template
This is a combo chart graph ppt powerpoint presentation inspiration template. This is a three stage process. The stages in this process are finance, marketing, management, investment, analysis.
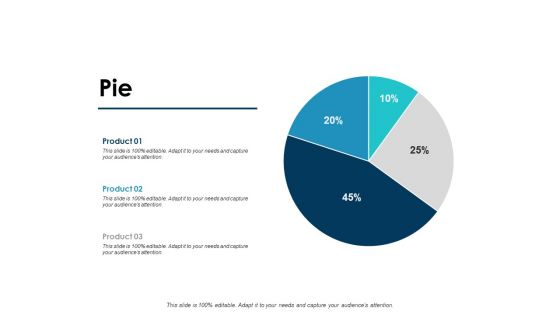
Pie Financial Graph Ppt PowerPoint Presentation Model Gridlines
This is a pie financial graph ppt powerpoint presentation model gridlines. This is a three stage process. The stages in this process are finance, marketing, management, investment, analysis.
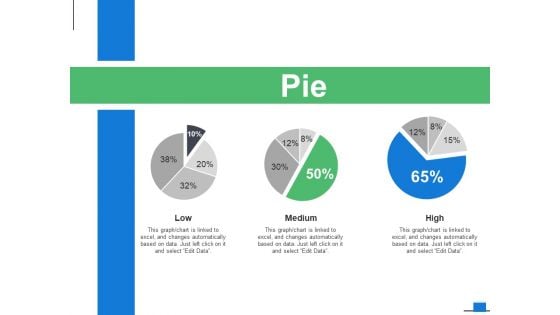
Pie Financial Graph Ppt PowerPoint Presentation Gallery Gridlines
This is a pie financial graph ppt powerpoint presentation gallery gridlines. This is a three stage process. The stages in this process are finance, marketing, management, investment, analysis.
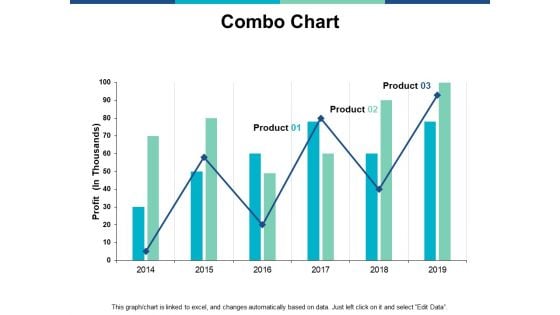
Combo Chart Graph Ppt PowerPoint Presentation Infographics Guide
This is a combo chart graph ppt powerpoint presentation infographics guide. This is a two stage process. The stages in this process are marketing, business, management, planning, strategy.
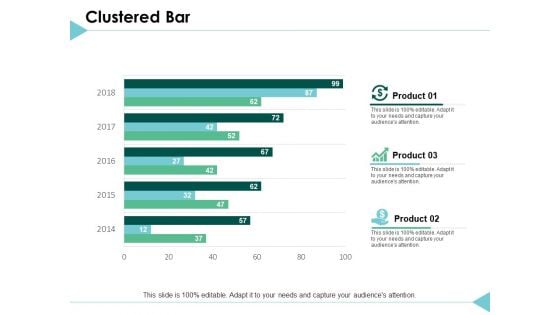
Clustered Bar Graph Ppt PowerPoint Presentation Outline Layouts
This is a clustered bar graph ppt powerpoint presentation outline layouts. This is a three stage process. The stages in this process are finance, marketing, analysis, investment, million.

Stacked Bar Graph Ppt PowerPoint Presentation Inspiration Images
This is a stacked bar graph ppt powerpoint presentation inspiration images. This is a three stage process. The stages in this process are finance, marketing, analysis, investment, million.
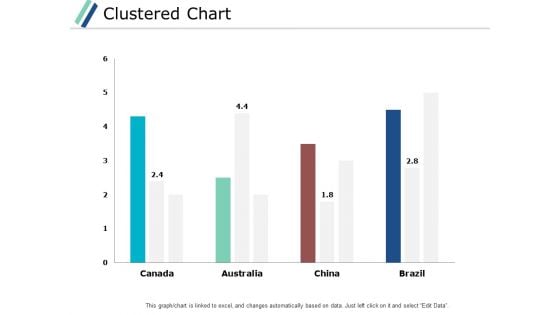
Clustered Chart Graph Ppt PowerPoint Presentation Gallery Backgrounds
This is a clustered chart graph ppt powerpoint presentation gallery backgrounds. This is a three stage process. The stages in this process are finance, marketing, analysis, investment, million.
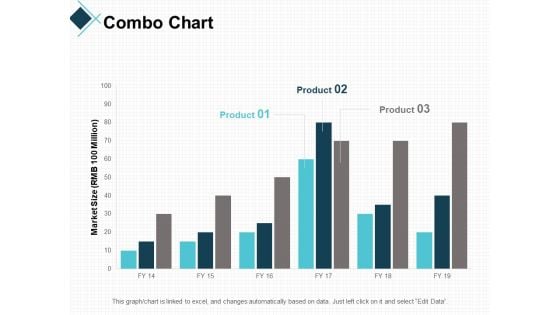
Combo Chart Graph Ppt PowerPoint Presentation Professional Guidelines
This is a combo chart graph ppt powerpoint presentation professional guidelines. This is a three stage process. The stages in this process are finance, marketing, analysis, investment, million.
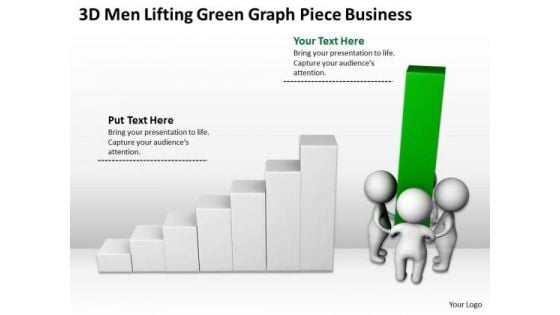
Men At Work Business As Usual PowerPoint Templates Free Download
We present our men at work business as usual powerpoint templates free download.Present our Business PowerPoint Templates because Our PowerPoint Templates and Slides are conceived by a dedicated team. Use them and give form to your wondrous ideas. Download and present our People PowerPoint Templates because Our PowerPoint Templates and Slides will let you Leave a lasting impression to your audiences. They possess an inherent longstanding recall factor. Download and present our Teamwork PowerPoint Templates because you can Set pulses racing with our PowerPoint Templates and Slides. They will raise the expectations of your team. Use our Success PowerPoint Templates because Our PowerPoint Templates and Slides are Clear and concise. Use them and dispel any doubts your team may have. Present our Shapes PowerPoint Templates because These PowerPoint Templates and Slides will give the updraft to your ideas. See them soar to great heights with ease.Use these PowerPoint slides for presentations relating to 3d, achievement, bar, business, businessman, cartoon, chart, concept, diagram, finance, graph, growth, holding, illustration, investment, moving, progress, puppets, green, rendering, report, standing, teamwork, up, wealth, white. The prominent colors used in the PowerPoint template are Green, White, Gray. Fight fires with our Men At Work Business As Usual PowerPoint Templates Free Download. Try us out and see what a difference our templates make.

Associated Data IT What Are Triples In Linked Data Template PDF
This slide represents the overview of triples in linked data and how it connects scattered data sets, indexes them for semantic search, and enriches them with text analysis to create large knowledge graphs. Triples are essential elements of linked data. Deliver an awe inspiring pitch with this creative Associated Data IT What Are Triples In Linked Data Template PDF bundle. Topics like Fundamental Elements, Environments, Dynamic can be discussed with this completely editable template. It is available for immediate download depending on the needs and requirements of the user.
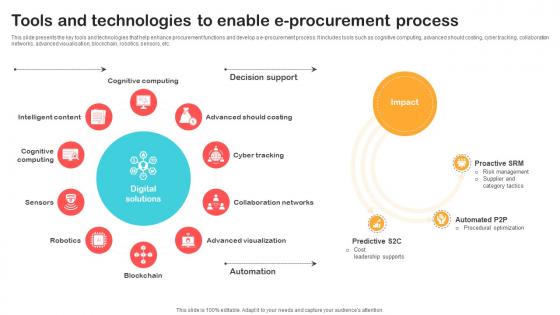
Tools And Technologies To Enable E Procurement Optimizing Retail Operations With Digital DT SS V
This slide presents the key tools and technologies that help enhance procurement functions and develop a e-procurement process. It includes tools such as cognitive computing, advanced should costing, cyber tracking, collaboration networks, advanced visualisation, blockchain, robotics, sensors, etc.Create an editable Tools And Technologies To Enable E Procurement Optimizing Retail Operations With Digital DT SS V that communicates your idea and engages your audience. Whether you are presenting a business or an educational presentation, pre-designed presentation templates help save time. Tools And Technologies To Enable E Procurement Optimizing Retail Operations With Digital DT SS V is highly customizable and very easy to edit, covering many different styles from creative to business presentations. Slidegeeks has creative team members who have crafted amazing templates. So, go and get them without any delay. This slide presents the key tools and technologies that help enhance procurement functions and develop a e-procurement process. It includes tools such as cognitive computing, advanced should costing, cyber tracking, collaboration networks, advanced visualisation, blockchain, robotics, sensors, etc.
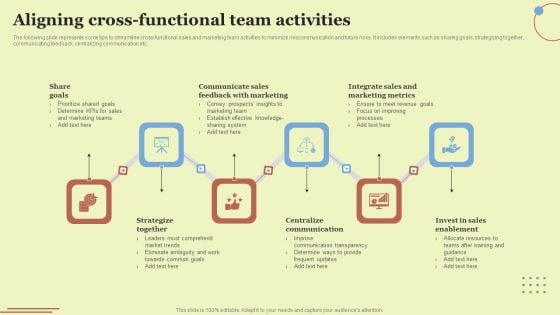
Aligning Cross Functional Team Activities Ideas PDF
The following slide represents some tips to streamline cross-functional sales and marketing team activities to minimize miscommunication and future risks. It includes elements such as sharing goals, strategizing together, communicating feedback, centralizing communication etc. If you are looking for a format to display your unique thoughts, then the professionally designed Aligning Cross Functional Team Activities Ideas PDF is the one for you. You can use it as a Google Slides template or a PowerPoint template. Incorporate impressive visuals, symbols, images, and other charts. Modify or reorganize the text boxes as you desire. Experiment with shade schemes and font pairings. Alter, share or cooperate with other people on your work. Download Aligning Cross Functional Team Activities Ideas PDF and find out how to give a successful presentation. Present a perfect display to your team and make your presentation unforgettable.
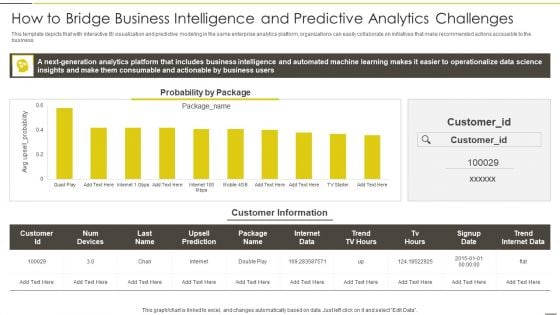
Administered Data And Analytic Quality Playbook How To Bridge Business Intelligence Sample PDF
This template depicts that with interactive BI visualization and predictive modeling in the same enterprise analytics platform, organizations can easily collaborate on initiatives that make recommended actions accessible to the business.Deliver an awe inspiring pitch with this creative Administered Data And Analytic Quality Playbook How To Bridge Business Intelligence Sample PDF bundle. Topics like Generation Analytics, Consumable Actionable, Operationalize Science can be discussed with this completely editable template. It is available for immediate download depending on the needs and requirements of the user.
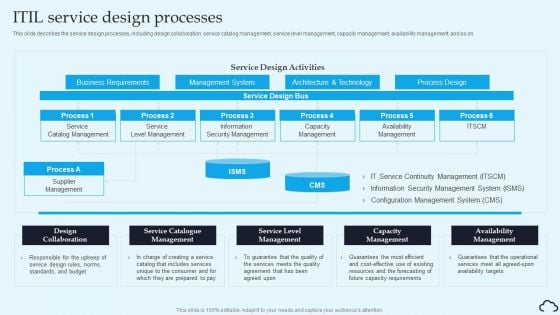
ITIL Service Design Processes IT Service Management Framework Demonstration PDF
This slide describes the service design processes, including design collaboration, service catalog management, service level management, capacity management, availability management, and so on.From laying roadmaps to briefing everything in detail, our templates are perfect for you. You can set the stage with your presentation slides. All you have to do is download these easy-to-edit and customizable templates. ITIL Service Design Processes IT Service Management Framework Demonstration PDF will help you deliver an outstanding performance that everyone would remember and praise you for. Do download this presentation today.

Six Advantages Of Cloud Computing With Capacity And Scalability Ppt PowerPoint Presentation Gallery Example Introduction PDF
Presenting this set of slides with name six advantages of cloud computing with capacity and scalability ppt powerpoint presentation gallery example introduction pdf. This is a six stage process. The stages in this process are reduce infrastructure costs, capacity and scalability, refresh aging infrastructure, support new business opportunities, business continuity, increased collaboration. This is a completely editable PowerPoint presentation and is available for immediate download. Download now and impress your audience.

Graph In 2011 Business PowerPoint Backgrounds And Templates 1210
Microsoft PowerPoint Template and Background with An orange arrow moving upwards over the 3D rendering of the year 2011 business graph on a white reflective background Our Graph In 2011 Business PowerPoint Backgrounds And Templates 1210 are designed to excite. Your thoughts will cause much delight.
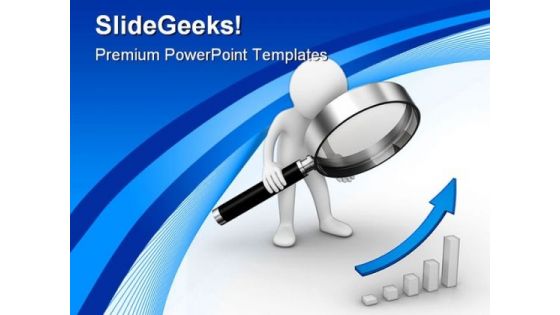
Graph Analysis Arrow Business PowerPoint Templates And PowerPoint Backgrounds 0211
Microsoft PowerPoint Template and Background with a man analyzing a graph showing growth Our content has been profitable for millions. Join the party with our Graph Analysis Arrow Business PowerPoint Templates And PowerPoint Backgrounds 0211. You'll always stay ahead of the game.
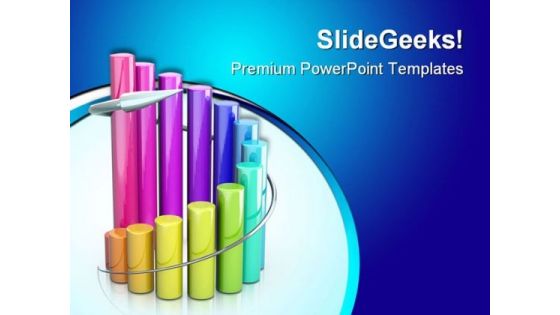
Colorful Sales Graph Business PowerPoint Templates And PowerPoint Backgrounds 0511
Microsoft PowerPoint Template and Background with business 3D graph with arrow showing profits and gains Dont re-invent the wheel. Save time with our Colorful Sales Graph Business PowerPoint Templates And PowerPoint Backgrounds 0511. Make sure your presentation gets the attention it deserves.
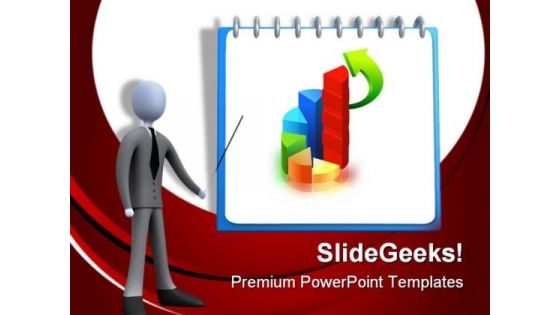
Business Graph01 Success PowerPoint Templates And PowerPoint Backgrounds 0511
Microsoft PowerPoint Template and Background with human showing a presentation of business graph Make everyday special with our Business Graph01 Success PowerPoint Templates And PowerPoint Backgrounds 0511. Ring in the changes with our Business Graph01 Success PowerPoint Templates And PowerPoint Backgrounds 0511.
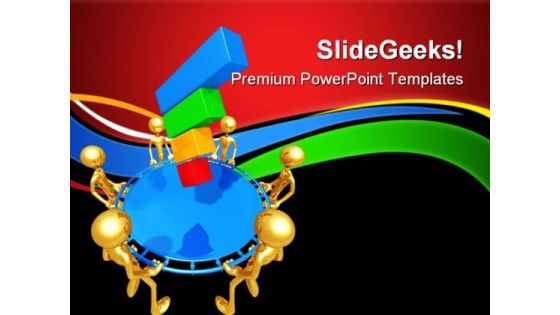
Bar Graph Business PowerPoint Themes And PowerPoint Slides 0811
Microsoft PowerPoint Theme and Slide with safety net catching a bar graph Get a firm handle on your discussion with our Bar Graph Business PowerPoint Themes And PowerPoint Slides 0811. Try us out and see what a difference our templates make.
Graph With Arrow Business PowerPoint Templates And PowerPoint Themes 0212
Microsoft Powerpoint Templates and Background with bar graph with rising arrow Give the gift of career growth with our Graph With Arrow Business PowerPoint Templates And PowerPoint Themes 0212. Dont waste time struggling with PowerPoint. Let us do it for you.

Bar Graph Finance PowerPoint Templates And PowerPoint Themes 0512
Microsoft Powerpoint Templates and Background with bar chart growth-Bar Graph Finance PowerPoint Templates And PowerPoint Themes 0512-These PowerPoint designs and slide layouts can be used for themes relating to -Bar chart growth, abstract, business, finance, success, marketing Our Bar Graph Finance PowerPoint Templates And PowerPoint Themes 0512 exemplify character. They always deliver on promises.

Bar Graph Global PowerPoint Templates And PowerPoint Themes 0512
Microsoft Powerpoint Templates and Background with success-Bar Graph Global PowerPoint Templates And PowerPoint Themes 0512-These PowerPoint designs and slide layouts can be used for themes relating to -Success, business, shapes, marketing, sales, finance, globe Suggest ideas with our Bar Graph Global PowerPoint Templates And PowerPoint Themes 0512. Download without worries with our money back guaranteee.

Bar Graph Winner Success PowerPoint Templates And PowerPoint Themes 0512
Microsoft Powerpoint Templates and Background with winner-Bar Graph Winner Success PowerPoint Templates And PowerPoint Themes 0512-These PowerPoint designs and slide layouts can be used for themes relating to -Winner, background, success, business, finance, shapes Adopt adventure with our Bar Graph Winner Success PowerPoint Templates And PowerPoint Themes 0512. Discover new avenues for your thoughts.

Colored Bar Graph Success PowerPoint Templates And PowerPoint Themes 0512
Microsoft Powerpoint Templates and Background with success-Colored Bar Graph Success PowerPoint Templates And PowerPoint Themes 0512-These PowerPoint designs and slide layouts can be used for themes relating to -Success, business, shapes, marketing, sales, finance Become a contributor with our Colored Bar Graph Success PowerPoint Templates And PowerPoint Themes 0512. You will come out on top.


 Continue with Email

 Home
Home


