Coordination
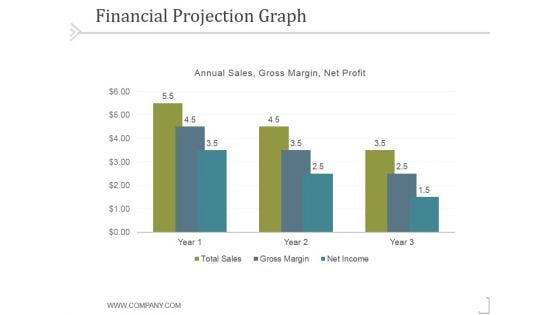
Financial Projection Graph Template 2 Ppt PowerPoint Presentation Template
This is a financial projection graph template 2 ppt powerpoint presentation template. This is a three stage process. The stages in this process are business, strategy, marketing, success, analysis.
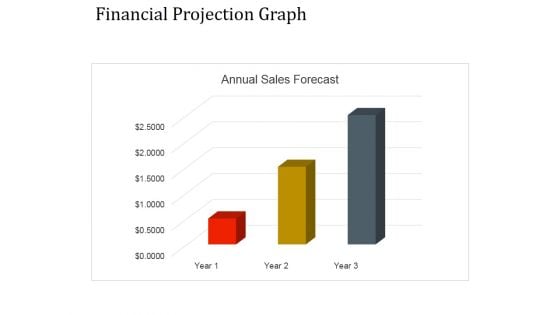
Financial Projection Graph Template 1 Ppt PowerPoint Presentation Graphics
This is a financial projection graph template 1 ppt powerpoint presentation graphics. This is a three stage process. The stages in this process are annual sales, business, management, marketing, strategy.
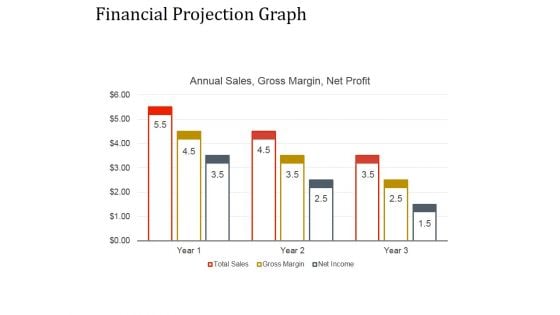
Financial Projection Graph Template 2 Ppt PowerPoint Presentation Ideas
This is a financial projection graph template 2 ppt powerpoint presentation ideas. This is a nine stage process. The stages in this process are annual sales, business, management, marketing, strategy.
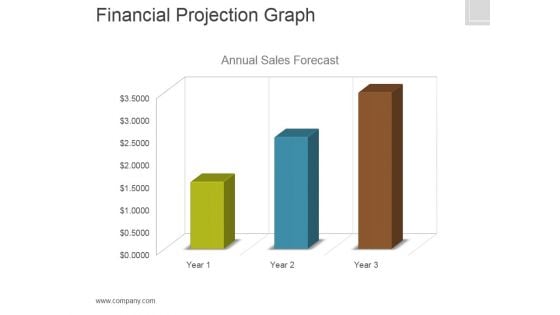
Financial Projection Graph Template 1 Ppt PowerPoint Presentation Clipart
This is a financial projection graph template 1 ppt powerpoint presentation clipart. This is a three stage process. The stages in this process are annual, sales, forecast, finance, marketing.
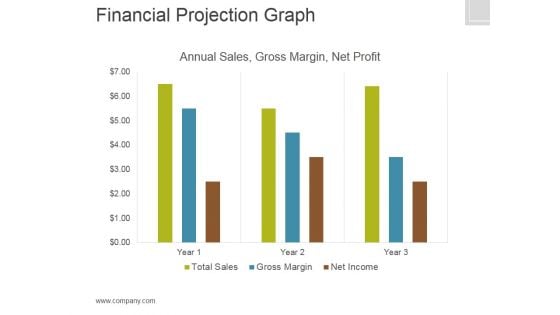
Financial Projection Graph Template 2 Ppt PowerPoint Presentation Graphics
This is a financial projection graph template 2 ppt powerpoint presentation graphics. This is a three stage process. The stages in this process are annual sales, gross margin, net profit, finance.
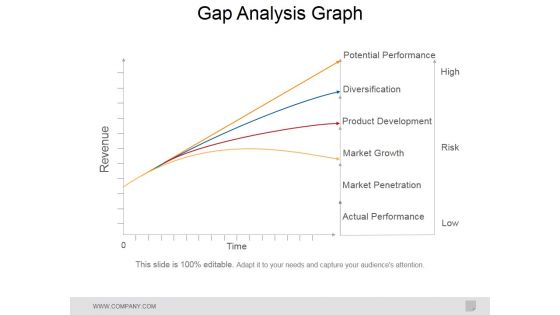
Gap Analysis Graph Ppt PowerPoint Presentation Portfolio Topics
This is a gap analysis graph ppt powerpoint presentation portfolio topics. This is a four stage process. The stages in this process are potential performance, diversification, product development, market growth, market penetration, actual performance.
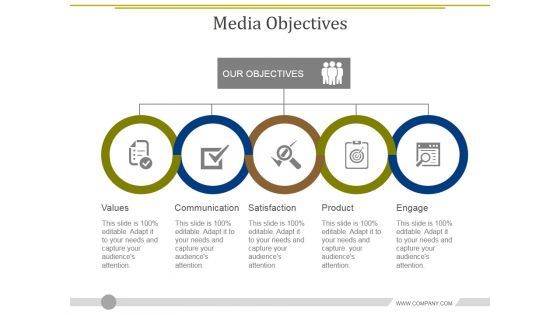
Media Objectives Template 2 Ppt PowerPoint Presentation Diagram Graph Charts
This is a media objectives template 2 ppt powerpoint presentation diagram graph charts. This is a five stage process. The stages in this process are values, communication, satisfaction, product, engage.
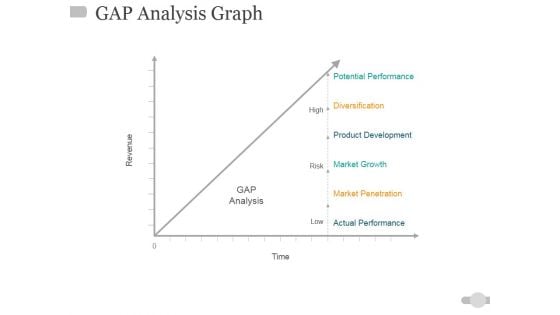
Gap Analysis Graph Ppt PowerPoint Presentation Inspiration Picture
This is a gap analysis graph ppt powerpoint presentation inspiration picture. This is a one stage process. The stages in this process are high, risk, low, time, gap analysis, revenue.
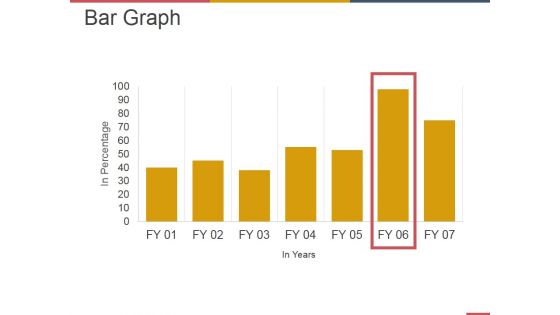
Bar Graph Ppt PowerPoint Presentation Summary Infographic Template
This is a bar graph ppt powerpoint presentation summary infographic template. This is a seven stage process. The stages in this process are business, strategy, marketing, analysis, growth strategy.
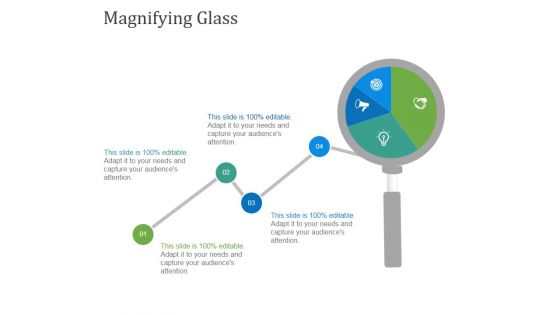
Magnifying Glass Ppt PowerPoint Presentation Diagram Graph Charts
This is a magnifying glass ppt powerpoint presentation diagram graph charts. This is a one stage process. The stages in this process are magnifying glass, planning, marketing, business, management, strategy.
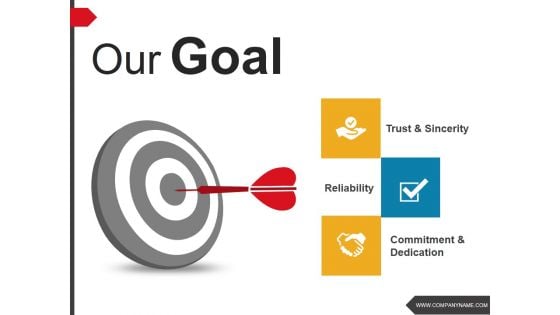
Our Goal Ppt PowerPoint Presentation Diagram Graph Charts
This is a our goal ppt powerpoint presentation diagram graph charts. This is a three stage process. The stages in this process are trust and sincerity, reliability, commitment and dedication.
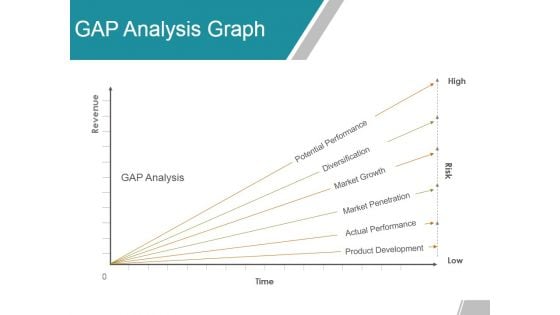
Gap Analysis Graph Ppt Powerpoint Presentation Gallery Sample
This is a gap analysis graph ppt powerpoint presentation gallery sample. This is a six stage process. The stages in this process are potential performance, diversification, market growth, market penetration.
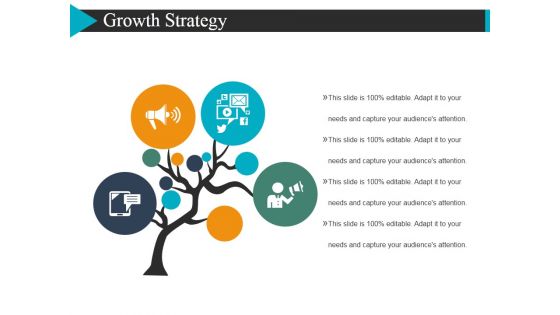
Growth Strategy Template 2 Ppt Powerpoint Presentation Diagram Graph Charts
This is a growth strategy template 2 ppt powerpoint presentation diagram graph charts. This is a four stage process. The stages in this process are tree, marketing, business, icons.
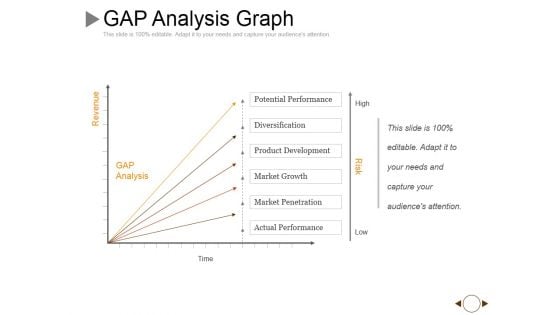
Gap Analysis Graph Ppt PowerPoint Presentation Slides Graphics Pictures
This is a gap analysis graph ppt powerpoint presentation slides graphics pictures. This is a five stage process. The stages in this process are revenue, time, high, low, risk.

Top Debtors And Creditors Ppt PowerPoint Presentation Diagram Graph Charts
This is a top debtors and creditors ppt powerpoint presentation diagram graph charts. This is a five stage process. The stages in this process are amount, creditors, debtors, icons, strategy.
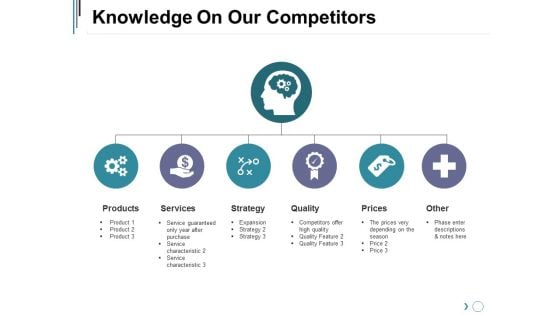
Knowledge On Our Competitors Ppt PowerPoint Presentation Diagram Graph Charts
This is a knowledge on our competitors ppt powerpoint presentation diagram graph charts. This is a six stage process. The stages in this process are services, strategy, quality, prices, other.
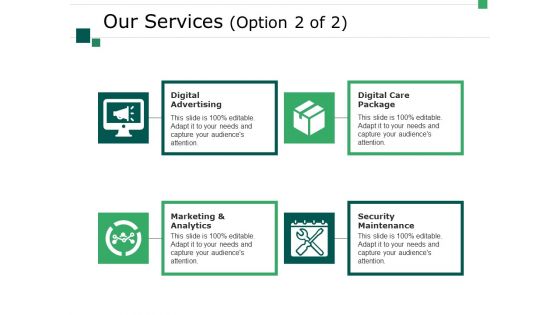
Our Services Template 2 Ppt PowerPoint Presentation Diagram Graph Charts
This is a our services template 2 ppt powerpoint presentation diagram graph charts. This is a four stage process. The stages in this process are business, digital advertising, digital care package, security maintenance, marketing and analytics, marketing, icons.
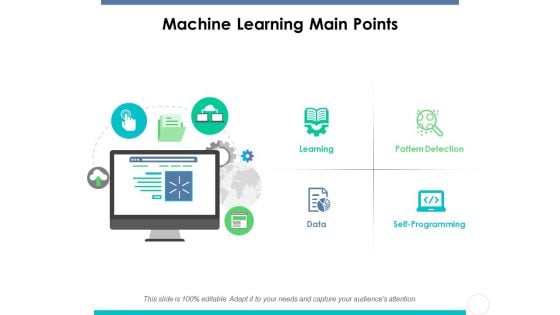
Machine Learning Main Points Ppt PowerPoint Presentation Diagram Graph Charts
This is a machine learning main points ppt powerpoint presentation diagram graph charts. This is a four stages process. The stages in this process are learning, pattern detection, programming, data, machine learning main points.
Clustered Column Graph Finance Investment Ppt PowerPoint Presentation Outline Icons
This is a clustered column graph finance investment ppt powerpoint presentation outline icons. This is a three stage process. The stages in this process are finance, investment, business, marketing, analysis.
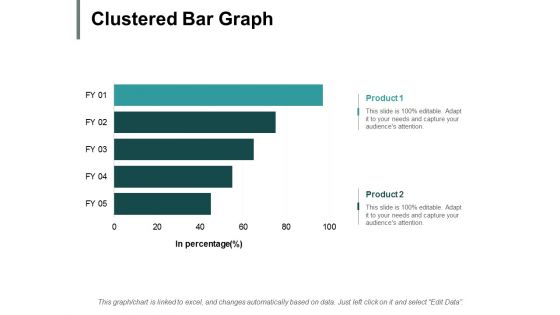
Clustered Bar Graph Ppt PowerPoint Presentation Pictures Example File
This is a clustered bar graph ppt powerpoint presentation pictures example file. This is a two stage process. The stages in this process are finance, marketing, management, investment, analysis.
Bar Graph Financial Sales Product Ppt PowerPoint Presentation Icon Vector
This is a bar graph financial sales product ppt powerpoint presentation icon vector. This is a five stage process. The stages in this process are business, management, financial, marketing, sales.
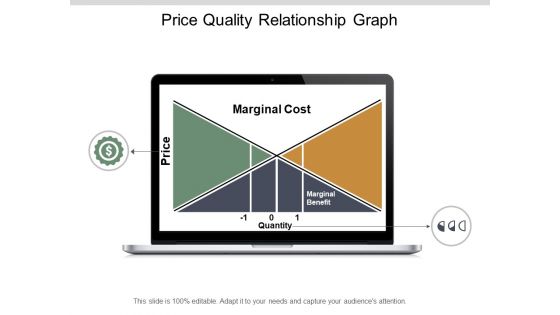
Price Quality Relationship Graph Ppt PowerPoint Presentation Show Design Templates
This is a price quality relationship graph ppt powerpoint presentation show design templates. This is a two stage process. The stages in this process are cost benefit analysis, cost benefit investigation, cost benefit examination.
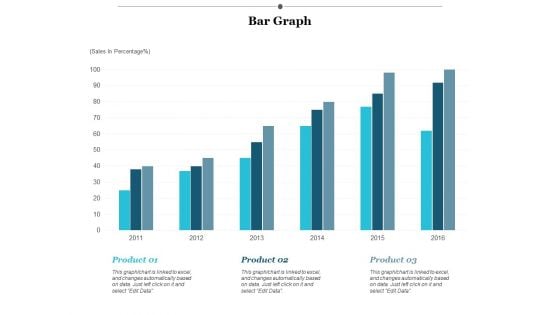
Bar Graph Finance Ppt PowerPoint Presentation Infographics Designs Download
This is a bar graph finance ppt powerpoint presentation infographics designs download. This is a three stage process. The stages in this process are finance, marketing, management, investment, analysis.

Successful Employee Referral Programs Ppt PowerPoint Presentation Diagram Graph Charts
This is a successful employee referral programs ppt powerpoint presentation diagram graph charts. This is a three stage process. The stages in this process are successful employee referral programs.
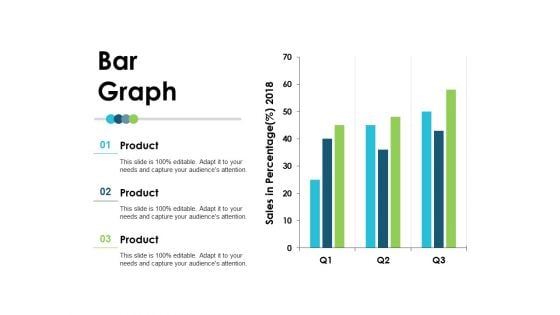
Bar Graph Employee Value Proposition Ppt PowerPoint Presentation File Layout
This is a bar graph employee value proposition ppt powerpoint presentation file layout. This is a three stage process. The stages in this process are business, management, strategy, analysis, marketing.
Growth Trend Arrow Graph Icon Ppt PowerPoint Presentation Summary Model
This is a growth trend arrow graph icon ppt powerpoint presentation summary model. This is a one stage process. The stages in this process are growth, upward trends, uptrends, upward arrow.
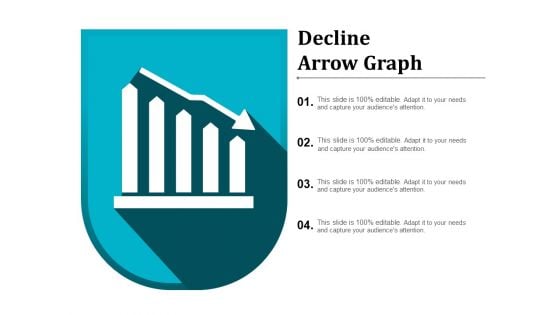
Decline Arrow Graph Ppt PowerPoint Presentation Pictures Portfolio
This is a decline arrow graph ppt powerpoint presentation pictures portfolio. This is a four stage process The stages in this process are downward step, downward phases, downward process.

Career Promotion Graph Growth Ppt PowerPoint Presentation Infographics Show
This is a career promotion graph growth ppt powerpoint presentation infographics show. This is a three stage process. The stages in this process are career progression, career aspiration, career promotion powerpoint presentation slides.
Graph With Growth Arrow Vector Ppt Powerpoint Presentation Gallery Show
This is a graph with growth arrow vector ppt powerpoint presentation gallery show. This is a three stage process. The stages in this process are accelerator, seed accelerators, startup accelerator.
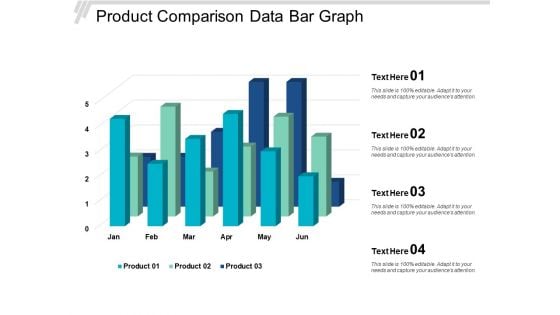
Product Comparison Data Bar Graph Ppt Powerpoint Presentation Slides Show
This is a product comparison data bar graph ppt powerpoint presentation slides show. This is a four stage process. The stages in this process are data presentation, content presentation, information presentation.
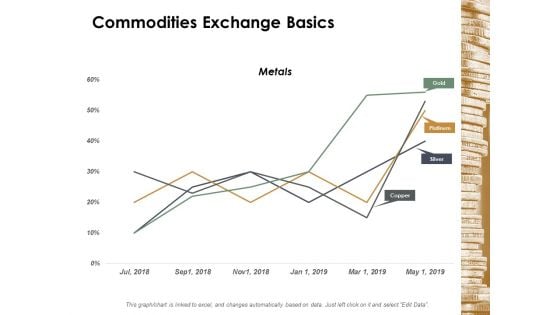
Commodities Exchange Basics Ppt Powerpoint Presentation Diagram Graph Charts
This is a commodities exchange basics ppt powerpoint presentation diagram graph charts. This is a four stage process. The stages in this process are finance, marketing, management, investment, analysis.
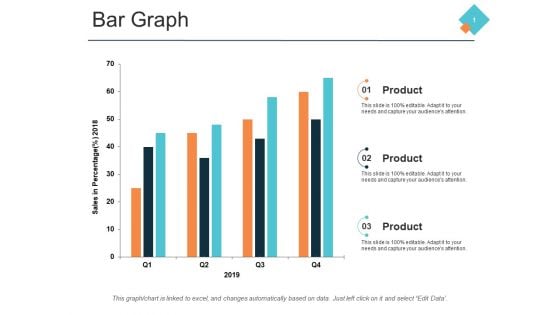
Bar Graph Marketing Process Ppt PowerPoint Presentation Ideas Example Introduction
This is a bar graph marketing process ppt powerpoint presentation ideas example introduction. This is a three stage process. The stages in this process are finance, management, strategy, analysis, marketing.
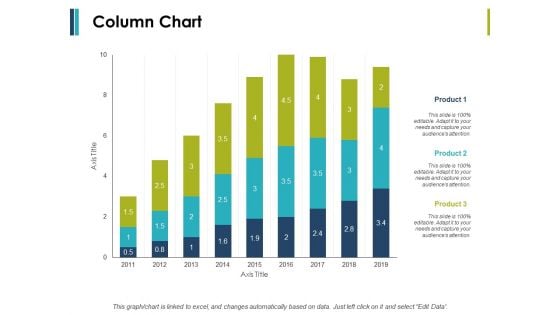
Column Chart And Graph Ppt PowerPoint Presentation File Introduction
This is a column chart and graph ppt powerpoint presentation file introduction. This is a three stage process. The stages in this process are finance, marketing, management, investment, analysis.
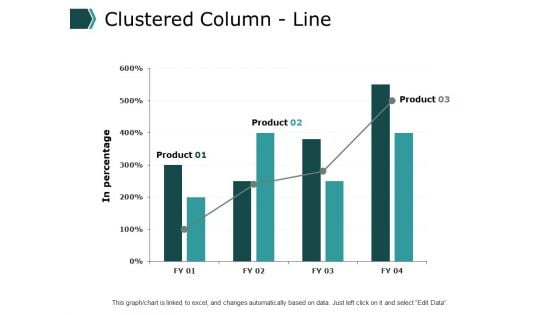
Clustered Column Line Graph Ppt PowerPoint Presentation Ideas Demonstration
This is a clustered column line graph ppt powerpoint presentation ideas demonstration. This is a three stage process. The stages in this process are financial, minimum, maximum, marketing, strategy.
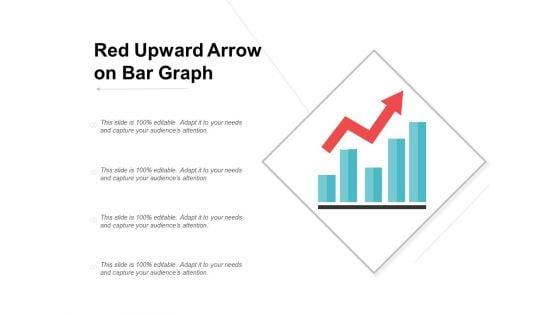
Red Upward Arrow On Bar Graph Ppt Powerpoint Presentation Infographics
This is a red upward arrow on bar graph ppt powerpoint presentation infographics. This is a four stage process. The stages in this process are increasing arrows, improving arrows, growing arrows.
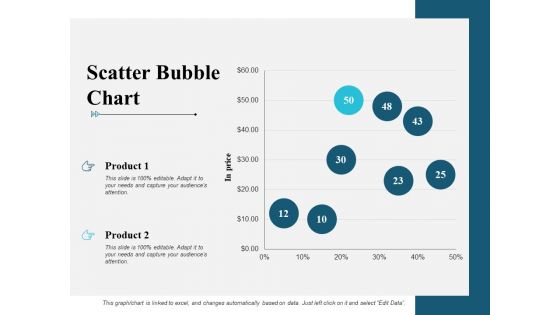
Scatter Bubble Chart Graph Ppt PowerPoint Presentation Infographic Template Maker
This is a scatter bubble chart graph ppt powerpoint presentation infographic template maker. This is a two stage process. The stages in this process are finance, marketing, management, investment, analysis.

Donut Pie Chart Graph Ppt PowerPoint Presentation File Styles
This is a donut pie chart graph ppt powerpoint presentation file styles. This is a three stage process. The stages in this process are finance, marketing, management, investment, analysis.
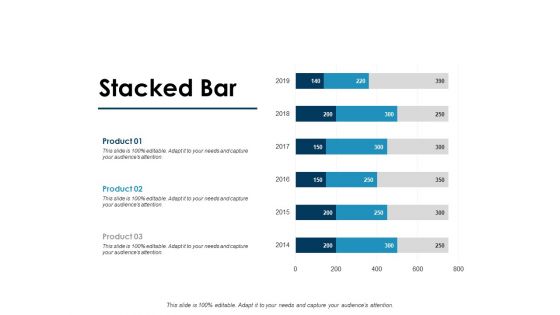
Stacked Bar Graph Ppt PowerPoint Presentation Portfolio Slide Portrait
This is a stacked bar graph ppt powerpoint presentation portfolio slide portrait. This is a three stage process. The stages in this process are finance, marketing, management, investment, analysis.
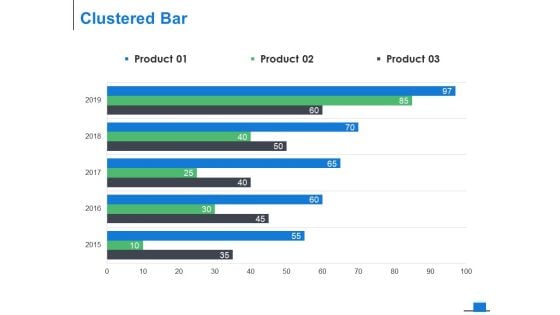
Clustered Bar Graph Ppt PowerPoint Presentation Model Background Designs
This is a clustered bar graph ppt powerpoint presentation model background designs. This is a three stage process. The stages in this process are finance, marketing, management, investment, analysis.
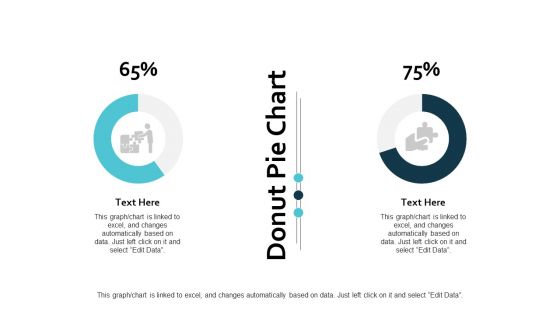
Donut Pie Chart Graph Ppt PowerPoint Presentation Ideas Guidelines
This is a donut pie chart graph ppt powerpoint presentation ideas guidelines. This is a three stage process. The stages in this process are finance, marketing, management, investment, analysis.
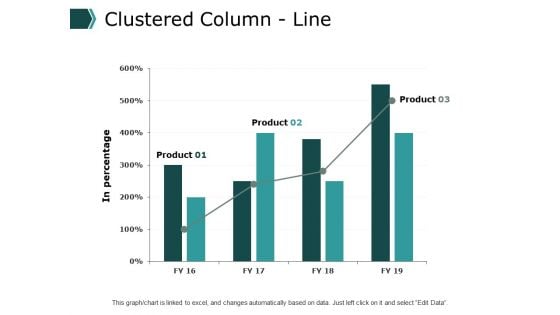
Clustered Column Line Graph Ppt PowerPoint Presentation File Clipart
This is a clustered column line graph ppt powerpoint presentation file clipart. This is a three stage process. The stages in this process are finance, marketing, management, investment, analysis.
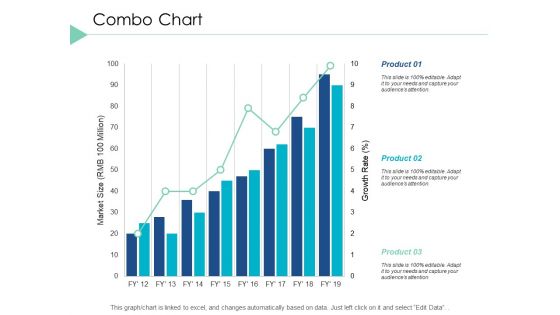
Combo Chart Graph Ppt PowerPoint Presentation Infographic Template Layout Ideas
This is a combo chart graph ppt powerpoint presentation infographic template layout ideas. This is a three stage process. The stages in this process are finance, marketing, analysis, investment, million.
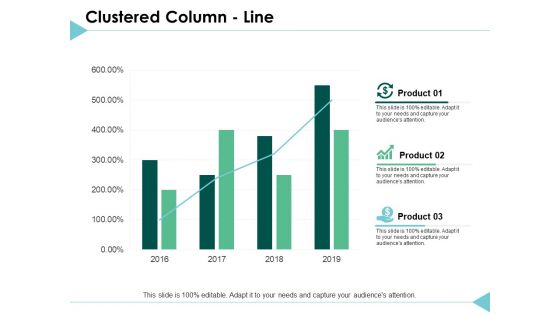
Clustered Column Line Graph Ppt PowerPoint Presentation Inspiration Deck
This is a clustered column line graph ppt powerpoint presentation inspiration deck. This is a three stage process. The stages in this process are finance, marketing, analysis, investment, million.
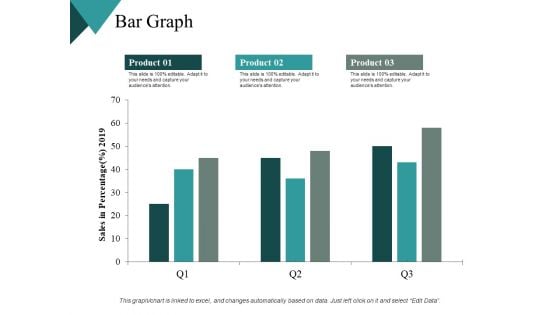
Bar Graph Finance Ppt PowerPoint Presentation Outline Background Designs
This is a bar graph finance ppt powerpoint presentation outline background designs. This is a three stage process. The stages in this process are financial, maximum, medium, minimum, marketing.
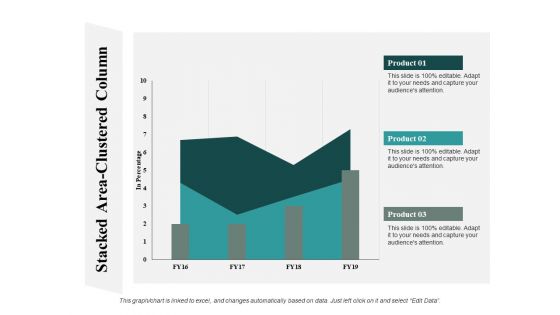
Stacked Area Clustered Column Graph Ppt PowerPoint Presentation Summary Guide
This is a stacked area clustered column graph ppt powerpoint presentation summary guide. This is a three stage process. The stages in this process are finance, marketing, analysis, investment, million.

Bar Graph With Red Progressive Arrow Ppt PowerPoint Presentation Outline
This is a bar graph with red progressive arrow ppt powerpoint presentation outline. This is a three stage process. The stages in this process are rising arrow, growing arrow, increasing arrow.
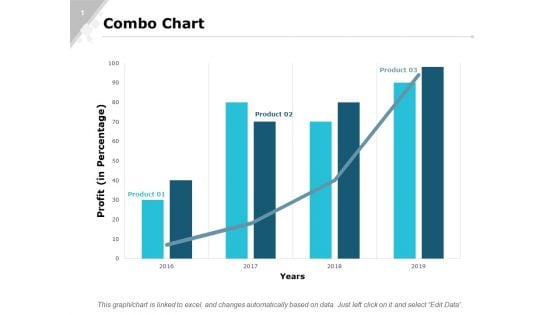
Combo Chart Graph Ppt PowerPoint Presentation Gallery Designs Download
This is a combo chart graph ppt powerpoint presentation gallery designs download. This is a three stage process. The stages in this process are finance, marketing, analysis, investment, million.
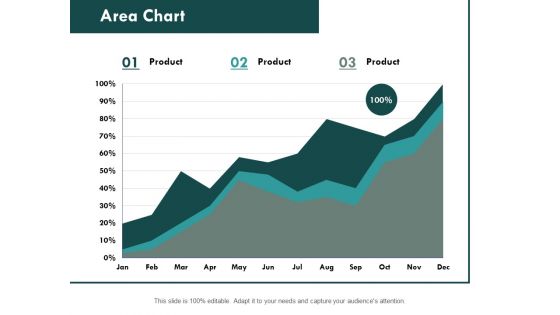
Area Chart Graph Ppt PowerPoint Presentation Professional Format Ideas
This is a column chart graph ppt powerpoint presentation slides file formats. This is a stage three process. The stages in this process are finance, marketing, analysis, investment, million.
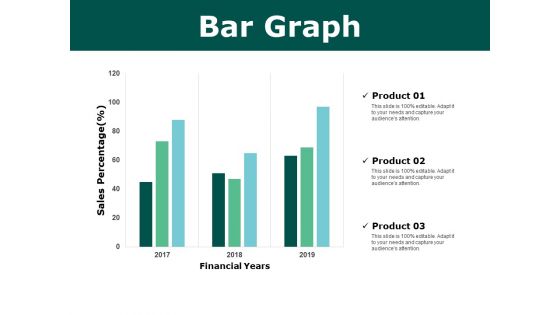
Bar Graph Finance Ppt PowerPoint Presentation Pictures Portrait
This is a bar graph finance ppt powerpoint presentation pictures portrait. The topics discussed in this diagram are marketing, business, management, planning, strategy This is a completely editable PowerPoint presentation, and is available for immediate download.
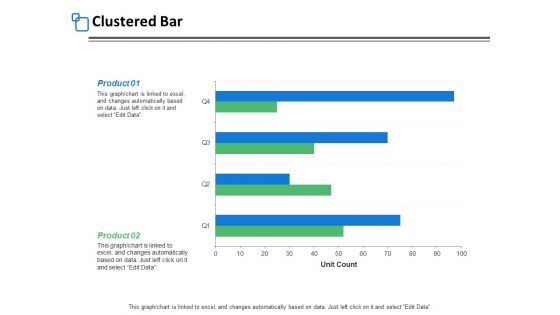
Clustered Bar Graph Ppt PowerPoint Presentation File Design Inspiration
This is a clustered bar graph ppt powerpoint presentation file design inspiration. The topics discussed in this diagram are marketing, business, management, planning, strategy This is a completely editable PowerPoint presentation, and is available for immediate download.
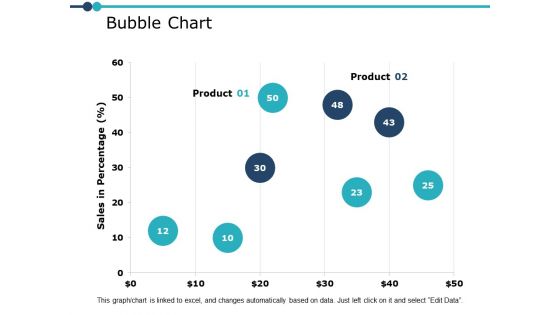
Bubble Chart Graph Ppt PowerPoint Presentation Ideas Outfit
This is a bubble chart graph ppt powerpoint presentation ideas outfit. The topics discussed in this diagram are marketing, business, management, planning, strategy This is a completely editable PowerPoint presentation, and is available for immediate download.
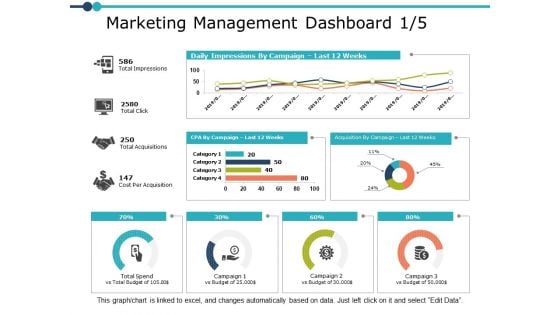
Marketing Management Dashboard Graph Ppt PowerPoint Presentation Infographic Template Portfolio
This is a marketing management dashboard graph ppt powerpoint presentation infographic template portfolio. The topics discussed in this diagram are marketing, business, management, planning, strategy This is a completely editable PowerPoint presentation, and is available for immediate download.
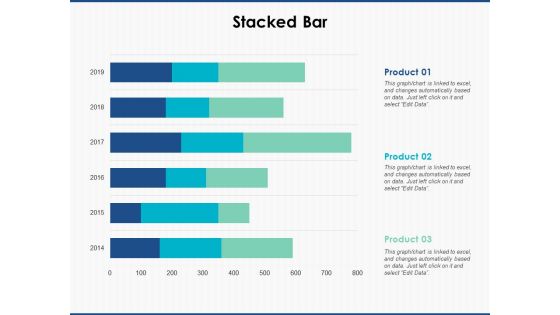
Stacked Bar Graph Ppt PowerPoint Presentation Layouts Inspiration
This is a stacked bar graph ppt powerpoint presentation layouts inspiration. The topics discussed in this diagram are marketing, business, management, planning, strategy This is a completely editable PowerPoint presentation, and is available for immediate download.
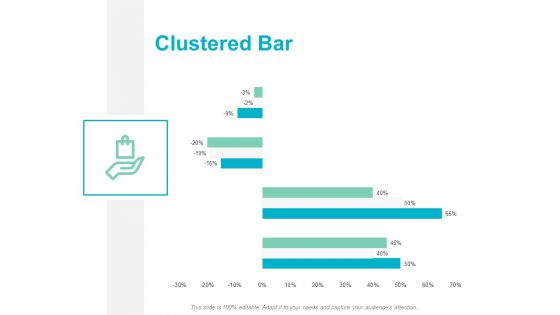
Clustered Bar Graph Ppt PowerPoint Presentation Outline Ideas
This is a clustered bar graph ppt powerpoint presentation outline ideas. The topics discussed in this diagram are marketing, business, management, planning, strategy This is a completely editable PowerPoint presentation, and is available for immediate download.
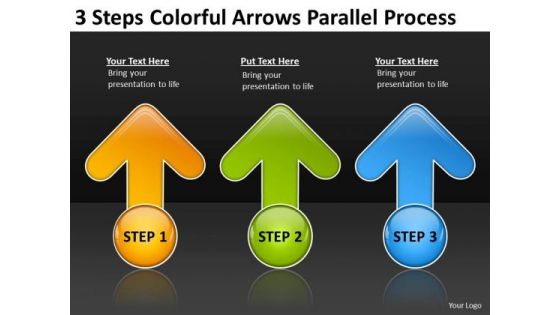
3 Steps Colorful Arrows Parallel Process Business Plan Example Free PowerPoint Slides
We present our 3 steps colorful arrows parallel process business plan example free PowerPoint Slides.Present our Arrows PowerPoint Templates because you can Add colour to your speech with our PowerPoint Templates and Slides. Your presentation will leave your audience speechless. Present our Signs PowerPoint Templates because You can Be the star of the show with our PowerPoint Templates and Slides. Rock the stage with your ideas. Download and present our Shapes PowerPoint Templates because Our PowerPoint Templates and Slides are aesthetically designed to attract attention. We gaurantee that they will grab all the eyeballs you need. Download our Circle Charts PowerPoint Templates because you should once Tap the ingenuity of our PowerPoint Templates and Slides. They are programmed to succeed. Download and present our Business PowerPoint Templates because Our PowerPoint Templates and Slides are focused like a searchlight beam. They highlight your ideas for your target audience.Use these PowerPoint slides for presentations relating to arrow, business, chart, collaborate, colorful, colors, commerce, concept, data, development, direction, economic, forward, graph, graphics, growing, growth, illustration, improvement, interaction, lead, leadership, line, manage, management, networking, object, organization, organize, performance, race, relation, relationship, resources, results, sales, same, staff, team, together. The prominent colors used in the PowerPoint template are Orange, Green, Blue. We assure you our 3 steps colorful arrows parallel process business plan example free PowerPoint Slides will get their audience's attention. People tell us our colors PowerPoint templates and PPT Slides are the best it can get when it comes to presenting. Customers tell us our 3 steps colorful arrows parallel process business plan example free PowerPoint Slides will help you be quick off the draw. Just enter your specific text and see your points hit home. Presenters tell us our commerce PowerPoint templates and PPT Slides are designed by professionals People tell us our 3 steps colorful arrows parallel process business plan example free PowerPoint Slides will make you look like a winner. We assure you our data PowerPoint templates and PPT Slides will make the presenter successul in his career/life. Our 3 Steps Colorful Arrows Parallel Process Business Plan Example Free PowerPoint Slides will go on till blue in the face. They will keep at it till you achieve your aim.

Business Profits Graph Success PowerPoint Templates And PowerPoint Themes 1012
The above template displays a diagram of a business profit graph. This image refers the concept of profits and gains. This image has been conceived to enable you to emphatically communicate your ideas in your Business PPT presentations showing success and growth in business. Create captivating presentations to deliver comparative and weighted arguments. Your audience will take a fancy to our Business Profits Graph Success PowerPoint Templates And PowerPoint Themes 1012. They will create the desire for more.
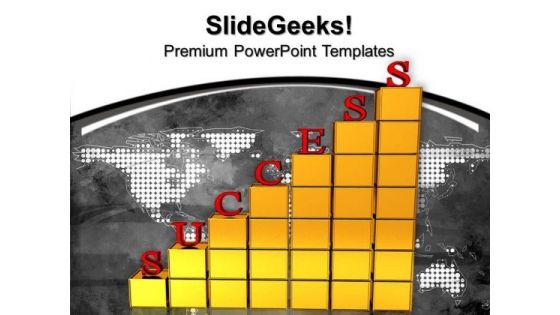
Success Graph Business PowerPoint Templates And PowerPoint Themes 1012
The above template displays a diagram of a bar graph showing success. This image represents the concept of growth in business. This image has been conceived to enable you to emphatically communicate your ideas in your Business PPT presentations. Create captivating presentations to deliver comparative and weighted arguments. Extend an invitation with our Success Graph Business PowerPoint Templates And PowerPoint Themes 1012. Allow the audience into your thoughts.
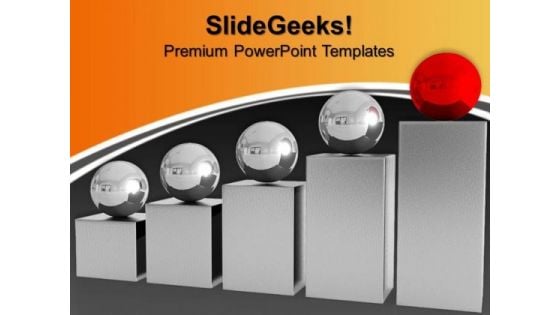
Success Graph Leadership PowerPoint Templates And PowerPoint Themes 1012
The above template displays a diagram of a bar graph. This image represents the concept of leadership. This image has been conceived to enable you to emphatically communicate your ideas in your Business PPT presentations. Create captivating presentations to deliver comparative and weighted arguments. Boil down the argument with our Success Graph Leadership PowerPoint Templates And PowerPoint Themes 1012. Analyse complexities to their barest detail.
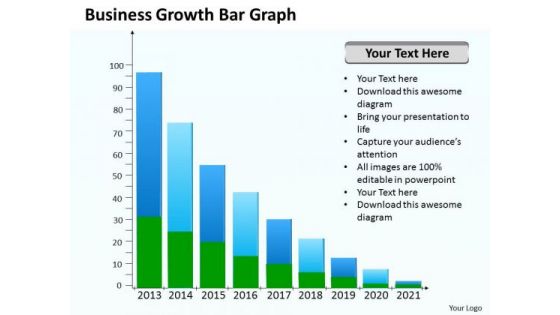
Business PowerPoint Template Growth Bar Graph Ppt Templates
Our Business powerpoint template growth bar graph ppt templates make good beasts of burden. Place all your demands on them. Deliver the right dose with our Arrows PowerPoint Templates. Your ideas will get the correct illumination. Your abilities have been lying dormant. Awaken them with our Marketing PowerPoint Templates. Promote your views with our Business PowerPoint Template Growth Bar Graph Ppt Templates. Download without worries with our money back guaranteee.

World Growth Graph PowerPoint Templates Ppt Backgrounds For Slides 0713
Be the drummer with our World Growth Graph PowerPoint Templates PPT Backgrounds For Slides. Let your thoughts create the beat. Drum out your message on our finance PowerPoint Templates. It will be heard by all far and wide. Up the ante with our globe PowerPoint Templates. Drum it up to a crescendo. You intend to deliver. Make it happen with our World Growth Graph PowerPoint Templates Ppt Backgrounds For Slides 0713. Make sure your presentation gets the attention it deserves.


 Continue with Email

 Home
Home


