Coordination
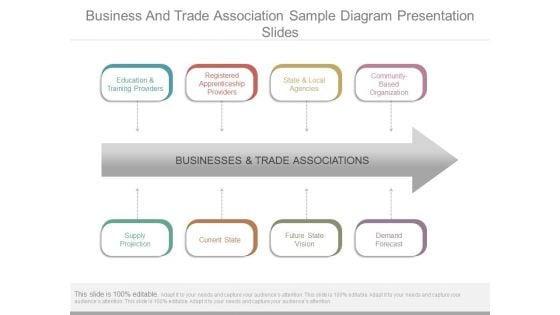
Business And Trade Association Sample Diagram Presentation Slides
This is a business and trade association sample diagram presentation slides. This is a eight stage process. The stages in this process are education and training providers, supply projection, registered apprenticeship providers, current state, state and local agencies, future state vision, community based organization, demand forecast, businesses and trade associations.

Greet Business Associates With Handshake Ppt PowerPoint Presentation Gallery Infographics
Presenting this set of slides with name greet business associates with handshake ppt powerpoint presentation gallery infographics. This is a three stage process. The stages in this process are greet business associates with handshake. This is a completely editable PowerPoint presentation and is available for immediate download. Download now and impress your audience.
Business Associate Vector Icon Ppt PowerPoint Presentation Inspiration Slides
Presenting this set of slides with name business associate vector icon ppt powerpoint presentation inspiration slides. The topics discussed in these slide is business associate vector icon. This is a completely editable PowerPoint presentation and is available for immediate download. Download now and impress your audience.
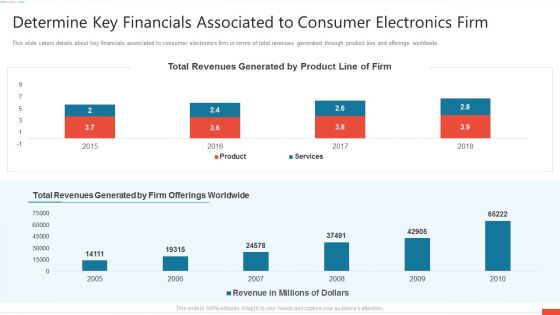
Determine Key Financials Associated To Consumer Electronics Firm Guidelines PDF
Deliver an awe-inspiring pitch with this creative determine key financials associated to consumer electronics firm guidelines pdf bundle. Topics like determine key financials associated to consumer electronics firm can be discussed with this completely editable template. It is available for immediate download depending on the needs and requirements of the user.

Enterprise Correspondence Us Details For Business Associates Mockup PDF
Presenting enterprise correspondence us details for business associates mockup pdf to dispense important information. This template comprises three stages. It also presents valuable insights into the topics including enterprise correspondence us details for business associates. This is a completely customizable PowerPoint theme that can be put to use immediately. So, download it and address the topic impactfully.
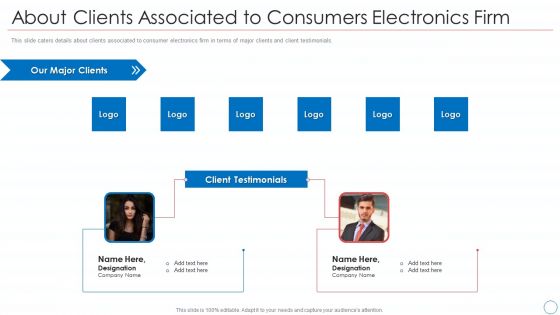
About Clients Associated To Consumers Electronics Firm Inspiration PDF
Deliver an awe-inspiring pitch with this creative about clients associated to consumers electronics firm inspiration pdf bundle. Topics like about clients associated to consumers electronics firm can be discussed with this completely editable template. It is available for immediate download depending on the needs and requirements of the user.
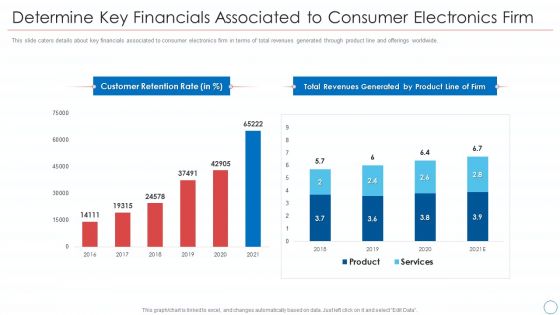
Determine Key Financials Associated To Consumer Electronics Firm Background PDF
Deliver an awe-inspiring pitch with this creative determine key financials associated to consumer electronics firm background pdf bundle. Topics like determine key financials associated to consumer electronics firm can be discussed with this completely editable template. It is available for immediate download depending on the needs and requirements of the user.
Certified Associate In Project Management Training Cost Icon Introduction PDF
Presenting Certified Associate In Project Management Training Cost Icon Introduction PDF to dispense important information. This template comprises four stages. It also presents valuable insights into the topics including Certified Associate In Project Management Training Cost Icon. This is a completely customizable PowerPoint theme that can be put to use immediately. So, download it and address the topic impactfully.
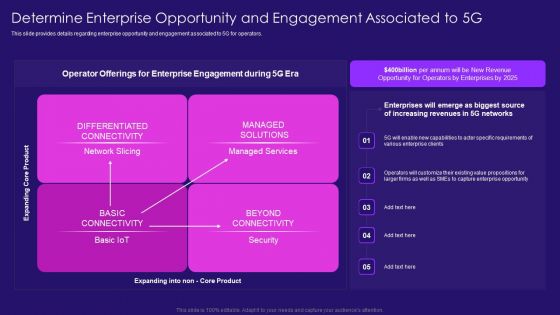
Determine Enterprise Opportunity And Engagement Associated To 5G Structure PDF
This slide provides details regarding enterprise opportunity and engagement associated to 5G for operators. Deliver an awe inspiring pitch with this creative Determine Enterprise Opportunity And Engagement Associated To 5G Structure PDF bundle. Topics like Operator Offerings, Enterprise Engagement, Opportunity Operators can be discussed with this completely editable template. It is available for immediate download depending on the needs and requirements of the user.
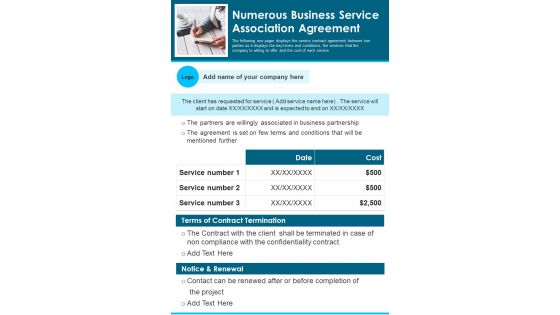
Numerous Business Service Association Agreement PDF Document PPT Template
Presenting you a fantastic Numerous Business Service Association Agreement PDF Document PPT Template. This one-pager document is crafted on hours of research and professional design efforts to ensure you have the best resource. It is completely editable and its design allow you to rehash its elements to suit your needs. Get this Numerous Business Service Association Agreement PDF Document PPT Template Download now.

One Pager Sales Associate Employee PDF Document PPT Template
Looking for a predesigned One Pager Sales Associate Employee PDF Document PPT Template Heres the perfect piece for you It has everything that a well-structured one-pager template should have. Besides, it is 100 percent editable, which offers you the cushion to make adjustments according to your preferences. Grab this One Pager Sales Associate Employee PDF Document PPT Template Download now.
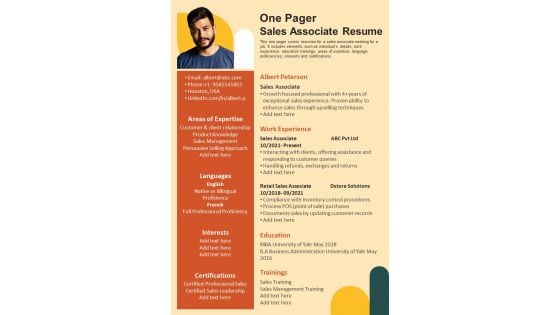
One Pager Sales Associate Resume PDF Document PPT Template
Here we present the One Pager Sales Associate Resume PDF Document PPT Template. This One-pager template includes everything you require. You can edit this document and make changes according to your needs it offers complete freedom of customization. Grab this One Pager Sales Associate Resume PDF Document PPT Template Download now.
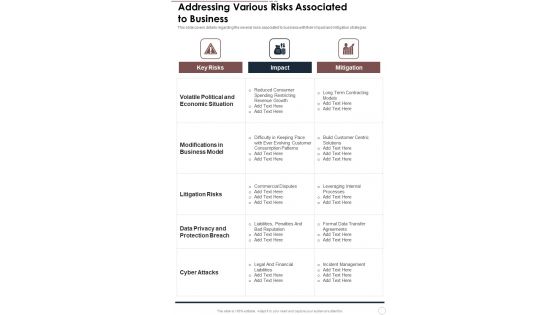
Addressing Various Risks Associated To Business One Pager Documents
Presenting you an exemplary Addressing Various Risks Associated To Business One Pager Documents. Our one-pager comprises all the must-have essentials of an inclusive document. You can edit it with ease, as its layout is completely editable. With such freedom, you can tweak its design and other elements to your requirements. Download this Addressing Various Risks Associated To Business One Pager Documents brilliant piece now.
Financial Associate Career Progression Framework Icon Icons PDF
Presenting Financial Associate Career Progression Framework Icon Icons PDF to dispense important information. This template comprises three stages. It also presents valuable insights into the topics including Financial Associate Career, Progression Framework Icon. This is a completely customizable PowerPoint theme that can be put to use immediately. So, download it and address the topic impactfully.
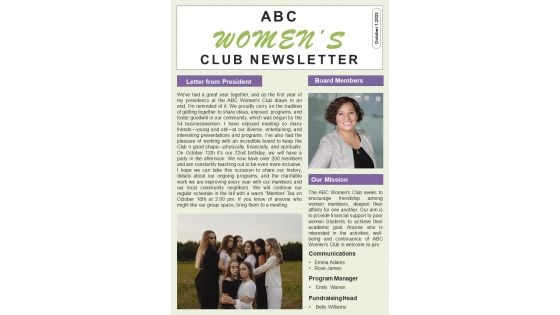
Bifold One Pager For Women Association Newsletter Template
Make a statement with One Pager For Women Association Newsletter Bifold PPT Template. Our visually-aesthetic template is designed to captivate your audience and effectively deliver your message. This template is 100 percentcustomizable, so you can tailor its content to suit your needs. With One Pager For Women Association Newsletter, you can create a professional and engaging presentation that leaves a lasting impression.
Icons Slide CASB 2 0 IT Ppt Diagram Graph Charts
Welcome to our selection of the Icons Slide CASB 2 0 IT Ppt Diagram Graph Charts. These are designed to help you showcase your creativity and bring your sphere to life. Planning and Innovation are essential for any business that is just starting out. This collection contains the designs that you need for your everyday presentations. All of our PowerPoints are 100Percent editable, so you can customize them to suit your needs. This multi-purpose template can be used in various situations. Grab these presentation templates today. Our Icons Slide CASB 2 0 IT Ppt Diagram Graph Charts are topically designed to provide an attractive backdrop to any subject. Use them to look like a presentation pro.
Continuous Glucose Monitoring Graph In Powerpoint And Google Slides Cpb
Presenting our innovatively designed set of slides titled Continuous Glucose Monitoring Graph In Powerpoint And Google Slides Cpb. This completely editable PowerPoint graphic exhibits Continuous Glucose Monitoring Graph that will help you convey the message impactfully. It can be accessed with Google Slides and is available in both standard screen and widescreen aspect ratios. Apart from this, you can download this well structured PowerPoint template design in different formats like PDF, JPG, and PNG. So, click the download button now to gain full access to this PPT design. Our Continuous Glucose Monitoring Graph In Powerpoint And Google Slides Cpb are topically designed to provide an attractive backdrop to any subject. Use them to look like a presentation pro.
Stock Exchange Graph In Powerpoint And Google Slides Cpb
Introducing our well designed Stock Exchange Graph In Powerpoint And Google Slides Cpb. This PowerPoint design presents information on topics like Stock Exchange Graph. As it is predesigned it helps boost your confidence level. It also makes you a better presenter because of its high quality content and graphics. This PPT layout can be downloaded and used in different formats like PDF, PNG, and JPG. Not only this, it is available in both Standard Screen and Widescreen aspect ratios for your convenience. Therefore, click on the download button now to persuade and impress your audience. Our Stock Exchange Graph In Powerpoint And Google Slides Cpb are topically designed to provide an attractive backdrop to any subject. Use them to look like a presentation pro.

Agenda For Zero Trust Network Access Ppt Diagram Graph Charts
Do you have to make sure that everyone on your team knows about any specific topic I yes, then you should give Agenda For Zero Trust Network Access Ppt Diagram Graph Charts a try. Our experts have put a lot of knowledge and effort into creating this impeccable Agenda For Zero Trust Network Access Ppt Diagram Graph Charts. You can use this template for your upcoming presentations, as the slides are perfect to represent even the tiniest detail. You can download these templates from the Slidegeeks website and these are easy to edit. So grab these today Our Agenda For Zero Trust Network Access Ppt Diagram Graph Charts are topically designed to provide an attractive backdrop to any subject. Use them to look like a presentation pro.
Crude Oil Graph In Powerpoint And Google Slides Cpb
Presenting our innovatively designed set of slides titled Crude Oil Graph In Powerpoint And Google Slides Cpb. This completely editable PowerPoint graphic exhibits Crude Oil Graph that will help you convey the message impactfully. It can be accessed with Google Slides and is available in both standard screen and widescreen aspect ratios. Apart from this, you can download this well structured PowerPoint template design in different formats like PDF, JPG, and PNG. So, click the download button now to gain full access to this PPT design. Our Crude Oil Graph In Powerpoint And Google Slides Cpb are topically designed to provide an attractive backdrop to any subject. Use them to look like a presentation pro.
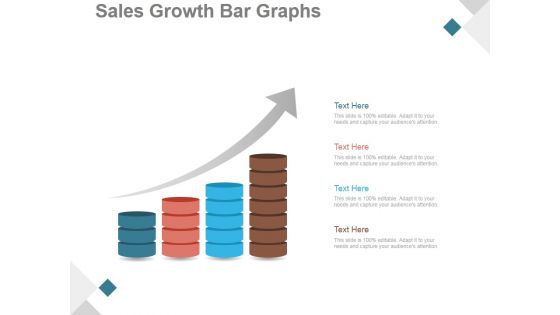
Sales Growth Bar Graphs Ppt PowerPoint Presentation Images
This is a sales growth bar graphs ppt powerpoint presentation images. This is a four stage process. The stages in this process are business, strategy, marketing, growth, bar graph, sales management.
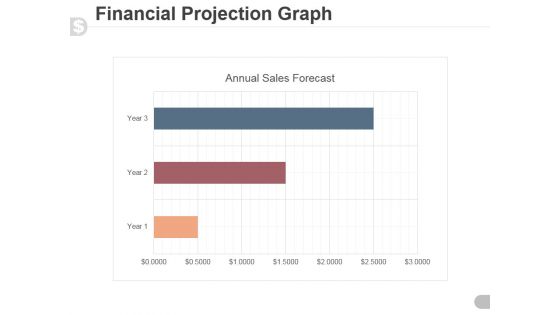
Financial Projection Graph Template 2 Ppt PowerPoint Presentation Samples
This is a financial projection graph template 2 ppt powerpoint presentation samples. This is a three stage process. The stages in this process are annual sales forecast, timeline, marketing, graph, management.
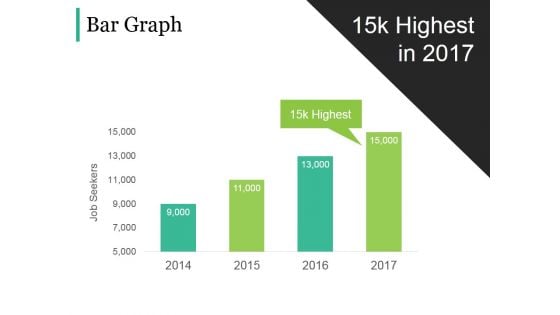
Bar Graph Ppt PowerPoint Presentation Gallery Example Topics
This is a bar graph ppt powerpoint presentation gallery example topics. This is a four stage process. The stages in this process are business, strategy, marketing, analysis, finance, bar graph.
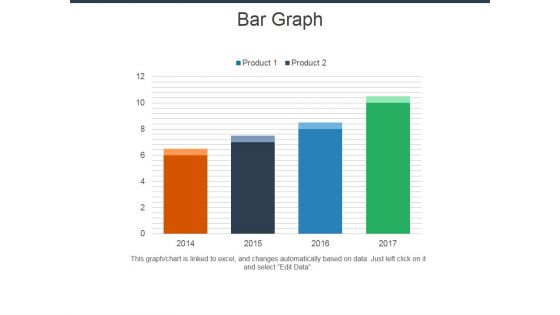
Bar Graph Ppt Powerpoint Presentation Infographic Template Smartart
This is a bar graph ppt powerpoint presentation infographic template smartart. This is a four stage process. The stages in this process are bar graph, business, management, strategy, planning.
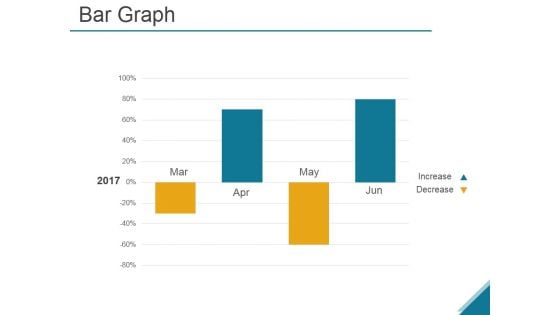
Bar Graph Ppt PowerPoint Presentation Infographic Template Background
This is a bar graph ppt powerpoint presentation infographic template background. This is a four stage process. The stages in this process are business, strategy, analysis, growth, chart and graph.
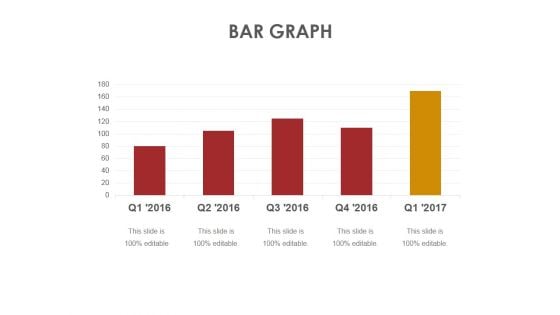
Bar Graph Ppt PowerPoint Presentation Gallery Infographic Template
This is a bar graph ppt powerpoint presentation gallery infographic template. This is a five stage process. The stages in this process are business, marketing, analysis, strategy, bar graph.
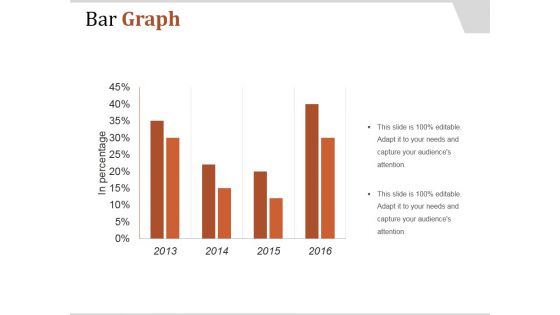
Bar Graph Ppt PowerPoint Presentation Layouts Design Templates
This is a bar graph ppt powerpoint presentation layouts design templates. This is a four stage process. The stages in this process are bar graph, planning, business, management, strategy.
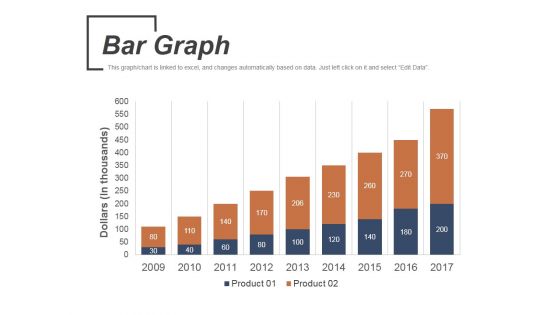
Bar Graph Ppt PowerPoint Presentation Outline Design Templates
This is a bar graph ppt powerpoint presentation outline design templates. This is a nine stage process. The stages in this process are bar graph, management, planning, strategy, marketing.
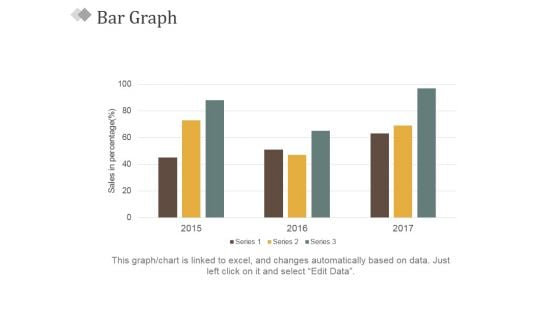
Bar Graph Ppt PowerPoint Presentation Slides Visual Aids
This is a bar graph ppt powerpoint presentation slides visual aids. This is a three stage process. The stages in this process are sales in percentage, bar graph, business, marketing, success.
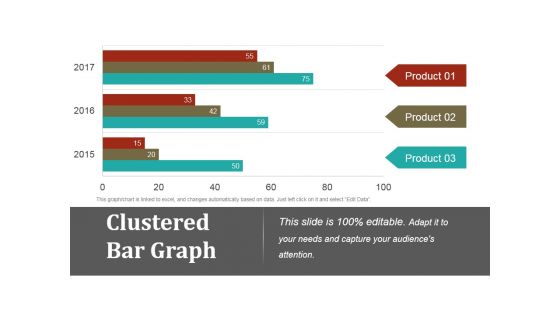
Clustered Bar Graph Ppt PowerPoint Presentation Gallery Graphics Example
This is a clustered bar graph ppt powerpoint presentation gallery graphics example. This is a three stage process. The stages in this process are clustered bar graph, finance, marketing, strategy, business.
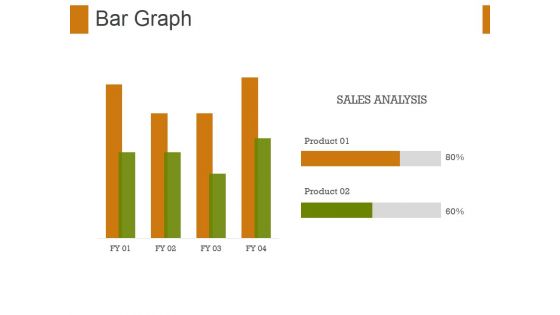
Bar Graph Ppt PowerPoint Presentation File Graphic Tips
This is a bar graph ppt powerpoint presentation file graphic tips. This is a two stage process. The stages in this process are bar graph, finance, marketing, strategy, sales, business.
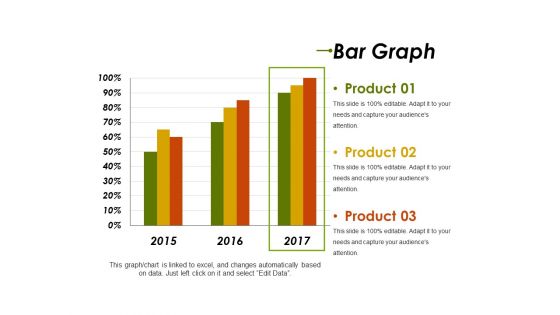
Bar Graph Template 1 Ppt PowerPoint Presentation Slides Format Ideas
This is a bar graph template 1 ppt powerpoint presentation slides format ideas. This is a three stage process. The stages in this process are product, years, bar graph, business, marketing.
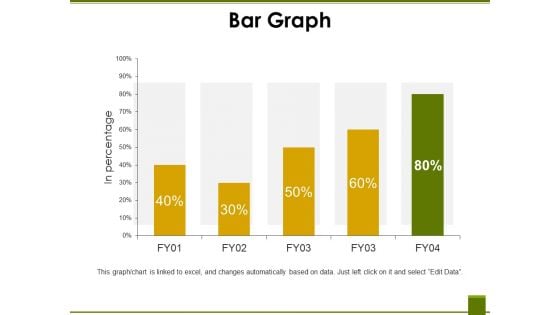
Bar Graph Template 2 Ppt PowerPoint Presentation Ideas Files
This is a bar graph template 2 ppt powerpoint presentation ideas files. This is a five stage process. The stages in this process are in percentage, business, marketing, finance, graph.
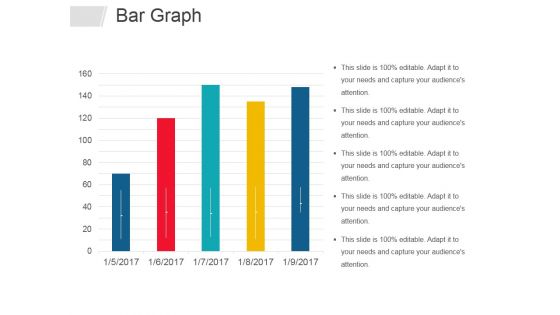
Bar Graph Ppt PowerPoint Presentation Infographics Graphics Design
This is a bar graph ppt powerpoint presentation infographics graphics design. This is a five stage process. The stages in this process are bar graph, business, years, marketing, management.
Bar Graph Template 1 Ppt PowerPoint Presentation Icon Layouts
This is a bar graph template 1 ppt powerpoint presentation icon layouts. This is a three stage process. The stages in this process are bar graph, finance, analysis, marketing, strategy.
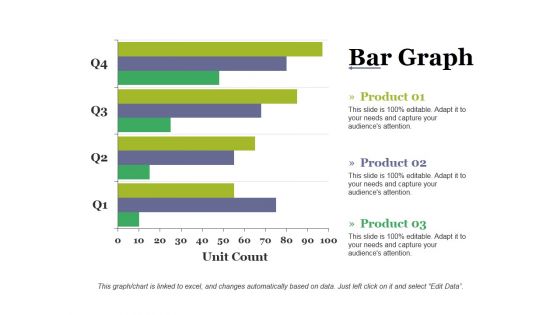
Bar Graph Template 2 Ppt PowerPoint Presentation Inspiration Backgrounds
This is a bar graph template 2 ppt powerpoint presentation inspiration backgrounds. This is a four stage process. The stages in this process are bar graph, finance, analysis, marketing, strategy.
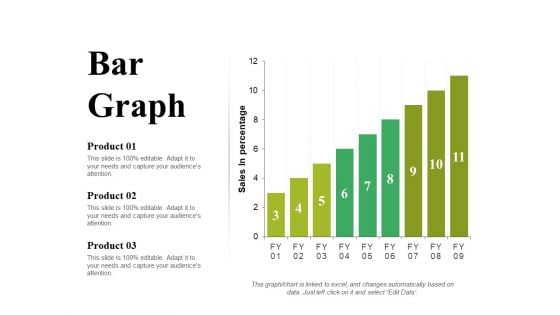
Bar Graph Ppt PowerPoint Presentation Portfolio Slide Portrait
This is a bar graph ppt powerpoint presentation portfolio slide portrait. This is a three stage process. The stages in this process are product, sales in percentage, bar graph, growth, success.
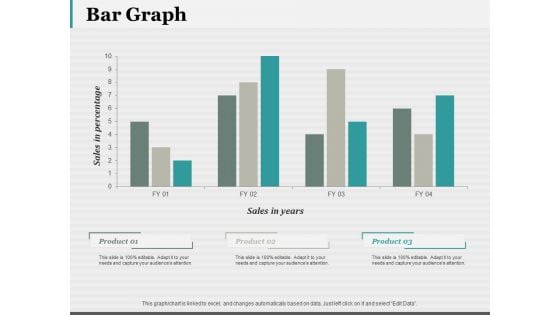
Bar Graph 7 QC Tools Ppt PowerPoint Presentation Styles Structure
This is a bar graph 7 qc tools ppt powerpoint presentation styles structure. This is a three stage process. The stages in this process are bar graph, finance, marketing, analysis, investment.

Algorithm Graph Pattern Matching Ppt PowerPoint Presentation Inspiration Background Images
This is a algorithm graph pattern matching ppt powerpoint presentation inspiration background images. This is a two stage process. The stages in this process are graph theory, chart theory, business.
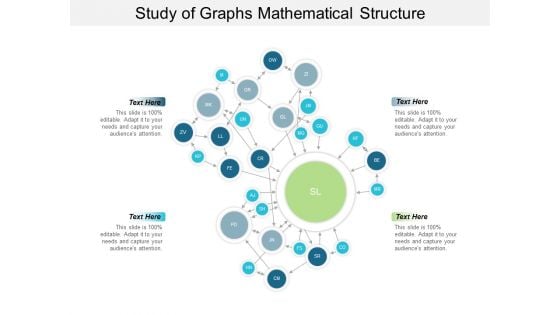
Study Of Graphs Mathematical Structure Ppt PowerPoint Presentation Gallery Background
This is a study of graphs mathematical structure ppt powerpoint presentation gallery background. This is a four stage process. The stages in this process are graph theory, chart theory, business.
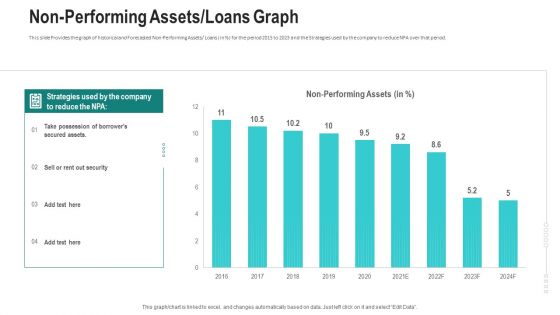
Non Performing Assets Loans Graph Ppt Summary Graphic Tips PDF
This slide Provides the graph of historical and Forecasted Non-Performing Assets or Loans in percent for the period 2015 to 2023 and the Strategies used by the company to reduce NPA over that period. Deliver and pitch your topic in the best possible manner with this non performing assets loans graph ppt summary graphic tips pdf. Use them to share invaluable insights on non performing assets or loans graph and impress your audience. This template can be altered and modified as per your expectations. So, grab it now.
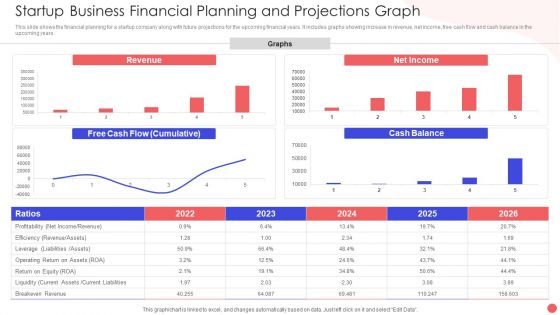
Startup Business Financial Planning And Projections Graph Slides PDF
This slide shows the financial planning for a startup company along with future projections for the upcoming financial years. It includes graphs showing increase in revenue, net income, free cash flow and cash balance in the upcoming years. Pitch your topic with ease and precision using this Startup Business Financial Planning And Projections Graph Slides PDF. This layout presents information on Revenue Graphs Operating, Free Cash Flow, Net Income Ration. It is also available for immediate download and adjustment. So, changes can be made in the color, design, graphics or any other component to create a unique layout.
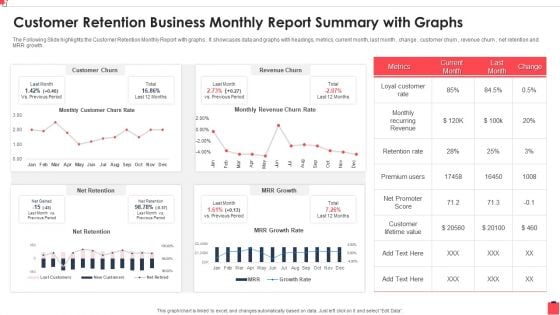
Customer Retention Business Monthly Report Summary With Graphs Guidelines PDF
The Following Slide highlights the Customer Retention Monthly Report with graphs . It showcases data and graphs with headings, metrics, current month, last month , change , customer churn , revenue churn , net retention and MRR growth. Showcasing this set of slides titled Customer Retention Business Monthly Report Summary With Graphs Guidelines PDF The topics addressed in these templates are Recurring Revenue, Customer Churn, Promoter Score All the content presented in this PPT design is completely editable. Download it and make adjustments in color, background, font etc. as per your unique business setting.
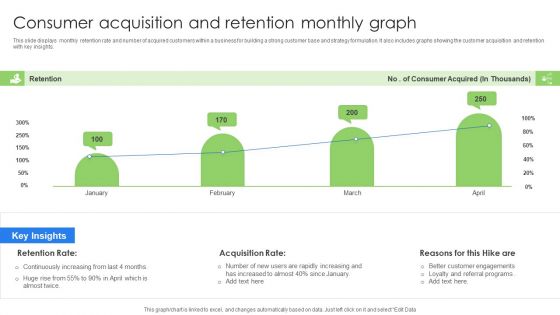
Consumer Acquisition And Retention Monthly Graph Background PDF
This slide displays monthly retention rate and number of acquired customers within a business for building a strong customer base and strategy formulation. It also includes graphs showing the customer acquisition and retention with key insights. Pitch your topic with ease and precision using this Consumer Acquisition And Retention Monthly Graph Background PDF. This layout presents information on Consumer Acquisition, Retention Monthly Graph. It is also available for immediate download and adjustment. So, changes can be made in the color, design, graphics or any other component to create a unique layout.
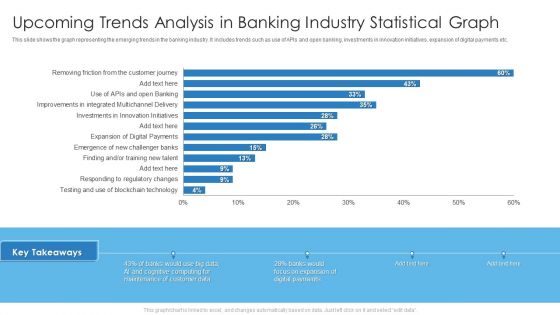
Upcoming Trends Analysis In Banking Industry Statistical Graph Brochure PDF
This slide shows the graph representing the emerging trends in the banking industry. It includes trends such as use of APIs and open banking, investments in innovation initiatives, expansion of digital payments etc. Deliver and pitch your topic in the best possible manner with this Upcoming Trends Analysis In Banking Industry Statistical Graph Brochure PDF. Use them to share invaluable insights on Upcoming Trends Analysis, Banking Industry Statistical Graph and impress your audience. This template can be altered and modified as per your expectations. So, grab it now.
Safety And Health Kpis For Tracking Performance Graph Mockup PDF
This slide represents graph showing key performance indicators tracked by companies for assessment of safety and health performance of their workplace. It includes key metrics such as workforce awareness, safety meetings held, recordable injuries, lost work days, compliance, severity rates etc. Pitch your topic with ease and precision using this Safety And Health Kpis For Tracking Performance Graph Mockup PDF. This layout presents information on Safety And Health, Kpis For Tracking, Performance Graph. It is also available for immediate download and adjustment. So, changes can be made in the color, design, graphics or any other component to create a unique layout.
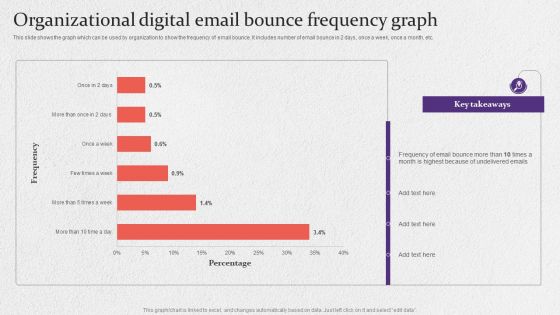
Organizational Digital Email Bounce Frequency Graph Formats PDF
This slide shows the graph which can be used by organization to show the frequency of email bounce. It includes number of email bounce in 2 days, once a week, once a month, etc. Pitch your topic with ease and precision using this Organizational Digital Email Bounce Frequency Graph Formats PDF. This layout presents information on Organizational Digital, Email Bounce Frequency Graph. It is also available for immediate download and adjustment. So, changes can be made in the color, design, graphics or any other component to create a unique layout.
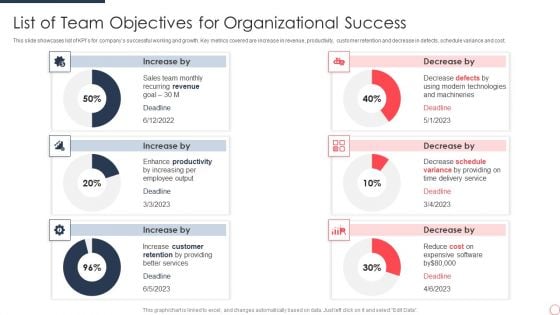
List Of Team Objectives For Organizational Success Ideas PDF
This slide showcases list of KPIs for companys successful working and growth. Key metrics covered are increase in revenue, productivity, customer retention and decrease in defects, schedule variance and cost. Showcasing this set of slides titled List Of Team Objectives For Organizational Success Ideas PDF. The topics addressed in these templates are Sales Team, Recurring Revenue, Goal. All the content presented in this PPT design is completely editable. Download it and make adjustments in color, background, font etc. as per your unique business setting.
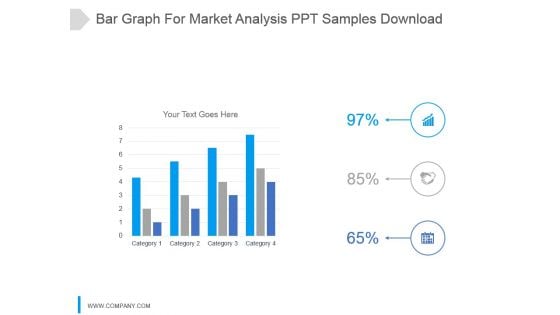
Bar Graph For Market Analysis Ppt Samples Download
This is a bar graph for market analysis ppt samples download. This is a four stage process. The stages in this process are category.
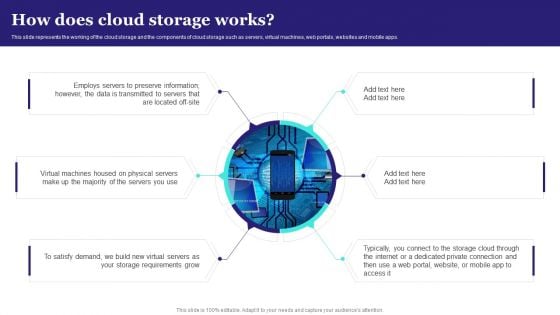
How Does Cloud Storage Works Introduction PDF
This slide represents the working of the cloud storage and the components of cloud storage such as servers, virtual machines, web portals, websites and mobile apps. Create an editable How Does Cloud Storage Works Introduction PDF that communicates your idea and engages your audience. Whether you are presenting a business or an educational presentation, pre designed presentation templates help save time. How Does Cloud Storage Works Introduction PDF is highly customizable and very easy to edit, covering many different styles from creative to business presentations. Slidegeeks has creative team members who have crafted amazing templates. So, go and get them without any delay.

Non Performing Assets Loans Graph Ppt Inspiration Information PDF
This slide Provides the graph of historical and Forecasted Non Performing Assets Loans in persent for the period 2015 to 2023 and the Strategies used by the company to reduce NPA over that period.Deliver an awe-inspiring pitch with this creative non performing assets loans graph ppt inspiration information pdf. bundle. Topics like non performing assets, 2015 to 2023 can be discussed with this completely editable template. It is available for immediate download depending on the needs and requirements of the user
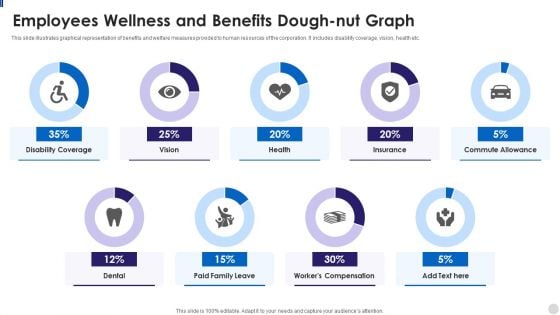
Employees Wellness And Benefits Dough Nut Graph Infographics PDF
This slide illustrates graphical representation of benefits and welfare measures provided to human resources of the corporation. It includes disability coverage, vision, health etc. Showcasing this set of slides titled Employees Wellness And Benefits Dough Nut Graph Infographics PDF. The topics addressed in these templates are Employees Wellness And Benefits Dough Nut Graph. All the content presented in this PPT design is completely editable. Download it and make adjustments in color, background, font etc. as per your unique business setting.

Brand Revenue Comparative Analysis Graph With Key Insights Inspiration PDF
This slide illustrates graphical representation of sales revenue of three brands. It includes insights and facts and figures of these brands.Showcasing this set of slides titled Brand Revenue Comparative Analysis Graph With Key Insights Inspiration PDF. The topics addressed in these templates are Brand Revenue Comparative Analysis Graph With Key Insights. All the content presented in this PPT design is completely editable. Download it and make adjustments in color, background, font etc. as per your unique business setting.
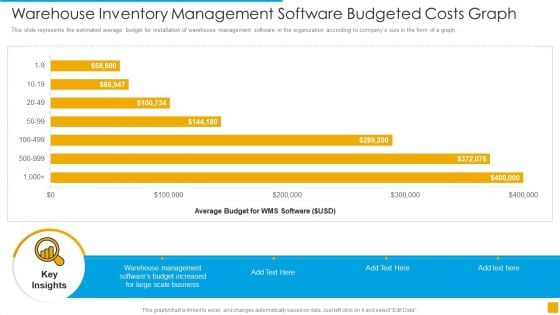
Warehouse Inventory Management Software Budgeted Costs Graph Demonstration PDF
This slide represents the estimated average budget for installation of warehouse management software in the organization according to companys size in the form of a graph Pitch your topic with ease and precision using this Warehouse Inventory Management Software Budgeted Costs Graph Demonstration PDF. This layout presents information on Management, Budget, Average. It is also available for immediate download and adjustment. So, changes can be made in the color, design, graphics or any other component to create a unique layout.
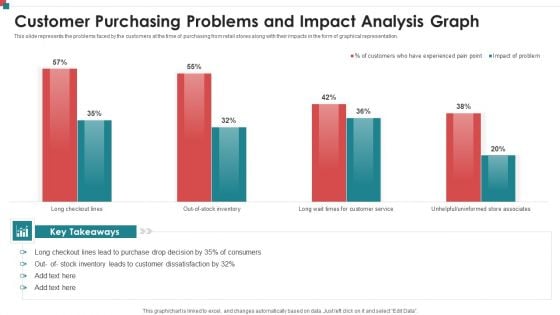
Customer Purchasing Problems And Impact Analysis Graph Inspiration PDF
This slide represents the problems faced by the customers at the time of purchasing from retail stores along with their impacts in the form of graphical representation. Showcasing this set of slides titled Customer Purchasing Problems And Impact Analysis Graph Inspiration PDF. The topics addressed in these templates are Customer Purchasing Problems And Impact Analysis Graph. All the content presented in this PPT design is completely editable. Download it and make adjustments in color, background, font etc. as per your unique business setting.
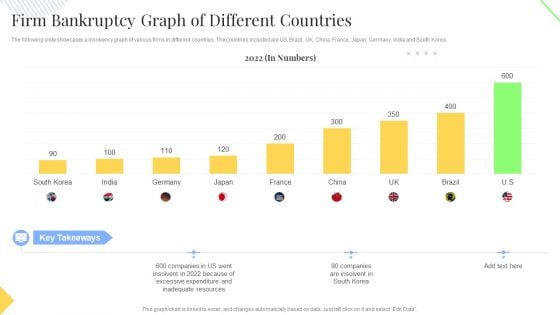
Firm Bankruptcy Graph Of Different Countries Summary PDF
The following slide showcases a insolvency graph of various firms in different countries. The countries included are US, Brazil, UK, China, France, Japan, Germany, India and South Korea. Showcasing this set of slides titled Firm Bankruptcy Graph Of Different Countries Summary PDF. The topics addressed in these templates are Excessive Expenditure, Inadequate Resources. All the content presented in this PPT design is completely editable. Download it and make adjustments in color, background, font etc. as per your unique business setting.
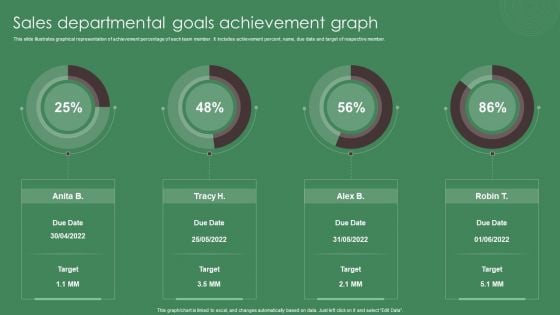
Sales Departmental Goals Achievement Graph Ppt Inspiration Slide Download PDF
This slide illustrates graphical representation of achievement percentage of each team member. It includes achievement percent, name, due date and target of respective member. Pitch your topic with ease and precision using this Sales Departmental Goals Achievement Graph Ppt Inspiration Slide Download PDF. This layout presents information on Sales Departmental, Goals, Achievement Graph. It is also available for immediate download and adjustment. So, changes can be made in the color, design, graphics or any other component to create a unique layout.
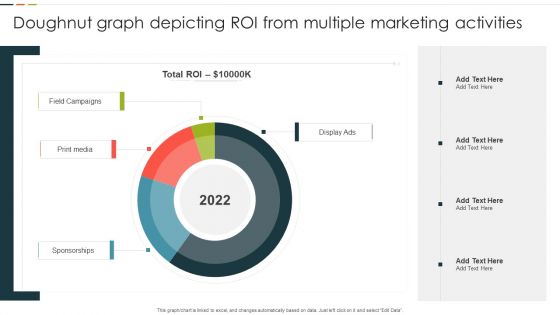
Doughnut Graph Depicting ROI From Multiple Marketing Activities Rules PDF
This graph or chart is linked to excel, and changes automatically based on data. Just left click on it and select Edit Data. Pitch your topic with ease and precision using this Doughnut Graph Depicting ROI From Multiple Marketing Activities Rules PDF. This layout presents information on Total ROI, Field Campaigns, Print Media, Display Ads. It is also available for immediate download and adjustment. So, changes can be made in the color, design, graphics or any other component to create a unique layout.
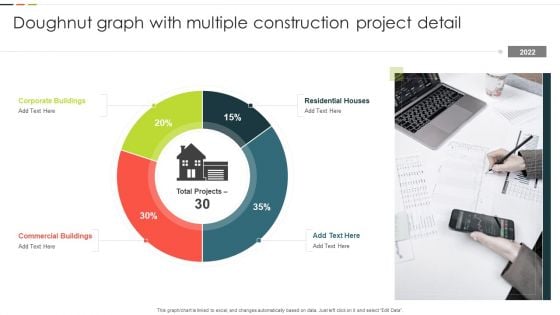
Doughnut Graph With Multiple Construction Project Detail Structure PDF
This graph or chart is linked to excel, and changes automatically based on data. Just left click on it and select Edit Data. Showcasing this set of slides titled Doughnut Graph With Multiple Construction Project Detail Structure PDF. The topics addressed in these templates are Corporate Buildings, Residential Houses, Commercial Buildings. All the content presented in this PPT design is completely editable. Download it and make adjustments in color, background, font etc. as per your unique business setting.
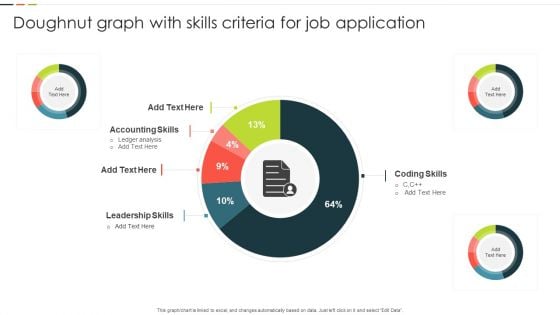
Doughnut Graph With Skills Criteria For Job Application Designs PDF
This graph or chart is linked to excel, and changes automatically based on data. Just left click on it and select Edit Data. Showcasing this set of slides titled Doughnut Graph With Skills Criteria For Job Application Designs PDF. The topics addressed in these templates are Accounting Skills, Leadership Skills, Coding Skills. All the content presented in this PPT design is completely editable. Download it and make adjustments in color, background, font etc. as per your unique business setting.


 Continue with Email

 Home
Home


