Coordination
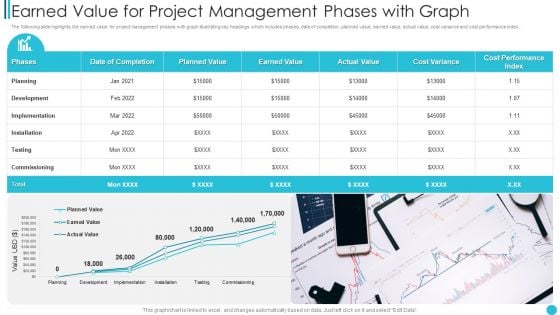
Earned Value For Project Management Phases With Graph Microsoft PDF
The following slide highlights the earned value for project management phases with graph illustrating key headings which includes phases, date of completion, planned value, earned value, actual value, cost variance and cost performance index.Pitch your topic with ease and precision using this Earned Value For Project Management Phases With Graph Microsoft PDF This layout presents information on Implementation, Installation, Commissioning It is also available for immediate download and adjustment. So, changes can be made in the color, design, graphics or any other component to create a unique layout.
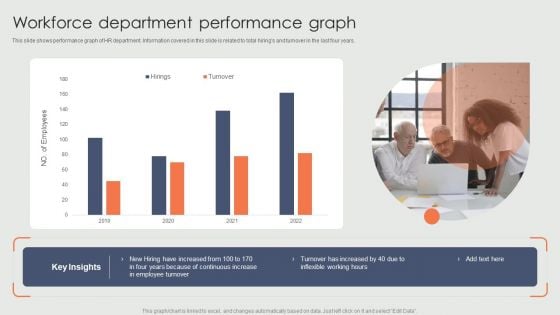
Workforce Department Performance Graph Ppt Model Graphics Pictures PDF
This slide shows performance graph of HR department. Information covered in this slide is related to total hirings and turnover in the last four years. Pitch your topic with ease and precision using this Workforce Department Performance Graph Ppt Model Graphics Pictures PDF. This layout presents information on New Hiring, Continuous Increase, Employee Turnover, 2019 To 2022. It is also available for immediate download and adjustment. So, changes can be made in the color, design, graphics or any other component to create a unique layout.
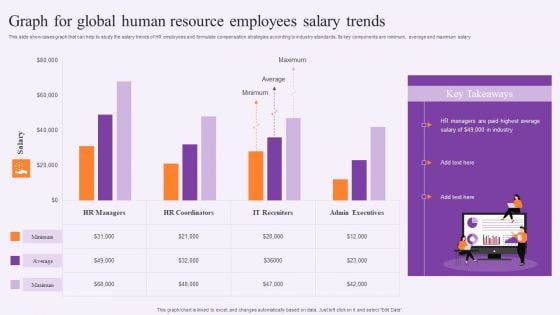
Graph For Global Human Resource Employees Salary Trends Demonstration PDF
This slide showcases graph that can help to study the salary trends of HR employees and formulate compensation strategies according to industry standards. Its key components are minimum, average and maximum salary. Showcasing this set of slides titled Graph For Global Human Resource Employees Salary Trends Demonstration PDF. The topics addressed in these templates are Global Human Resource, Employees Salary Trends. All the content presented in this PPT design is completely editable. Download it and make adjustments in color, background, font etc. as per your unique business setting.
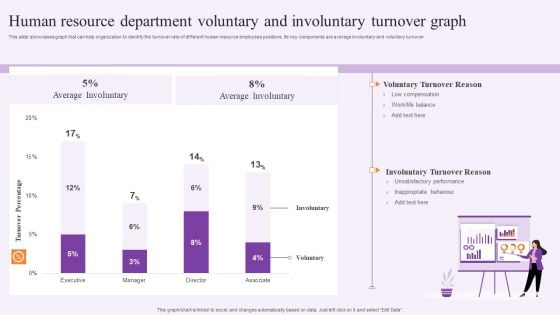
Human Resource Department Voluntary And Involuntary Turnover Graph Summary PDF
This slide showcases graph that can help organization to identify the turnover rate of different human resource employees positions. Its key components are average involuntary and voluntary turnover. Pitch your topic with ease and precision using this Human Resource Department Voluntary And Involuntary Turnover Graph Summary PDF. This layout presents information on Executive, Voluntary Turnover Reason, Average Involuntary. It is also available for immediate download and adjustment. So, changes can be made in the color, design, graphics or any other component to create a unique layout.
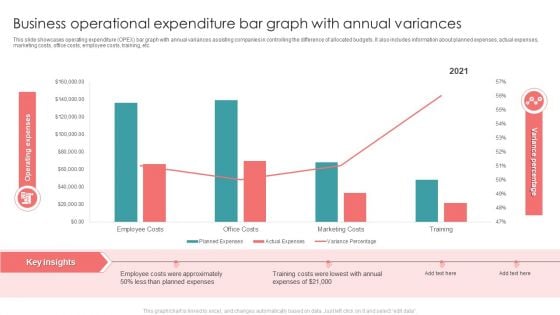
Business Operational Expenditure Bar Graph With Annual Variances Brochure PDF
This slide showcases operating expenditure OPEX bar graph with annual variances assisting companies in controlling the difference of allocated budgets. It also includes information about planned expenses, actual expenses, marketing costs, office costs, employee costs, training, etc. Showcasing this set of slides titled Business Operational Expenditure Bar Graph With Annual Variances Brochure PDF. The topics addressed in these templates are Employee Costs, Planned Expenses, Training Costs. All the content presented in this PPT design is completely editable. Download it and make adjustments in color, background, font etc. as per your unique business setting.
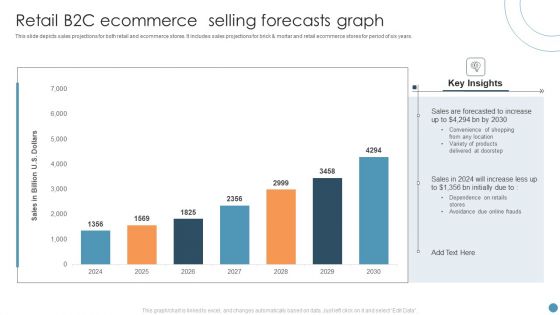
Retail B2C Ecommerce Selling Forecasts Graph Portrait PDF
This slide depicts sales projections for both retail and ecommerce stores. It includes sales projections for brick and mortar and retail ecommerce stores for period of six years. Pitch your topic with ease and precision using this Retail B2C Ecommerce Selling Forecasts Graph Portrait PDF. This layout presents information on Retail B2C Ecommerce, Selling Forecasts Graph. It is also available for immediate download and adjustment. So, changes can be made in the color, design, graphics or any other component to create a unique layout.
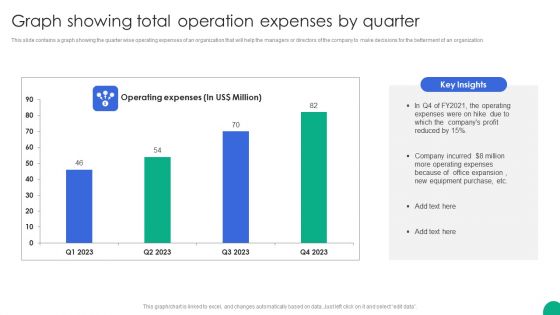
Graph Showing Total Operation Expenses By Quarter Themes PDF
This slide contains a graph showing the quarter wise operating expenses of an organization that will help the managers or directors of the company to make decisions for the betterment of an organization.Pitch your topic with ease and precision using this Graph Showing Total Operation Expenses By Quarter Themes PDF. This layout presents information on Operating Expenses, Equipment Purchase, Office Expansion. It is also available for immediate download and adjustment. So, changes can be made in the color, design, graphics or any other component to create a unique layout.
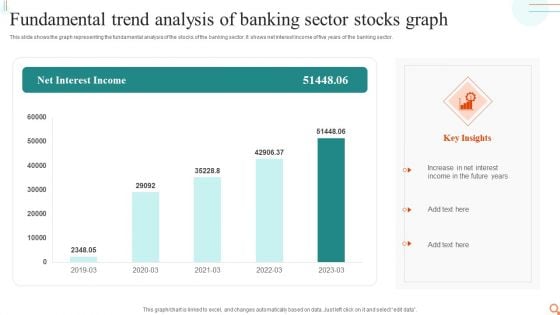
Fundamental Trend Analysis Of Banking Sector Stocks Graph Mockup PDF
This slide shows the graph representing the fundamental analysis of the stocks of the banking sector. It shows net interest income of five years of the banking sector.Pitch your topic with ease and precision using this Fundamental Trend Analysis Of Banking Sector Stocks Graph Mockup PDF. This layout presents information on Increase Interest, Income Future, Interest Income. It is also available for immediate download and adjustment. So, changes can be made in the color, design, graphics or any other component to create a unique layout.
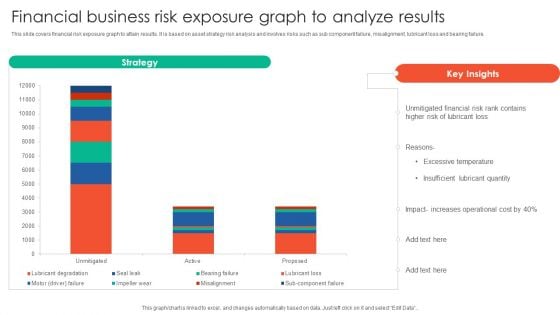
Financial Business Risk Exposure Graph To Analyze Results Elements PDF
This slide covers financial risk exposure graph to attain results. It is based on asset strategy risk analysis and involves risks such as sub component failure, misalignment, lubricant loss and bearing failure. Pitch your topic with ease and precision using this Financial Business Risk Exposure Graph To Analyze Results Elements PDF. This layout presents information on Strategy, Unmitigated Financial, Risk Rank Contains. It is also available for immediate download and adjustment. So, changes can be made in the color, design, graphics or any other component to create a unique layout.
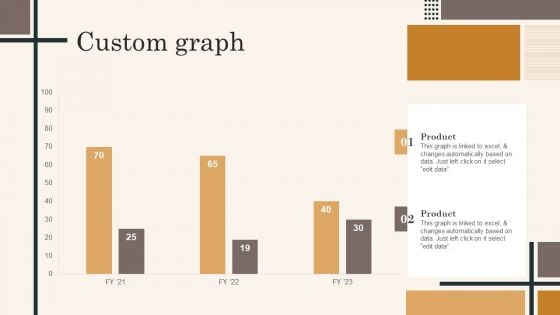
Edtech Service Launch And Promotion Plan Custom Graph Portrait PDF
Here you can discover an assortment of the finest PowerPoint and Google Slides templates. With these templates, you can create presentations for a variety of purposes while simultaneously providing your audience with an eye catching visual experience. Download Edtech Service Launch And Promotion Plan Custom Graph Portrait PDF to deliver an impeccable presentation. These templates will make your job of preparing presentations much quicker, yet still, maintain a high level of quality. Slidegeeks has experienced researchers who prepare these templates and write high quality content for you. Later on, you can personalize the content by editing the Edtech Service Launch And Promotion Plan Custom Graph Portrait PDF.
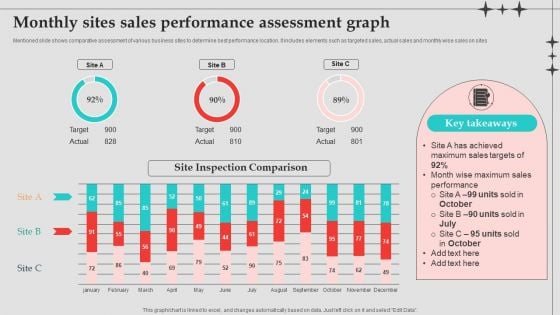
Monthly Sites Sales Performance Assessment Graph Designs PDF
Mentioned slide shows comparative assessment of various business sites to determine best performance location. It includes elements such as targeted sales, actual sales and monthly wise sales on sites. Pitch your topic with ease and precision using this Monthly Sites Sales Performance Assessment Graph Designs PDF. This layout presents information on Sales Performance, Sales Targets, Performance Assessment Graph . It is also available for immediate download and adjustment. So, changes can be made in the color, design, graphics or any other component to create a unique layout.
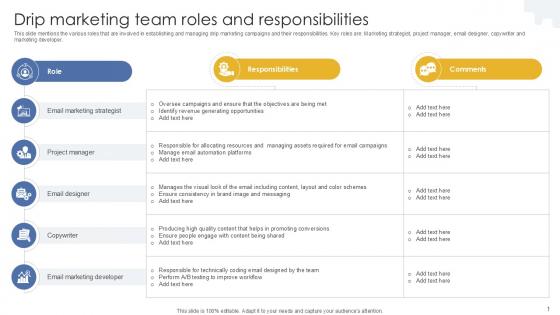
Drip Marketing Team Roles And Responsibilities PPT PowerPoint MKT SS V
This slide mentions the various roles that are involved in establishing and managing drip marketing campaigns and their responsibilities. Key roles are Marketing strategist, project manager, email designer, copywriter and marketing developer. If you are looking for a format to display your unique thoughts, then the professionally designed Drip Marketing Team Roles And Responsibilities PPT PowerPoint MKT SS V is the one for you. You can use it as a Google Slides template or a PowerPoint template. Incorporate impressive visuals, symbols, images, and other charts. Modify or reorganize the text boxes as you desire. Experiment with shade schemes and font pairings. Alter, share or cooperate with other people on your work. Download Drip Marketing Team Roles And Responsibilities PPT PowerPoint MKT SS V and find out how to give a successful presentation. Present a perfect display to your team and make your presentation unforgettable. This slide mentions the various roles that are involved in establishing and managing drip marketing campaigns and their responsibilities. Key roles are Marketing strategist, project manager, email designer, copywriter and marketing developer.
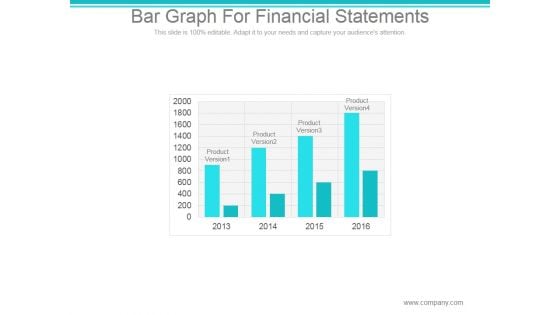
Bar Graph For Financial Statements Ppt PowerPoint Presentation Example
This is a bar graph for financial statements ppt powerpoint presentation example. This is a four stage process. The stages in this process are product version, finance, year.
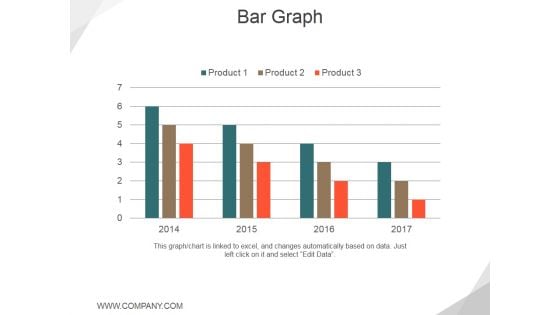
Bar Graph Ppt PowerPoint Presentation Layouts Graphic Images
This is a bar graph ppt powerpoint presentation layouts graphic images. This is a four stage process. The stages in this process are product, business, marketing, growth.
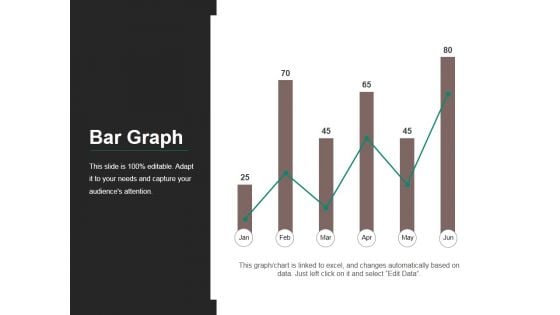
Bar Graph Ppt PowerPoint Presentation Slides Graphic Images
This is a bar graph ppt powerpoint presentation slides graphic images. This is a six stage process. The stages in this process are bar, finance, business, marketing, growth.
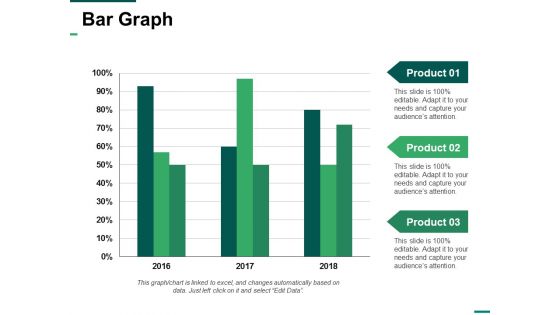
Bar Graph Ppt PowerPoint Presentation Styles Visual Aids
This is a bar graph ppt powerpoint presentation styles visual aids. This is a three stage process. The stages in this process are bar, marketing, strategy, finance, planning.
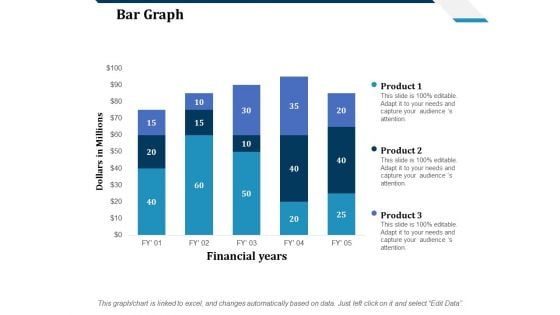
Bar Graph Ppt PowerPoint Presentation Ideas Design Inspiration
This is a bar graph ppt powerpoint presentation ideas design inspiration. This is a five stage process. The stages in this process are bar, marketing, strategy, planning, finance.
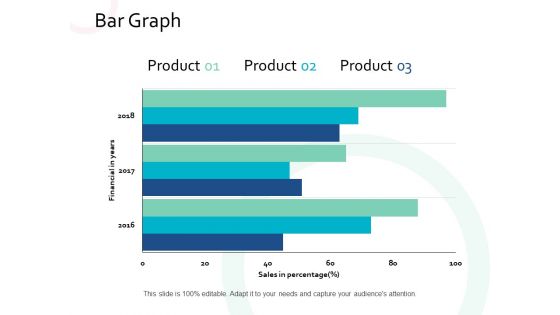
Bar Graph Finance Ppt PowerPoint Presentation Summary Ideas
This is a bar graph finance ppt powerpoint presentation summary ideas. This is a three stage process. The stages in this process are finance, analysis, business, investment, marketing.
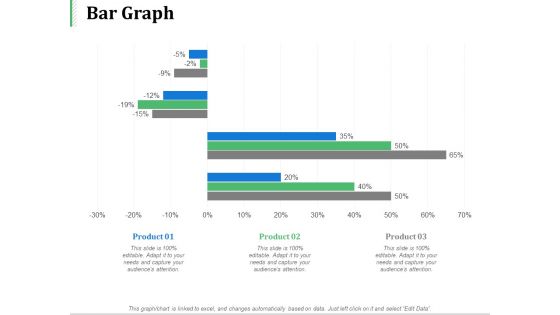
Bar Graph Product Ppt PowerPoint Presentation Layouts Ideas
This is a bar graph product ppt powerpoint presentation layouts ideas. This is a three stage process. The stages in this process are business, management, marketing, product, percentage.

PowerPoint Slides Gear Company Ppt Designs
PowerPoint Slides Gear Company PPT Designs-Gear Wheels sound like magic, but they're simply science in action! Geared devices can change the speed, and direction of a power source. Use this graphic to explain sustainability objectives. The Sustainable Business reveals proven ways to apply long-term (i.e.: sustainable) business concepts in a concise, easy-to-understand framework that has proven to generate wealth, optimize labour and financial investments and other valuable resources, and reduce environmental degradation in the bargain-PowerPoint Slides Gear Company PPT Designs-3d, Business, Cog, Cogwheel, Collaboration, Communication, Component, Connection, Construction, Cooperate, Cooperation, Development, Different, Domination, Element, Energy, Engine, Engineering, Equipment, Essential, Fctory, Gear, Group Forget about ceilings with our PowerPoint Slides Gear Company Ppt Designs. They pitch it so high that the glass will crack.
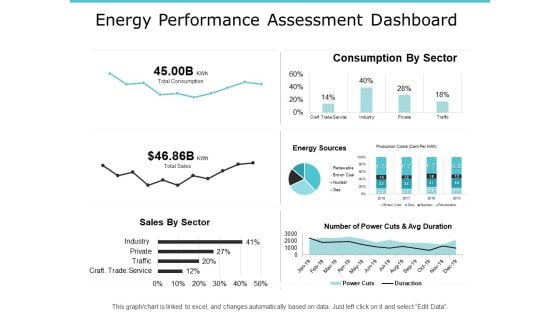
Energy Performance Assessment Dashboard Graph Ppt PowerPoint Presentation Slide
Presenting this set of slides with name energy performance assessment dashboard graph ppt powerpoint presentation slide. The topics discussed in these slides are marketing, business, management, planning, strategy. This is a completely editable PowerPoint presentation and is available for immediate download. Download now and impress your audience.
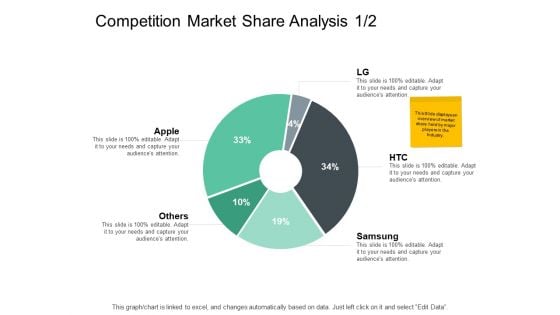
Competition Market Share Analysis Graph Ppt PowerPoint Presentation Infographics Inspiration
Presenting this set of slides with name competition market share analysis graph ppt powerpoint presentation infographics inspiration. The topics discussed in these slides are marketing, business, management, planning, strategy. This is a completely editable PowerPoint presentation and is available for immediate download. Download now and impress your audience.
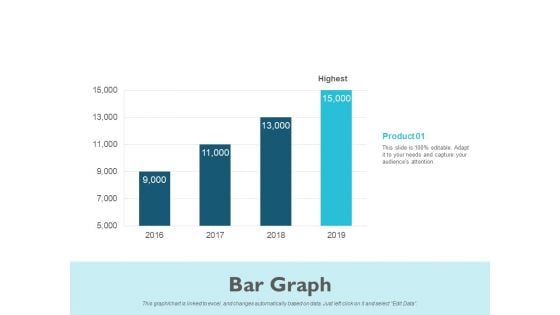
Bar Graph Process Ppt PowerPoint Presentation Portfolio Designs Download
Presenting this set of slides with name bar graph process ppt powerpoint presentation portfolio designs download. The topics discussed in these slides are finance, marketing, management, investment, analysis. This is a completely editable PowerPoint presentation and is available for immediate download. Download now and impress your audience.
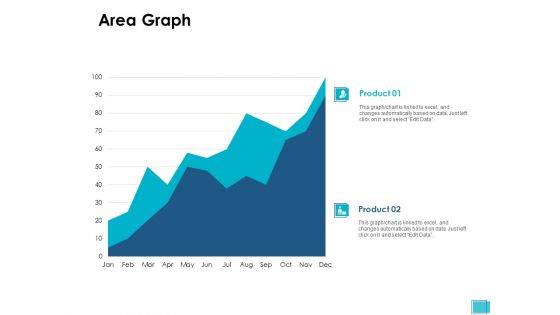
Area Graph Analysis Ppt PowerPoint Presentation Summary Graphics Example
Presenting this set of slides with name area graph analysis ppt powerpoint presentation summary graphics example. The topics discussed in these slides are finance, marketing, management, investment, analysis. This is a completely editable PowerPoint presentation and is available for immediate download. Download now and impress your audience.
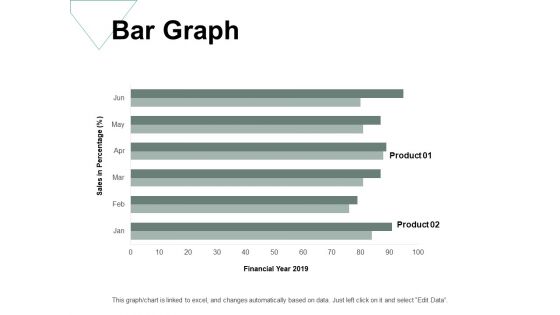
Bar Graph Investment Ppt PowerPoint Presentation Infographics Graphics Template
Presenting this set of slides with name bar graph investment ppt powerpoint presentation infographics graphics template. The topics discussed in these slides are finance, marketing, management, investment, analysis. This is a completely editable PowerPoint presentation and is available for immediate download. Download now and impress your audience.
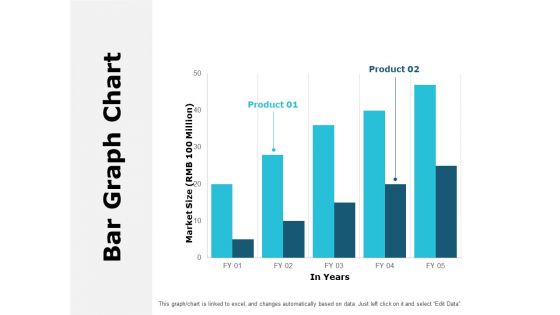
Bar Graph Chart Analysis Ppt PowerPoint Presentation Outline Good
Presenting this set of slides with name bar graph chart analysis ppt powerpoint presentation outline good. The topics discussed in these slides are finance, marketing, management, investment, analysis. This is a completely editable PowerPoint presentation and is available for immediate download. Download now and impress your audience.
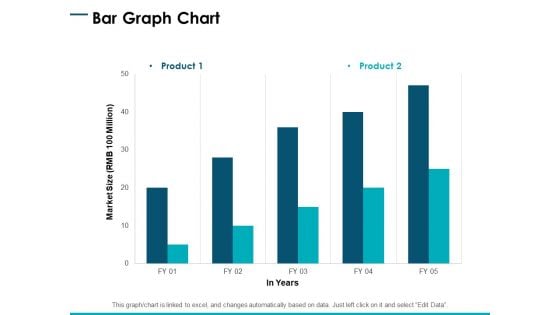
Bar Graph Chart Analysis Ppt PowerPoint Presentation Gallery Objects
Presenting this set of slides with name bar graph chart analysis ppt powerpoint presentation gallery objects. The topics discussed in these slides are finance, marketing, management, investment, analysis. This is a completely editable PowerPoint presentation and is available for immediate download. Download now and impress your audience.
Bar Graph Product Ppt PowerPoint Presentation Icon Layout
Presenting this set of slides with name bar graph product ppt powerpoint presentation icon layout. The topics discussed in these slides are finance, marketing, management, investment, analysis. This is a completely editable PowerPoint presentation and is available for immediate download. Download now and impress your audience.
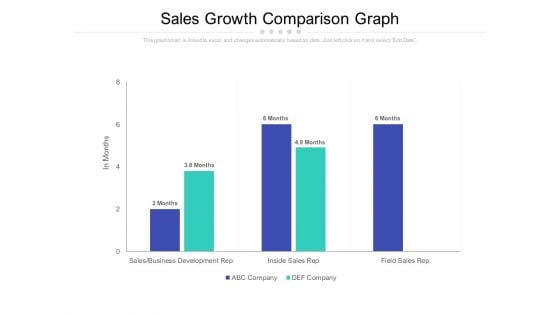
Sales Growth Comparison Graph Ppt PowerPoint Presentation Outline Demonstration
Presenting this set of slides with name sales growth comparison graph ppt powerpoint presentation outline demonstration. The topics discussed in these slides are sales, business development rep, inside sales rep, field sales rep. This is a completely editable PowerPoint presentation and is available for immediate download. Download now and impress your audience.
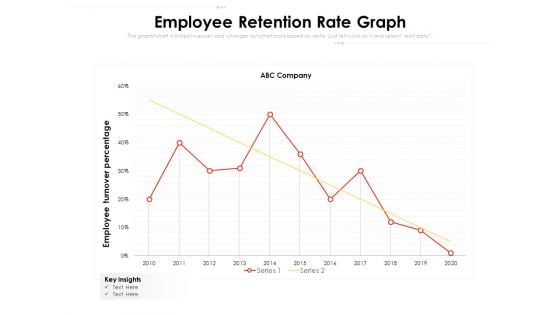
Employee Retention Rate Graph Ppt PowerPoint Presentation Pictures Portrait PDF
Presenting this set of slides with name employee retention rate graph ppt powerpoint presentation pictures portrait pdf. The topics discussed in these slides are key insights, 2010 to 2020, employee turnover percentage. This is a completely editable PowerPoint presentation and is available for immediate download. Download now and impress your audience.
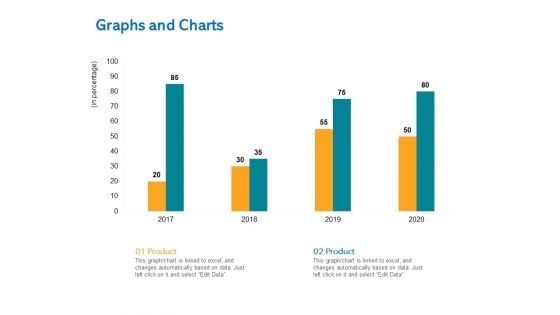
Agile Marketing Approach Graphs And Charts Ppt Gallery Samples PDF
Presenting this set of slides with name agile marketing approach graphs and charts ppt gallery samples pdf. The topics discussed in these slides are product 1, product 2. This is a completely editable PowerPoint presentation and is available for immediate download. Download now and impress your audience.
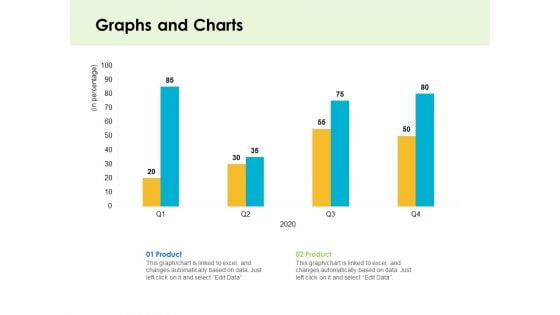
Key Team Members Graphs And Charts Ppt Images PDF
Presenting this set of slides with name key team members graphs and charts ppt images pdf. The topics discussed in these slides are product 1, product 2. This is a completely editable PowerPoint presentation and is available for immediate download. Download now and impress your audience.
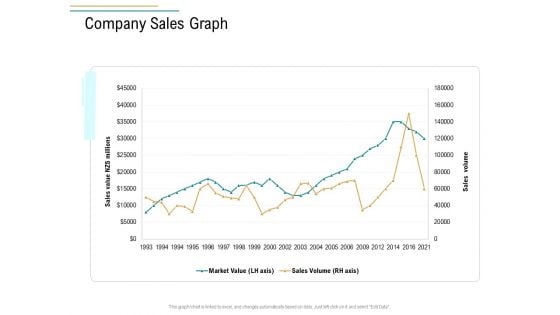
Business Operations Assessment Company Sales Graph Ppt Portfolio Good PDF
Deliver an awe-inspiring pitch with this creative business operations assessment company sales graph ppt portfolio good pdf bundle. Topics like market value, sales volume can be discussed with this completely editable template. It is available for immediate download depending on the needs and requirements of the user.
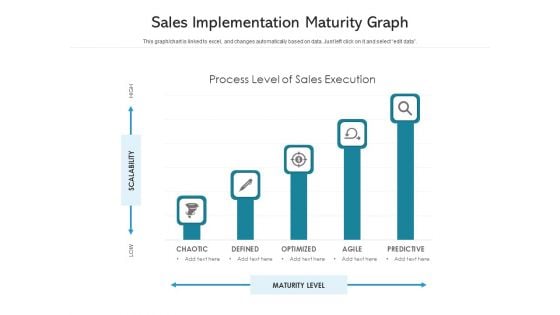
Sales Implementation Maturity Graph Ppt PowerPoint Presentation Inspiration Microsoft PDF
Showcasing this set of slides titled sales implementation maturity graph ppt powerpoint presentation inspiration microsoft pdf. The topics addressed in these templates are chaotic, defined, optimized, agile, predictive. All the content presented in this PPT design is completely editable. Download it and make adjustments in color, background, font etc. as per your unique business setting.
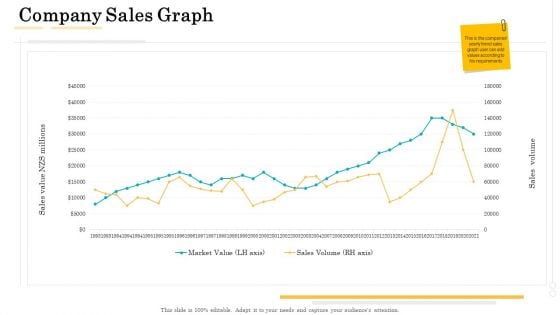
Administrative Regulation Company Sales Graph Ppt PowerPoint Presentation Outline PDF
Deliver an awe-inspiring pitch with this creative administrative regulation company sales graph ppt powerpoint presentation outline pdf bundle. Topics like market value, sales volume can be discussed with this completely editable template. It is available for immediate download depending on the needs and requirements of the user.
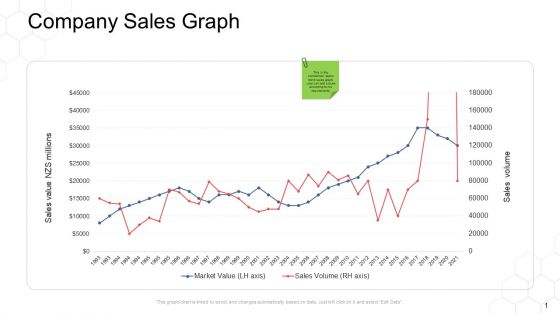
Corporate Regulation Company Sales Graph Ppt Infographics Backgrounds PDF
Deliver an awe inspiring pitch with this creative corporate regulation company sales graph ppt infographics backgrounds pdf bundle. Topics like sales, value, market can be discussed with this completely editable template. It is available for immediate download depending on the needs and requirements of the user.
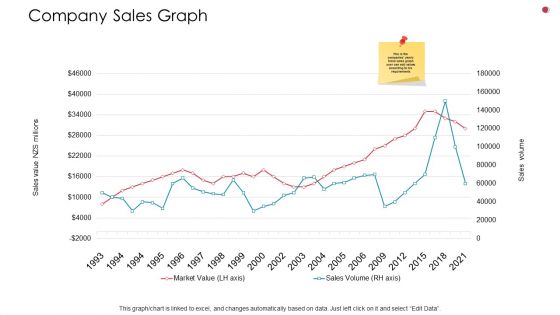
Company Sales Graph Business Analysis Method Ppt Professional Visuals PDF
Deliver an awe inspiring pitch with this creative company sales graph business analysis method ppt professional visuals pdf bundle. Topics like market value, sales can be discussed with this completely editable template. It is available for immediate download depending on the needs and requirements of the user.
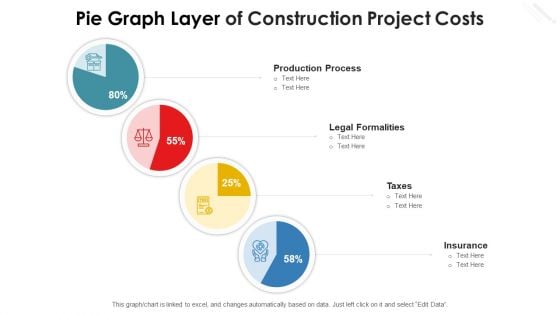
Pie Graph Layer Of Construction Project Costs Diagrams PDF
Showcasing this set of slides titled pie graph layer of construction project costs diagrams pdf. The topics addressed in these templates are production process, taxes, legal formalities, insurance. All the content presented in this PPT design is completely editable. Download it and make adjustments in color, background, font etc. as per your unique business setting.

Pie Graph Layer Of Marketing Expenditure Themes PDF
Pitch your topic with ease and precision using this pie graph layer of marketing expenditure themes pdf. This layout presents information on online advertising, trade shows, sales training, catalogs and brochures. It is also available for immediate download and adjustment. So, changes can be made in the color, design, graphics or any other component to create a unique layout.
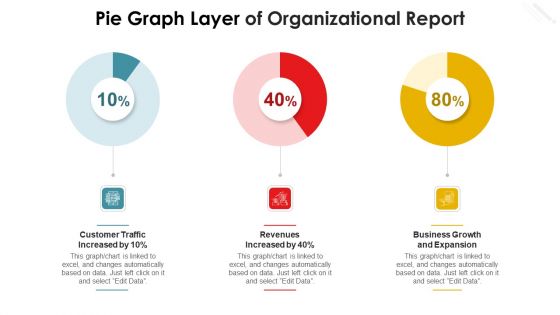
Pie Graph Layer Of Organizational Report Themes PDF
Pitch your topic with ease and precision using this pie graph layer of organizational report themes pdf. This layout presents information on revenues increased by, business growth and expansion, customer traffic increased by. It is also available for immediate download and adjustment. So, changes can be made in the color, design, graphics or any other component to create a unique layout.
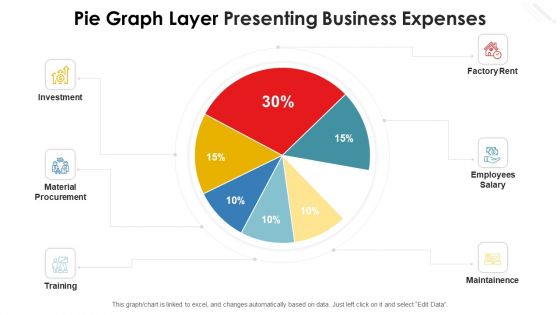
Pie Graph Layer Presenting Business Expenses Topics PDF
Pitch your topic with ease and precision using this pie graph layer presenting business expenses topics pdf. This layout presents information on investment, material procurement, training, employees salary, factory rent. It is also available for immediate download and adjustment. So, changes can be made in the color, design, graphics or any other component to create a unique layout.
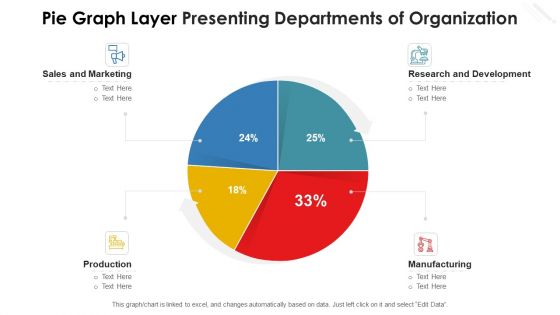
Pie Graph Layer Presenting Departments Of Organization Infographics PDF
Showcasing this set of slides titled pie graph layer presenting departments of organization infographics pdf. The topics addressed in these templates are sales and marketing, production, manufacturing, research and development. All the content presented in this PPT design is completely editable. Download it and make adjustments in color, background, font etc. as per your unique business setting.
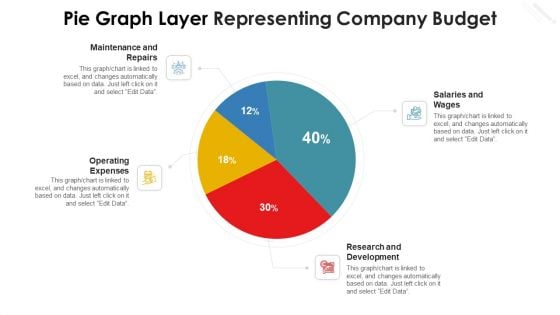
Pie Graph Layer Representing Company Budget Sample PDF
Pitch your topic with ease and precision using this pie graph layer representing company budget sample pdf. This layout presents information on maintenance and repairs, operating expenses, research and development, salaries and wages. It is also available for immediate download and adjustment. So, changes can be made in the color, design, graphics or any other component to create a unique layout.
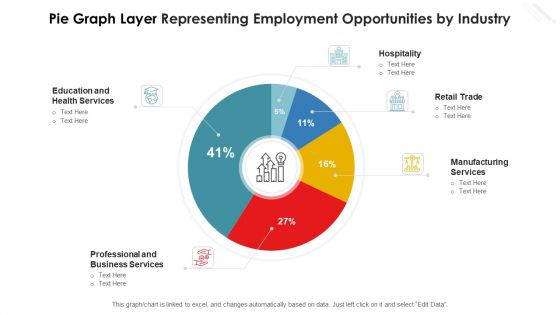
Pie Graph Layer Representing Employment Opportunities By Industry Ideas PDF
Showcasing this set of slides titled pie graph layer representing employment opportunities by industry ideas pdf. The topics addressed in these templates are hospitality, retail trade, manufacturing services, education and health services, professional and business services. All the content presented in this PPT design is completely editable. Download it and make adjustments in color, background, font etc. as per your unique business setting.
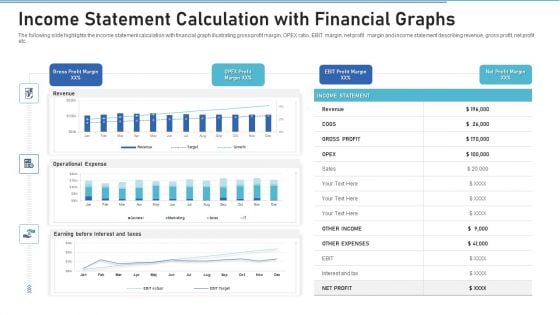
Income Statement Calculation With Financial Graphs Pictures PDF
Showcasing this set of slides titled income statement calculation with financial graphs pictures pdf. The topics addressed in these templates are revenue, gross profit, expenses. All the content presented in this PPT design is completely editable. Download it and make adjustments in color, background, font etc. as per your unique business setting.
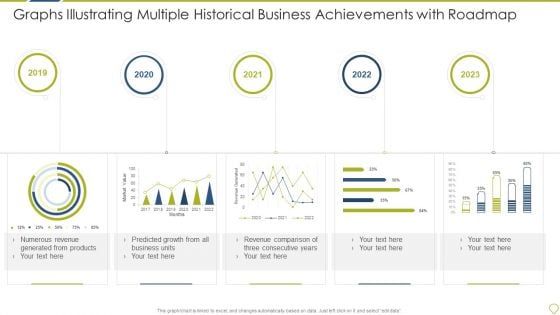
Graphs Illustrating Multiple Historical Business Achievements With Roadmap Themes PDF
Showcasing this set of slides titled graphs illustrating multiple historical business achievements with roadmap themes pdf. The topics addressed in these templates are revenue, business, growth. All the content presented in this PPT design is completely editable. Download it and make adjustments in color, background, font etc. as per your unique business setting.
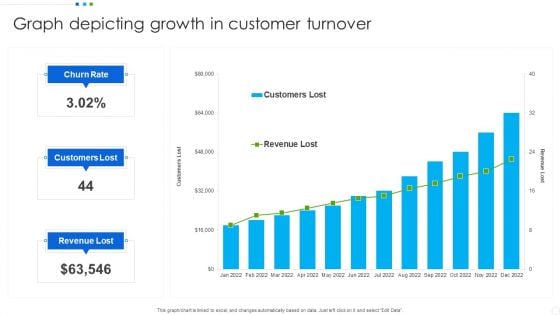
Graph Depicting Growth In Customer Turnover Infographics PDF
Showcasing this set of slides titled Graph Depicting Growth In Customer Turnover Infographics PDF. The topics addressed in these templates are Revenue Lost, Customers Lost, Churn Rate. All the content presented in this PPT design is completely editable. Download it and make adjustments in color, background, font etc. as per your unique business setting.

Line Graph Showing Growth In Customer Conversion Rate Inspiration PDF
Pitch your topic with ease and precision using this Line Graph Showing Growth In Customer Conversion Rate Inspiration PDF. This layout presents information on Monthly Average, Customer Conversion Rate, Previous Average. It is also available for immediate download and adjustment. So, changes can be made in the color, design, graphics or any other component to create a unique layout.
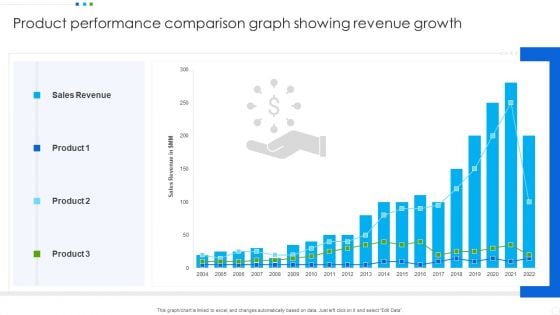
Product Performance Comparison Graph Showing Revenue Growth Portrait PDF
Showcasing this set of slides titled Product Performance Comparison Graph Showing Revenue Growth Portrait PDF. The topics addressed in these templates are Sales Revenue, Product. All the content presented in this PPT design is completely editable. Download it and make adjustments in color, background, font etc. as per your unique business setting.
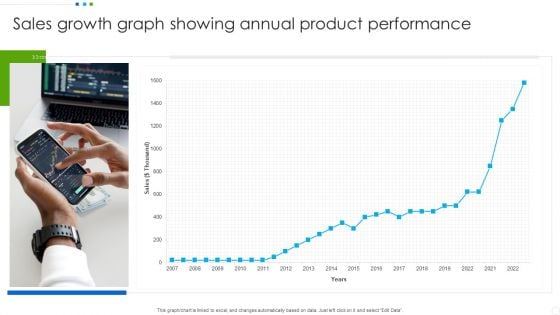
Sales Growth Graph Showing Annual Product Performance Slides PDF
Pitch your topic with ease and precision using this Sales Growth Graph Showing Annual Product Performance Slides PDF. This layout presents information on Sales Growth, Product Performance. It is also available for immediate download and adjustment. So, changes can be made in the color, design, graphics or any other component to create a unique layout.
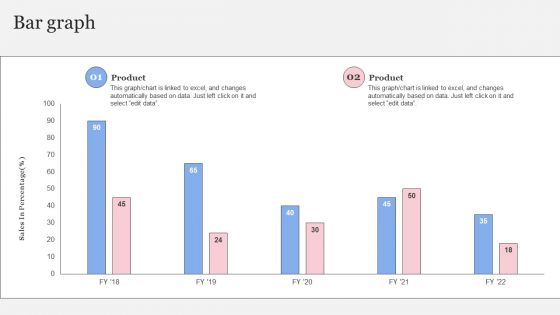
Complete Brand Promotion Playbook Bar Graph Structure PDF
Deliver an awe inspiring pitch with this creative Complete Brand Promotion Playbook Bar Graph Structure PDF bundle. Topics like Product, Automatically, Excel Changes can be discussed with this completely editable template. It is available for immediate download depending on the needs and requirements of the user.
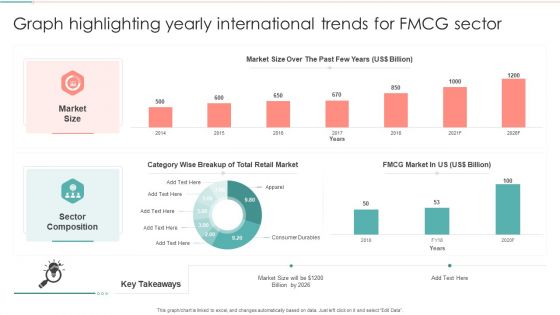
Graph Highlighting Yearly International Trends For FMCG Sector Information PDF
Pitch your topic with ease and precision using this Graph Highlighting Yearly International Trends For FMCG Sector Information PDF. This layout presents information on Sector Composition, Wise Breakup, Retail Market. It is also available for immediate download and adjustment. So, changes can be made in the color, design, graphics or any other component to create a unique layout.
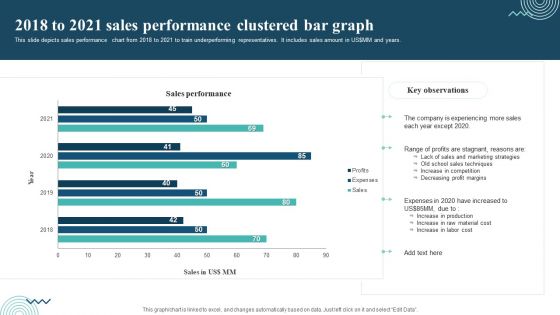
2018 To 2021 Sales Performance Clustered Bar Graph Graphics PDF
Showcasing this set of slides titled 2018 To 2021 Sales Performance Clustered Bar Graph Graphics PDF. The topics addressed in these templates are Range Of Profits, Increase In Production, Profits Are Stagnant. All the content presented in this PPT design is completely editable. Download it and make adjustments in color, background, font etc. as per your unique business setting.
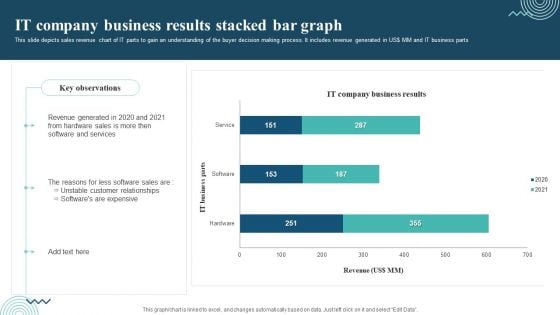
IT Company Business Results Stacked Bar Graph Topics PDF
Showcasing this set of slides titled IT Company Business Results Stacked Bar Graph Topics PDF. The topics addressed in these templates are Revenue Generated, Software And Services, Unstable Customer Relationships. All the content presented in this PPT design is completely editable. Download it and make adjustments in color, background, font etc. As per your unique business setting.
Profits And Discounts On Products Clustered Bar Graph Icons PDF
Showcasing this set of slides titled Profits And Discounts On Products Clustered Bar Graph Icons PDF. The topics addressed in these templates are Profits And Discounts, Less Discounts, Market Penetration. All the content presented in this PPT design is completely editable. Download it and make adjustments in color, background, font etc. as per your unique business setting.
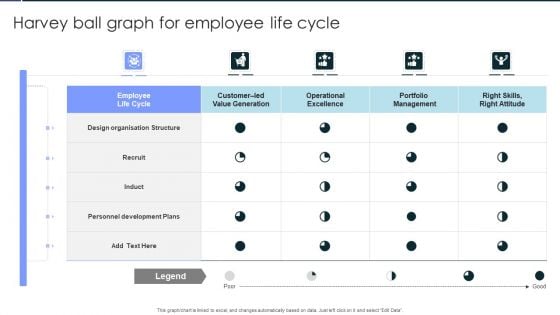
Harvey Ball Graph For Employee Life Cycle Pictures PDF
Pitch your topic with ease and precision using this Harvey Ball Graph For Employee Life Cycle Pictures PDF. This layout presents information on Employee Life Cycle, Design Organisation Structure, Personnel Development Plans . It is also available for immediate download and adjustment. So, changes can be made in the color, design, graphics or any other component to create a unique layout.
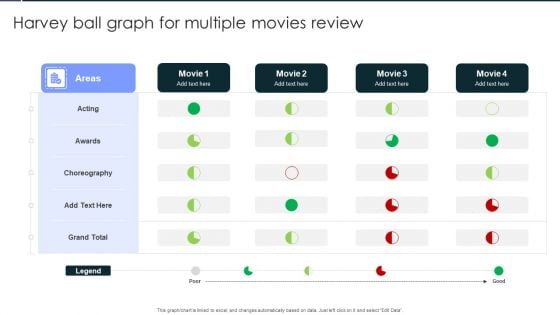
Harvey Ball Graph For Multiple Movies Review Template PDF
Showcasing this set of slides titled Harvey Ball Graph For Multiple Movies Review Template PDF. The topics addressed in these templates are Acting, Awards, Choreography. All the content presented in this PPT design is completely editable. Download it and make adjustments in color, background, font etc. as per your unique business setting.
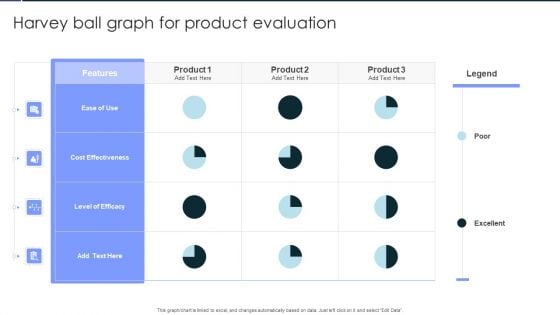
Harvey Ball Graph For Product Evaluation Microsoft PDF
Showcasing this set of slides titled Harvey Ball Graph For Product Evaluation Microsoft PDF. The topics addressed in these templates are Ease Of Use, Cost Effectiveness, Level Of Efficacy. All the content presented in this PPT design is completely editable. Download it and make adjustments in color, background, font etc. as per your unique business setting.
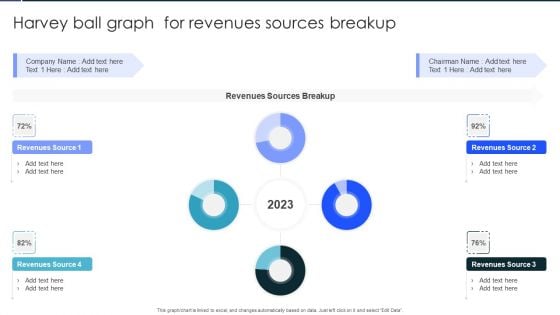
Harvey Ball Graph For Revenues Sources Breakup Infographics PDF
Showcasing this set of slides titled Harvey Ball Graph For Revenues Sources Breakup Infographics PDF. The topics addressed in these templates are Revenues Sources Breakup, Revenues, Sources Breakup. All the content presented in this PPT design is completely editable. Download it and make adjustments in color, background, font etc. as per your unique business setting.
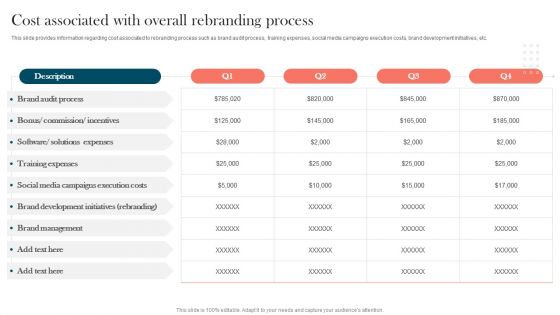
Strengthening Brand Cost Associated With Overall Rebranding Process Rules PDF
This slide provides information regarding cost associated to rebranding process such as brand audit process, training expenses, social media campaigns execution costs, brand development initiatives, etc. Do you have to make sure that everyone on your team knows about any specific topic I yes, then you should give Strengthening Brand Cost Associated With Overall Rebranding Process Rules PDF a try. Our experts have put a lot of knowledge and effort into creating this impeccable Strengthening Brand Cost Associated With Overall Rebranding Process Rules PDF. You can use this template for your upcoming presentations, as the slides are perfect to represent even the tiniest detail. You can download these templates from the Slidegeeks website and these are easy to edit. So grab these today.


 Continue with Email

 Home
Home


