Corporate Finance
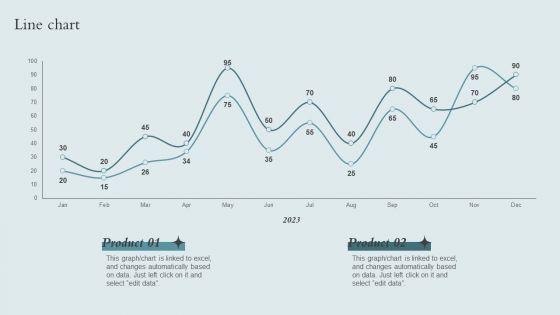
Brand Awareness Strategy Line Chart Ppt PowerPoint Presentation Gallery Show PDF
Present like a pro with Brand Awareness Strategy Line Chart Ppt PowerPoint Presentation Gallery Show PDF Create beautiful presentations together with your team, using our easy-to-use presentation slides. Share your ideas in real-time and make changes on the fly by downloading our templates. So whether youre in the office, on the go, or in a remote location, you can stay in sync with your team and present your ideas with confidence. With Slidegeeks presentation got a whole lot easier. Grab these presentations today.
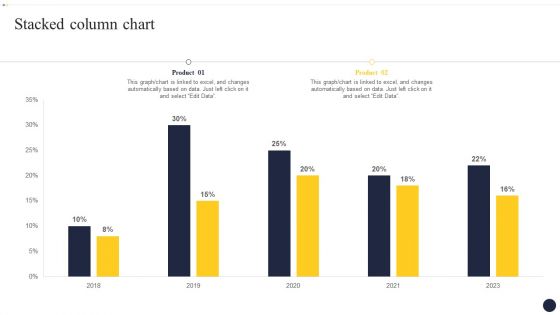
Integrating Naas Service Model To Enhance Stacked Column Chart Infographics PDF
Find highly impressive Integrating Naas Service Model To Enhance Stacked Column Chart Infographics PDF on Slidegeeks to deliver a meaningful presentation. You can save an ample amount of time using these presentation templates. No need to worry to prepare everything from scratch because Slidegeeks experts have already done a huge research and work for you. You need to download Integrating Naas Service Model To Enhance Stacked Column Chart Infographics PDF for your upcoming presentation. All the presentation templates are 100 percent editable and you can change the color and personalize the content accordingly. Download now.
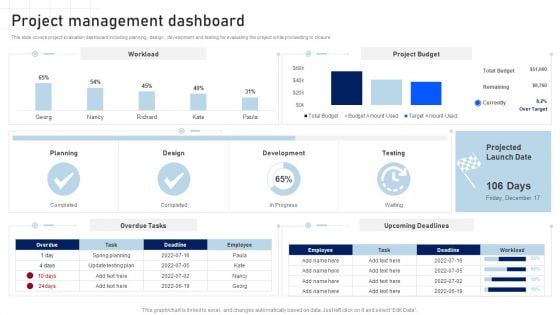
Software Development Playbook Project Management Dashboard Ideas PDF
This slide covers project evaluation dashboard including planning, design , development and testing for evaluating the project while proceeding to closure. Presenting this PowerPoint presentation, titled Software Development Playbook Project Management Dashboard Ideas PDF, with topics curated by our researchers after extensive research. This editable presentation is available for immediate download and provides attractive features when used. Download now and captivate your audience. Presenting this Software Development Playbook Project Management Dashboard Ideas PDF. Our researchers have carefully researched and created these slides with all aspects taken into consideration. This is a completely customizable Software Development Playbook Project Management Dashboard Ideas PDF that is available for immediate downloading. Download now and make an impact on your audience. Highlight the attractive features available with our PPTs.
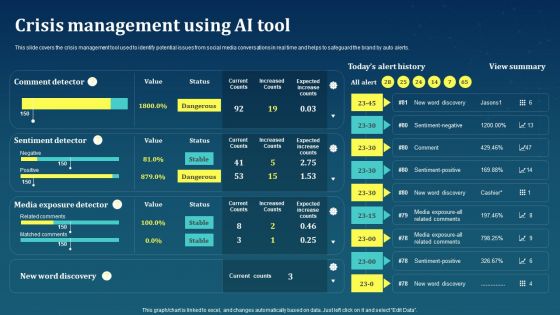
Crisis Management Using AI Tool AI For Brand Administration Clipart PDF
This slide covers the crisis management tool used to identify potential issues from social media conversations in real time and helps to safeguard the brand by auto alerts.Do you have to make sure that everyone on your team knows about any specific topic I yes, then you should give Crisis Management Using AI Tool AI For Brand Administration Clipart PDF a try. Our experts have put a lot of knowledge and effort into creating this impeccable Crisis Management Using AI Tool AI For Brand Administration Clipart PDF. You can use this template for your upcoming presentations, as the slides are perfect to represent even the tiniest detail. You can download these templates from the Slidegeeks website and these are easy to edit. So grab these today.
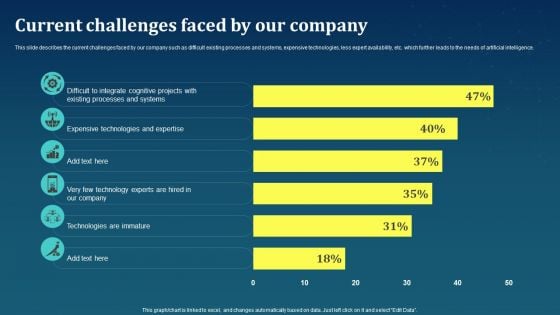
Current Challenges Faced By Our Company AI For Brand Administration Sample PDF
This slide describes the current challenges faced by our company such as difficult existing processes and systems, expensive technologies, less expert availability, etc. which further leads to the needs of artificial intelligence.Get a simple yet stunning designed Current Challenges Faced By Our Company AI For Brand Administration Sample PDF. It is the best one to establish the tone in your meetings. It is an excellent way to make your presentations highly effective. So, download this PPT today from Slidegeeks and see the positive impacts. Our easy-to-edit Current Challenges Faced By Our Company AI For Brand Administration Sample PDF can be your go-to option for all upcoming conferences and meetings. So, what are you waiting for Grab this template today.
Digital Media Tracking Dashboard AI For Brand Administration Template PDF
This slide covers the digital marketing dashboard along with the lead breakdown, google analytics traffic, and social media channels.From laying roadmaps to briefing everything in detail, our templates are perfect for you. You can set the stage with your presentation slides. All you have to do is download these easy-to-edit and customizable templates. Digital Media Tracking Dashboard AI For Brand Administration Template PDF will help you deliver an outstanding performance that everyone would remember and praise you for. Do download this presentation today.

Current Issues Faced By Creating Branding Techniques To Increase Brand Awareness Summary PDF
This slide covers the current issues faced by company such as rise in bounce rate low conversion rate due to low-quality content, slow loading time, ad heavy images, lack of sufficient information, poor website performance, etc.There are so many reasons you need a Current Issues Faced By Creating Branding Techniques To Increase Brand Awareness Summary PDF. The first reason is you can notspend time making everything from scratch, Thus, Slidegeeks has made presentation templates for you too. You can easily download these templates from our website easily.

Dashboard Depicting Website Data Insights Creating Branding Techniques To Increase Brand Awareness Structure PDF
This slide shows the dashboard that depicts website data insights which covers channels such as display, social and email with total sessions, pages, average session duration, bounce rate, goal completion.Do you have to make sure that everyone on your team knows about any specific topic I yes, then you should give Dashboard Depicting Website Data Insights Creating Branding Techniques To Increase Brand Awareness Structure PDF a try. Our experts have put a lot of knowledge and effort into creating this impeccable Dashboard Depicting Website Data Insights Creating Branding Techniques To Increase Brand Awareness Structure PDF. You can use this template for your upcoming presentations, as the slides are perfect to represent even the tiniest detail. You can download these templates from the Slidegeeks website and these are easy to edit. So grab these today.

Impact Of Branding Strategies On Sales And Creating Branding Techniques To Increase Brand Awareness Summary PDF
This slide shows the impact of branding strategies on sales and customer base due to increase in customer loyalty, positive brand perception among customers, multiple networks to reach customers, etc.From laying roadmaps to briefing everything in detail, our templates are perfect for you. You can set the stage with your presentation slides. All you have to do is download these easy-to-edit and customizable templates. Impact Of Branding Strategies On Sales And Creating Branding Techniques To Increase Brand Awareness Summary PDF will help you deliver an outstanding performance that everyone would remember and praise you for. Do download this presentation today.
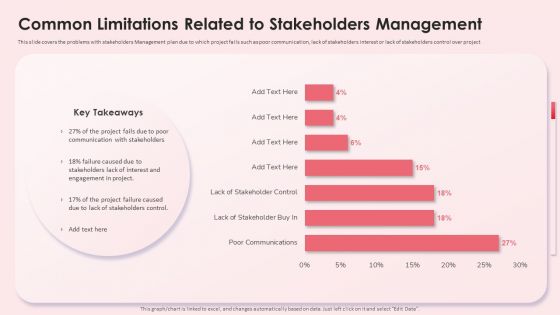
Common Limitations Related To Stakeholders Management Structure PDF
This slide covers the problems with stakeholders Management plan due to which project fails such as poor communication, lack of stakeholders interest or lack of stakeholders control over project, Do you have an important presentation coming up Are you looking for something that will make your presentation stand out from the rest Look no further than Common Limitations Related To Stakeholders Management Structure PDF. With our professional designs, you can trust that your presentation will pop and make delivering it a smooth process. And with Slidegeeks, you can trust that your presentation will be unique and memorable. So why wait Grab Common Limitations Related To Stakeholders Management Structure PDF today and make your presentation stand out from the rest.
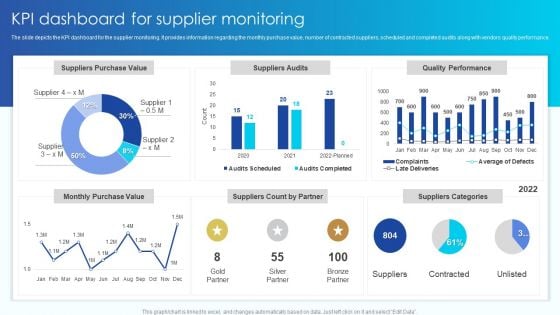
KPI Dashboard For Supplier Monitoring Vendor Management Program For Supplier Growth And Development Background PDF
The slide depicts the KPI dashboard for the supplier monitoring. It provides information regarding the monthly purchase value, number of contracted suppliers, scheduled and completed audits along with vendors quality performance.Do you have to make sure that everyone on your team knows about any specific topic I yes, then you should give KPI Dashboard For Supplier Monitoring Vendor Management Program For Supplier Growth And Development Background PDF a try. Our experts have put a lot of knowledge and effort into creating this impeccable KPI Dashboard For Supplier Monitoring Vendor Management Program For Supplier Growth And Development Background PDF. You can use this template for your upcoming presentations, as the slides are perfect to represent even the tiniest detail. You can download these templates from the Slidegeeks website and these are easy to edit. So grab these today.
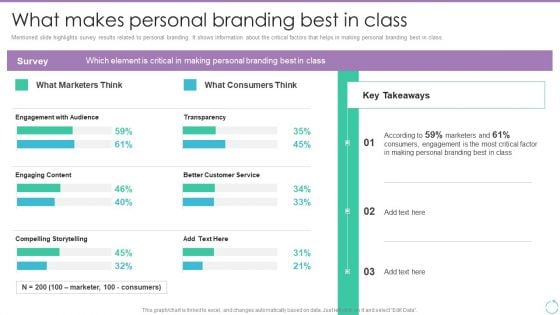
Personal Branding Plan For Executives What Makes Personal Branding Best In Class Introduction PDF
Mentioned slide highlights survey results related to personal branding. It shows information about the critical factors that helps in making personal branding best in class. Are you in need of a template that can accommodate all of your creative concepts This one is crafted professionally and can be altered to fit any style. Use it with Google Slides or PowerPoint. Include striking photographs, symbols, depictions, and other visuals. Fill, move around, or remove text boxes as desired. Test out color palettes and font mixtures. Edit and save your work, or work with colleagues. Download Personal Branding Plan For Executives What Makes Personal Branding Best In Class Introduction PDF and observe how to make your presentation outstanding. Give an impeccable presentation to your group and make your presentation unforgettable.

Video Promotion Techniques Customer Conversion Rate From Social Media Platforms Inspiration PDF
The following slide outlines customer conversion rate derived from different social media channels. The key channels highlighted in the slide are Facebook, Instagram, YouTube, Twitter and Snapchat. Present like a pro with Video Promotion Techniques Customer Conversion Rate From Social Media Platforms Inspiration PDF Create beautiful presentations together with your team, using our easy-to-use presentation slides. Share your ideas in real-time and make changes on the fly by downloading our templates. So whether youre in the office, on the go, or in a remote location, you can stay in sync with your team and present your ideas with confidence. With Slidegeeks presentation got a whole lot easier. Grab these presentations today.
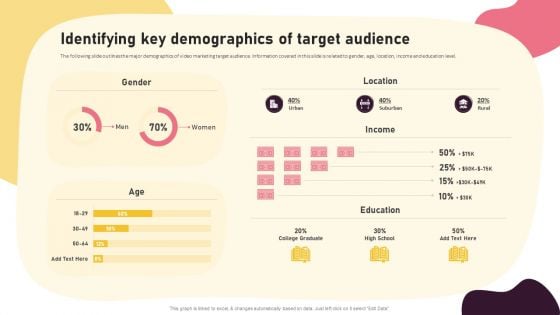
Video Promotion Techniques Identifying Key Demographics Of Target Audience Ideas PDF
The following slide outlines the major demographics of video marketing target audience. Information covered in this slide is related to gender, age, location, income and education level. This modern and well-arranged Video Promotion Techniques Identifying Key Demographics Of Target Audience Ideas PDF provides lots of creative possibilities. It is very simple to customize and edit with the Powerpoint Software. Just drag and drop your pictures into the shapes. All facets of this template can be edited with Powerpoint, no extra software is necessary. Add your own material, put your images in the places assigned for them, adjust the colors, and then you can show your slides to the world, with an animated slide included.
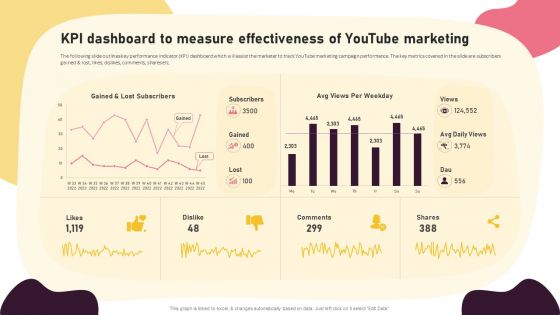
Video Promotion Techniques KPI Dashboard To Measure Effectiveness Of Youtube Pictures PDF
The following slide outlines key performance indicator KPI dashboard which will assist the marketer to track YouTube marketing campaign performance. The key metrics covered in the slide are subscribers gained and lost, likes, dislikes, comments, shares etc. Explore a selection of the finest Video Promotion Techniques KPI Dashboard To Measure Effectiveness Of Youtube Pictures PDF here. With a plethora of professionally designed and pre-made slide templates, you can quickly and easily find the right one for your upcoming presentation. You can use our Video Promotion Techniques KPI Dashboard To Measure Effectiveness Of Youtube Pictures PDF to effectively convey your message to a wider audience. Slidegeeks has done a lot of research before preparing these presentation templates. The content can be personalized and the slides are highly editable. Grab templates today from Slidegeeks.
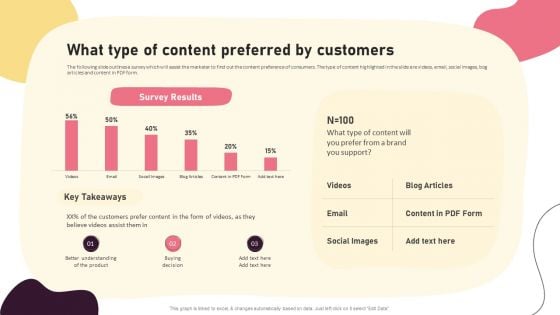
Video Promotion Techniques What Type Of Content Preferred By Customers Introduction PDF
The following slide outlines a survey which will assist the marketer to find out the content preference of consumers. The type of content highlighted in the slide are videos, email, social images, bog articles and content in PDF form. From laying roadmaps to briefing everything in detail, our templates are perfect for you. You can set the stage with your presentation slides. All you have to do is download these easy-to-edit and customizable templates. Video Promotion Techniques What Type Of Content Preferred By Customers Introduction PDF will help you deliver an outstanding performance that everyone would remember and praise you for. Do download this presentation today.
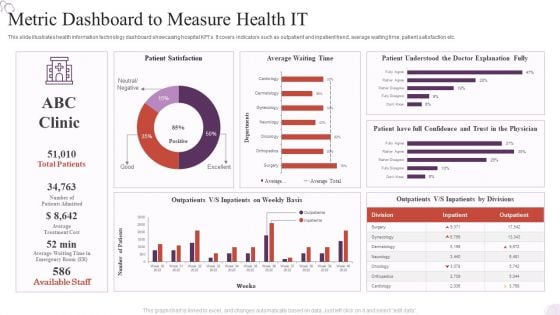
Metric Dashboard To Measure Health IT Background PDF
Pitch your topic with ease and precision using this Metric Dashboard To Measure Health IT Background PDF. This layout presents information on Metric Dashboard, Patient Satisfaction, Average Waiting Time. It is also available for immediate download and adjustment. So, changes can be made in the color, design, graphics or any other component to create a unique layout.
Dashboard For Tracking Organizational OGSM Model Metrics Microsoft PDF
Pitch your topic with ease and precision using this Dashboard For Tracking Organizational OGSM Model Metrics Microsoft PDF. This layout presents information on Revenue, Market Share, Gross Margin. It is also available for immediate download and adjustment. So, changes can be made in the color, design, graphics or any other component to create a unique layout.
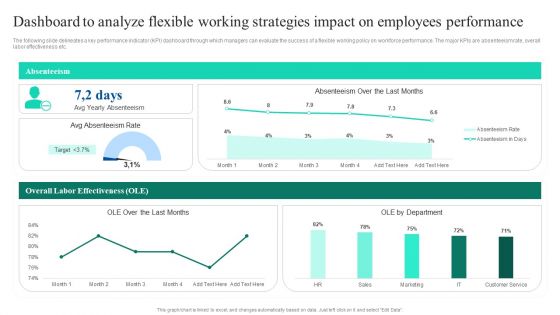
Adopting Flexible Work Policy Dashboard To Analyze Flexible Working Strategies Impact Template PDF
The following slide delineates a key performance indicator KPI dashboard through which managers can evaluate the success of a flexible working policy on workforce performance. The major KPIs are absenteeism rate, overall labor effectiveness etc. Do you have to make sure that everyone on your team knows about any specific topic I yes, then you should give Adopting Flexible Work Policy Dashboard To Analyze Flexible Working Strategies Impact Template PDF a try. Our experts have put a lot of knowledge and effort into creating this impeccable Adopting Flexible Work Policy Dashboard To Analyze Flexible Working Strategies Impact Template PDF. You can use this template for your upcoming presentations, as the slides are perfect to represent even the tiniest detail. You can download these templates from the Slidegeeks website and these are easy to edit. So grab these today.
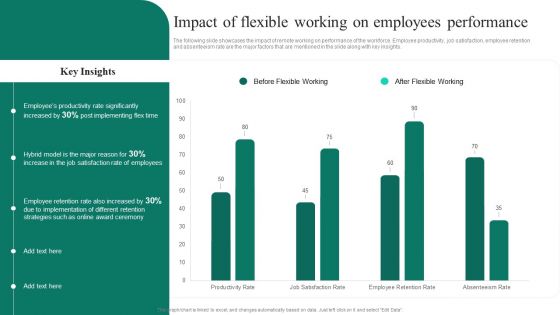
Adopting Flexible Work Policy Impact Of Flexible Working On Employees Performance Ideas PDF
The following slide showcases the impact of remote working on performance of the workforce. Employee productivity, job satisfaction, employee retention and absenteeism rate are the major factors that are mentioned in the slide along with key insights. Coming up with a presentation necessitates that the majority of the effort goes into the content and the message you intend to convey. The visuals of a PowerPoint presentation can only be effective if it supplements and supports the story that is being told. Keeping this in mind our experts created Adopting Flexible Work Policy Impact Of Flexible Working On Employees Performance Ideas PDF to reduce the time that goes into designing the presentation. This way, you can concentrate on the message while our designers take care of providing you with the right template for the situation.
Adopting Flexible Work Policy Statistics Showing Continuously Rise In Flexible Icons PDF
The following slide outlines a diagrammatic representation outlining the percentage of companies switching to flexible work arrangements. It includes details of the last 5 years along with key observations. Presenting this PowerPoint presentation, titled Adopting Flexible Work Policy Statistics Showing Continuously Rise In Flexible Icons PDF, with topics curated by our researchers after extensive research. This editable presentation is available for immediate download and provides attractive features when used. Download now and captivate your audience. Presenting this Adopting Flexible Work Policy Statistics Showing Continuously Rise In Flexible Icons PDF. Our researchers have carefully researched and created these slides with all aspects taken into consideration. This is a completely customizable Adopting Flexible Work Policy Statistics Showing Continuously Rise In Flexible Icons PDF that is available for immediate downloading. Download now and make an impact on your audience. Highlight the attractive features available with our PPTs.
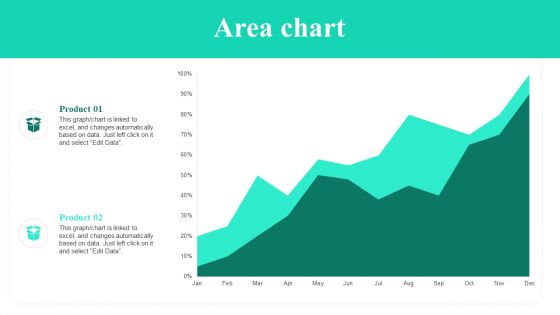
Adopting Flexible Work Policy Area Chart Ppt PowerPoint Presentation File Slideshow PDF
Do you have to make sure that everyone on your team knows about any specific topic I yes, then you should give Adopting Flexible Work Policy Area Chart Ppt PowerPoint Presentation File Slideshow PDF a try. Our experts have put a lot of knowledge and effort into creating this impeccable Adopting Flexible Work Policy Area Chart Ppt PowerPoint Presentation File Slideshow PDF. You can use this template for your upcoming presentations, as the slides are perfect to represent even the tiniest detail. You can download these templates from the Slidegeeks website and these are easy to edit. So grab these today.
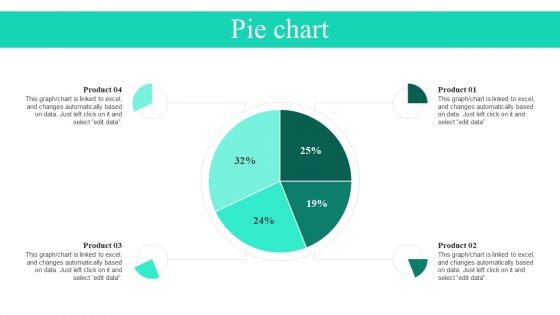
Adopting Flexible Work Policy Pie Chart Ppt PowerPoint Presentation File Layouts PDF
Do you have an important presentation coming up Are you looking for something that will make your presentation stand out from the rest Look no further than Adopting Flexible Work Policy Pie Chart Ppt PowerPoint Presentation File Layouts PDF. With our professional designs, you can trust that your presentation will pop and make delivering it a smooth process. And with Slidegeeks, you can trust that your presentation will be unique and memorable. So why wait Grab Adopting Flexible Work Policy Pie Chart Ppt PowerPoint Presentation File Layouts PDF today and make your presentation stand out from the rest.
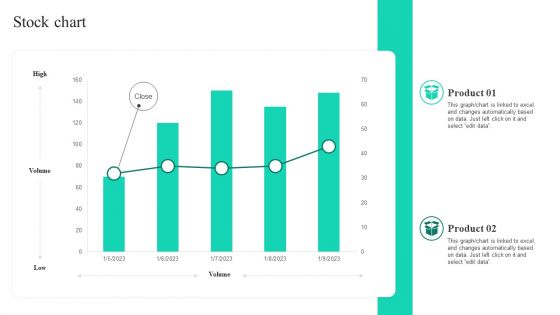
Adopting Flexible Work Policy Stock Chart Ppt PowerPoint Presentation File Influencers PDF
If your project calls for a presentation, then Slidegeeks is your go-to partner because we have professionally designed, easy-to-edit templates that are perfect for any presentation. After downloading, you can easily edit Adopting Flexible Work Policy Stock Chart Ppt PowerPoint Presentation File Influencers PDF and make the changes accordingly. You can rearrange slides or fill them with different images. Check out all the handy templates
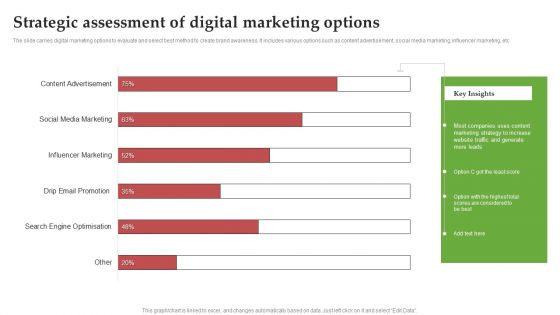
Strategic Assessment Of Digital Marketing Options Ppt PowerPoint Presentation File Show PDF
The slide carries digital marketing options to evaluate and select best method to create brand awareness. It includes various options such as content advertisement, social media marketing, influencer marketing, etc. Pitch your topic with ease and precision using this Strategic Assessment Of Digital Marketing Options Ppt PowerPoint Presentation File Show PDF. This layout presents information on Influencer Marketing, Social Media Marketing, Content Advertisement. It is also available for immediate download and adjustment. So, changes can be made in the color, design, graphics or any other component to create a unique layout.
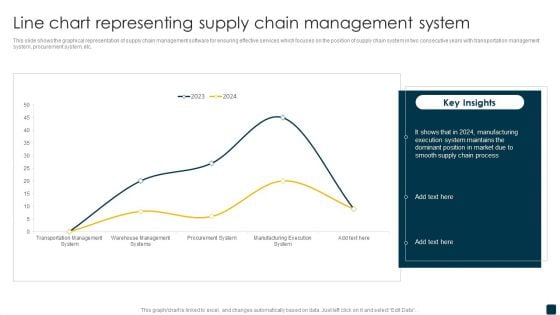
Line Chart Representing Supply Chain Management System Rules PDF
This slide shows the graphical representation of supply chain management software for ensuring effective services which focuses on the position of supply chain system in two consecutive years with transportation management system, procurement system, etc. Pitch your topic with ease and precision using this Line Chart Representing Supply Chain Management System Rules PDF. This layout presents information on Supply Chain Process, Manufacturing, Execution System. It is also available for immediate download and adjustment. So, changes can be made in the color, design, graphics or any other component to create a unique layout.
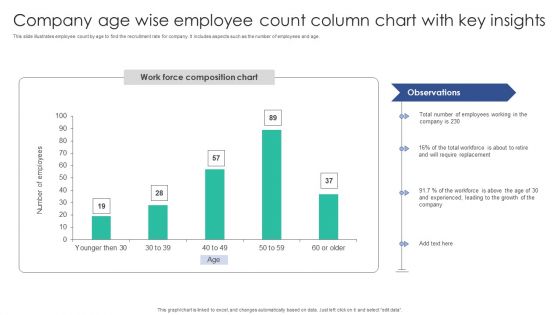
Company Age Wise Employee Count Column Chart With Key Insights Microsoft PDF
This slide illustrates employee count by age to find the recruitment rate for company. It includes aspects such as the number of employees and age.Pitch your topic with ease and precision using this Company Age Wise Employee Count Column Chart With Key Insights Microsoft PDF. This layout presents information on Employees Working, Total Workforce, Require Replacement. It is also available for immediate download and adjustment. So, changes can be made in the color, design, graphics or any other component to create a unique layout.
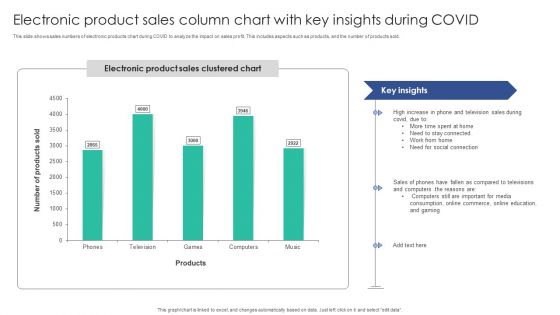
Electronic Product Sales Column Chart With Key Insights During COVID Microsoft PDF
This slide shows sales numbers of electronic products chart during COVID to analyze the impact on sales profit. This includes aspects such as products, and the number of products sold. Pitch your topic with ease and precision using this Electronic Product Sales Column Chart With Key Insights During COVID Microsoft PDF. This layout presents information on Stay Connected, Social Connection, Compared Televisions. It is also available for immediate download and adjustment. So, changes can be made in the color, design, graphics or any other component to create a unique layout.
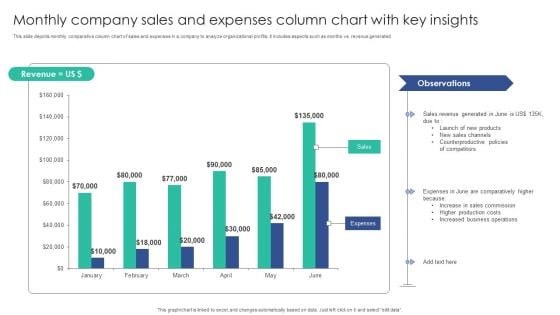
Monthly Company Sales And Expenses Column Chart With Key Insights Mockup PDF
This slide depicts monthly comparative column chart of sales and expenses in a company to analyze organizational profits. It includes aspects such as months vs. revenue generatedPitch your topic with ease and precision using this Monthly Company Sales And Expenses Column Chart With Key Insights Mockup PDF. This layout presents information on Sales Channels, Counterproductive Policies, Sales Commission. It is also available for immediate download and adjustment. So, changes can be made in the color, design, graphics or any other component to create a unique layout.
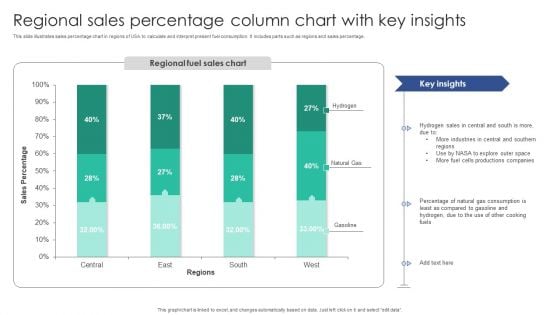
Regional Sales Percentage Column Chart With Key Insights Diagrams PDF
This slide illustrates sales percentage chart in regions of USA to calculate and interpret present fuel consumption. It includes parts such as regions and sales percentage.Pitch your topic with ease and precision using this Regional Sales Percentage Column Chart With Key Insights Diagrams PDF. This layout presents information on Industries Central, Sales Central, Productions Companies. It is also available for immediate download and adjustment. So, changes can be made in the color, design, graphics or any other component to create a unique layout.
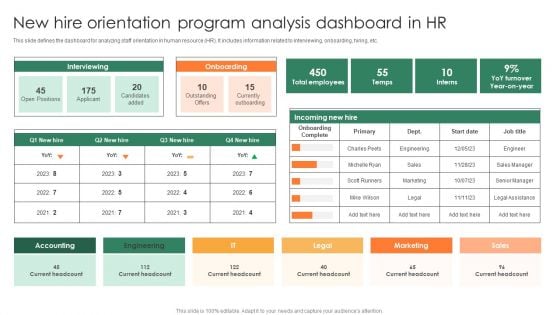
New Hire Orientation Program Analysis Dashboard In HR Clipart PDF
Pitch your topic with ease and precision using this New Hire Orientation Program Analysis Dashboard In HR Clipart PDF. This layout presents information on Currently Outboarding, Current Headcount, Onboarding Complete. It is also available for immediate download and adjustment. So, changes can be made in the color, design, graphics or any other component to create a unique layout.
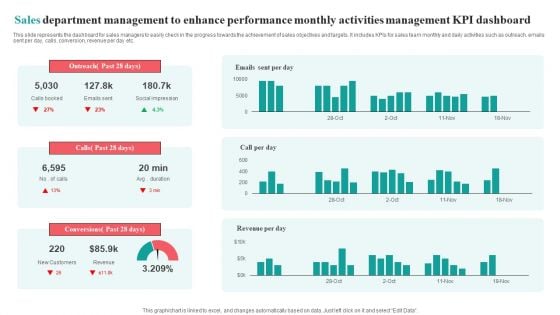
Sales Department Management To Enhance Performance Monthly Activities Management KPI Dashboard Brochure PDF
This slide represents the dashboard for sales managers to easily check in the progress towards the achievement of sales objectives and targets. It includes KPIs for sales team monthly and daily activities such as outreach, emails sent per day, calls, conversion, revenue per day etc.Pitch your topic with ease and precision using this Sales Department Management To Enhance Performance Monthly Activities Management KPI Dashboard Brochure PDF. This layout presents information on Social Impression, Conversions Past, Outreach Past. It is also available for immediate download and adjustment. So, changes can be made in the color, design, graphics or any other component to create a unique layout.
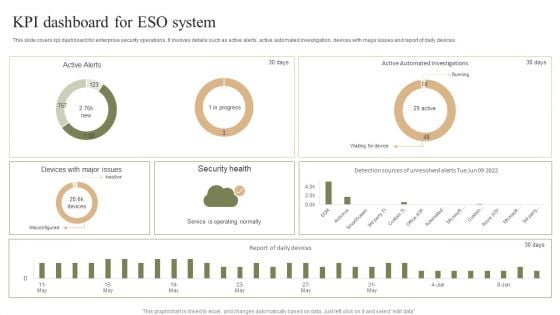
KPI Dashboard For ESO System Ppt PowerPoint Presentation File Template PDF
This slide covers kpi dashboard for enterprise security operations. It involves details such as active alerts, active automated investigation, devices with major issues and report of daily devices. Pitch your topic with ease and precision using this KPI Dashboard For ESO System Ppt PowerPoint Presentation File Template PDF. This layout presents information on Security Health, Misconfigured, Service Operating Normally. It is also available for immediate download and adjustment. So, changes can be made in the color, design, graphics or any other component to create a unique layout.
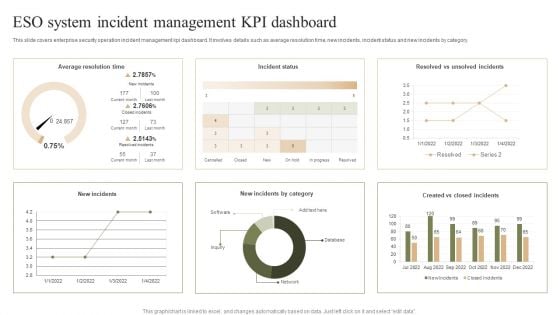
ESO System Incident Management KPI Dashboard Ppt PowerPoint Presentation File Graphic Images PDF
This slide covers enterprise security operation incident management kpi dashboard. It involves details such as average resolution time, new incidents, incident status and new incidents by category. Pitch your topic with ease and precision using this ESO System Incident Management KPI Dashboard Ppt PowerPoint Presentation File Graphic Images PDF. This layout presents information on Average Resolution Time, Incident Status, New Incidents. It is also available for immediate download and adjustment. So, changes can be made in the color, design, graphics or any other component to create a unique layout.
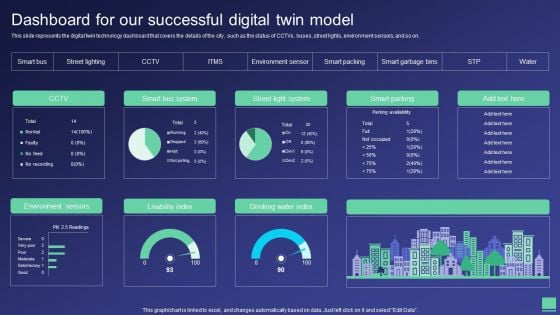
Digital Twin Tech IT Dashboard For Our Successful Digital Twin Model Microsoft PDF
This slide represents the digital twin technology dashboard that covers the details of the city, such as the status of CCTVs, buses, street lights, environment sensors, and so on. Do you have an important presentation coming up Are you looking for something that will make your presentation stand out from the rest Look no further than Digital Twin Tech IT Dashboard For Our Successful Digital Twin Model Microsoft PDF. With our professional designs, you can trust that your presentation will pop and make delivering it a smooth process. And with Slidegeeks, you can trust that your presentation will be unique and memorable. So why wait Grab Digital Twin Tech IT Dashboard For Our Successful Digital Twin Model Microsoft PDF today and make your presentation stand out from the rest.
Employees Attrition Tracking Statistics And Resignation Rate Report By Industry Background PDF
This slide covers dashboard for industry wise employees turnover rates. It further includes statistics on resignation rare of workers, average turnover rates for different industries. Pitch your topic with ease and precision using this Employees Attrition Tracking Statistics And Resignation Rate Report By Industry Background PDF. This layout presents information on Employees, Industry, Average Turnover Rate. It is also available for immediate download and adjustment. So, changes can be made in the color, design, graphics or any other component to create a unique layout.
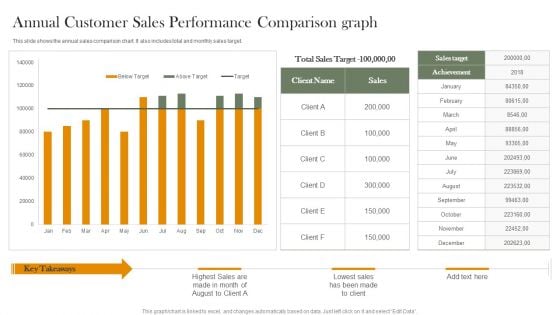
Annual Customer Sales Performance Comparison Graph Portrait PDF
This slide shows the annual sales comparison chart. It also includes total and monthly sales target. Pitch your topic with ease and precision using this Annual Customer Sales Performance Comparison Graph Portrait PDF. This layout presents information on Total Sales Target, Sales Target, Achievement. It is also available for immediate download and adjustment. So, changes can be made in the color, design, graphics or any other component to create a unique layout.

KPI Dashboard Of Customer And Product Sales Performance Comparison Information PDF
This slide shows the KPI dashboard of client and product sales comparison. It also includes sales by location and total sales. Pitch your topic with ease and precision using this KPI Dashboard Of Customer And Product Sales Performance Comparison Information PDF. This layout presents information on Product Sales, Client Sales, Tim Santana. It is also available for immediate download and adjustment. So, changes can be made in the color, design, graphics or any other component to create a unique layout.
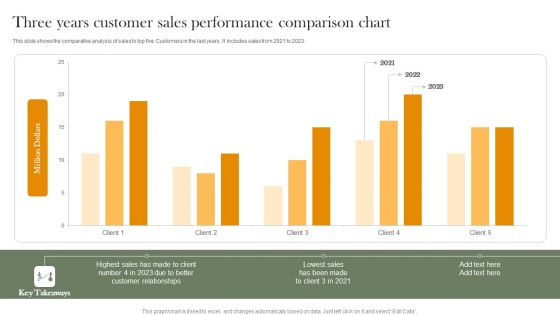
Three Years Customer Sales Performance Comparison Chart Professional PDF
This slide shows the comparative analysis of sales to top five Customers in the last years. It includes sales from 2021 to 2023. Pitch your topic with ease and precision using this Three Years Customer Sales Performance Comparison Chart Professional PDF. This layout presents information on Highest Sales, Customer Relationships, Lowest Sales. It is also available for immediate download and adjustment. So, changes can be made in the color, design, graphics or any other component to create a unique layout.
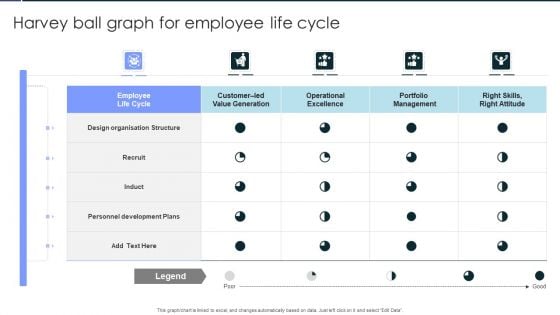
Harvey Ball Graph For Employee Life Cycle Pictures PDF
Pitch your topic with ease and precision using this Harvey Ball Graph For Employee Life Cycle Pictures PDF. This layout presents information on Employee Life Cycle, Design Organisation Structure, Personnel Development Plans . It is also available for immediate download and adjustment. So, changes can be made in the color, design, graphics or any other component to create a unique layout.
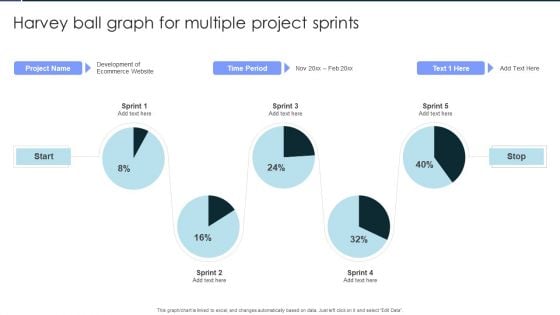
Harvey Ball Graph For Multiple Project Sprints Background PDF
Pitch your topic with ease and precision using this Harvey Ball Graph For Multiple Project Sprints Background PDF. This layout presents information on Harvey Ball Graph, For Multiple, Project Sprints. It is also available for immediate download and adjustment. So, changes can be made in the color, design, graphics or any other component to create a unique layout.
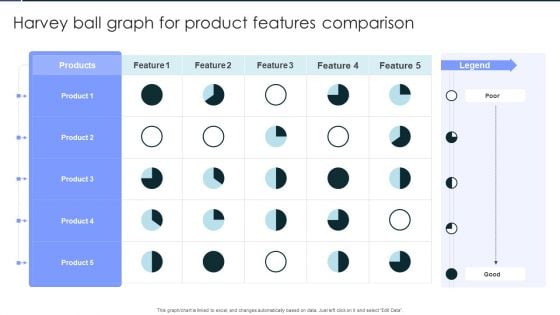
Harvey Ball Graph For Product Features Comparison Rules PDF
Pitch your topic with ease and precision using this Harvey Ball Graph For Product Features Comparison Rules PDF. This layout presents information onHarvey Ball Graph, For Product, Features Comparison. It is also available for immediate download and adjustment. So, changes can be made in the color, design, graphics or any other component to create a unique layout.
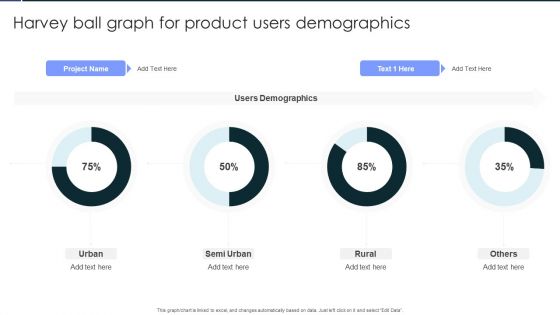
Harvey Ball Graph For Product Users Demographics Portrait PDF
Pitch your topic with ease and precision using this Harvey Ball Graph For Product Users Demographics Portrait PDF. This layout presents information on Harvey Ball Graph, For Product, Users Demographics. It is also available for immediate download and adjustment. So, changes can be made in the color, design, graphics or any other component to create a unique layout.
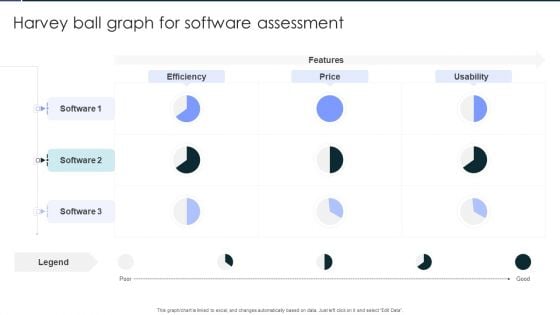
Harvey Ball Graph For Software Assessment Clipart PDF
Pitch your topic with ease and precision using this Harvey Ball Graph For Software Assessment Clipart PDF. This layout presents information on Harvey Ball Graph, For Software, Assessment. It is also available for immediate download and adjustment. So, changes can be made in the color, design, graphics or any other component to create a unique layout.
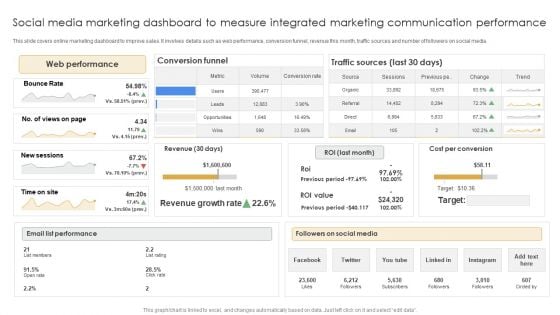
Social Media Marketing Dashboard To Measure Integrated Marketing Communication Performance Clipart PDF
This slide covers online marketing dashboard to improve sales. It involves details such as web performance, conversion funnel, revenue this month, traffic sources and number of followers on social media. Pitch your topic with ease and precision using this Social Media Marketing Dashboard To Measure Integrated Marketing Communication Performance Clipart PDF. This layout presents information on Web Performance, Email List Performance, Followers Social Media. It is also available for immediate download and adjustment. So, changes can be made in the color, design, graphics or any other component to create a unique layout.
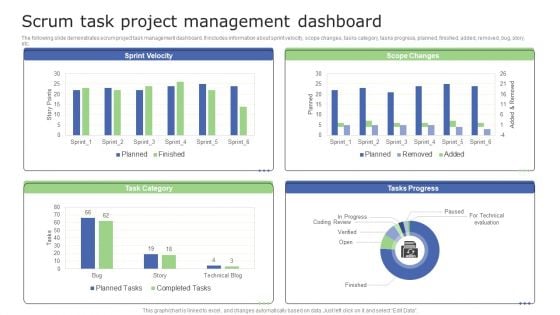
Scrum Task Project Management Dashboard Information PDF
The following slide demonstrates scrum project task management dashboard. It includes information about sprint velocity, scope changes, tasks category, tasks progress, planned, finished, added, removed, bug, story, etc. Pitch your topic with ease and precision using this Scrum Task Project Management Dashboard Information PDF. This layout presents information on Scrum Task Project, Management Dashboard. It is also available for immediate download and adjustment. So, changes can be made in the color, design, graphics or any other component to create a unique layout.
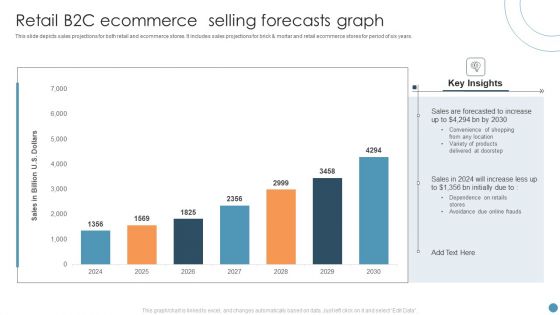
Retail B2C Ecommerce Selling Forecasts Graph Portrait PDF
This slide depicts sales projections for both retail and ecommerce stores. It includes sales projections for brick and mortar and retail ecommerce stores for period of six years. Pitch your topic with ease and precision using this Retail B2C Ecommerce Selling Forecasts Graph Portrait PDF. This layout presents information on Retail B2C Ecommerce, Selling Forecasts Graph. It is also available for immediate download and adjustment. So, changes can be made in the color, design, graphics or any other component to create a unique layout.
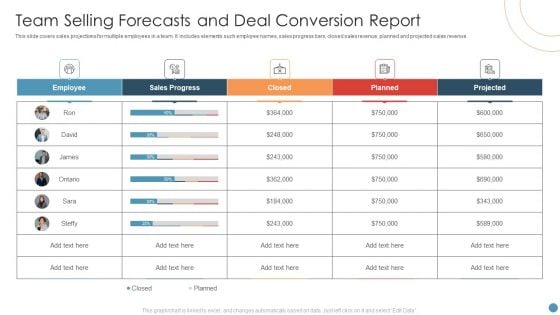
Team Selling Forecasts And Deal Conversion Report Themes PDF
This slide covers sales projections for multiple employees in a team. It includes elements such employee names, sales progress bars, closed sales revenue, planned and projected sales revenue. Pitch your topic with ease and precision using this Team Selling Forecasts And Deal Conversion Report Themes PDF. This layout presents information on Sales Progress, Employee, Team Selling Forecasts. It is also available for immediate download and adjustment. So, changes can be made in the color, design, graphics or any other component to create a unique layout.
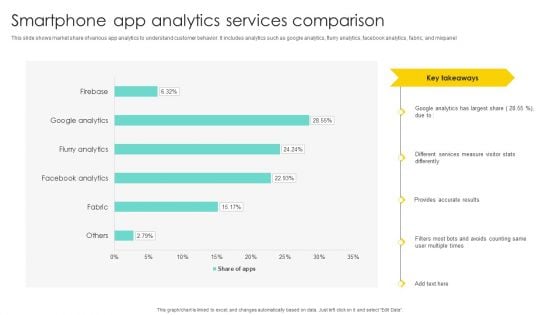
Smartphone App Analytics Services Comparison Brochure PDF
This slide shows market share of various app analytics to understand customer behavior. It includes analytics such as google analytics, flurry analytics, facebook analytics, fabric, and mixpanel. Pitch your topic with ease and precision using this Smartphone App Analytics Services Comparison Brochure PDF. This layout presents information on Different Services Measure, Visitor Stats Differently, Provides Accurate Results. It is also available for immediate download and adjustment. So, changes can be made in the color, design, graphics or any other component to create a unique layout.
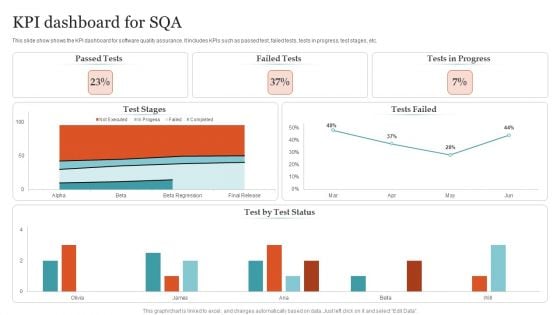
KPI Dashboard For SQA Ppt PowerPoint Presentation Gallery Structure PDF
This slide show shows the KPI dashboard for software quality assurance. It includes KPIs such as passed test, failed tests, tests in progress, test stages, etc. Pitch your topic with ease and precision using this KPI Dashboard For SQA Ppt PowerPoint Presentation Gallery Structure PDF. This layout presents information on Passed Tests, Failed Tests, Tests Progress . It is also available for immediate download and adjustment. So, changes can be made in the color, design, graphics or any other component to create a unique layout.
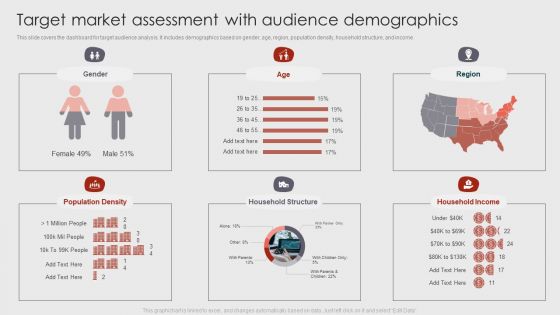
Target Market Assessment With Audience Demographics Inspiration PDF
This slide covers the dashboard for target audience analysis. It includes demographics based on gender, age, region, population density, household structure, and income. Pitch your topic with ease and precision using this Target Market Assessment With Audience Demographics Inspiration PDF. This layout presents information on Target Market Assessment, Audience Demographics . It is also available for immediate download and adjustment. So, changes can be made in the color, design, graphics or any other component to create a unique layout.
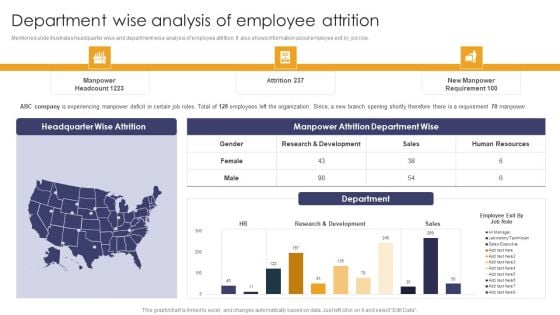
Implementing Succession Planning Department Wise Analysis Of Employee Attrition Inspiration PDF
Mentioned slide illustrates headquarter wise and department wise analysis of employee attrition. It also shows information about employee exit by job role. From laying roadmaps to briefing everything in detail, our templates are perfect for you. You can set the stage with your presentation slides. All you have to do is download these easy-to-edit and customizable templates. Implementing Succession Planning Department Wise Analysis Of Employee Attrition Inspiration PDF will help you deliver an outstanding performance that everyone would remember and praise you for. Do download this presentation today.
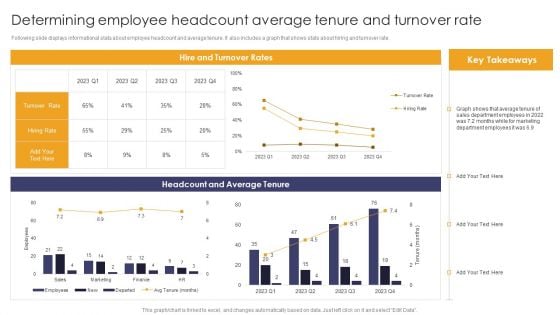
Implementing Succession Planning Determining Employee Headcount Average Tenure Template PDF
Following slide displays informational stats about employee headcount and average tenure. It also includes a graph that shows stats about hiring and turnover rate. Present like a pro with Implementing Succession Planning Determining Employee Headcount Average Tenure Template PDF Create beautiful presentations together with your team, using our easy-to-use presentation slides. Share your ideas in real-time and make changes on the fly by downloading our templates. So whether youre in the office, on the go, or in a remote location, you can stay in sync with your team and present your ideas with confidence. With Slidegeeks presentation got a whole lot easier. Grab these presentations today.

Implementing Succession Planning HR Performance Management Dashboard Microsoft PDF
This graph or chart is linked to excel, and changes automatically based on data. Just left click on it and select Edit Data. Find highly impressive Implementing Succession Planning HR Performance Management Dashboard Microsoft PDF on Slidegeeks to deliver a meaningful presentation. You can save an ample amount of time using these presentation templates. No need to worry to prepare everything from scratch because Slidegeeks experts have already done a huge research and work for you. You need to download Implementing Succession Planning HR Performance Management Dashboard Microsoft PDF for your upcoming presentation. All the presentation templates are 100 percent editable and you can change the color and personalize the content accordingly. Download now.
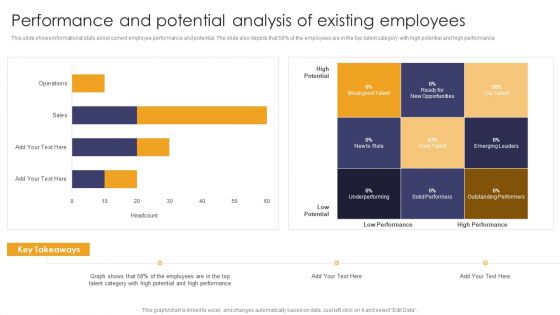
Implementing Succession Planning Performance And Potential Analysis Of Existing Infographics PDF
This slide shows informational stats about current employee performance and potential. The slide also depicts that 58 percent of the employees are in the top talent category with high potential and high performance. Crafting an eye-catching presentation has never been more straightforward. Let your presentation shine with this tasteful yet straightforward Implementing Succession Planning Performance And Potential Analysis Of Existing Infographics PDF template. It offers a minimalistic and classy look that is great for making a statement. The colors have been employed intelligently to add a bit of playfulness while still remaining professional. Construct the ideal Implementing Succession Planning Performance And Potential Analysis Of Existing Infographics PDF that effortlessly grabs the attention of your audience Begin now and be certain to wow your customers.
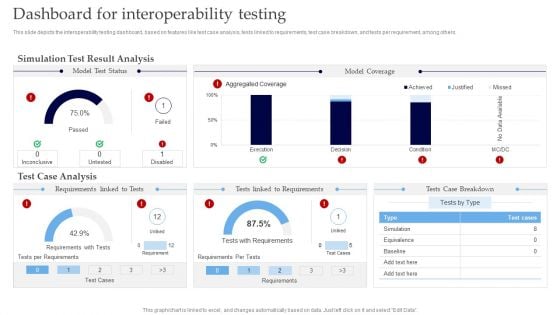
Interoperability Software Testing Dashboard For Interoperability Testing Information PDF
This slide depicts the interoperability testing dashboard, based on features like test case analysis, tests linked to requirements, test case breakdown, and tests per requirement, among others. Do you have an important presentation coming up Are you looking for something that will make your presentation stand out from the rest Look no further than Interoperability Software Testing Dashboard For Interoperability Testing Information PDF. With our professional designs, you can trust that your presentation will pop and make delivering it a smooth process. And with Slidegeeks, you can trust that your presentation will be unique and memorable. So why wait Grab Interoperability Software Testing Dashboard For Interoperability Testing Information PDF today and make your presentation stand out from the rest.
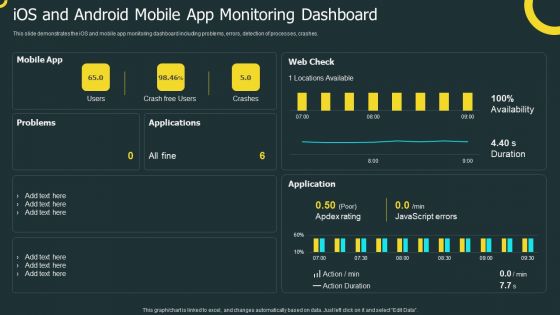
IOS Application Development Ios And Android Mobile App Monitoring Dashboard Pictures PDF
This slide demonstrates the iOS and mobile app monitoring dashboard including problems, errors, detection of processes, crashes. Crafting an eye catching presentation has never been more straightforward. Let your presentation shine with this tasteful yet straightforward IOS Application Development Ios And Android Mobile App Monitoring Dashboard Pictures PDF template. It offers a minimalistic and classy look that is great for making a statement. The colors have been employed intelligently to add a bit of playfulness while still remaining professional. Construct the ideal IOS Application Development Ios And Android Mobile App Monitoring Dashboard Pictures PDF that effortlessly grabs the attention of your audience Begin now and be certain to wow your customers.
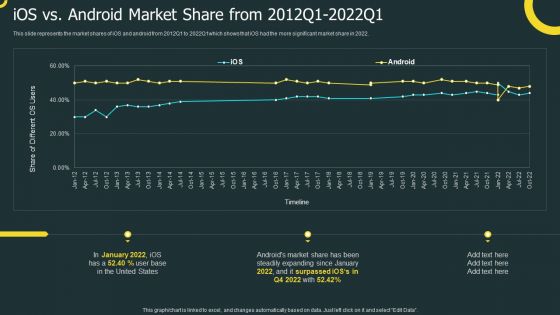
IOS Application Development Ios Vs Android Market Share From 2012Q1 2022Q1 Clipart PDF
This slide represents the market shares of iOS and android from 2012Q1 to 2022Q1which shows that iOS had the more significant market share in 2022. Formulating a presentation can take up a lot of effort and time, so the content and message should always be the primary focus. The visuals of the PowerPoint can enhance the presenters message, so our IOS Application Development Ios Vs Android Market Share From 2012Q1 2022Q1 Clipart PDF was created to help save time. Instead of worrying about the design, the presenter can concentrate on the message while our designers work on creating the ideal templates for whatever situation is needed. Slidegeeks has experts for everything from amazing designs to valuable content, we have put everything into IOS Application Development Ios Vs Android Market Share From 2012Q1 2022Q1 Clipart PDF.
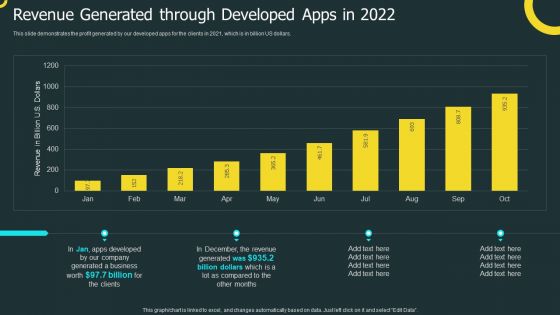
IOS Application Development Revenue Generated Through Developed Apps In 2022 Diagrams PDF
This slide demonstrates the profit generated by our developed apps for the clients in 2021, which is in billion US dollars. Slidegeeks has constructed IOS Application Development Revenue Generated Through Developed Apps In 2022 Diagrams PDF after conducting extensive research and examination. These presentation templates are constantly being generated and modified based on user preferences and critiques from editors. Here, you will find the most attractive templates for a range of purposes while taking into account ratings and remarks from users regarding the content. This is an excellent jumping off point to explore our content and will give new users an insight into our top notch PowerPoint Templates.
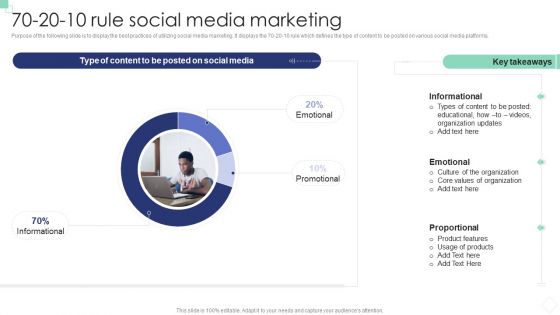
Implementing B2B And B2C Marketing 70 20 10 Rule Social Media Marketing Brochure PDF
Purpose of the following slide is to display the best practices of utilizing social media marketing. It displays the 70-20-10 rule which defines the type of content to be posted on various social media platforms. Crafting an eye-catching presentation has never been more straightforward. Let your presentation shine with this tasteful yet straightforward Implementing B2B And B2C Marketing 70 20 10 Rule Social Media Marketing Brochure PDF template. It offers a minimalistic and classy look that is great for making a statement. The colors have been employed intelligently to add a bit of playfulness while still remaining professional. Construct the ideal Implementing B2B And B2C Marketing 70 20 10 Rule Social Media Marketing Brochure PDF that effortlessly grabs the attention of your audience Begin now and be certain to wow your customers.


 Continue with Email

 Home
Home


