Corporate Finance
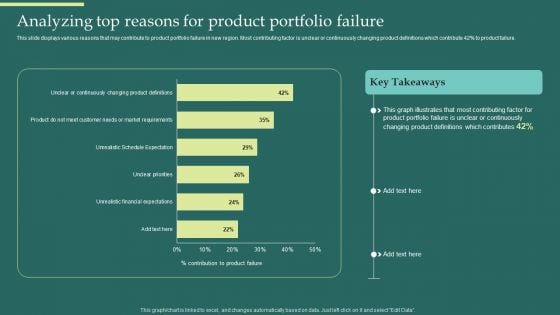
Product Portfolios And Strategic Analyzing Top Reasons For Product Portfolio Failure Summary PDF
This slide displays various reasons that may contribute to product portfolio failure in new region. Most contributing factor is unclear or continuously changing product definitions which contribute 42 percent to product failure. Want to ace your presentation in front of a live audience Our Product Portfolios And Strategic Analyzing Top Reasons For Product Portfolio Failure Summary PDF can help you do that by engaging all the users towards you.. Slidegeeks experts have put their efforts and expertise into creating these impeccable powerpoint presentations so that you can communicate your ideas clearly. Moreover, all the templates are customizable, and easy-to-edit and downloadable. Use these for both personal and commercial use.

Product Portfolios And Strategic Major Challenges Faced In Improving Product Portfolio Ideas PDF
This modern and well-arranged Product Portfolios And Strategic Major Challenges Faced In Improving Product Portfolio Ideas PDF provides lots of creative possibilities. It is very simple to customize and edit with the Powerpoint Software. Just drag and drop your pictures into the shapes. All facets of this template can be edited with Powerpoint, no extra software is necessary. Add your own material, put your images in the places assigned for them, adjust the colors, and then you can show your slides to the world, with an animated slide included.
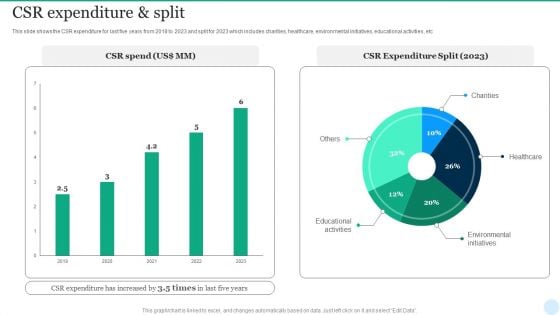
Web Interface Development Services Company Summary CSR Expenditure And Split Topics PDF
This slide shows the CSR expenditure for last five years from 2018 to 2023 and split for 2023 which includes charities, healthcare, environmental initiatives, educational activities, etc. From laying roadmaps to briefing everything in detail, our templates are perfect for you. You can set the stage with your presentation slides. All you have to do is download these easy-to-edit and customizable templates. Web Interface Development Services Company Summary CSR Expenditure And Split Topics PDF will help you deliver an outstanding performance that everyone would remember and praise you for. Do download this presentation today.
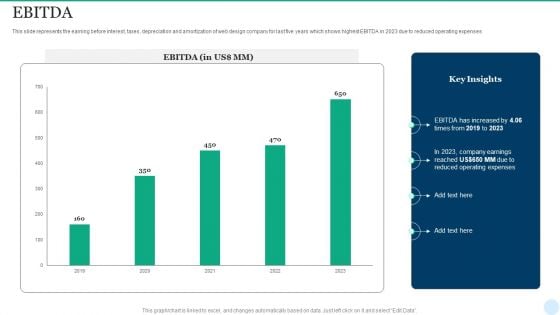
Web Interface Development Services Company Summary EBITDA Structure PDF
This slide represents the earning before interest, taxes, depreciation and amortization of web design company for last five years which shows highest EBITDA in 2023 due to reduced operating expenses. Present like a pro with Web Interface Development Services Company Summary EBITDA Structure PDF Create beautiful presentations together with your team, using our easy-to-use presentation slides. Share your ideas in real-time and make changes on the fly by downloading our templates. So whether youre in the office, on the go, or in a remote location, you can stay in sync with your team and present your ideas with confidence. With Slidegeeks presentation got a whole lot easier. Grab these presentations today.
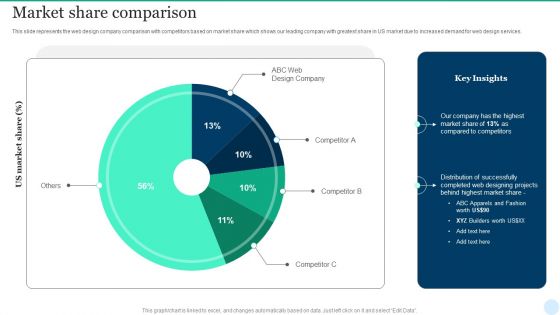
Web Interface Development Services Company Summary Market Share Comparison Slides PDF
This slide represents the web design company comparison with competitors based on market share which shows our leading company with greatest share in US market due to increased demand for web design services. Crafting an eye-catching presentation has never been more straightforward. Let your presentation shine with this tasteful yet straightforward Web Interface Development Services Company Summary Market Share Comparison Slides PDF template. It offers a minimalistic and classy look that is great for making a statement. The colors have been employed intelligently to add a bit of playfulness while still remaining professional. Construct the ideal Web Interface Development Services Company Summary Market Share Comparison Slides PDF that effortlessly grabs the attention of your audience Begin now and be certain to wow your customers.

Web Interface Development Services Company Summary Operating Profits From 2019 To 2023 Microsoft PDF
This slide covers the operating profit of web design company for last five years from 2019 to 2023 which shows changes in operating profits year after year. Formulating a presentation can take up a lot of effort and time, so the content and message should always be the primary focus. The visuals of the PowerPoint can enhance the presenters message, so our Web Interface Development Services Company Summary Operating Profits From 2019 To 2023 Microsoft PDF was created to help save time. Instead of worrying about the design, the presenter can concentrate on the message while our designers work on creating the ideal templates for whatever situation is needed. Slidegeeks has experts for everything from amazing designs to valuable content, we have put everything into Web Interface Development Services Company Summary Operating Profits From 2019 To 2023 Microsoft PDF.
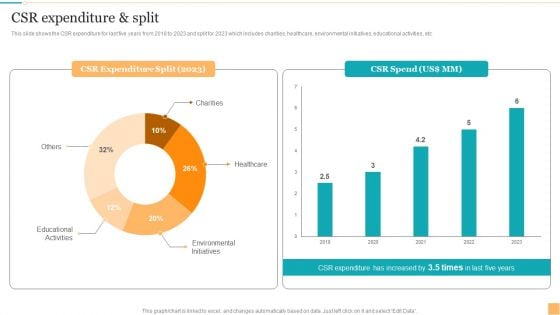
Website Design And Branding Studio Company Profile CSR Expenditure And Split Template PDF
This slide shows the CSR expenditure for last five years from 2018 to 2023 and split for 2023 which includes charities, healthcare, environmental initiatives, educational activities, etc. Get a simple yet stunning designed Website Design And Branding Studio Company Profile CSR Expenditure And Split Template PDF. It is the best one to establish the tone in your meetings. It is an excellent way to make your presentations highly effective. So, download this PPT today from Slidegeeks and see the positive impacts. Our easy-to-edit Website Design And Branding Studio Company Profile CSR Expenditure And Split Template PDF can be your go-to option for all upcoming conferences and meetings. So, what are you waiting for Grab this template today.
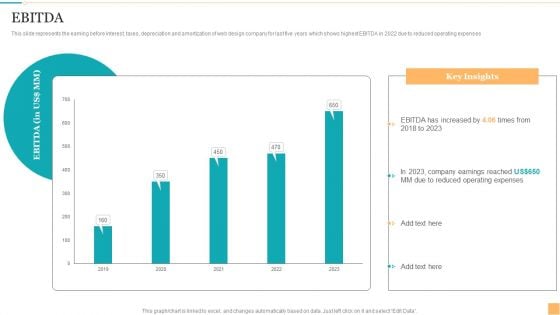
Website Design And Branding Studio Company Profile EBIDTA Microsoft PDF
This slide represents the earning before interest, taxes, depreciation and amortization of web design company for last five years which shows highest EBITDA in 2022 due to reduced operating expenses. From laying roadmaps to briefing everything in detail, our templates are perfect for you. You can set the stage with your presentation slides. All you have to do is download these easy-to-edit and customizable templates. Website Design And Branding Studio Company Profile EBIDTA Microsoft PDF will help you deliver an outstanding performance that everyone would remember and praise you for. Do download this presentation today.
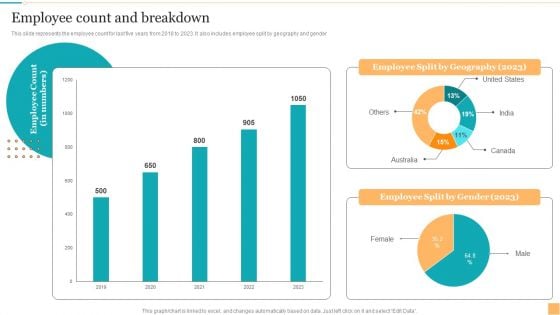
Website Design And Branding Studio Company Profile Employee Count And Breakdown Structure PDF
This slide represents the employee count for last five years from 2018 to 2023. It also includes employee split by geography and gender. Present like a pro with Website Design And Branding Studio Company Profile Employee Count And Breakdown Structure PDF Create beautiful presentations together with your team, using our easy-to-use presentation slides. Share your ideas in real-time and make changes on the fly by downloading our templates. So whether youre in the office, on the go, or in a remote location, you can stay in sync with your team and present your ideas with confidence. With Slidegeeks presentation got a whole lot easier. Grab these presentations today.
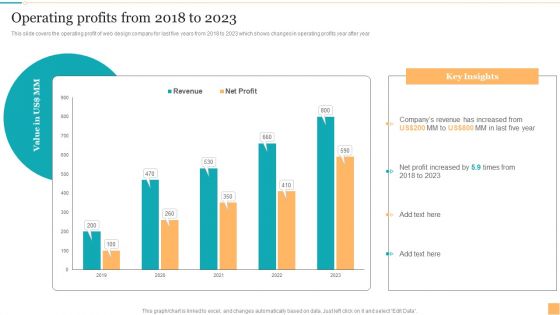
Website Design And Branding Studio Company Profile Operating Profits From 2018 To 2023 Graphics PDF
This slide covers the operating profit of web design company for last five years from 2018 to 2023 which shows changes in operating profits year after year. Formulating a presentation can take up a lot of effort and time, so the content and message should always be the primary focus. The visuals of the PowerPoint can enhance the presenters message, so our Website Design And Branding Studio Company Profile Operating Profits From 2018 To 2023 Graphics PDF was created to help save time. Instead of worrying about the design, the presenter can concentrate on the message while our designers work on creating the ideal templates for whatever situation is needed. Slidegeeks has experts for everything from amazing designs to valuable content, we have put everything into Website Design And Branding Studio Company Profile Operating Profits From 2018 To 2023 Graphics PDF.
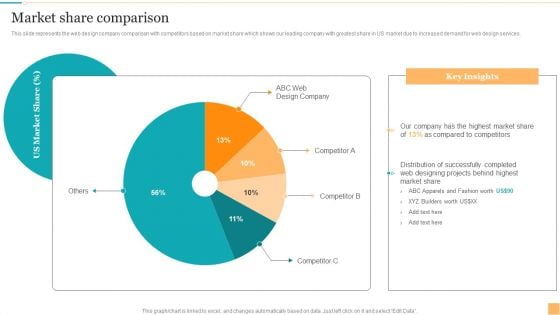
Website Design And Branding Studio Company Profile Market Share Comparison Diagrams PDF
This slide represents the web design company comparison with competitors based on market share which shows our leading company with greatest share in US market due to increased demand for web design services. Here you can discover an assortment of the finest PowerPoint and Google Slides templates. With these templates, you can create presentations for a variety of purposes while simultaneously providing your audience with an eye-catching visual experience. Download Website Design And Branding Studio Company Profile Market Share Comparison Diagrams PDF to deliver an impeccable presentation. These templates will make your job of preparing presentations much quicker, yet still, maintain a high level of quality. Slidegeeks has experienced researchers who prepare these templates and write high-quality content for you. Later on, you can personalize the content by editing the Website Design And Branding Studio Company Profile Market Share Comparison Diagrams PDF.
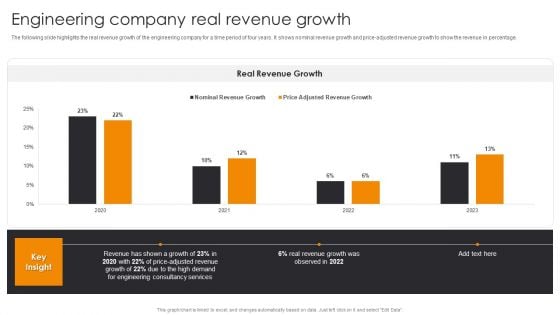
Engineering Company Real Revenue Growth Engineering Company Financial Analysis Report Structure PDF
The following slide highlights the real revenue growth of the engineering company for a time period of four years. It shows nominal revenue growth and price-adjusted revenue growth to show the revenue in percentage.Formulating a presentation can take up a lot of effort and time, so the content and message should always be the primary focus. The visuals of the PowerPoint can enhance the presenters message, so our Engineering Company Real Revenue Growth Engineering Company Financial Analysis Report Structure PDF was created to help save time. Instead of worrying about the design, the presenter can concentrate on the message while our designers work on creating the ideal templates for whatever situation is needed. Slidegeeks has experts for everything from amazing designs to valuable content, we have put everything into Engineering Company Real Revenue Growth Engineering Company Financial Analysis Report Structure PDF.
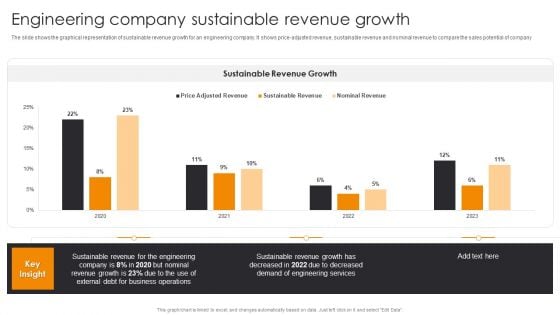
Engineering Company Sustainable Revenue Growth Engineering Company Financial Analysis Report Clipart PDF
The slide shows the graphical representation of sustainable revenue growth for an engineering company. It shows price-adjusted revenue, sustainable revenue and nominal revenue to compare the sales potential of company. Coming up with a presentation necessitates that the majority of the effort goes into the content and the message you intend to convey. The visuals of a PowerPoint presentation can only be effective if it supplements and supports the story that is being told. Keeping this in mind our experts created Engineering Company Sustainable Revenue Growth Engineering Company Financial Analysis Report Clipart PDF to reduce the time that goes into designing the presentation. This way, you can concentrate on the message while our designers take care of providing you with the right template for the situation.

Engineering Products And Services Demand Forecast Engineering Company Financial Analysis Report Template PDF
The following slide highlights the yearly demand and forecast of products and services provided by the engineering company. It shows the percentage revenue change from last year and the forecast for next year. This modern and well-arranged Engineering Products And Services Demand Forecast Engineering Company Financial Analysis Report Template PDF provides lots of creative possibilities. It is very simple to customize and edit with the Powerpoint Software. Just drag and drop your pictures into the shapes. All facets of this template can be edited with Powerpoint no extra software is necessary. Add your own material, put your images in the places assigned for them, adjust the colors, and then you can show your slides to the world, with an animated slide included.
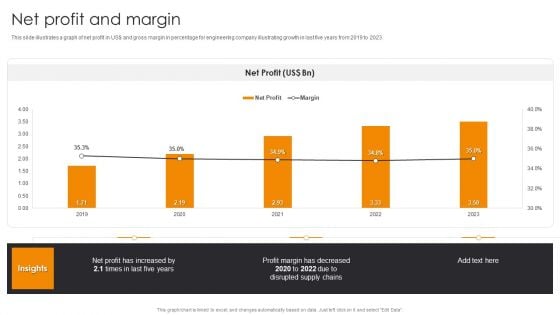
Net Profit And Margin Engineering Company Financial Analysis Report Background PDF
This slide illustrates a graph of net profit in US dollar and gross margin in percentage for engineering company illustrating growth in last five years from 2019 to 2023.Slidegeeks has constructed Net Profit And Margin Engineering Company Financial Analysis Report Background PDF after conducting extensive research and examination. These presentation templates are constantly being generated and modified based on user preferences and critiques from editors. Here, you will find the most attractive templates for a range of purposes while taking into account ratings and remarks from users regarding the content. This is an excellent jumping-off point to explore our content and will give new users an insight into our top-notch PowerPoint Templates.
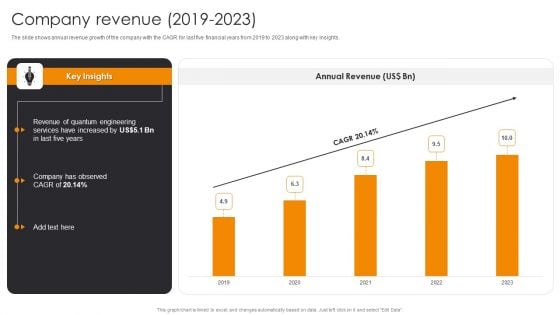
Company Revenue 2019 To 2023 Engineering Company Financial Analysis Report Structure PDF
The slide shows annual revenue growth of the company with the CAGR for last five financial years from 2019 to 2023 along with key insights.Presenting this PowerPoint presentation, titled Company Revenue 2019 To 2023 Engineering Company Financial Analysis Report Structure PDF, with topics curated by our researchers after extensive research. This editable presentation is available for immediate download and provides attractive features when used. Download now and captivate your audience. Presenting this Company Revenue 2019 To 2023 Engineering Company Financial Analysis Report Structure PDF. Our researchers have carefully researched and created these slides with all aspects taken into consideration. This is a completely customizable Company Revenue 2019 To 2023 Engineering Company Financial Analysis Report Structure PDF that is available for immediate downloading. Download now and make an impact on your audience. Highlight the attractive features available with our PPTs.

Operating Profit And Margin Engineering Company Financial Analysis Report Portrait PDF
This slide illustrates a graph of operating profit in US dollar and gross margin in percentage for engineering company illustrating key insights and changes in last five years from 2019 to 2023. Here you can discover an assortment of the finest PowerPoint and Google Slides templates. With these templates, you can create presentations for a variety of purposes while simultaneously providing your audience with an eye-catching visual experience. Download Operating Profit And Margin Engineering Company Financial Analysis Report Portrait PDF to deliver an impeccable presentation. These templates will make your job of preparing presentations much quicker, yet still, maintain a high level of quality. Slidegeeks has experienced researchers who prepare these templates and write high-quality content for you. Later on, you can personalize the content by editing the Operating Profit And Margin Engineering Company Financial Analysis Report Portrait PDF.
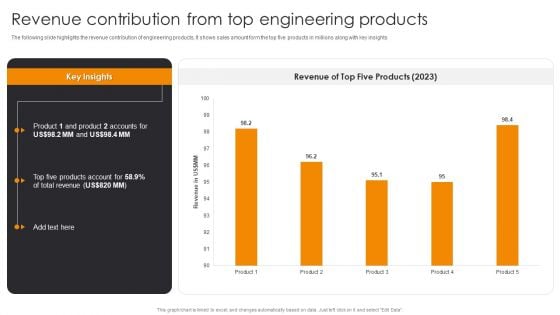
Revenue Contribution From Top Engineering Products Engineering Company Financial Analysis Report Infographics PDF
The following slide highlights the revenue contribution of engineering products, It shows sales amount form the top five products in millions along with key insights. This Revenue Contribution From Top Engineering Products Engineering Company Financial Analysis Report Infographics PDF from Slidegeeks makes it easy to present information on your topic with precision. It provides customization options, so you can make changes to the colors, design, graphics, or any other component to create a unique layout. It is also available for immediate download, so you can begin using it right away. Slidegeeks has done good research to ensure that you have everything you need to make your presentation stand out. Make a name out there for a brilliant performance.
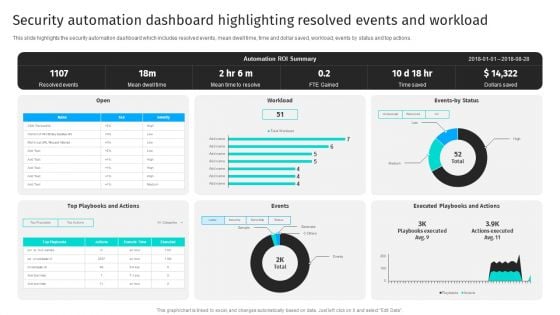
Security Automation Dashboard Highlighting Resolved Events And Workload Portrait PDF
This slide highlights the security automation dashboard which includes resolved events, mean dwell time, time and dollar saved, workload, events by status and top actions.From laying roadmaps to briefing everything in detail, our templates are perfect for you. You can set the stage with your presentation slides. All you have to do is download these easy-to-edit and customizable templates. Security Automation Dashboard Highlighting Resolved Events And Workload Portrait PDF will help you deliver an outstanding performance that everyone would remember and praise you for. Do download this presentation today.
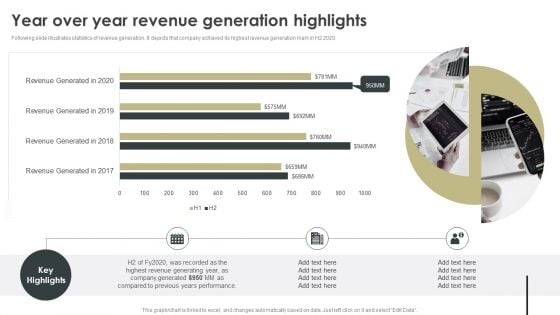
Year Over Year Revenue Generation Highlights Inspiration PDF
Following slide illustrates statistics of revenue generation. It depicts that company achieved its highest revenue generation mark in H2 2020. This Year Over Year Revenue Generation Highlights Inspiration PDF from Slidegeeks makes it easy to present information on your topic with precision. It provides customization options, so you can make changes to the colors, design, graphics, or any other component to create a unique layout. It is also available for immediate download, so you can begin using it right away. Slidegeeks has done good research to ensure that you have everything you need to make your presentation stand out. Make a name out there for a brilliant performance.
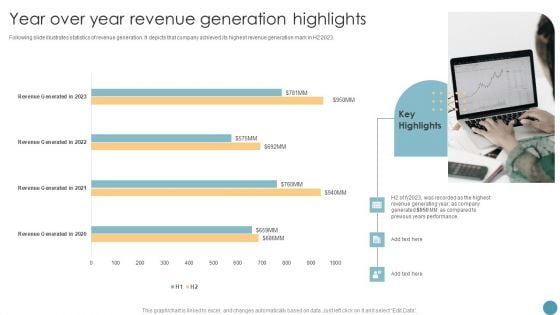
Feasibility Analysis Report For Construction Project Year Over Year Revenue Generation Highlights Portrait PDF
Following slide illustrates statistics of revenue generation. It depicts that company achieved its highest revenue generation mark in H2 2023. Presenting this PowerPoint presentation, titled Feasibility Analysis Report For Construction Project Year Over Year Revenue Generation Highlights Portrait PDF, with topics curated by our researchers after extensive research. This editable presentation is available for immediate download and provides attractive features when used. Download now and captivate your audience. Presenting this Feasibility Analysis Report For Construction Project Year Over Year Revenue Generation Highlights Portrait PDF. Our researchers have carefully researched and created these slides with all aspects taken into consideration. This is a completely customizable Feasibility Analysis Report For Construction Project Year Over Year Revenue Generation Highlights Portrait PDF that is available for immediate downloading. Download now and make an impact on your audience. Highlight the attractive features available with our PPTs.
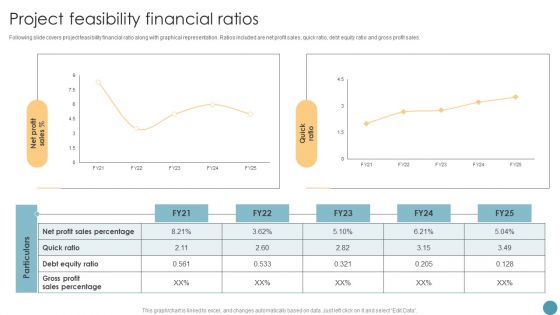
Project Feasibility Financial Ratios Feasibility Analysis Report For Construction Project Structure PDF
Following slide covers project feasibility financial ratio along with graphical representation. Ratios included are net profit sales, quick ratio, debt equity ratio and gross profit sales. Here you can discover an assortment of the finest PowerPoint and Google Slides templates. With these templates, you can create presentations for a variety of purposes while simultaneously providing your audience with an eye catching visual experience. Download Project Feasibility Financial Ratios Feasibility Analysis Report For Construction Project Structure PDF to deliver an impeccable presentation. These templates will make your job of preparing presentations much quicker, yet still, maintain a high level of quality. Slidegeeks has experienced researchers who prepare these templates and write high quality content for you. Later on, you can personalize the content by editing the Project Feasibility Financial Ratios Feasibility Analysis Report For Construction Project Structure PDF.
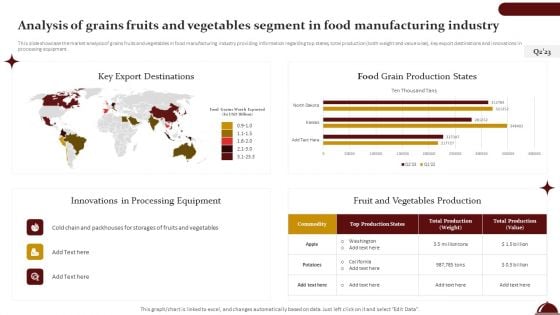
Analysis Of Grains Fruits And Vegetables Segment In Food Manufacturing Industry Infographics PDF
This slide showcase the market analysis of grains fruits and vegetables in food manufacturing industry providing information regarding top states, total production both weight and value wise, key export destinations and innovations in processing equipment. Presenting this PowerPoint presentation, titled Analysis Of Grains Fruits And Vegetables Segment In Food Manufacturing Industry Infographics PDF, with topics curated by our researchers after extensive research. This editable presentation is available for immediate download and provides attractive features when used. Download now and captivate your audience. Presenting this Analysis Of Grains Fruits And Vegetables Segment In Food Manufacturing Industry Infographics PDF. Our researchers have carefully researched and created these slides with all aspects taken into consideration. This is a completely customizable Analysis Of Grains Fruits And Vegetables Segment In Food Manufacturing Industry Infographics PDF that is available for immediate downloading. Download now and make an impact on your audience. Highlight the attractive features available with our PPTs.
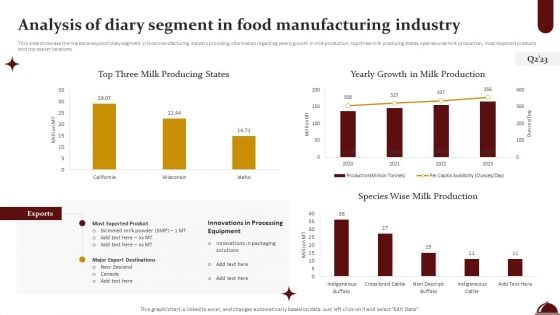
Food Processing Industry Latest Insights Trends And Analytics Analysis Of Diary Segment In Food Manufacturing Industry Mockup PDF
This slide showcase the market analysis of diary segment in food manufacturing industry providing information regarding yearly growth in milk production, top three milk producing states, species wise milk production, most exported products and top export locations. This Food Processing Industry Latest Insights Trends And Analytics Analysis Of Diary Segment In Food Manufacturing Industry Mockup PDF from Slidegeeks makes it easy to present information on your topic with precision. It provides customization options, so you can make changes to the colors, design, graphics, or any other component to create a unique layout. It is also available for immediate download, so you can begin using it right away. Slidegeeks has done good research to ensure that you have everything you need to make your presentation stand out. Make a name out there for a brilliant performance.
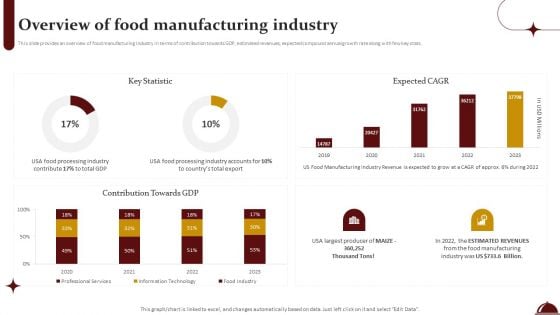
Food Processing Industry Latest Insights Trends And Analytics Overview Of Food Manufacturing Industry Download PDF
This slide provides an overview of food manufacturing industry in terms of contribution towards GDP, estimated revenues, expected compound annual growth rate along with few key stats. Do you have to make sure that everyone on your team knows about any specific topic I yes, then you should give Food Processing Industry Latest Insights Trends And Analytics Overview Of Food Manufacturing Industry Download PDF a try. Our experts have put a lot of knowledge and effort into creating this impeccable Food Processing Industry Latest Insights Trends And Analytics Overview Of Food Manufacturing Industry Download PDF. You can use this template for your upcoming presentations, as the slides are perfect to represent even the tiniest detail. You can download these templates from the Slidegeeks website and these are easy to edit. So grab these today.
Food Processing Industry Latest Insights Trends And Analytics Performance Monitoring Dashboard For Consumer Goods Icons PDF
This slide showcase the performance monitoring dashboard for consumer goods providing information regarding the overview of food and beverages sales, top selling products and on shelf availability. Get a simple yet stunning designed Food Processing Industry Latest Insights Trends And Analytics Performance Monitoring Dashboard For Consumer Goods Icons PDF. It is the best one to establish the tone in your meetings. It is an excellent way to make your presentations highly effective. So, download this PPT today from Slidegeeks and see the positive impacts. Our easy to edit Food Processing Industry Latest Insights Trends And Analytics Performance Monitoring Dashboard For Consumer Goods Icons PDF can be your go to option for all upcoming conferences and meetings. So, what are you waiting for Grab this template today.

Food Segments Contribution Towards Total Production And Global Export Topics PDF
This slide graphically provides information regarding the contribution of multiple food components such as meats, diary, grains and oil seeds, fruits and vegetables etc. towards total food production and global export. From laying roadmaps to briefing everything in detail, our templates are perfect for you. You can set the stage with your presentation slides. All you have to do is download these easy to edit and customizable templates. Food Segments Contribution Towards Total Production And Global Export Topics PDF will help you deliver an outstanding performance that everyone would remember and praise you for. Do download this presentation today.
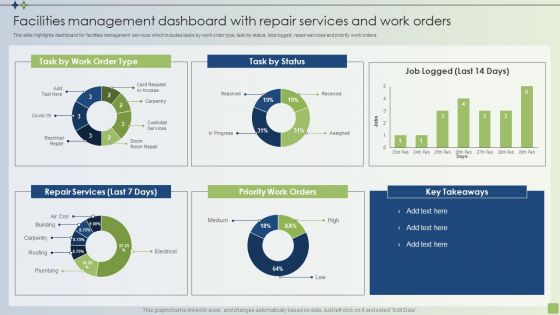
Strategic FM Services Facilities Management Dashboard With Repair Services And Work Orders Infographics PDF
This slide highlights dashboard for facilities management services which includes tasks by work order type, task by status, lobs logged, repair services and priority work orders. Formulating a presentation can take up a lot of effort and time, so the content and message should always be the primary focus. The visuals of the PowerPoint can enhance the presenters message, so our Strategic FM Services Facilities Management Dashboard With Repair Services And Work Orders Infographics PDF was created to help save time. Instead of worrying about the design, the presenter can concentrate on the message while our designers work on creating the ideal templates for whatever situation is needed. Slidegeeks has experts for everything from amazing designs to valuable content, we have put everything into Strategic FM Services Facilities Management Dashboard With Repair Services And Work Orders Infographics PDF.
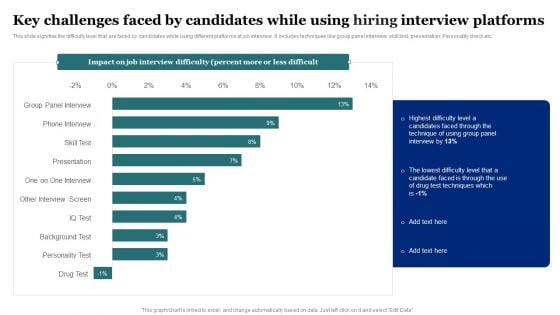
Key Challenges Faced By Candidates While Using Hiring Interview Platforms Rules PDF
This slide signifies the difficulty level that are faced by candidates while using different platforms at job interview. It includes techniques like group panel interview, skill test, presentation, Personality check etc. Pitch your topic with ease and precision using this Key Challenges Faced By Candidates While Using Hiring Interview Platforms Rules PDF. This layout presents information on Group Panel Interview, Phone Interview, Skill Test, Presentation. It is also available for immediate download and adjustment. So, changes can be made in the color, design, graphics or any other component to create a unique layout.

Term Life Insurance Plan Claims Management Dashboard Portrait PDF
This slide illustrates facts and figures related to status of total claims and closed claims made in an insurance company. It includes yearly claim status pie-chart, total claims quarter-wise and total closed claims quarter-wise. Pitch your topic with ease and precision using this Term Life Insurance Plan Claims Management Dashboard Portrait PDF. This layout presents information on Yearly Claim Status, Total Claims, Quarter Wise. It is also available for immediate download and adjustment. So, changes can be made in the color, design, graphics or any other component to create a unique layout.
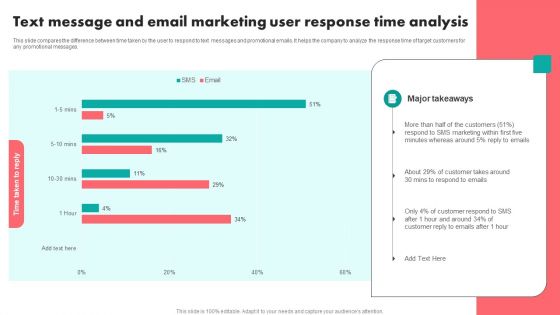
Text Message And Email Marketing User Response Time Analysis Template PDF
This slide compares the difference between time taken by the user to respond to text messages and promotional emails. It helps the company to analyze the response time of target customers for any promotional messages. Pitch your topic with ease and precision using this Text Message And Email Marketing User Response Time Analysis Template PDF. This layout presents information on Text Message, Email Marketing User, Response Time Analysis. It is also available for immediate download and adjustment. So, changes can be made in the color, design, graphics or any other component to create a unique layout.
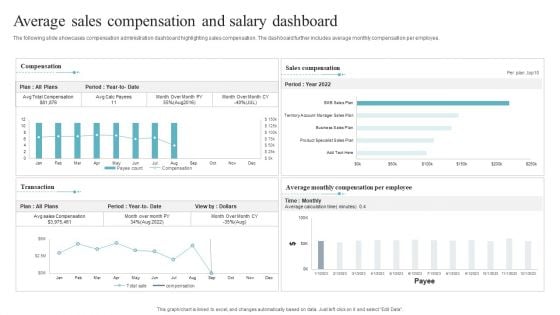
Average Sales Compensation And Salary Dashboard Introduction PDF
The following slide showcases compensation administration dashboard highlighting sales compensation. The dashboard further includes average monthly compensation per employee. Pitch your topic with ease and precision using this Average Sales Compensation And Salary Dashboard Introduction PDF. This layout presents information on Salary Dashboard, Average Sales Compensation. It is also available for immediate download and adjustment. So, changes can be made in the color, design, graphics or any other component to create a unique layout.
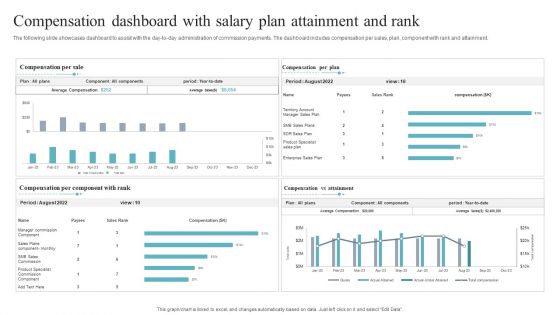
Compensation Dashboard With Salary Plan Attainment And Rank Slides PDF
The following slide showcases dashboard to assist with the day to day administration of commission payments. The dashboard includes compensation per sales, plan, component with rank and attainment. Pitch your topic with ease and precision using this Compensation Dashboard With Salary Plan Attainment And Rank Slides PDF. This layout presents information on Salary Plan Attainment Rank, Compensation Dashboard. It is also available for immediate download and adjustment. So, changes can be made in the color, design, graphics or any other component to create a unique layout.
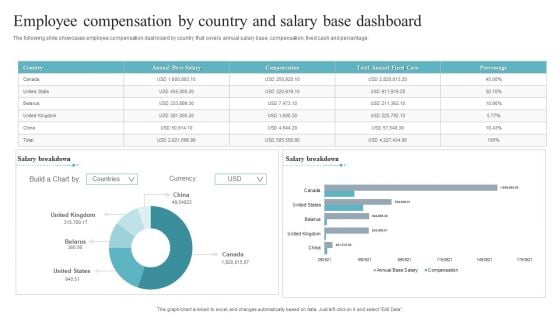
Employee Compensation By Country And Salary Base Dashboard Mockup PDF
The following slide showcases employee compensation dashboard by country that covers annual salary base, compensation, fixed cash and percentage. Pitch your topic with ease and precision using this Employee Compensation By Country And Salary Base Dashboard Mockup PDF. This layout presents information on Employee Compensation, Country Salary Base Dashboard. It is also available for immediate download and adjustment. So, changes can be made in the color, design, graphics or any other component to create a unique layout.
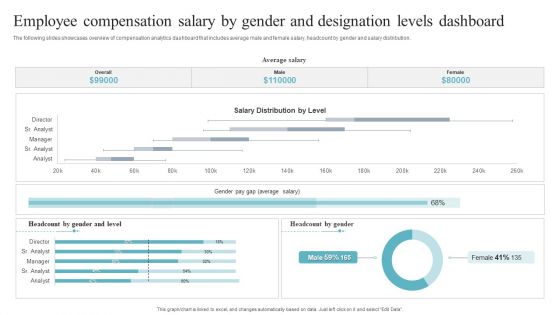
Employee Compensation Salary By Gender And Designation Levels Dashboard Portrait PDF
The following slides showcases overview of compensation analytics dashboard that includes average male and female salary, headcount by gender and salary distribution. Pitch your topic with ease and precision using this Employee Compensation Salary By Gender And Designation Levels Dashboard Portrait PDF. This layout presents information on Employee Compensation Salary, Designation Levels Dashboard. It is also available for immediate download and adjustment. So, changes can be made in the color, design, graphics or any other component to create a unique layout.
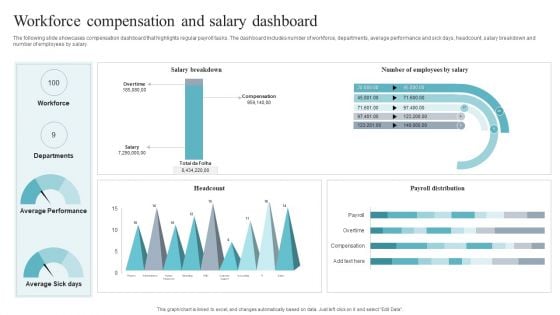
Workforce Compensation And Salary Dashboard Brochure PDF
The following slide showcases compensation dashboard that highlights regular payroll tasks. The dashboard includes number of workforce, departments, average performance and sick days, headcount, salary breakdown and number of employees by salary. Pitch your topic with ease and precision using this Workforce Compensation And Salary Dashboard Brochure PDF. This layout presents information on Workforce Compensation, Salary Dashboard. It is also available for immediate download and adjustment. So, changes can be made in the color, design, graphics or any other component to create a unique layout.
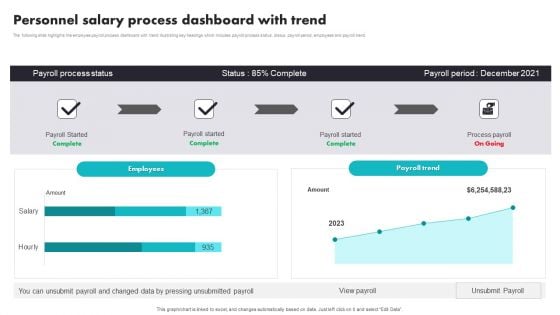
Personnel Salary Process Dashboard With Trend Brochure PDF
The following slide highlights the employee payroll process dashboard with trend illustrating key headings which includes payroll process status, status, payroll period, employees and payroll trend. Pitch your topic with ease and precision using this Personnel Salary Process Dashboard With Trend Brochure PDF. This layout presents information on Personnel Salary Process, Dashboard With Trend. It is also available for immediate download and adjustment. So, changes can be made in the color, design, graphics or any other component to create a unique layout.
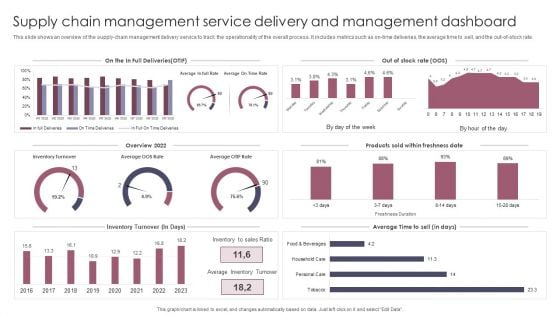
Supply Chain Management Service Delivery And Management Dashboard Guidelines PDF
This slide shows an overview of the supply chain management delivery service to track the operationality of the overall process. It includes metrics such as on time deliveries, the average time to sell, and the out of stock rate. Pitch your topic with ease and precision using this Supply Chain Management Service Delivery And Management Dashboard Guidelines PDF. This layout presents information on Supply Chain Management, Service Delivery, Management Dashboard. It is also available for immediate download and adjustment. So, changes can be made in the color, design, graphics or any other component to create a unique layout.
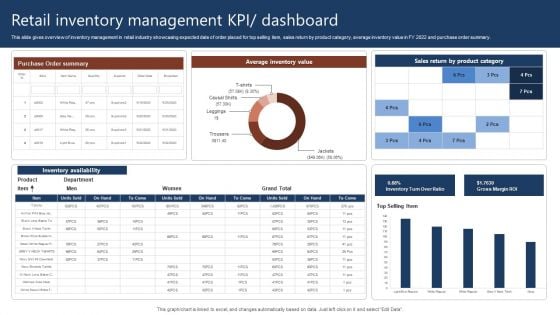
Retail Inventory Management Kpi Dashboard Rules PDF
This slide gives overview of inventory management in retail industry showcasing expected date of order placed for top selling item, sales return by product category, average inventory value in FY 2022 and purchase order summary. Pitch your topic with ease and precision using this Retail Inventory Management Kpi Dashboard Rules PDF. This layout presents information on Retail Inventory Management, Dashboard. It is also available for immediate download and adjustment. So, changes can be made in the color, design, graphics or any other component to create a unique layout.
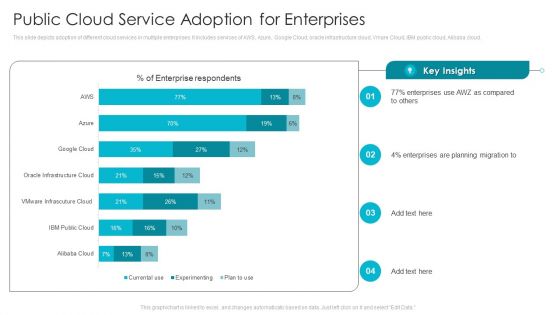
Public Cloud Service Adoption For Enterprises Ppt Inspiration Graphic Images PDF
This slide depicts adoption of different cloud services in multiple enterprises. It includes services of AWS, Azure, Google Cloud, oracle infrastructure cloud, Vmare Cloud, IBM public cloud, Alibaba cloud. Pitch your topic with ease and precision using this Public Cloud Service Adoption For Enterprises Ppt Inspiration Graphic Images PDF. This layout presents information on Planning Migration, Alibaba Cloud, IBM Public Cloud. It is also available for immediate download and adjustment. So, changes can be made in the color, design, graphics or any other component to create a unique layout.
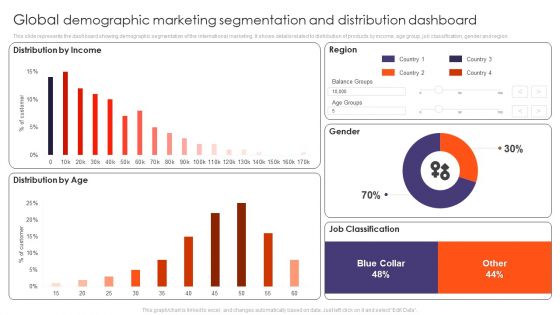
Global Demographic Marketing Segmentation And Distribution Dashboard Ppt Gallery Tips PDF
This slide represents the dashboard showing demographic segmentation of the international marketing. It shows details related to distribution of products by income, age group, job classification, gender and region. Pitch your topic with ease and precision using this Global Demographic Marketing Segmentation And Distribution Dashboard Ppt Gallery Tips PDF. This layout presents information on Distribution Income, Distribution Age, Region, Gender, Job Classification. It is also available for immediate download and adjustment. So, changes can be made in the color, design, graphics or any other component to create a unique layout.
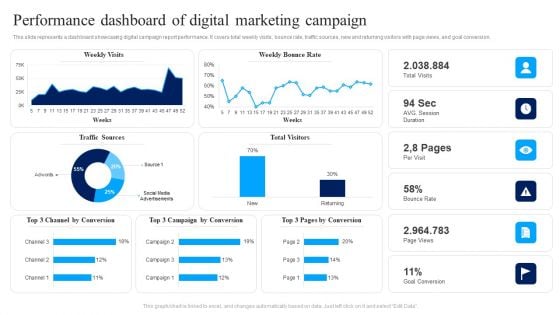
Performance Dashboard Of Digital Marketing Campaign Ppt Show Slide PDF
This slide represents a dashboard showcasing digital campaign report performance. It covers total weekly visits, bounce rate, traffic sources, new and returning visitors with page views, and goal conversion. Pitch your topic with ease and precision using this Performance Dashboard Of Digital Marketing Campaign Ppt Show Slide PDF. This layout presents information on Weekly Visits, Weekly Bounce Rate, Bounce Rate. It is also available for immediate download and adjustment. So, changes can be made in the color, design, graphics or any other component to create a unique layout.
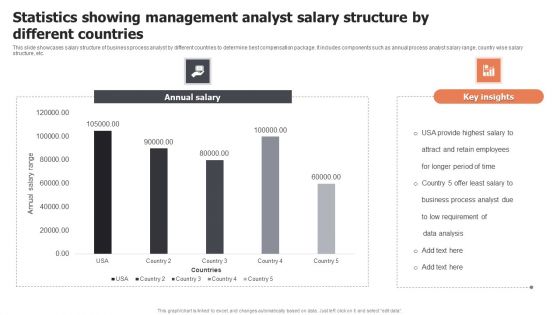
Statistics Showing Management Analyst Salary Structure By Different Countries Sample PDF
Pitch your topic with ease and precision using this Statistics Showing Management Analyst Salary Structure By Different Countries Sample PDF. This layout presents information on Annual Salary, Key Insights, USA Provide, Highest Salary. It is also available for immediate download and adjustment. So, changes can be made in the color, design, graphics or any other component to create a unique layout.
Effect Of Pandemic On Education By Global School Closures Icons PDF
The slide illustrates the impact of COVID-19 on schools worldwide to estimate the educational loss to learners. The data included is the number of learners impacted by COVID from march 25 to april 30, 2020. Pitch your topic with ease and precision using this Effect Of Pandemic On Education By Global School Closures Icons PDF. This layout presents information on Total Estimated, Localized Level Educational, Institutions Closure. It is also available for immediate download and adjustment. So, changes can be made in the color, design, graphics or any other component to create a unique layout.
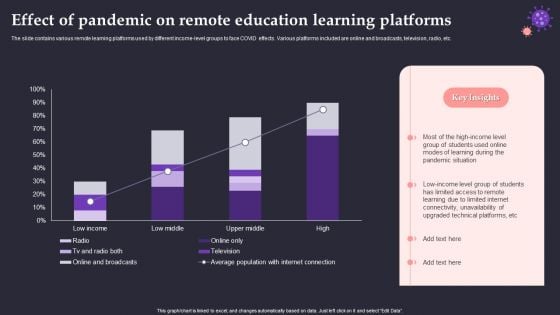
Effect Of Pandemic On Remote Education Learning Platforms Sample PDF
The slide contains various remote learning platforms used by different income-level groups to face COVID effects. Various platforms included are online and broadcasts, television, radio, etc. Pitch your topic with ease and precision using this Effect Of Pandemic On Remote Education Learning Platforms Sample PDF. This layout presents information on Pandemic Situation, High Income Level, Technical Platforms. It is also available for immediate download and adjustment. So, changes can be made in the color, design, graphics or any other component to create a unique layout.
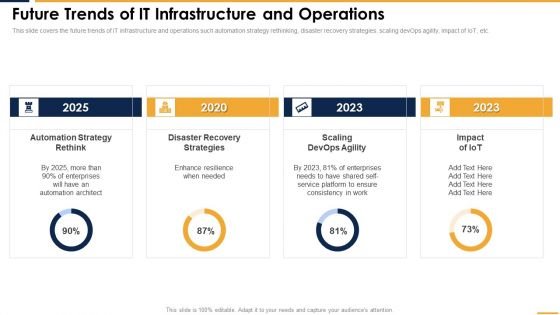
Future Trends Of IT Infrastructure And Operations Professional PDF
This slide covers the future trends of IT infrastructure and operations such automation strategy rethinking, disaster recovery strategies, scaling devOps agility, impact of IoT, etc. Crafting an eye catching presentation has never been more straightforward. Let your presentation shine with this tasteful yet straightforward Future Trends Of IT Infrastructure And Operations Professional PDF template. It offers a minimalistic and classy look that is great for making a statement. The colors have been employed intelligently to add a bit of playfulness while still remaining professional. Construct the ideal Future Trends Of IT Infrastructure And Operations Professional PDF that effortlessly grabs the attention of your audience Begin now and be certain to wow your customers.

Infrastructure Monitoring Dashboard Structure PDF
This slide covers the dashboard which can be used to monitor the server count, geo activity, processor, memory space, network security, etc. Formulating a presentation can take up a lot of effort and time, so the content and message should always be the primary focus. The visuals of the PowerPoint can enhance the presenters message, so our Infrastructure Monitoring Dashboard Structure PDF was created to help save time. Instead of worrying about the design, the presenter can concentrate on the message while our designers work on creating the ideal templates for whatever situation is needed. Slidegeeks has experts for everything from amazing designs to valuable content, we have put everything into Infrastructure Monitoring Dashboard Structure PDF.
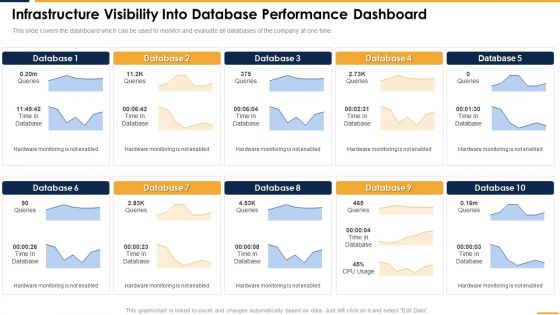
Infrastructure Visibility Into Database Performance Dashboard Rules PDF
This slide covers the dashboard which can be used to monitor and evaluate all databases of the company at one time. This modern and well arranged Infrastructure Visibility Into Database Performance Dashboard Rules PDF provides lots of creative possibilities. It is very simple to customize and edit with the Powerpoint Software. Just drag and drop your pictures into the shapes. All facets of this template can be edited with Powerpoint no extra software is necessary. Add your own material, put your images in the places assigned for them, adjust the colors, and then you can show your slides to the world, with an animated slide included.

Time Spent On Monitoring IT Infrastructure Professional PDF
This slide covers the time spend in monitoring the IT infrastructure such as extracting and analyzing logs, interpreting reports and alerts, managing tools and agents, etc. Explore a selection of the finest Time Spent On Monitoring IT Infrastructure Professional PDF here. With a plethora of professionally designed and pre made slide templates, you can quickly and easily find the right one for your upcoming presentation. You can use our Time Spent On Monitoring IT Infrastructure Professional PDF to effectively convey your message to a wider audience. Slidegeeks has done a lot of research before preparing these presentation templates. The content can be personalized and the slides are highly editable. Grab templates today from Slidegeeks.
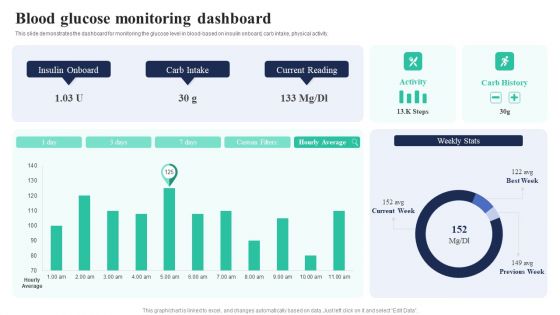
Biochips Use Cases Blood Glucose Monitoring Dashboard Introduction PDF
This slide demonstrates the dashboard for monitoring the glucose level in blood-based on insulin onboard, carb intake, physical activity. Slidegeeks has constructed Biochips Use Cases Blood Glucose Monitoring Dashboard Introduction PDF after conducting extensive research and examination. These presentation templates are constantly being generated and modified based on user preferences and critiques from editors. Here, you will find the most attractive templates for a range of purposes while taking into account ratings and remarks from users regarding the content. This is an excellent jumping-off point to explore our content and will give new users an insight into our top-notch PowerPoint Templates.
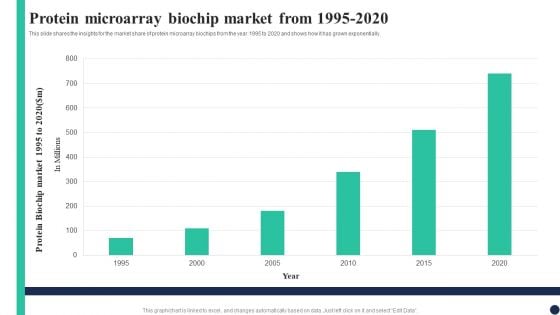
Biochips Use Cases Protein Microarray Biochip Market From 1995 To 2020 Pictures PDF
This slide shares the insights for the market share of protein microarray biochips from the year 1995 to 2020 and shows how it has grown exponentially. Here you can discover an assortment of the finest PowerPoint and Google Slides templates. With these templates, you can create presentations for a variety of purposes while simultaneously providing your audience with an eye-catching visual experience. Download Biochips Use Cases Protein Microarray Biochip Market From 1995 To 2020 Pictures PDF to deliver an impeccable presentation. These templates will make your job of preparing presentations much quicker, yet still, maintain a high level of quality. Slidegeeks has experienced researchers who prepare these templates and write high-quality content for you. Later on, you can personalize the content by editing the Biochips Use Cases Protein Microarray Biochip Market From 1995 To 2020 Pictures PDF.
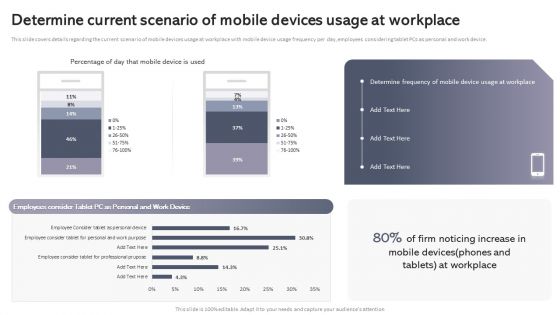
Workplace Portable Device Monitoring And Administration Determine Current Scenario Of Mobile Devices Usage At Workplace Information PDF
This slide covers details regarding the current scenario of mobile devices usage at workplace with mobile device usage frequency per day, employees considering tablet PCs as personal and work device. This Workplace Portable Device Monitoring And Administration Determine Current Scenario Of Mobile Devices Usage At Workplace Information PDF from Slidegeeks makes it easy to present information on your topic with precision. It provides customization options, so you can make changes to the colors, design, graphics, or any other component to create a unique layout. It is also available for immediate download, so you can begin using it right away. Slidegeeks has done good research to ensure that you have everything you need to make your presentation stand out. Make a name out there for a brilliant performance.
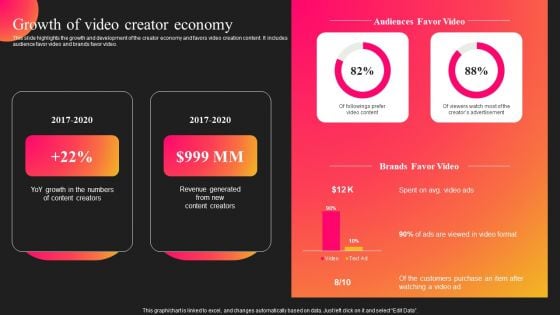
Curastory Editing Platform Pitch Deck Growth Of Video Creator Economy Template PDF
This slide highlights the growth and development of the creator economy and favors video creation content. It includes audience favor video and brands favor video. Coming up with a presentation necessitates that the majority of the effort goes into the content and the message you intend to convey. The visuals of a PowerPoint presentation can only be effective if it supplements and supports the story that is being told. Keeping this in mind our experts created Curastory Editing Platform Pitch Deck Growth Of Video Creator Economy Template PDF to reduce the time that goes into designing the presentation. This way, you can concentrate on the message while our designers take care of providing you with the right template for the situation.
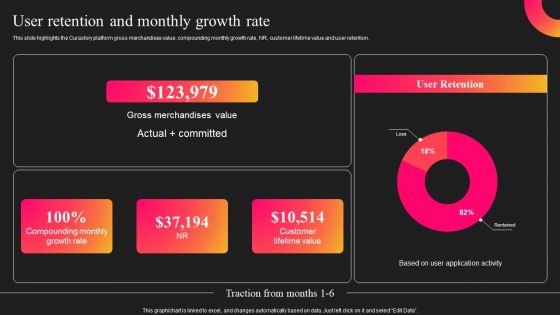
Curastory Editing Platform Pitch Deck User Retention And Monthly Growth Rate Template PDF
This slide highlights the Curastory platform gross merchandises value, compounding monthly growth rate, NR, customer lifetime value and user retention. Explore a selection of the finest Curastory Editing Platform Pitch Deck User Retention And Monthly Growth Rate Template PDF here. With a plethora of professionally designed and pre made slide templates, you can quickly and easily find the right one for your upcoming presentation. You can use our Curastory Editing Platform Pitch Deck User Retention And Monthly Growth Rate Template PDF to effectively convey your message to a wider audience. Slidegeeks has done a lot of research before preparing these presentation templates. The content can be personalized and the slides are highly editable. Grab templates today from Slidegeeks.
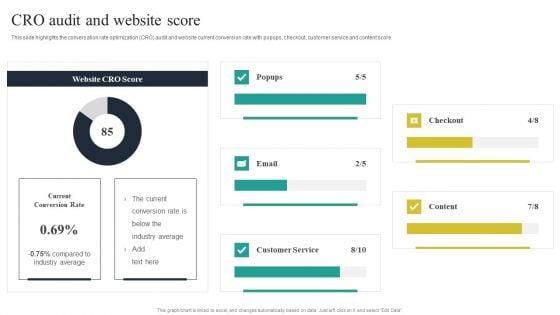
Website Audit To Increase Conversion Rate CRO Audit And Website Score Clipart PDF
This slide highlights the conversation rate optimization CRO audit and website current conversion rate with popups, checkout, customer service and content score. Are you in need of a template that can accommodate all of your creative concepts This one is crafted professionally and can be altered to fit any style. Use it with Google Slides or PowerPoint. Include striking photographs, symbols, depictions, and other visuals. Fill, move around, or remove text boxes as desired. Test out color palettes and font mixtures. Edit and save your work, or work with colleagues. Download Website Audit To Increase Conversion Rate CRO Audit And Website Score Clipart PDF and observe how to make your presentation outstanding. Give an impeccable presentation to your group and make your presentation unforgettable.
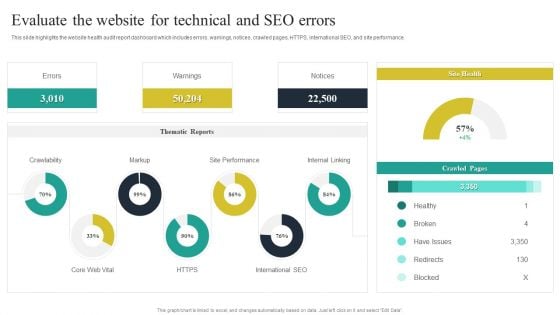
Website Audit To Increase Conversion Rate Evaluate The Website For Technical And SEO Errors Ideas PDF
This slide highlights the website health audit report dashboard which includes errors, warnings, notices, crawled pages, HTTPS, international SEO, and site performance. Crafting an eye catching presentation has never been more straightforward. Let your presentation shine with this tasteful yet straightforward Website Audit To Increase Conversion Rate Evaluate The Website For Technical And SEO Errors Ideas PDF template. It offers a minimalistic and classy look that is great for making a statement. The colors have been employed intelligently to add a bit of playfulness while still remaining professional. Construct the ideal Website Audit To Increase Conversion Rate Evaluate The Website For Technical And SEO Errors Ideas PDF that effortlessly grabs the attention of your audience Begin now and be certain to wow your customers.
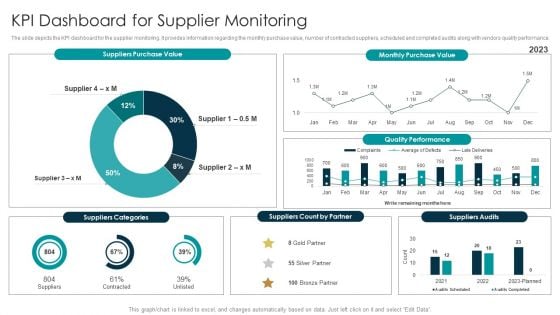
Tactical Approach For Vendor Reskilling KPI Dashboard For Supplier Monitoring Slides PDF
The slide depicts the KPI dashboard for the supplier monitoring. It provides information regarding the monthly purchase value, number of contracted suppliers, scheduled and completed audits along with vendors quality performance. Coming up with a presentation necessitates that the majority of the effort goes into the content and the message you intend to convey. The visuals of a PowerPoint presentation can only be effective if it supplements and supports the story that is being told. Keeping this in mind our experts created Tactical Approach For Vendor Reskilling KPI Dashboard For Supplier Monitoring Slides PDF to reduce the time that goes into designing the presentation. This way, you can concentrate on the message while our designers take care of providing you with the right template for the situation.
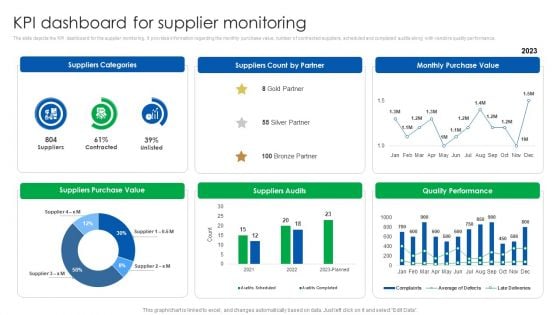
Vendor Relationship Management Strategic Plan KPI Dashboard For Supplier Monitoring Infographics PDF
The slide depicts the KPI dashboard for the supplier monitoring. It provides information regarding the monthly purchase value, number of contracted suppliers, scheduled and completed audits along with vendors quality performance. Coming up with a presentation necessitates that the majority of the effort goes into the content and the message you intend to convey. The visuals of a PowerPoint presentation can only be effective if it supplements and supports the story that is being told. Keeping this in mind our experts created Vendor Relationship Management Strategic Plan KPI Dashboard For Supplier Monitoring Infographics PDF to reduce the time that goes into designing the presentation. This way, you can concentrate on the message while our designers take care of providing you with the right template for the situation.
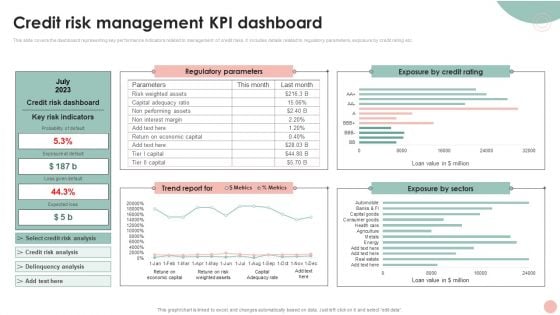
Company Risk Assessment Plan Credit Risk Management KPI Dashboard Rules PDF
This slide covers the dashboard representing key performance indicators related to management of credit risks. It includes details related to regulatory parameters, exposure by credit rating etc. Do you have an important presentation coming up. Are you looking for something that will make your presentation stand out from the rest. Look no further than Company Risk Assessment Plan Credit Risk Management KPI Dashboard Rules PDF. With our professional designs, you can trust that your presentation will pop and make delivering it a smooth process. And with Slidegeeks, you can trust that your presentation will be unique and memorable. So why wait. GrabCompany Risk Assessment Plan Credit Risk Management KPI Dashboard Rules PDF today and make your presentation stand out from the rest.
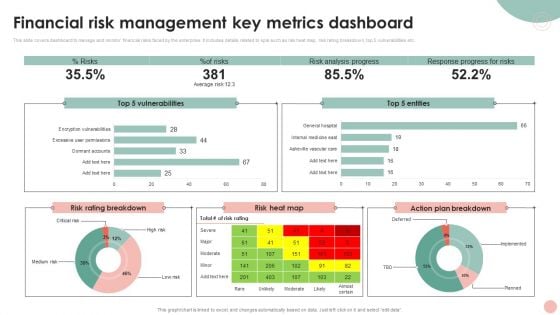
Company Risk Assessment Plan Financial Risk Management Key Metrics Dashboard Brochure PDF
This slide covers dashboard to manage and monitor financial risks faced by the enterprise. It includes details related to kpis such as risk heat map, risk rating breakdown, top 5 vulnerabilities etc. Crafting an eye catching presentation has never been more straightforward. Let your presentation shine with this tasteful yet straight forward Company Risk Assessment Plan Financial Risk Management Key Metrics Dashboard Brochure PDF template. It offers a minimalistic and classy look that is great for making a statement. The colors have been employed intelligently to add a bit of playfulness while still remaining professional. Construct the ideal Company Risk Assessment Plan Financial Risk Management Key Metrics Dashboard Brochure PDF that effortlessly grabs the attention of your audience. Begin now and be certain to wow your customers.


 Continue with Email

 Home
Home


