Cost Chart
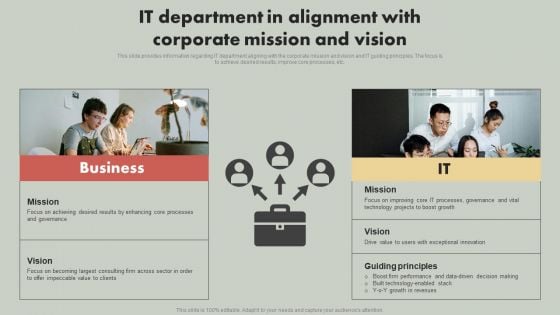
IT Reducing Costs And Management Tips IT Department In Alignment With Corporate Mission And Vision Inspiration PDF
This slide provides information regarding IT department aligning with the corporate mission and vision and IT guiding principles. The focus is to achieve desired results, improve core processes, etc. Whether you have daily or monthly meetings, a brilliant presentation is necessary. IT Reducing Costs And Management Tips IT Department In Alignment With Corporate Mission And Vision Inspiration PDF can be your best option for delivering a presentation. Represent everything in detail using IT Reducing Costs And Management Tips IT Department In Alignment With Corporate Mission And Vision Inspiration PDF and make yourself stand out in meetings. The template is versatile and follows a structure that will cater to your requirements. All the templates prepared by Slidegeeks are easy to download and edit. Our research experts have taken care of the corporate themes as well. So, give it a try and see the results.
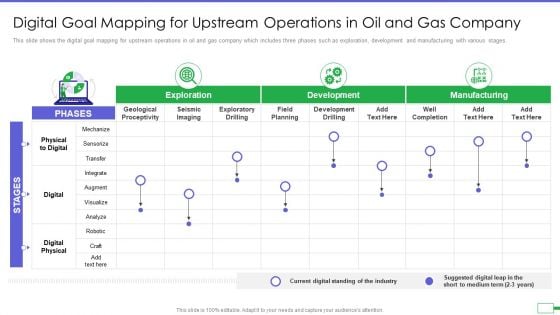
Iot And Digital Twin To Reduce Costs Post Covid Digital Goal Mapping For Upstream Operations Structure PDF
This slide shows the digital goal mapping for upstream operations in oil and gas company which includes three phases such as exploration, development and manufacturing with various stages. Deliver an awe inspiring pitch with this creative iot and digital twin to reduce costs post covid digital goal mapping for upstream operations structure pdf bundle. Topics like exploration, development, manufacturing can be discussed with this completely editable template. It is available for immediate download depending on the needs and requirements of the user.
Project Management Equipment To Control Workload Tasks And Minimize Costs 30 60 90 Days Plan Mockup PDF
Presenting project management equipment to control workload tasks and minimize costs 30 60 90 days plan mockup pdf to provide visual cues and insights. Share and navigate important information on three stages that need your due attention. This template can be used to pitch topics like 30 60 90 days plan. In addtion, this PPT design contains high resolution images, graphics, etc, that are easily editable and available for immediate download.
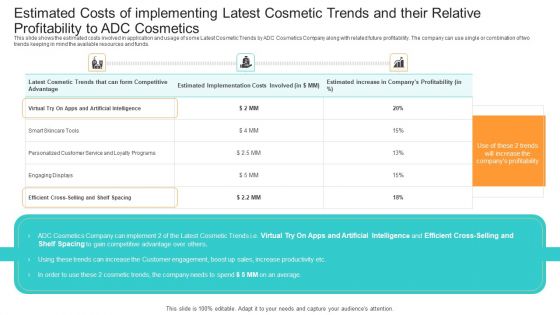
Competition Estimated Costs Of Implementing Latest Cosmetic Trends And Their Relative Profitability To ADC Cosmetics Designs PDF
This slide shows the estimated costs involved in application and usage of some Latest Cosmetic Trends by ADC Cosmetics Company along with related future profitability. The company can use single or combination of two trends keeping in mind the available resources and funds. Deliver and pitch your topic in the best possible manner with this competition estimated costs of implementing latest cosmetic trends and their relative profitability to adc cosmetics designs pdf. Use them to share invaluable insights on latest cosmetic trends that can form competitive advantage, engaging displays, personalized customer service and loyalty programs and impress your audience. This template can be altered and modified as per your expectations. So, grab it now.
Hike In The Charges Of Fuel Costs In Transportation Firm Case Competition 30 60 90 Days Plan Brochure PDF
This is a hike in the charges of fuel costs in transportation firm case competition 30 60 90 days plan brochure pdf. template with various stages. Focus and dispense information on three stages using this creative set, that comes with editable features. It contains large content boxes to add your information on topics like 30 60 90 days plan You can also showcase facts, figures, and other relevant content using this PPT layout. Grab it now.
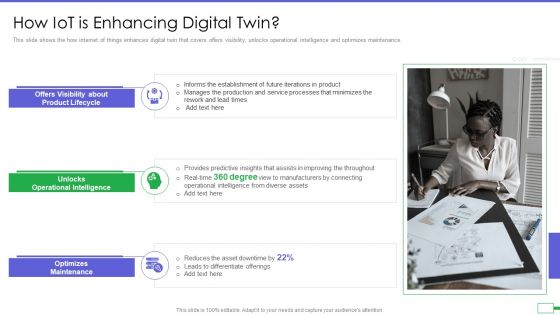
Iot And Digital Twin To Reduce Costs Post Covid How Iot Is Enhancing Digital Twin Introduction PDF
This slide shows the how internet of things enhances digital twin that covers offers visibility, unlocks operational intelligence and optimizes maintenance. This is a iot and digital twin to reduce costs post covid how iot is enhancing digital twin introduction pdf template with various stages. Focus and dispense information on three stages using this creative set, that comes with editable features. It contains large content boxes to add your information on topics like offers visibility about product lifecycle, unlocks operational intelligence, optimizes maintenance. You can also showcase facts, figures, and other relevant content using this PPT layout. Grab it now.
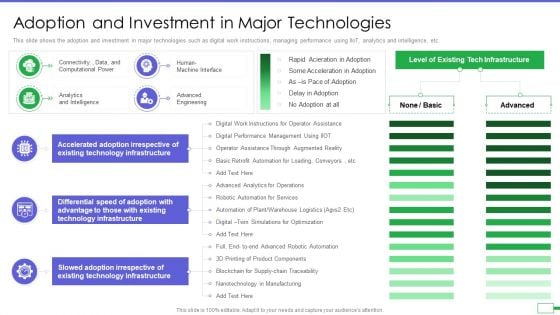
Iot And Digital Twin To Reduce Costs Post Covid Adoption And Investment In Major Technologies Clipart PDF
This slide shows the adoption and investment in major technologies such as digital work instructions, managing performance using IIoT, analytics and intelligence, etc. Presenting iot and digital twin to reduce costs post covid adoption and investment in major technologies clipart pdf to provide visual cues and insights. Share and navigate important information on three stages that need your due attention. This template can be used to pitch topics like technology infrastructure, analytics and intelligence, advanced engineering, human machine interface. In addtion, this PPT design contains high resolution images, graphics, etc, that are easily editable and available for immediate download.

Iot And Digital Twin To Reduce Costs Post Covid Digital Rolling Stock Maintenance In Rail Elements PDF
This slide shows the digital rolling stock maintenance in rail transportation which includes monitoring off train conditions, mobile maintenance, automated execution, etc. Deliver and pitch your topic in the best possible manner with this iot and digital twin to reduce costs post covid digital rolling stock maintenance in rail elements pdf. Use them to share invaluable insights on mobile maintenance, integrated maintenance, digitally enabled workforce, automated execution, smart parts management and impress your audience. This template can be altered and modified as per your expectations. So, grab it now.
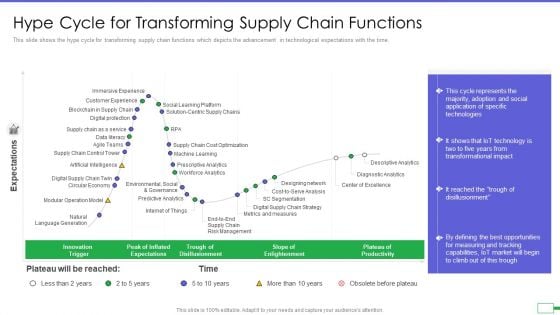
Iot And Digital Twin To Reduce Costs Post Covid Hype Cycle For Transforming Supply Chain Functions Portrait PDF
This slide shows the hype cycle for transforming supply chain functions which depicts the advancement in technological expectations with the time. Deliver an awe inspiring pitch with this creative iot and digital twin to reduce costs post covid hype cycle for transforming supply chain functions portrait pdf bundle. Topics like risk management, center of excellence, diagnostic analytics, descriptive analytics, metrics and measures can be discussed with this completely editable template. It is available for immediate download depending on the needs and requirements of the user.
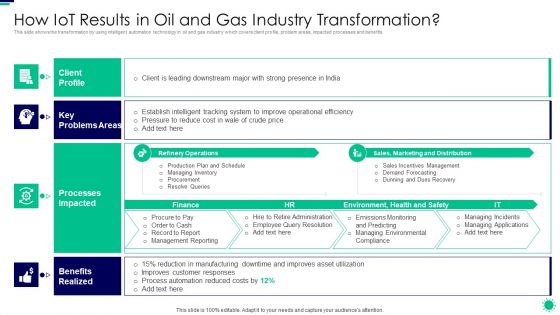
Purpose Digital Twin Internet Things Reducing Costs After COVID Era How Iot Results In Oil And Gas Designs PDF
This slide shows the transformation by using intelligent automation technology in oil and gas industry which covers client profile, problem areas, impacted processes and benefits. Deliver an awe inspiring pitch with this creative purpose digital twin internet things reducing costs after covid era how iot results in oil and gas designs pdf bundle. Topics like client profile, problems areas, processes impacted, benefits realized can be discussed with this completely editable template. It is available for immediate download depending on the needs and requirements of the user.
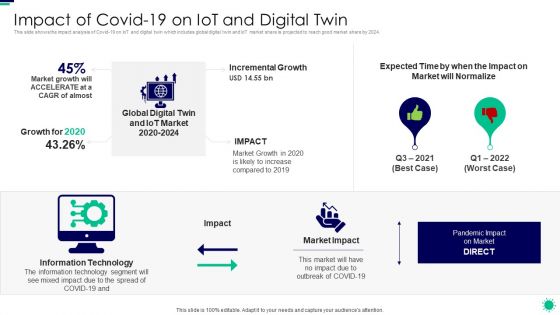
Purpose Digital Twin Internet Things Reducing Costs After COVID Era Impact Of Covid 19 On Iot Sample PDF
This slide shows the impact analysis of Covid 19 on IoT and digital twin which includes global digital twin and IoT market share is projected to reach good market share by 2024. Deliver an awe inspiring pitch with this creative purpose digital twin internet things reducing costs after covid era impact of covid 19 on iot sample pdf bundle. Topics like information technology, market impact, incremental growth can be discussed with this completely editable template. It is available for immediate download depending on the needs and requirements of the user.
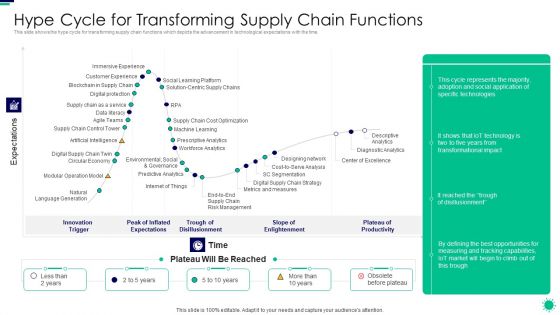
Purpose Digital Twin Internet Things Reducing Costs After COVID Era Hype Cycle For Transforming Supply Inspiration PDF
This slide shows the hype cycle for transforming supply chain functions which depicts the advancement in technological expectations with the time. Deliver and pitch your topic in the best possible manner with this purpose digital twin internet things reducing costs after covid era hype cycle for transforming supply inspiration pdf . Use them to share invaluable insights on immersive experience, customer experience, digital protection, data literacy and impress your audience. This template can be altered and modified as per your expectations. So, grab it now.
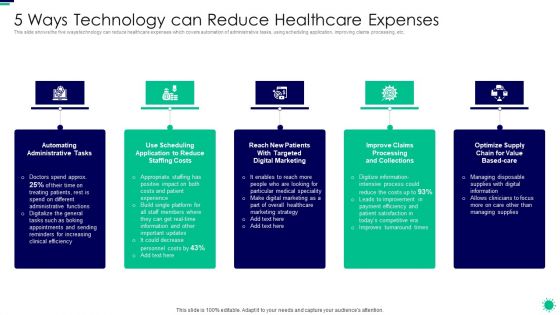
Purpose Digital Twin Internet Things Reducing Costs After COVID Era 5 Ways Technology Can Reduce Demonstration PDF
This slide shows the five ways technology can reduce healthcare expenses which covers automation of administrative tasks, using scheduling application, improving claims processing, etc. This is a purpose digital twin internet things reducing costs after covid era 5 ways technology can reduce demonstration pdf template with various stages. Focus and dispense information on five stages using this creative set, that comes with editable features. It contains large content boxes to add your information on topics like automating administrative tasks, application reduce, digital marketing, collections. You can also showcase facts, figures, and other relevant content using this PPT layout. Grab it now.
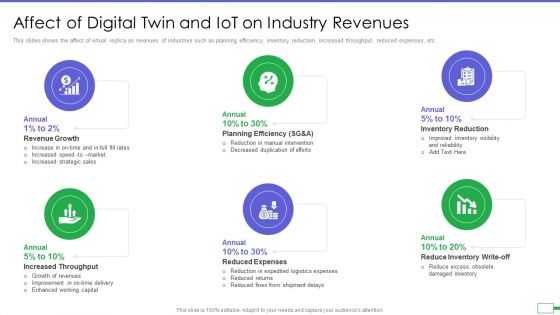
Iot And Digital Twin To Reduce Costs Post Covid Affect Of Digital Twin And Iot On Industry Revenues Brochure PDF
This slides shows the affect of virtual replica on revenues of industries such as planning efficiency, inventory reduction, increased throughput, reduced expenses, etc. Presenting iot and digital twin to reduce costs post covid affect of digital twin and iot on industry revenues brochure pdf to provide visual cues and insights. Share and navigate important information on six stages that need your due attention. This template can be used to pitch topics like revenue growth, planning efficiency, inventory reduction, increased throughput, reduced expenses. In addtion, this PPT design contains high resolution images, graphics, etc, that are easily editable and available for immediate download.
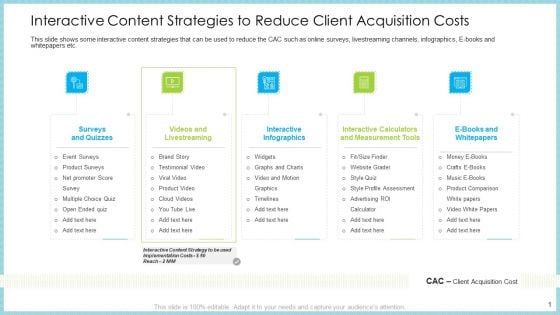
Customer Acquiring Price For Retaining New Clients Interactive Content Strategies To Reduce Client Acquisition Costs Rules PDF
This slide shows some interactive content strategies that can be used to reduce the CAC such as online surveys, livestreaming channels, infographics, E-books and whitepapers etc. This is a customer acquiring price for retaining new clients interactive content strategies to reduce client acquisition costs rules pdf template with various stages. Focus and dispense information on five stages using this creative set, that comes with editable features. It contains large content boxes to add your information on topics like surveys and quizzes, videos and livestreaming, interactive infographics, interactive calculators and measurement tools, e books and whitepapers. You can also showcase facts, figures, and other relevant content using this PPT layout. Grab it now.
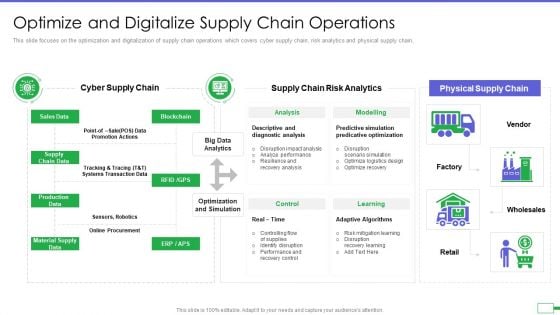
Iot And Digital Twin To Reduce Costs Post Covid Optimize And Digitalize Supply Chain Operations Demonstration PDF
This slide focuses on the optimization and digitalization of supply chain operations which covers cyber supply chain, risk analytics and physical supply chain. Deliver an awe inspiring pitch with this creative iot and digital twin to reduce costs post covid optimize and digitalize supply chain operations demonstration pdf bundle. Topics like sales data, material supply data, production data, supply chain data can be discussed with this completely editable template. It is available for immediate download depending on the needs and requirements of the user.
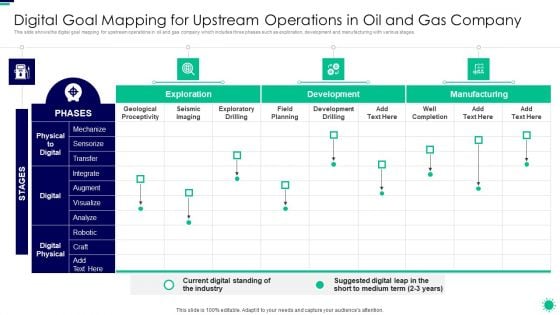
Purpose Digital Twin Internet Things Reducing Costs After COVID Era Digital Goal Mapping For Upstream Mockup PDF
This slide shows the digital goal mapping for upstream operations in oil and gas company which includes three phases such as exploration, development and manufacturing with various stages. Deliver an awe inspiring pitch with this creative purpose digital twin internet things reducing costs after covid era digital goal mapping for upstream mockup pdf bundle. Topics like digital goal mapping for upstream operations in oil and gas company can be discussed with this completely editable template. It is available for immediate download depending on the needs and requirements of the user.
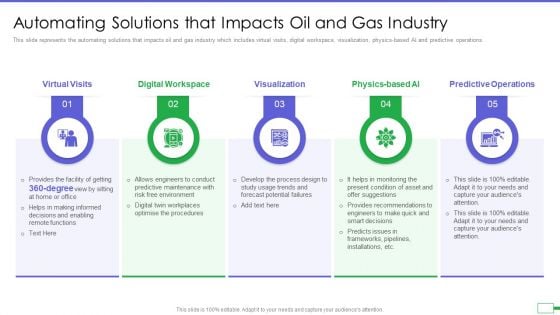
Iot And Digital Twin To Reduce Costs Post Covid Automating Solutions That Impacts Oil And Gas Industry Formats PDF
This slide represents the automating solutions that impacts oil and gas industry which includes virtual visits, digital workspace, visualization, physics-based AI and predictive operations. Presenting iot and digital twin to reduce costs post covid automating solutions that impacts oil and gas industry formats pdf to provide visual cues and insights. Share and navigate important information on five stages that need your due attention. This template can be used to pitch topics like virtual visits, digital workspace, visualization, physics based ai, predictive operations. In addtion, this PPT design contains high resolution images, graphics, etc, that are easily editable and available for immediate download.
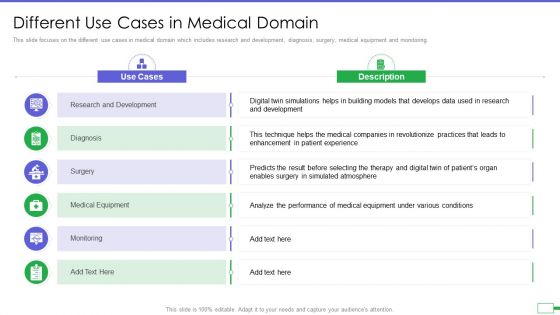
Iot And Digital Twin To Reduce Costs Post Covid Different Use Cases In Medical Domain Template PDF
This slide focuses on the different use cases in medical domain which includes research and development, diagnosis, surgery, medical equipment and monitoring. Presenting iot and digital twin to reduce costs post covid different use cases in medical domain template pdf to provide visual cues and insights. Share and navigate important information on six stages that need your due attention. This template can be used to pitch topics like research and development, diagnosis, surgery, medical equipment, monitoring. In addtion, this PPT design contains high resolution images, graphics, etc, that are easily editable and available for immediate download.
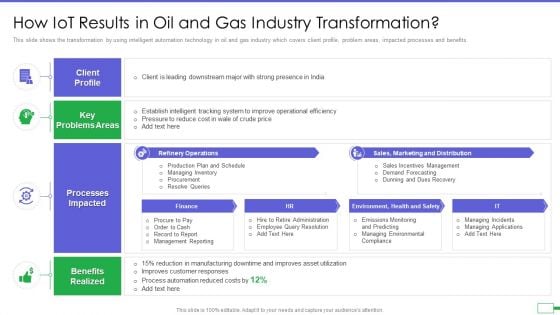
Iot And Digital Twin To Reduce Costs Post Covid How Iot Results In Oil And Gas Industry Demonstration PDF
This slide shows the transformation by using intelligent automation technology in oil and gas industry which covers client profile, problem areas, impacted processes and benefits. Presenting iot and digital twin to reduce costs post covid how iot results in oil and gas industry demonstration pdf to provide visual cues and insights. Share and navigate important information on four stages that need your due attention. This template can be used to pitch topics like client profile, key problems areas, processes impacted, benefits realized. In addtion, this PPT design contains high resolution images, graphics, etc, that are easily editable and available for immediate download.
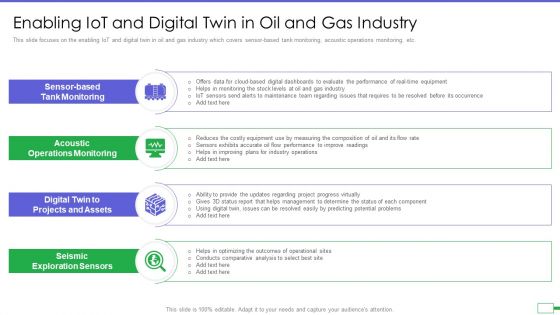
Iot And Digital Twin To Reduce Costs Post Covid Enabling Iot And Digital Twin In Oil And Gas Infographics PDF
This slide focuses on the enabling IoT and digital twin in oil and gas industry which covers sensor-based tank monitoring, acoustic operations monitoring, etc. Presenting iot and digital twin to reduce costs post covid enabling iot and digital twin in oil and gas infographics pdf to provide visual cues and insights. Share and navigate important information on four stages that need your due attention. This template can be used to pitch topics like sensor based tank monitoring, acoustic operations monitoring, digital twin to projects and assets, seismic exploration sensors. In addtion, this PPT design contains high resolution images, graphics, etc, that are easily editable and available for immediate download.
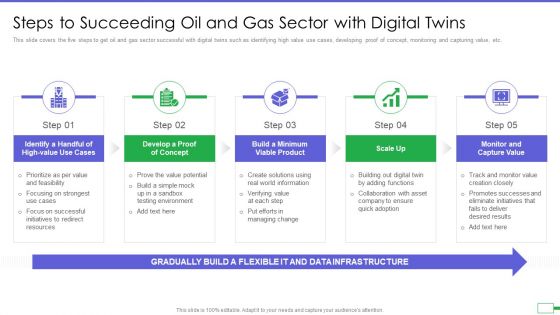
Iot And Digital Twin To Reduce Costs Post Covid Steps To Succeeding Oil And Gas Sector With Digital Slides PDF
This slide covers the five steps to get oil and gas sector successful with digital twins such as identifying high value use cases, developing proof of concept, monitoring and capturing value, etc. Presenting iot and digital twin to reduce costs post covid steps to succeeding oil and gas sector with digital slides pdf to provide visual cues and insights. Share and navigate important information on five stages that need your due attention. This template can be used to pitch topics like handful of high value use cases, develop a proof of concept, build a minimum viable product, scale up, monitor and capture value. In addtion, this PPT design contains high resolution images, graphics, etc, that are easily editable and available for immediate download.

Hike In Fuel Prices Resulting Increased Cargo Costs In Transportation Firm Business Case Competition Ppt PowerPoint Presentation Complete Deck
This complete deck acts as a great communication tool. It helps you in conveying your business message with personalized sets of graphics, icons etc. Comprising a set of fortyseven slides, this complete deck can help you persuade your audience. It also induces strategic thinking as it has been thoroughly researched and put together by our experts. Not only is it easily downloadable but also editable. The color, graphics, theme any component can be altered to fit your individual needs. So grab it now.

Project Management Equipment To Control Workload Tasks And Minimize Costs Ppt PowerPoint Presentation Complete Deck With Slides
This complete deck acts as a great communication tool. It helps you in conveying your business message with personalized sets of graphics, icons etc. Comprising a set of fiftytwo slides, this complete deck can help you persuade your audience. It also induces strategic thinking as it has been thoroughly researched and put together by our experts. Not only is it easily downloadable but also editable. The color, graphics, theme any component can be altered to fit your individual needs. So grab it now.
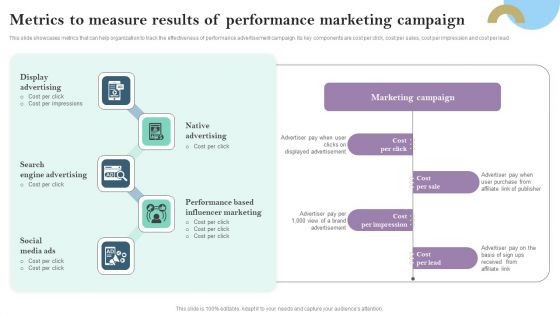
Metrics To Measure Results Of Performance Marketing Campaign Ppt PowerPoint Presentation Diagram Graph Charts PDF
This slide showcases metrics that can help organization to track the effectiveness of performance advertisement campaign. Its key components are cost per click, cost per sales, cost per impression and cost per lead Presenting this PowerPoint presentation, titled Metrics To Measure Results Of Performance Marketing Campaign Ppt PowerPoint Presentation Diagram Graph Charts PDF, with topics curated by our researchers after extensive research. This editable presentation is available for immediate download and provides attractive features when used. Download now and captivate your audience. Presenting this Metrics To Measure Results Of Performance Marketing Campaign Ppt PowerPoint Presentation Diagram Graph Charts PDF. Our researchers have carefully researched and created these slides with all aspects taken into consideration. This is a completely customizable Metrics To Measure Results Of Performance Marketing Campaign Ppt PowerPoint Presentation Diagram Graph Charts PDF that is available for immediate downloading. Download now and make an impact on your audience. Highlight the attractive features available with our PPTs.
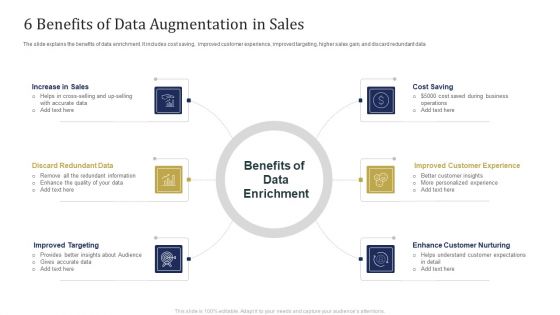
6 Benefits Of Data Augmentation In Sales Ppt Diagram Graph Charts PDF
The slide explains the benefits of data enrichment. It includes cost saving, improved customer experience, improved targeting, higher sales gain, and discard redundant data. Presenting 6 Benefits Of Data Augmentation In Sales Ppt Diagram Graph Charts PDF to dispense important information. This template comprises six stages. It also presents valuable insights into the topics including Discard Redundant Data, Improved Targeting, Enhance Customer Nurturing, Cost Saving. This is a completely customizable PowerPoint theme that can be put to use immediately. So, download it and address the topic impactfully.
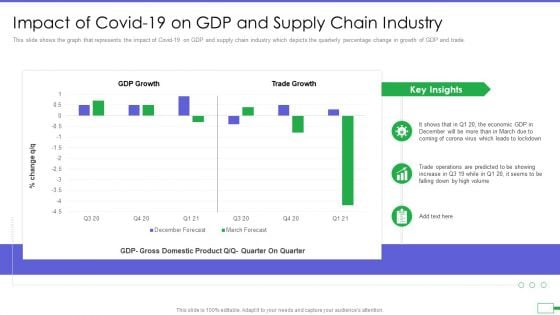
Iot And Digital Twin To Reduce Costs Post Covid Impact Of Covid 19 On Gdp And Supply Chain Industry Ideas PDF
This slide shows the graph that represents the impact of Covid 19 on GDP and supply chain industry which depicts the quarterly percentage change in growth of GDP and trade. Deliver an awe inspiring pitch with this creative iot and digital twin to reduce costs post covid impact of covid 19 on gdp and supply chain industry ideas pdf bundle. Topics like impact of covid 19 on gdp and supply chain industry can be discussed with this completely editable template. It is available for immediate download depending on the needs and requirements of the user.
Pie Graph Icon Circle Charts PowerPoint Templates And PowerPoint Themes 0612
Pie Graph Icon Circle Charts PowerPoint Templates And PowerPoint Themes Business-Microsoft Powerpoint Templates and Background with pie chart icon Enhance feasibility with our Pie Graph Icon Circle Charts PowerPoint Templates And PowerPoint Themes 0612. Exhort your team to eventual success.
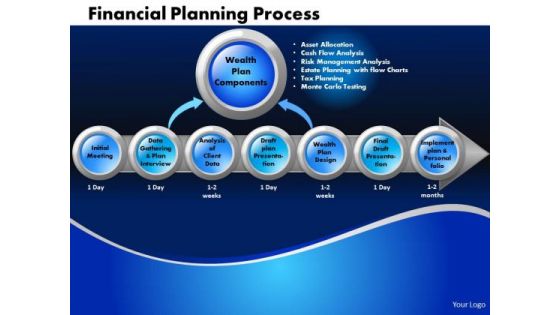
Business Circle Charts PowerPoint Templates Marketing Financial Planning Process Ppt Slides
Business Circle Charts PowerPoint Templates Marketing Financial Planning Process PPT Slides-This circle chart can be used in business, education and economic presentations to help the audience visualize the content better, or to find flaws in a financial planning process.-Business Circle Charts PowerPoint Templates Marketing Financial Planning Process PPT Slides-This template can be used for presentations relating to Abstract, Action, Business, Chart, Commerce, Competitor, Components, Concept, Conceptual, Design, Diagram, Executive, Financial, Goals, Guide, Guidelines, Hierarchy, Icon, Idea, Illustration, Manage, Management, Marketing, Mind, Mission, Model, Operations, Organization, Performance, Plan, Planning, Process Our Business Circle Charts PowerPoint Templates Marketing Financial Planning Process Ppt Slides team are good at their craft. They have chiselled out designer products.
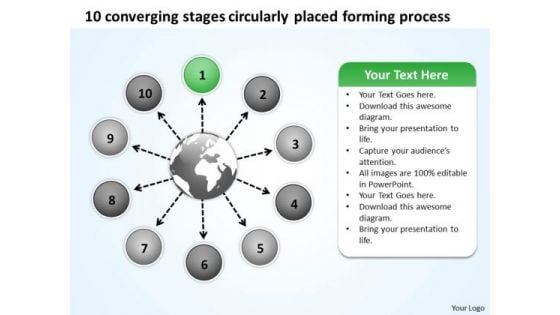
10 Converging Stages Circularly Placed Forming Process Charts And PowerPoint Slides
We present our 10 converging stages circularly placed forming process Charts and PowerPoint Slides.Download our Process and flows PowerPoint Templates because different people with differing ideas and priorities perform together to score. Download and present our Shapes PowerPoint Templates because this is a good example of the strength of teamwork. Present our Circle charts PowerPoint Templates because all for one and one for all. Download our Arrows PowerPoint Templates because you can Adorn them with your ideas and thoughts. Download our Ring charts PowerPoint Templates because the fruit of your labour is about to ripen.Use these PowerPoint slides for presentations relating to Arrow, blank, business, chart, circle, concept, connection, cycle, development, diagram, direction, element, environment, exchange, finance, financial, flow, graph, graphic, graphic presentation, group, icon, illustration, investment, isolated, isometric, market, motion, movement, organization, passive income, perspective, process, process chart, recycle, report, ring, sign, step, stock, success, symbol. The prominent colors used in the PowerPoint template are Blue light, Gray, Black. You can be sure our 10 converging stages circularly placed forming process Charts and PowerPoint Slides are Fun. Presenters tell us our connection PowerPoint templates and PPT Slides are Youthful. We assure you our 10 converging stages circularly placed forming process Charts and PowerPoint Slides are Fantastic. Customers tell us our cycle PowerPoint templates and PPT Slides are Clever. Presenters tell us our 10 converging stages circularly placed forming process Charts and PowerPoint Slides are the best it can get when it comes to presenting. You can be sure our chart PowerPoint templates and PPT Slides are Fun. Our 10 Converging Stages Circularly Placed Forming Process Charts And PowerPoint Slides team are exceedingly good. They have a clear assessment of what you need.
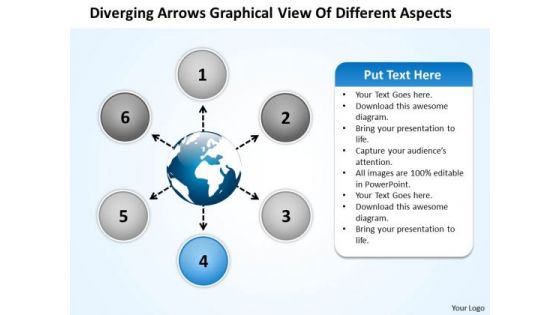
Arrows Graphical View Of Different Aspects Charts And Diagrams PowerPoint Templates
We present our arrows graphical view of different aspects Charts and Diagrams PowerPoint templates.Download and present our Flow Charts PowerPoint Templates because the gears of youthful minds are useful, therefore set them in motion. Use our Business PowerPoint Templates because you are ready to flap your wings and launch off. All poised are you to touch the sky with glory. Present our Shapes PowerPoint Templates because this is An innovative slide design depicting driving home the relevance of a steady rhythm. Present our Process and Flows PowerPoint Templates because watching them will strengthen your companys sinews. Present our Circle Charts PowerPoint Templates because this template with an image of helps you chart the course of your presentation.Use these PowerPoint slides for presentations relating to Arrows, Blank, Business, Chart, Circle, Circular, Circulation, Concept, Conceptual, Converging, Design, Diagram, Empty, Executive, Five, Icon, Illustration, Management, Pointing, Procedure, Process, Relationship, Resource, Sequence, Sequential, Strategy, Template. The prominent colors used in the PowerPoint template are Blue, Gray, White. Presenters tell us our arrows graphical view of different aspects Charts and Diagrams PowerPoint templates are Royal. We assure you our Chart PowerPoint templates and PPT Slides are Spiffy. Presenters tell us our arrows graphical view of different aspects Charts and Diagrams PowerPoint templates are Delightful. Use our Concept PowerPoint templates and PPT Slides are Swanky. We assure you our arrows graphical view of different aspects Charts and Diagrams PowerPoint templates are second to none. You can be sure our Business PowerPoint templates and PPT Slides are Vintage. Our Arrows Graphical View Of Different Aspects Charts And Diagrams PowerPoint Templates don't fiddle with feelings. They take all emotions into account.
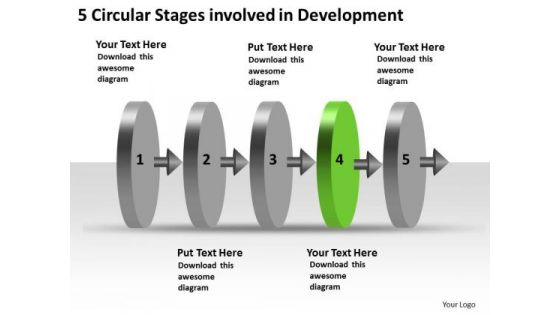
5 Circular Stages Involved Development What Is Flow Charts PowerPoint Templates
We present our 5 circular stages involved development what is flow charts PowerPoint templates.Download our Arrows PowerPoint Templates because getting it done may not be enough. Use our Process and Flows PowerPoint Templates because it shows to your group how they mesh together to drive the whole. Download and present our Shapes PowerPoint Templates because you have good reasons to back up the strength of your belief. Download our Business PowerPoint Templates because you have churned your mind and come upwith solutions. Present our Circle Charts PowerPoint Templates because Our Template designs are State of the Art.Use these PowerPoint slides for presentations relating to Abstract, Arrows, blank, business, chart, circular, circulation, concept, conceptual, design, diagram, empty, executive, icon, idea, illustration, management, map, mapping, model, numbers, organization, procedure, process, progression, resource, sequence, sequential, seven, stages, steps, strategy. The prominent colors used in the PowerPoint template are Green, Black, Gray. The feedback we get is that our 5 circular stages involved development what is flow charts PowerPoint templates are designed to make your presentations professional. People tell us our concept PowerPoint templates and PPT Slides are Nostalgic. We assure you our 5 circular stages involved development what is flow charts PowerPoint templates will help them to explain complicated concepts. Presenters tell us our chart PowerPoint templates and PPT Slides are designed by a team of presentation professionals. We assure you our 5 circular stages involved development what is flow charts PowerPoint templates are Multicolored. Use our blank PowerPoint templates and PPT Slides are Efficient. Give our 5 Circular Stages Involved Development What Is Flow Charts PowerPoint Templates catalogue a good look through. You will be enthralled by their appeal.
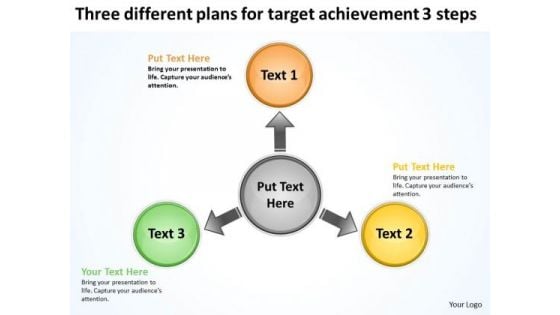
Three Different Plans For Target Achievement 3 Steps Charts And PowerPoint Slides
We present our three different plans for target achievement 3 steps Charts and PowerPoint Slides.Present our Circle Charts PowerPoint Templates because you have the people in place, selected the team leaders and all are raring to go. Present our Arrows PowerPoint Templates because with the help of our Slides you can Illustrate these thoughts with this slide. Download our Business PowerPoint Templates because this layout helps you to bring some important aspects of your business process to the notice of all concerned. Streamline the flow of information across the board. Present our Shapes PowerPoint Templates because Our PowerPoint Templates and Slides will effectively help you save your valuable time. They are readymade to fit into any presentation structure. Download and present our Flow Charts PowerPoint Templates because your ideas are fundamentally stable with a broad base of workable possibilities.Use these PowerPoint slides for presentations relating to 3d, achievement, aim, arrow, background, blue, business, career, chart, communication, competition, concept, curve, design, development, different, direction, education, financial, forecast, forward, glossy, graph, graphic, group, growth, icon, illustration, increase, investment, moving, outlook, path, plan, price, profit, progress, race, sales, start, success, target, team, three, turn, up, upwards, win, winner. The prominent colors used in the PowerPoint template are Orange, Yellow, Green. Customers tell us our three different plans for target achievement 3 steps Charts and PowerPoint Slides help you meet deadlines which are an element of today's workplace. Just browse and pick the slides that appeal to your intuitive senses. PowerPoint presentation experts tell us our blue PowerPoint templates and PPT Slides are Spectacular. People tell us our three different plans for target achievement 3 steps Charts and PowerPoint Slides are Tasteful. People tell us our background PowerPoint templates and PPT Slides are Handsome. Customers tell us our three different plans for target achievement 3 steps Charts and PowerPoint Slides are One-of-a-kind. People tell us our background PowerPoint templates and PPT Slides will help you be quick off the draw. Just enter your specific text and see your points hit home. Lead with our Three Different Plans For Target Achievement 3 Steps Charts And PowerPoint Slides. You will come out on top.
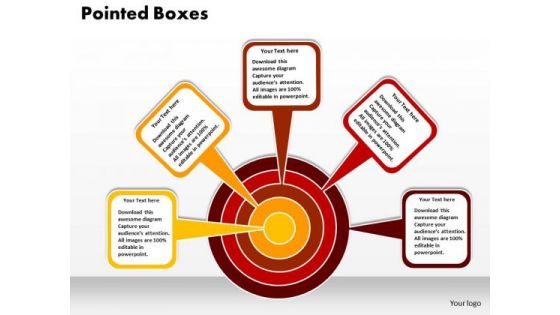
Business Circle Charts PowerPoint Templates Business Pointed Boxes Towards A Target Ppt Slides
Business Circle Charts PowerPoint Templates Business Pointed Boxes Towards A Target PPT Slides-This PowerPoint Diagram allows you to rate items by placing them in one of several concentric circles. Business goals can be explained more effectively with this design.-Business Circle Charts PowerPoint Templates Business Pointed Boxes Towards A Target PPT Slides Glue your slides together with our Business Circle Charts PowerPoint Templates Business Pointed Boxes Towards A Target Ppt Slides. Try us out and see what a difference our templates make.
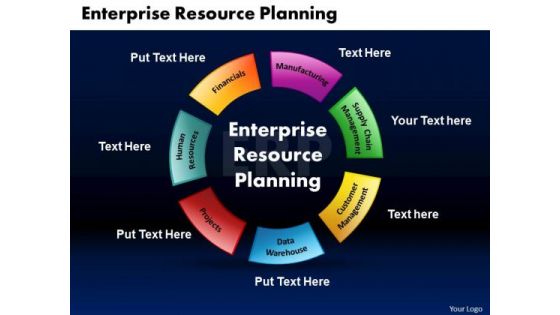
Business Circle Charts PowerPoint Templates Marketing Enterprise Resource Planning Ppt Slides
Business Circle Charts PowerPoint Templates Marketing Enterprise Resource Planning PPT Slides-This Event Resource Planning diagram can help you in displaying an organized view of marketing services and processes.-Business Circle Charts PowerPoint Templates Marketing Enterprise Resource Planning PPT Slides-This template can be used for presentations relating to 3d, Arrow, Blueprint, Business, Circle, Cleverness, Commerce, Company, Competence, Concept, Constructive, Corporate, Create, Creative, Creativity, Decision, Design, Develop, Device, Discover, Earn, Enterprise, Finance, Goal, Idea, Imaginative, Ingenious, Innovative, Inspiration, Inspire, Inventive, Job, Management, Market Formulate plans with our Business Circle Charts PowerPoint Templates Marketing Enterprise Resource Planning Ppt Slides. Download without worries with our money back guaranteee.
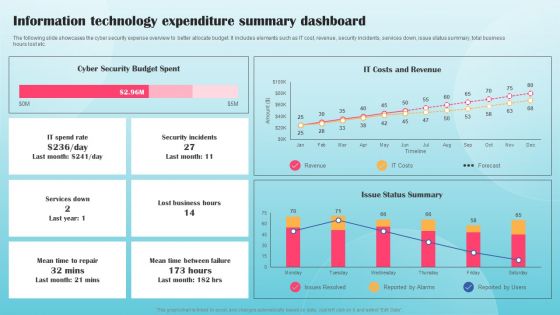
Information Technology Expenditure Summary Dashboard Ppt PowerPoint Presentation Diagram Graph Charts PDF
The following slide showcases the cyber security expense overview to better allocate budget. It includes elements such as IT cost, revenue, security incidents, services down, issue status summary, total business hours lost etc. This Information Technology Expenditure Summary Dashboard Ppt PowerPoint Presentation Diagram Graph Charts PDF from Slidegeeks makes it easy to present information on your topic with precision. It provides customization options, so you can make changes to the colors, design, graphics, or any other component to create a unique layout. It is also available for immediate download, so you can begin using it right away. Slidegeeks has done good research to ensure that you have everything you need to make your presentation stand out. Make a name out there for a brilliant performance.
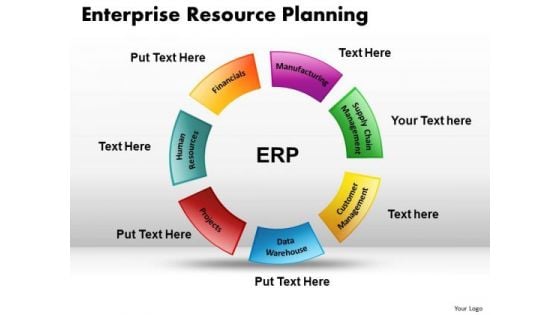
Business Circle Charts PowerPoint Templates Leadership Enterprise Resource Planning Ppt Slides
Business Circle Charts PowerPoint Templates Leadership Enterprise Resource Planning PPT Slides-A wonderful graphics to make a PowerPoint presentation on Enterprise Resource Planning-Business Circle Charts PowerPoint Templates Leadership Enterprise Resource Planning PPT Slides-This template can be used for presentations relating to 3d, Arrow, Blueprint, Business, Circle, Cleverness, Commerce, Company, Competence, Concept, Constructive, Corporate, Create, Creative, Creativity, Decision, Design, Develop, Device, Discover, Earn, Enterprise, Finance, Goal, Idea, Imaginative, Ingenious, Innovative, Inspiration, Inspire, Inventive, Job, Management, Market Arouse the excitement with our Business Circle Charts PowerPoint Templates Leadership Enterprise Resource Planning Ppt Slides. Stir up the audience with your views.
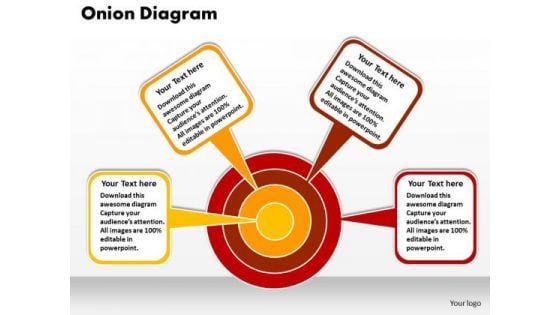
Business Circle Charts PowerPoint Templates Business Four Factors Onion Diagram Ppt Slides
Business Circle Charts PowerPoint Templates Business Four Factors Onion Diagram PPT Slides-This PowerPoint Diagram consists of four factors needed for development of Business. This Diagram will definitely make your Presentation more interesting and Fascinating.-Business Circle Charts PowerPoint Templates Business Four Factors Onion Diagram PPT Slides Establish success with our Business Circle Charts PowerPoint Templates Business Four Factors Onion Diagram Ppt Slides. Download without worries with our money back guaranteee.
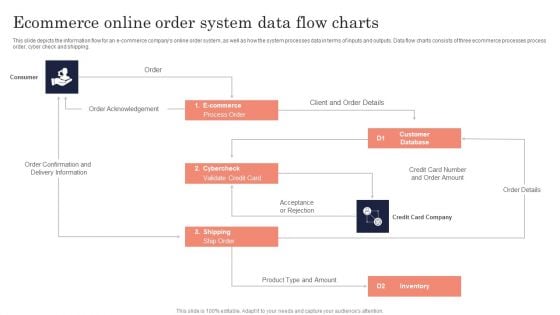
Ecommerce Online Order System Data Flow Charts Ppt PowerPoint Presentation File Slides PDF
This slide depicts the information flow for an e-commerce companys online order system, as well as how the system processes data in terms of inputs and outputs. Data flow charts consists of three ecommerce processes process order, cyber check and shipping. Presenting Ecommerce Online Order System Data Flow Charts Ppt PowerPoint Presentation File Slides PDF to dispense important information. This template comprises two stages. It also presents valuable insights into the topics including Customer, Database Inventory, Cybercheck. This is a completely customizable PowerPoint theme that can be put to use immediately. So, download it and address the topic impactfully.
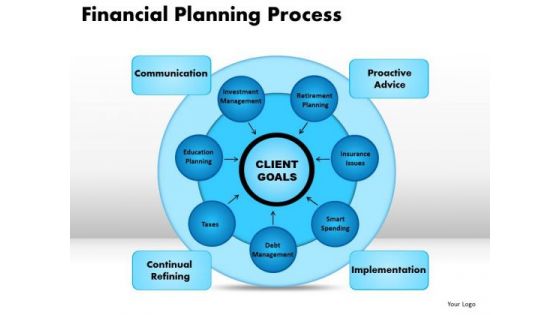
Business Circle Charts PowerPoint Templates Business Financial Planning Process Ppt Slides
Business Circle Charts PowerPoint Templates Business Financial Planning Process PPT Slides-This PowerPoint diagram shows transformations from one stage to others stage of Financial Planning Process-Business Circle Charts PowerPoint Templates Business Financial Planning Process PPT Slides-This template can be used for presentations relating to Abstract, Action, Business, Chart, Commerce, Competitor, Components, Concept, Conceptual, Design, Diagram, Executive, Financial, Goals, Guide, Guidelines, Hierarchy, Icon, Idea, Illustration, Manage, Management, Marketing, Mind, Mission, Model, Operations, Organization, Performance, Plan, Planning, Process Our Business Circle Charts PowerPoint Templates Business Financial Planning Process Ppt Slides team love fact finding missions. They enjoy bringing the truth to you.
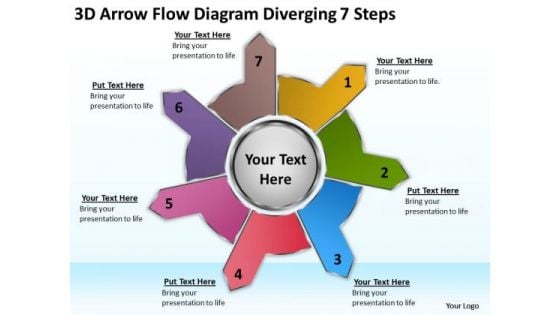
3d Arrow Flow Diagram Diverging 7 Steps Charts And Diagrams PowerPoint Templates
We present our 3d arrow flow diagram diverging 7 steps Charts and Diagrams PowerPoint templates.Use our Arrows PowerPoint Templates because you can Adorn them with your ideas and thoughts. Download and present our Business PowerPoint Templates because you are ready to flap your wings and launch off. All poised are you to touch the sky with glory. Download our Shapes PowerPoint Templates because all elements of the venture are equally critical. Use our Circle Charts PowerPoint Templates because you can Grab the attention of your team with this eye catching template signifying . Download and present our Flow Charts PowerPoint Templates because you have the right arrows in your quiver.Use these PowerPoint slides for presentations relating to 3d, abstract, arrow, art, background, blank, business, chart, circle, concept, connection, cycle, development, diagram, direction, element, environment, exchange, finance, flow, graph, graphic, group, icon, illustration, investment, isolated, isometric, market, motion, movement, organization, passive income, perspective, presentation, process, process chart, recycle, report, ring, sign, step, stock, success, symbol, teamwork, text, vector. The prominent colors used in the PowerPoint template are Yellow, Green, Blue. Customers tell us our 3d arrow flow diagram diverging 7 steps Charts and Diagrams PowerPoint templates are Adorable. PowerPoint presentation experts tell us our arrow PowerPoint templates and PPT Slides are specially created by a professional team with vast experience. They diligently strive to come up with the right vehicle for your brilliant Ideas. People tell us our 3d arrow flow diagram diverging 7 steps Charts and Diagrams PowerPoint templates are Great. People tell us our arrow PowerPoint templates and PPT Slides are Tranquil. Customers tell us our 3d arrow flow diagram diverging 7 steps Charts and Diagrams PowerPoint templates provide great value for your money. Be assured of finding the best projection to highlight your words. People tell us our business PowerPoint templates and PPT Slides are Graceful. Your audience will be absolutely attentive. Fascinate them with our 3d Arrow Flow Diagram Diverging 7 Steps Charts And Diagrams PowerPoint Templates.
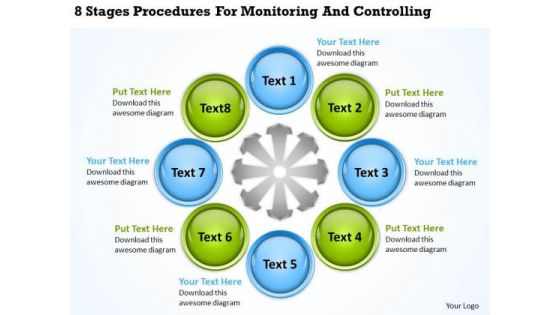
Business Charts 8 Stages Procedures For Monitoring And Controlling PowerPoint Slides
We present our business charts 8 stages procedures for monitoring and controlling PowerPoint Slides.Present our Circle Charts PowerPoint Templates because Our PowerPoint Templates and Slides will let your words and thoughts hit bullseye everytime. Present our Ring Charts PowerPoint Templates because Our PowerPoint Templates and Slides are created with admirable insight. Use them and give your group a sense of your logical mind. Use our Circle Charts PowerPoint Templates because It will get your audience in sync. Use our Process and Flows PowerPoint Templates because Our PowerPoint Templates and Slides will give you great value for your money. Be assured of finding the best projection to highlight your words. Download our Ring Charts PowerPoint Templates because Our PowerPoint Templates and Slides will let Your superior ideas hit the target always and everytime.Use these PowerPoint slides for presentations relating to Action, analysis, attitude, brainstorming, business, chart, classroom, concept,conceptual, conference, connection, corporate, design, diagram, direction,eight, employee, enhance, financial, formula, future, goal, graphic, guidelines,idea, link, management, market, marketing, mind, mindmap, organization,organize, plan, process, product, relation, render, solutions, strategy, success, successful, tactic, target, training, unity, vision. The prominent colors used in the PowerPoint template are Green lime, Blue, Gray. Our Business Charts 8 Stages Procedures For Monitoring And Controlling PowerPoint Slides capture the attention of your audience. With our money back guarantee you have nothing to lose.
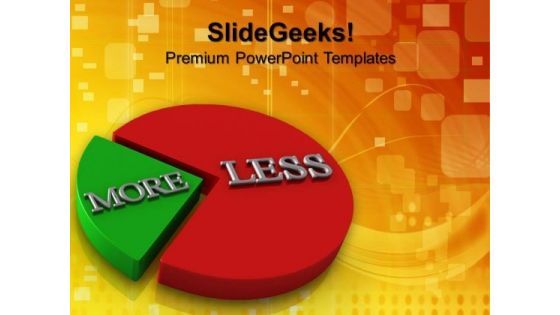
More And Less Pie Charts PowerPoint Templates And PowerPoint Themes 0712
More And Less Pie Charts PowerPoint Templates And PowerPoint Themes 0712-Microsoft Powerpoint Templates and Background with pie chart Our More And Less Pie Charts PowerPoint Templates And PowerPoint Themes 0712 will keep u sane. Your thoughts will bolt across the line.
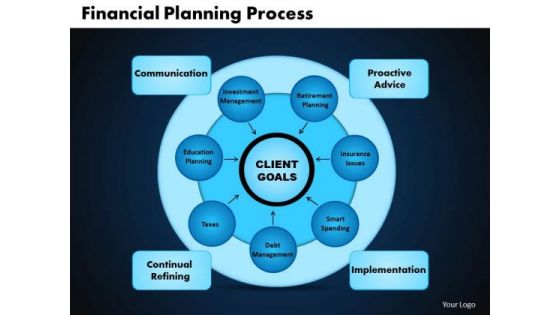
Business Circle Charts PowerPoint Templates Leadership Financial Planning Process Ppt Slides
Business Circle Charts PowerPoint Templates Leadership Financial Planning Process PPT Slides-This PowerPoint diagram shows transformations from one stage to others stage of Financial Planning Process-Business Circle Charts PowerPoint Templates Leadership Financial Planning Process PPT Slides-This template can be used for presentations relating to Abstract, Action, Business, Chart, Commerce, Competitor, Components, Concept, Conceptual, Design, Diagram, Executive, Financial, Goals, Guide, Guidelines, Hierarchy, Icon, Idea, Illustration, Manage, Management, Marketing, Mind, Mission, Model, Operations, Organization, Performance, Plan, Planning, Process The colour contrasts of our Business Circle Charts PowerPoint Templates Leadership Financial Planning Process Ppt Slides are aesthetically designed. They put the focus on key factors.
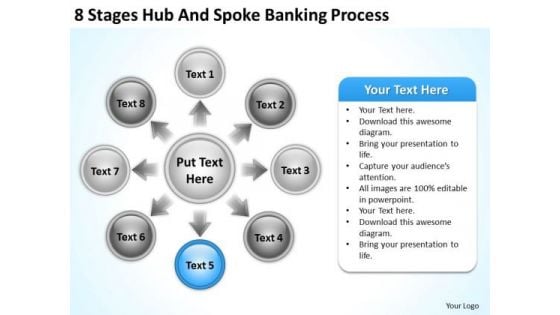
Business Flow Charts Examples 8 Stages Hub And Spoke Banking Process Ppt PowerPoint Template
We present our business flow charts examples 8 stages hub and spoke banking process ppt PowerPoint template.Present our Communication PowerPoint Templates because Our PowerPoint Templates and Slides will steer your racing mind. Hit the right buttons and spur on your audience. Use our Business PowerPoint Templates because You are working at that stage with an air of royalty. Let our PowerPoint Templates and Slides be the jewels in your crown. Download our Circle Charts PowerPoint Templates because Our PowerPoint Templates and Slides has conjured up a web of all you need with the help of our great team. Use them to string together your glistening ideas. Download our Arrows PowerPoint Templates because You canTake a leap off the starting blocks with our PowerPoint Templates and Slides. They will put you ahead of the competition in quick time. Present our Process and Flows PowerPoint Templates because It will Give impetus to the hopes of your colleagues. Our PowerPoint Templates and Slides will aid you in winning their trust.Use these PowerPoint slides for presentations relating to Arrows, Business, Chart, Circle, Company, Concept, Continuity, Continuous, Cycle, Dependency, Diagram, Direction, Dynamic, Endless, Feeds, Graph, Iteration, Iterative, Method, Path, Phase, Presentation, Process, Production, Progress, Progression, Report, Rotation, Sequence, Succession, Vector. The prominent colors used in the PowerPoint template are Blue, Gray, Black. Mastermind plans with our Business Flow Charts Examples 8 Stages Hub And Spoke Banking Process Ppt PowerPoint Template. Download without worries with our money back guaranteee.
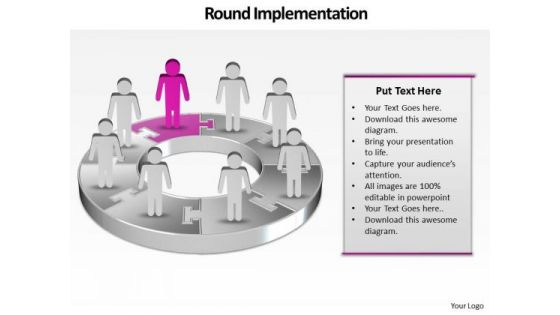
Ppt Group Of People Pie Charts Person Standing Pink Piece PowerPoint Templates
PPT group of people pie charts person standing pink piece PowerPoint Templates-Use this 3D Amazing PowerPoint Diagram to illustrate the steps to be followed in Circular Process. It is represented by Pink stage. This Diagram shows every single stage which can be explained in single slide to make your Presentation Attractive.-PPT group of people pie charts person standing pink piece PowerPoint Templates-arrow, bar, business, businessman, candidate, cartoon, character, chart, circle, circular, client, communication, company, concept, diagram, finance, growth, human, illustration, increase, information, marketing, person, presentation, process, profit, sales, stats, success, target Prescribe changes with our Ppt Group Of People Pie Charts Person Standing Pink Piece PowerPoint Templates. Download without worries with our money back guaranteee.
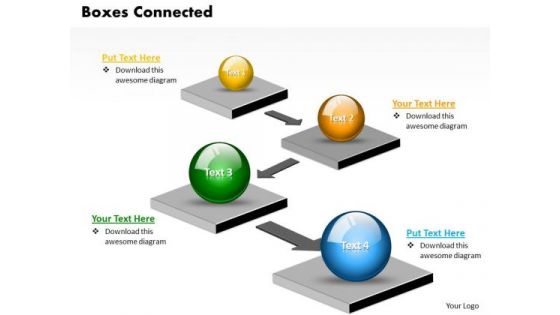
Business Charts PowerPoint Templates 3d Boxes Connected With Arrows Linear Circular Direction Sales
Business Charts PowerPoint templates 3d boxes connected with arrows linear circular direction Sales-Use this Graphical Interface to follow the Correct Path to reach the Destination. This 3D PowerPoint Diagram Shows Four Circular text boxes pointing one to the other defining which Path to follow. This Diagram will make your Presentation Attractive and Delightful to watch. Compare paths with our Business Charts PowerPoint Templates 3d Boxes Connected With Arrows Linear Circular Direction Sales. Download without worries with our money back guaranteee.
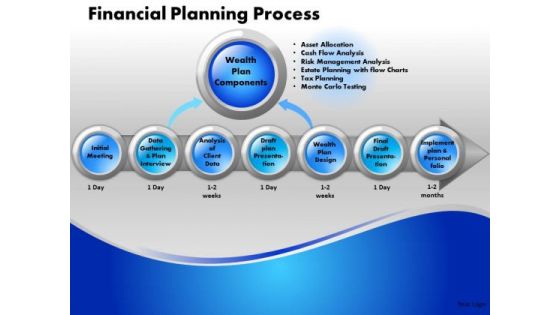
Business Circle Charts PowerPoint Templates Strategy Financial Planning Process Ppt Slides
Business Circle Charts PowerPoint Templates Strategy Financial Planning Process PPT Slides-This diagram depicting the process of financial planning. Its so important to have a plan first. Most people fail financially because they just don Set a good example with our Business Circle Charts PowerPoint Templates Strategy Financial Planning Process Ppt Slides. Be the benchmark for others to follow.
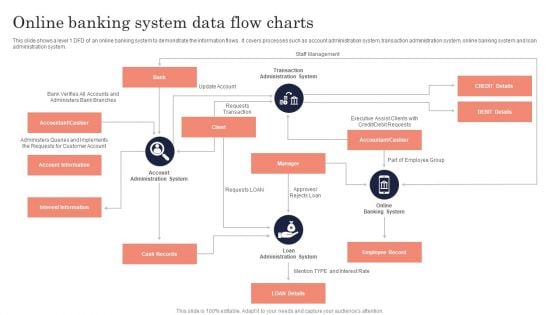
Online Banking System Data Flow Charts Ppt PowerPoint Presentation File Layout Ideas PDF
this slide shows a level 1 dfd of an online banking system to demonstrate the information flows. it covers processes such as account administration system, transaction administration system, online banking system and loan administration system. Persuade your audience using this Online Banking System Data Flow Charts Ppt PowerPoint Presentation File Layout Ideas PDF. This PPT design covers four stages, thus making it a great tool to use. It also caters to a variety of topics including Transaction Administration System, Accountant, Cashier, Employee Record. Download this PPT design now to present a convincing pitch that not only emphasizes the topic but also showcases your presentation skills.
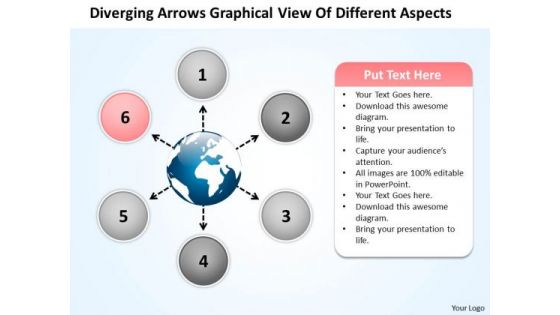
Arrows Graphical View Of Different Aspects Circlar Charts And Diagrams PowerPoint Templates
We present our arrows graphical view of different aspects circlar Charts and Diagrams PowerPoint templates.Use our Business PowerPoint Templates because like the famed William Tell, they put aside all emotions and concentrate on the target. Download our Flow Charts PowerPoint Templates because you can Amplify your views, ideas and thoughts from very basic aspects to the highly technical and complicated issus using this template as a tool. Present our Ring Charts PowerPoint Templates because this slide shows each path to the smallest detail. Present our Shapes PowerPoint Templates because it describes the benefits of healthy food habits and lifestyles in respect of vital organs of the human anatomy. Use our Process and Flows PowerPoint Templates because this diagram helps you to harness the opportunities, celebrate your performance till date and focus on greater growth and expansion in coming years.Use these PowerPoint slides for presentations relating to Arrows, Blank, Business, Chart, Circle, Circular, Circulation, Concept, Conceptual, Converging, Design, Diagram, Empty, Executive, Five, Icon, Illustration, Management, Pointing, Procedure, Process, Relationship, Resource, Sequence, Sequential, Strategy, Template. The prominent colors used in the PowerPoint template are Pink, Gray, White. Presenters tell us our arrows graphical view of different aspects circlar Charts and Diagrams PowerPoint templates help you meet deadlines which are an element of today's workplace. Just browse and pick the slides that appeal to your intuitive senses. We assure you our Circulation PowerPoint templates and PPT Slides are Perfect. Presenters tell us our arrows graphical view of different aspects circlar Charts and Diagrams PowerPoint templates are Nifty. Use our Circulation PowerPoint templates and PPT Slides are Perfect. We assure you our arrows graphical view of different aspects circlar Charts and Diagrams PowerPoint templates are Detailed. You can be sure our Business PowerPoint templates and PPT Slides are Perfect. They say appropriate facial expressions aid communication. Our Arrows Graphical View Of Different Aspects Circlar Charts And Diagrams PowerPoint Templates can be effective too.
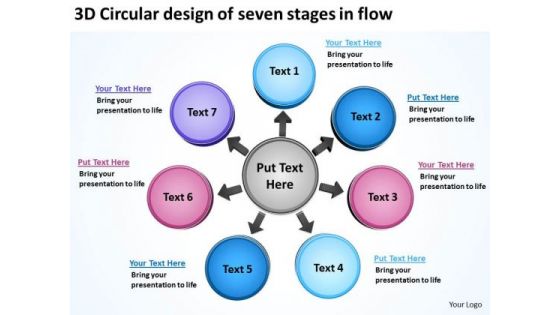
3d Circular Design Of Seven Stages In Flow Charts And Diagrams PowerPoint Templates
We present our 3d circular design of seven stages in flow Charts and Diagrams PowerPoint templates.Download our Circle Charts PowerPoint Templates because using our templates for your colleagues will impart knowledge to feed. Download our Arrows PowerPoint Templates because you have developed a vision of where you want to be a few years from now. Present our Business PowerPoint Templates because the great Bald headed Eagle embodies your personality. the eagle eye to seize upon the smallest of opportunities. Use our Shapes PowerPoint Templates because using our templates for your colleagues will impart knowledge to feed. Use our Flow Charts PowerPoint Templates because you can blaze a brilliant trail from point to point.Use these PowerPoint slides for presentations relating to 7, abstract, blank, business, central, centralized, chart, circular, circulation, concept, conceptual, converging, design, diagram, empty, executive, icon, idea, illustration, management, map, mapping, mba, model, numbers, organization, procedure, process, radial, relationship, resource, sequence, sequential, seven, strategy, template. The prominent colors used in the PowerPoint template are Pink, Blue, Purple. Customers tell us our 3d circular design of seven stages in flow Charts and Diagrams PowerPoint templates are Cheerful. PowerPoint presentation experts tell us our circulation PowerPoint templates and PPT Slides are Versatile. People tell us our 3d circular design of seven stages in flow Charts and Diagrams PowerPoint templates are Glamorous. People tell us our centralized PowerPoint templates and PPT Slides are Adorable. Customers tell us our 3d circular design of seven stages in flow Charts and Diagrams PowerPoint templates are Vintage. People tell us our business PowerPoint templates and PPT Slides will impress their bosses and teams. Get rid of banality with our 3d Circular Design Of Seven Stages In Flow Charts And Diagrams PowerPoint Templates. Take any boredom out of the equation.
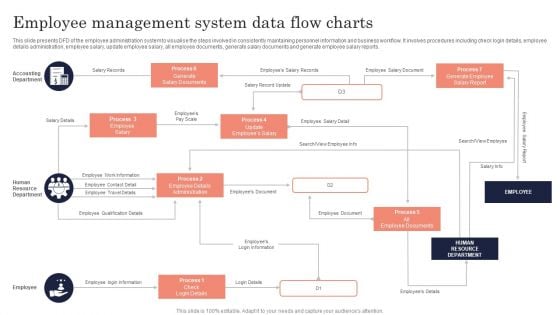
Employee Management System Data Flow Charts Ppt PowerPoint Presentation File Clipart Images PDF
Persuade your audience using this Employee Management System Data Flow Charts Ppt PowerPoint Presentation File Clipart Images PDF. This PPT design covers three stages, thus making it a great tool to use. It also caters to a variety of topics including Accounting Department, Human Resource Department, Employee. Download this PPT design now to present a convincing pitch that not only emphasizes the topic but also showcases your presentation skills.
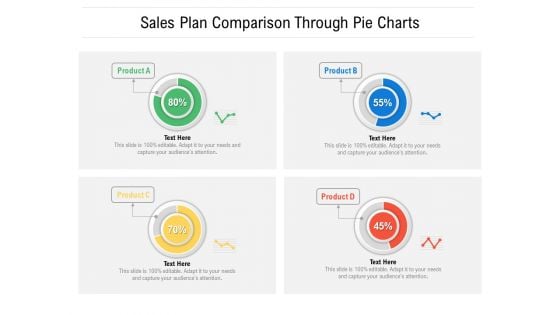
Sales Plan Comparison Through Pie Charts Ppt PowerPoint Presentation File Format Ideas PDF
Showcasing this set of slides titled sales plan comparison through pie charts ppt powerpoint presentation file format ideas pdf. The topics addressed in these templates are sales plan comparison through pie charts. All the content presented in this PPT design is completely editable. Download it and make adjustments in color, background, font etc. as per your unique business setting.
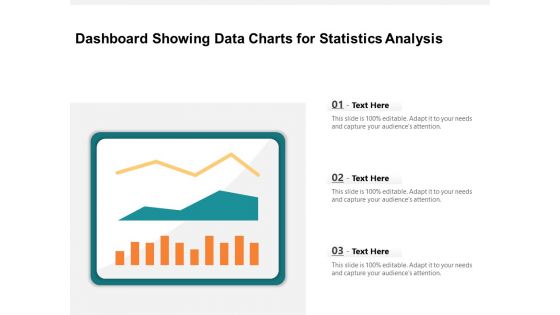
Dashboard Showing Data Charts For Statistics Analysis Ppt PowerPoint Presentation Infographic Template Grid PDF
Pitch your topic with ease and precision using this dashboard showing data charts for statistics analysis ppt powerpoint presentation infographic template grid pdf. This layout presents information on dashboard showing data charts for statistics analysis. It is also available for immediate download and adjustment. So, changes can be made in the color, design, graphics or any other component to create a unique layout.
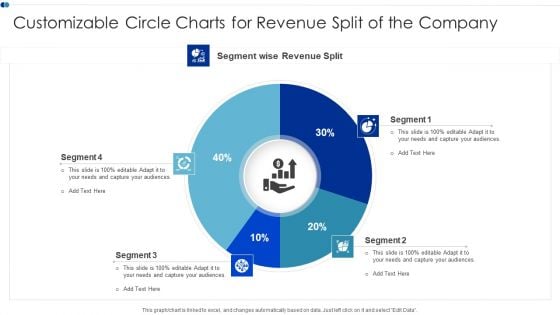
Customizable Circle Charts For Revenue Split Of The Company Graphics PDF
Showcasing this set of slides titled Customizable Circle Charts For Revenue Split Of The Company Graphics PDF The topics addressed in these templates are Customizable Circle, Charts Revenue, Split Company All the content presented in this PPT design is completely editable. Download it and make adjustments in color, background, font etc. as per your unique business setting.
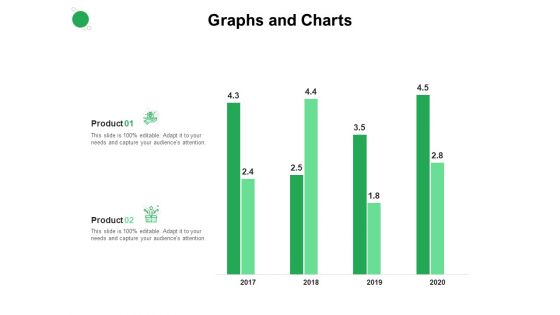
Values Promised By Company Graphs And Charts Ppt Show Model PDF
Presenting this set of slides with name values promised by company graphs and charts ppt show model pdf. The topics discussed in these slides are graphs and charts. This is a completely editable PowerPoint presentation and is available for immediate download. Download now and impress your audience.
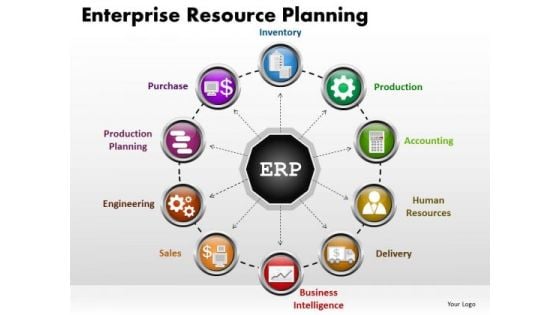
Business Circle Charts PowerPoint Templates Strategy Enterprise Resource Planning Ppt Slides
Business Circle Charts PowerPoint Templates Strategy Enterprise Resource Planning PPT Slides-This circle chart shows various interrelated circles can be used for factors involved in stragey enterprise resource planning-Business Circle Charts PowerPoint Templates Strategy Enterprise Resource Planning PPT Slides-This template can be used for presentations relating to 3d, Arrow, Blueprint, Business, Circle, Cleverness, Commerce, Company, Competence, Concept, Constructive, Corporate, Create, Creative, Creativity, Decision, Design, Develop, Device, Discover, Earn, Enterprise, Finance, Goal, Idea, Imaginative, Ingenious, Innovative, Inspiration, Inspire, Inventive, Job, Management, Market Operate efficiently with our Business Circle Charts PowerPoint Templates Strategy Enterprise Resource Planning Ppt Slides. Download without worries with our money back guaranteee.
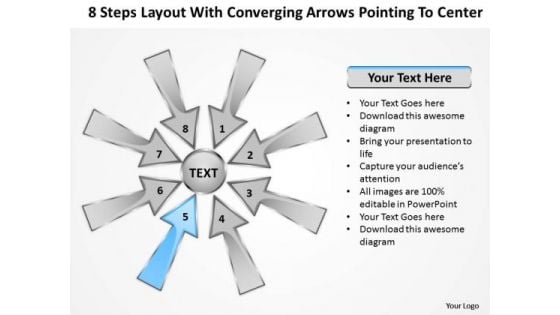
Steps Layout With Converging Arrows Pointing To Center Charts And Diagrams PowerPoint Slides
We present our steps layout with converging arrows pointing to center Charts and Diagrams PowerPoint Slides.Present our Arrows PowerPoint Templates because it focuses the light on the path to sure shot success. Download and present our Circle Charts PowerPoint Templates because you have a good idea of the roadmap to your desired destination. Download and present our Shapes PowerPoint Templates because this diagram provides trainers a tool to teach the procedure in a highly visual, engaging way. Present our Business PowerPoint Templates because it enlightens your team and colleagues on the critical factors involved. Present our Flow Charts PowerPoint Templates because it outlines the process with this innovative graphic to authenticate your plan of achieving the goal of added value/profit.Use these PowerPoint slides for presentations relating to 3d, abstract, all, around, arrow, aspect, attention, attract, blue, center, collect, colorful, conceptual, converge, course, cutout, direct, direction, factor, gather, globalization, go, green, guide, illustration, indicate, integration, isolated, location, many, movement, point, pointer, rainbow, reach, red, round, show, sides, sign, source, sphere, strategy, summon, symbol, target, unity, way, white, yellow. The prominent colors used in the PowerPoint template are Blue, Gray, Black. Presenters tell us our steps layout with converging arrows pointing to center Charts and Diagrams PowerPoint Slides are Royal. The feedback we get is that our aspect PowerPoint templates and PPT Slides are Clever. Presenters tell us our steps layout with converging arrows pointing to center Charts and Diagrams PowerPoint Slides are designed to make your presentations professional. You can be sure our attention PowerPoint templates and PPT Slides are Spectacular. People tell us our steps layout with converging arrows pointing to center Charts and Diagrams PowerPoint Slides are Ultra. PowerPoint presentation experts tell us our attract PowerPoint templates and PPT Slides are Endearing. Monitor plans with our Steps Layout With Converging Arrows Pointing To Center Charts And Diagrams PowerPoint Slides. Download without worries with our money back guaranteee.
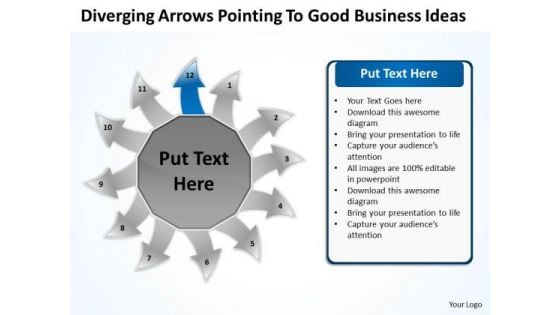
To Good New Business PowerPoint Presentation Ideas Charts And Networks Slides
We present our to good new business powerpoint presentation ideas Charts and Networks Slides.Present our Arrows PowerPoint Templates because clarity of thought has been the key to your growth. Present our Circle Charts PowerPoint Templates because you have analysed the illness and know the need. Download and present our Shapes PowerPoint Templates because you can put down your ideas and present them using our innovative templates. Download our Business PowerPoint Templates because Building castles in the sand is a danger and you are aware of. You have taken the precaution of building strong fundamentals. Download our Flow Charts PowerPoint Templates because it unravels the process layer by layer and exposes their relevance to the core issue.Use these PowerPoint slides for presentations relating to ahead, aim, aqua, arrow, back, backward, blue, circle, colorful, converge, converging, course, direction, diverge, diverging, green, header, illustration, left, move, movement, orange, orientation, point, red, right, ring, round, trend, vector, way, yellow. The prominent colors used in the PowerPoint template are Blue, Gray, Black. Presenters tell us our to good new business powerpoint presentation ideas Charts and Networks Slides are Chic. The feedback we get is that our aqua PowerPoint templates and PPT Slides are Wistful. Presenters tell us our to good new business powerpoint presentation ideas Charts and Networks Slides are Attractive. You can be sure our arrow PowerPoint templates and PPT Slides are Ritzy. People tell us our to good new business powerpoint presentation ideas Charts and Networks Slides are designed to make your presentations professional. PowerPoint presentation experts tell us our blue PowerPoint templates and PPT Slides are Liberated. Imagine winning it all with our To Good New Business PowerPoint Presentation Ideas Charts And Networks Slides. Download without worries with our money back guaranteee.
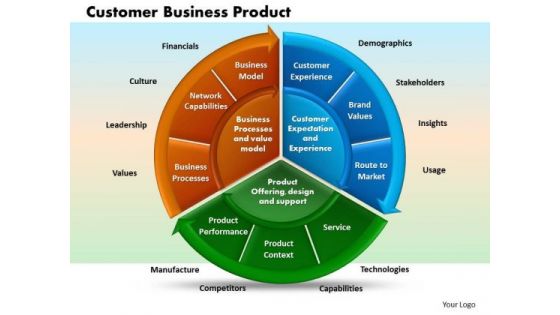
Business Circle Charts PowerPoint Templates Business Customer Business Product Ppt Slides
Business Circle Charts PowerPoint Templates Business customer business product PPT Slides-This PowerPoint diagram shows factors involved in a customer business product strategy -Business Circle Charts PowerPoint Templates Business customer business product PPT Slides-This template can be used for presentations relating to Aim, Arrow, Background, Business, Commerce, Conceptual, Customer, Finance, Financial, Gain, Growth, Illustration, Industry, Investment, Law, Legal, Manufacturing, Metaphor, Money, Objective, Product, Professional, Profit, Quality, Retail, Rights, Sale, Shop, Shopping, Success, Teamwork Find the perfect fit with our Business Circle Charts PowerPoint Templates Business Customer Business Product Ppt Slides. Try us out and see what a difference our templates make.


 Continue with Email

 Home
Home


