Cost Chart
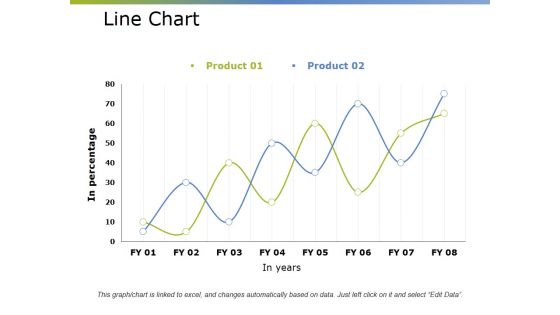
Line Chart Ppt PowerPoint Presentation Professional Gridlines
This is a line chart ppt powerpoint presentation professional gridlines. This is a two stage process. The stages in this process are business, marketing, growth, success, line chart.
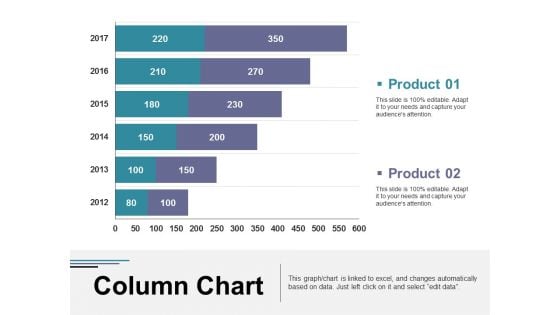
Column Chart Ppt PowerPoint Presentation Portfolio Outline
This is a column chart ppt powerpoint presentation portfolio outline. This is a two stage process. The stages in this process are column chart, business, marketing, graph, strategy.
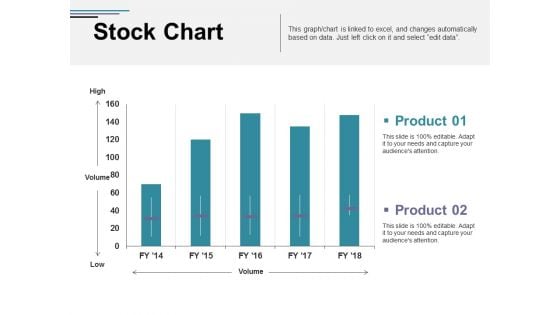
Stock Chart Ppt PowerPoint Presentation Pictures Model
This is a stock chart ppt powerpoint presentation pictures model. This is a two stage process. The stages in this process are business, high, volume, low, chart.
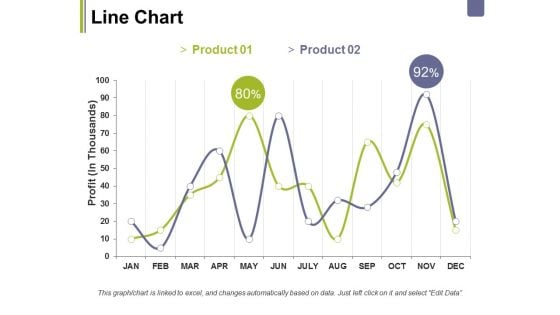
Line Chart Ppt PowerPoint Presentation Layouts Topics
This is a line chart ppt powerpoint presentation layouts topics. This is a two stage process. The stages in this process are business, profit, chart, percentage, graph, marketing.
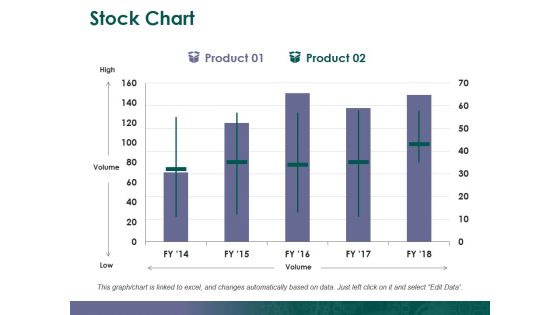
Stock Chart Ppt PowerPoint Presentation Outline Introduction
This is a stock chart ppt powerpoint presentation outline introduction. This is a two stage process. The stages in this process are stock chart, high, volume, low.
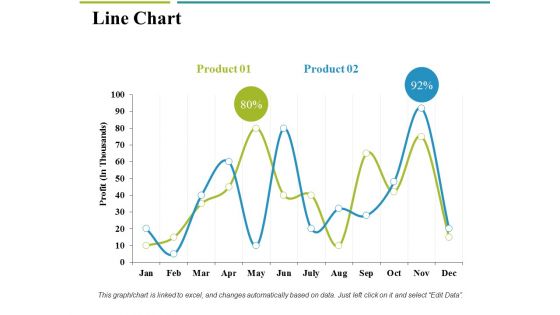
Line Chart Ppt PowerPoint Presentation Portfolio Deck
This is a line chart ppt powerpoint presentation portfolio deck. This is a two stage process. The stages in this process are business, marketing, profit, chart, percentage.
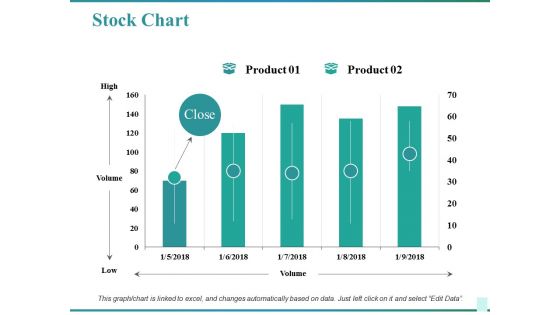
Stock Chart Ppt PowerPoint Presentation Pictures Microsoft
This is a stock chart ppt powerpoint presentation pictures microsoft. This is a two stage process. The stages in this process are business, high, volume, low, chart.
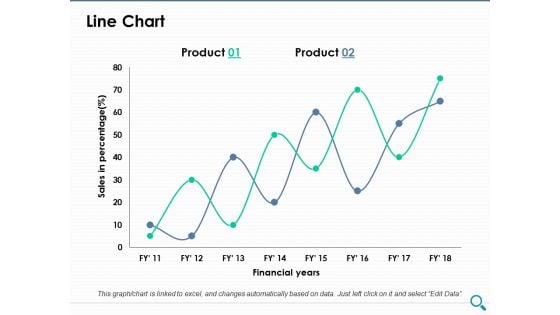
Line Chart Ppt PowerPoint Presentation Model Model
This is a line chart ppt powerpoint presentation model model. This is a two stage process. The stages in this process are line chart, growth, strategy, business, analysis.
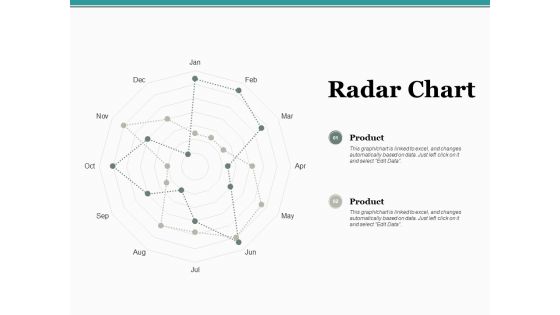
Radar Chart Ppt PowerPoint Presentation Professional Ideas
This is a radar chart ppt powerpoint presentation professional ideas. This is a two stage process. The stages in this process are product, percentage, management, marketing, chart.
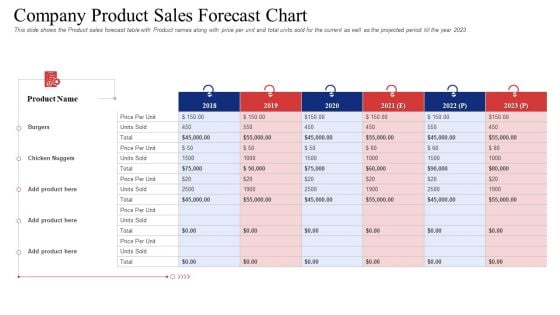
Company Product Sales Forecast Chart Guidelines PDF
This slide shows the Product sales forecast table with Product names along with price per unit and total units sold for the current as well as the projected period till the year 2023 Deliver an awe inspiring pitch with this creative company product sales forecast chart guidelines pdf bundle. Topics like company product sales forecast chart can be discussed with this completely editable template. It is available for immediate download depending on the needs and requirements of the user.
Combo Chart Ppt PowerPoint Presentation Icon Portrait
This is a combo chart ppt powerpoint presentation icon portrait. This is a three stage process. The stages in this process are combo chart, finance, marketing, strategy, analysis.
Pie Chart Ppt PowerPoint Presentation Outline Icons
This is a pie chart ppt powerpoint presentation outline icons. This is a three stage process. The stages in this process are pie chart, finance, marketing, strategy, business.
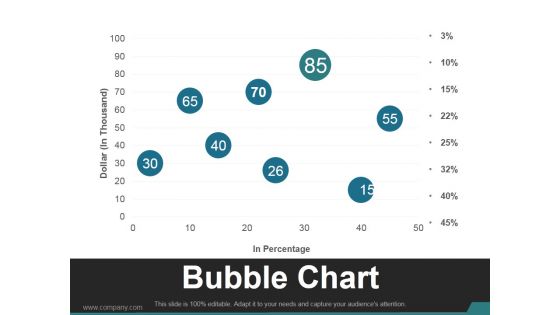
Bubble Chart Ppt PowerPoint Presentation Slide
This is a bubble chart ppt powerpoint presentation slide. This is a eight stage process. The stages in this process are business, marketing, finance, chart, management.
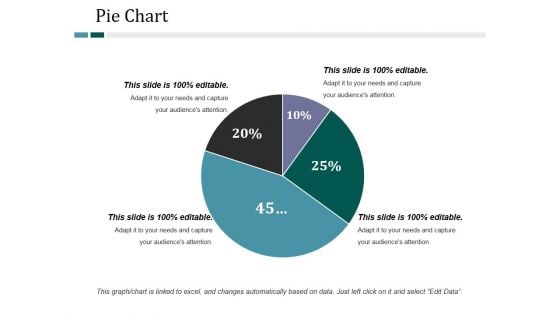
Pie Chart Ppt PowerPoint Presentation Ideas Microsoft
This is a pie chart ppt powerpoint presentation ideas microsoft. This is a four stage process. The stages in this process are pie chart, finance, marketing, strategy, business.
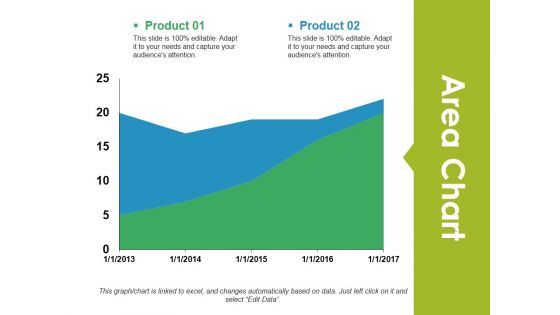
Area Chart Ppt PowerPoint Presentation Outline Deck
This is a area chart ppt powerpoint presentation outline deck. This is a two stage process. The stages in this process are area chart, finance, marketing, analysis, business.
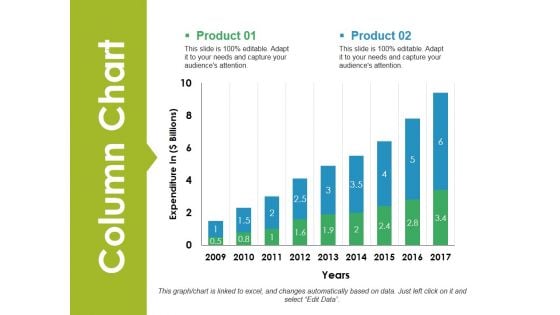
Column Chart Ppt PowerPoint Presentation File Graphics
This is a column chart ppt powerpoint presentation file graphics. This is a two stage process. The stages in this process are column chart, finance, analysis, marketing, business.
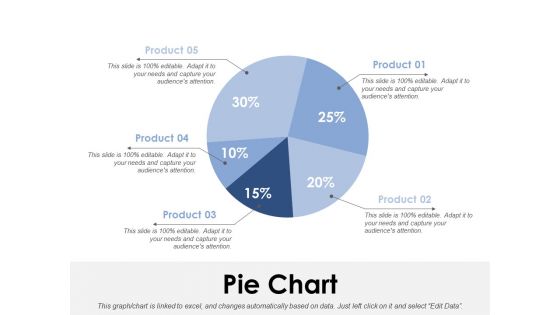
Pie Chart Ppt PowerPoint Presentation Outline Gallery
This is a pie chart ppt powerpoint presentation outline gallery. This is a five stage process. The stages in this process are pie chart, finance, marketing, strategy, analysis.
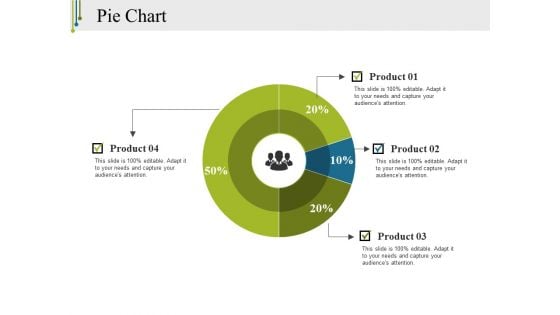
Pie Chart Ppt PowerPoint Presentation Infographics Clipart
This is a pie chart ppt powerpoint presentation infographics clipart. This is a four stage process. The stages in this process are pie chart, finance, marketing, strategy, business.
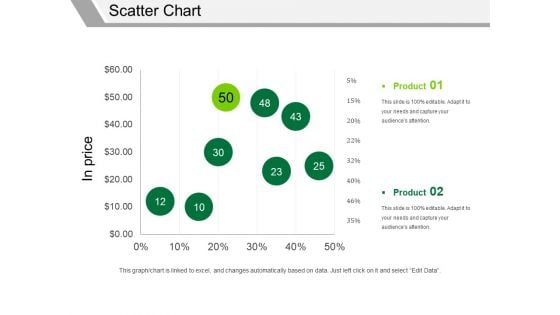
Scatter Chart Ppt PowerPoint Presentation Pictures Elements
This is a scatter chart ppt powerpoint presentation pictures elements. This is a two stage process. The stages in this process are in price, product, finance, business, marketing.
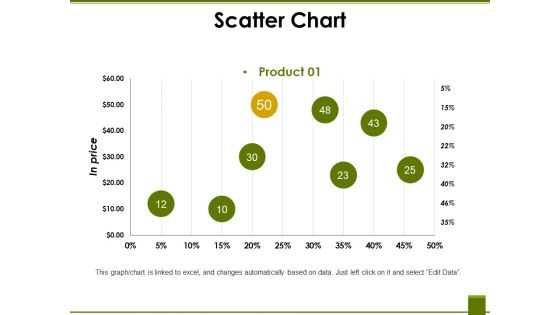
Scatter Chart Ppt PowerPoint Presentation File Display
This is a scatter chart ppt powerpoint presentation file display. This is a eight stage process. The stages in this process are product, business, marketing, finance, in price.
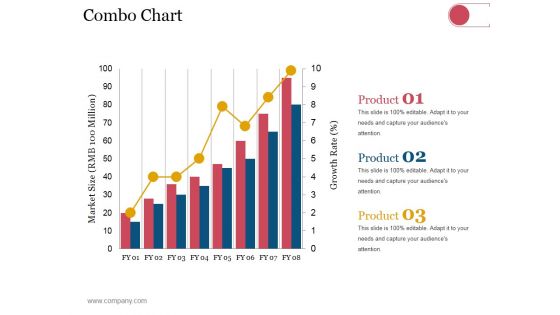
Combo Chart Ppt PowerPoint Presentation Inspiration Information
This is a combo chart ppt powerpoint presentation inspiration information. This is a eight stage process. The stages in this process are business, strategy, analysis, planning, combo chart, market size, growth rate.
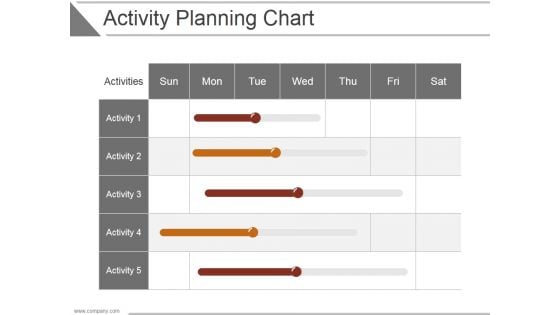
Activity Planning Chart Ppt PowerPoint Presentation Backgrounds
This is a activity planning chart ppt powerpoint presentation backgrounds. This is a five stage process. The stages in this process are business, strategy, analysis, marketing, chart and graph, compare.
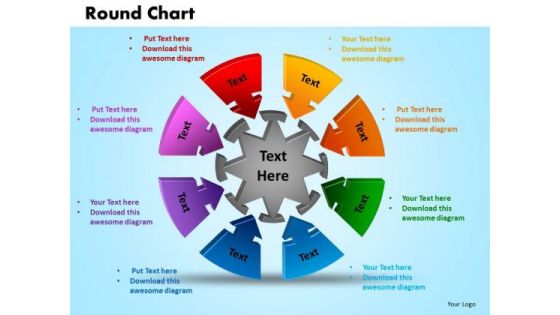
PowerPoint Theme Round Chart Marketing Ppt Slides
PowerPoint Theme Round Chart Marketing PPT Slides-This Diagram shows you the eight factors responsible for economic growth in Business .It can be used for creating Business presentations where four factors combined to result in one factor.-PowerPoint Theme Round Chart Marketing PPT Slides Present pioneering technologies with our PowerPoint Theme Round Chart Marketing Ppt Slides. They will make you look good.
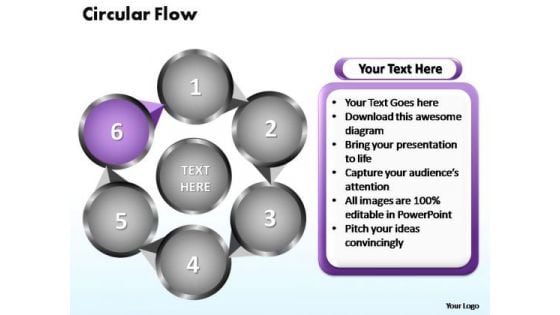
PowerPoint Themes Circular Flow Chart Ppt Slide
PowerPoint Themes Circular Flow Chart PPT Slide-Flowchart is a simple mapping tool that shows the sequence of actions within a process. Flowchart is widely used in business, education and economic presentations to help the audience visualize the content better, or to find flaws in a process.-PowerPoint Themes Circular Flow Chart PPT Slide Intensify growth with our PowerPoint Themes Circular Flow Chart Ppt Slide. Download without worries with our money back guaranteee.
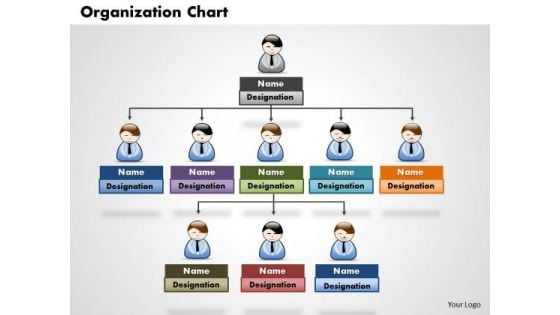
Business Diagram Organization Chart PowerPoint Ppt Presentation
Open Up Doors That Lead To Success. Our Business Diagram Organization chart PowerPoint PPT Presentation PowerPoint Templates Provide The Handles.

Business Diagram Organizational Chart PowerPoint Ppt Presentation
Our Business Diagram Organizational Chart PowerPoint PPT Presentation PowerPoint Templates Abhor Doodling. They Never Let The Interest Flag.
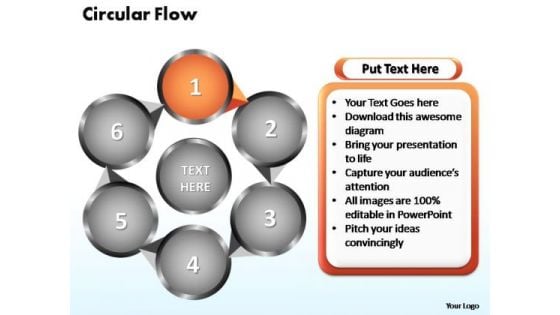
PowerPoint Themes Circular Flow Chart Ppt Template
PowerPoint Themes Circular Flow Chart PPT Template-Flowchart is a simple mapping tool that shows the sequence of actions within a process. Flowchart is widely used in business, education and economic presentations to help the audience visualize the content better, or to find flaws in a process.-PowerPoint Themes Circular Flow Chart PPT Template Our PowerPoint Themes Circular Flow Chart Ppt Template will ensure you make an impressive presentation You will be glad you tried us out.
PowerPoint Themes Circular Flow Chart Ppt Templates
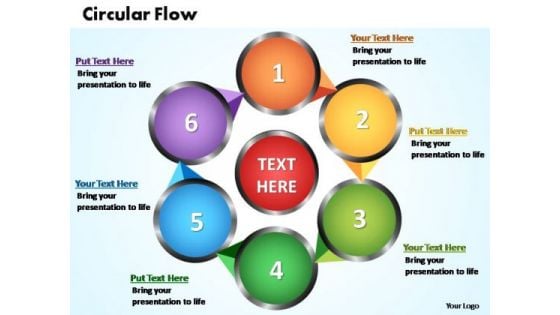
PowerPoint Themes Circular Flow Chart PPT Templates-Flowchart is a simple mapping tool that shows the sequence of actions within a process. Flowchart is widely used in business, education and economic presentations to help the audience visualize the content better, or to find flaws in a process.-PowerPoint Themes Circular Flow Chart PPT Templates Your thoughts and our PowerPoint Themes Circular Flow Chart Ppt Templates will make an excellent ensemble. They will capture all awards.
PowerPoint Themes Circular Flow Chart Ppt Theme
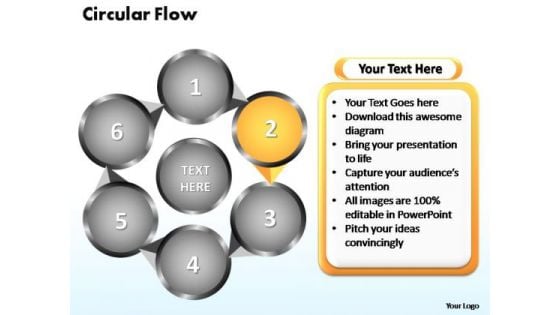
PowerPoint Themes Circular Flow Chart PPT Theme-Flowchart is a simple mapping tool that shows the sequence of actions within a process. Flowchart is widely used in business, education and economic presentations to help the audience visualize the content better, or to find flaws in a process.-PowerPoint Themes Circular Flow Chart PPT Theme Become a brand with our PowerPoint Themes Circular Flow Chart Ppt Theme. Build on your expertise with their assistance.
PowerPoint Themes Circular Flow Chart Ppt Design
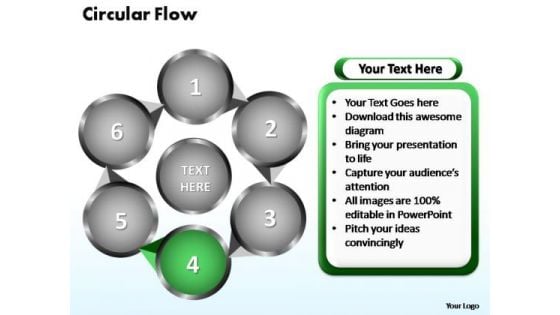
PowerPoint Themes Circular Flow Chart PPT Design-Flowchart is a simple mapping tool that shows the sequence of actions within a process. Flowchart is widely used in business, education and economic presentations to help the audience visualize the content better, or to find flaws in a process.-PowerPoint Themes Circular Flow Chart PPT Design Display performance management with our PowerPoint Themes Circular Flow Chart Ppt Design. They will make you look good.
PowerPoint Themes Circular Flow Chart Ppt Designs
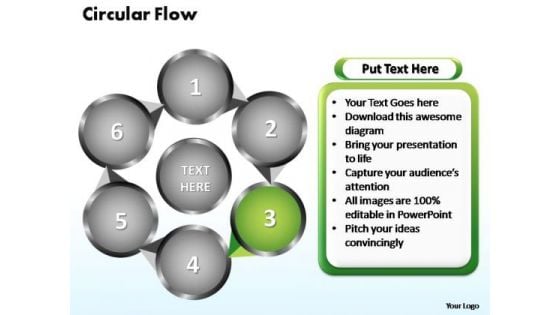
PowerPoint Themes Circular Flow Chart PPT Designs-Flowchart is a simple mapping tool that shows the sequence of actions within a process. Flowchart is widely used in business, education and economic presentations to help the audience visualize the content better, or to find flaws in a process.-PowerPoint Themes Circular Flow Chart PPT Designs Advertise your product with our PowerPoint Themes Circular Flow Chart Ppt Designs. Just download, type and present.
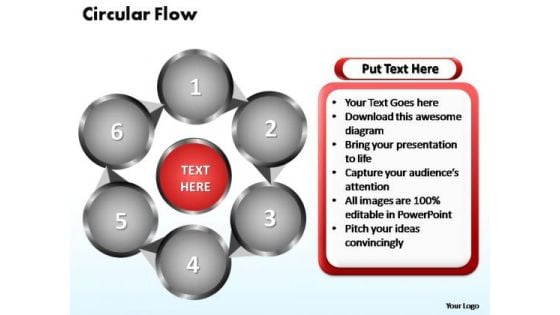
PowerPoint Themes Circular Flow Chart Ppt Layouts
PowerPoint Themes Circular Flow Chart PPT Layouts-Flowchart is a simple mapping tool that shows the sequence of actions within a process. Flowchart is widely used in business, education and economic presentations to help the audience visualize the content better, or to find flaws in a process.-PowerPoint Themes Circular Flow Chart PPT Layouts Our PowerPoint Themes Circular Flow Chart Ppt Layouts have no failings. They have been designed with attention to detail.
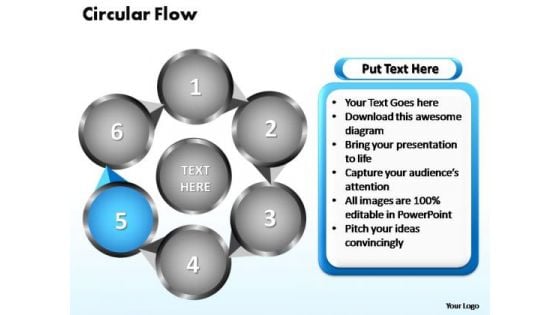
PowerPoint Themes Circular Flow Chart Ppt Slides
PowerPoint Themes Circular Flow Chart PPT Slides-Flowchart is a simple mapping tool that shows the sequence of actions within a process. Flowchart is widely used in business, education and economic presentations to help the audience visualize the content better, or to find flaws in a process.-PowerPoint Themes Circular Flow Chart PPT Slides Our PowerPoint Themes Circular Flow Chart Ppt Slides are cent per cent adaptable. They conform to all conditions.
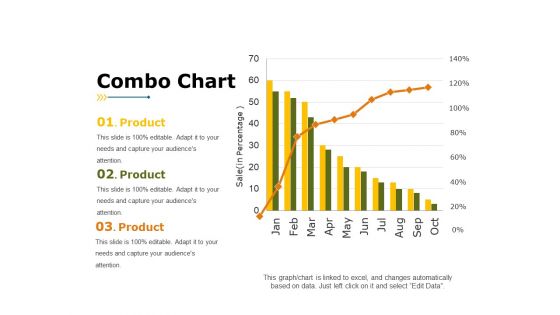
Combo Chart Ppt PowerPoint Presentation Portfolio Template
This is a combo chart ppt powerpoint presentation portfolio template. This is a three stage process. The stages in this process are product, business, marketing, combo chart, percentage.
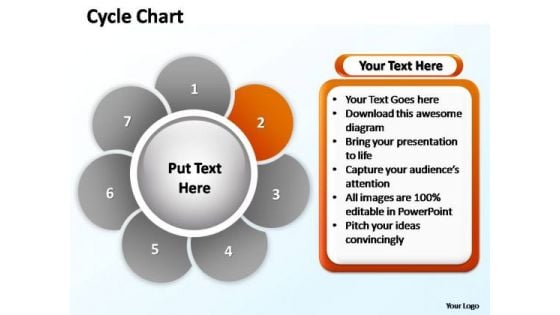
PowerPoint Slides Growth Cycle Chart Ppt Presentation
PowerPoint Slides Growth Cycle Chart PPT Presentation-Cycle Diagrams are a type of graphics that shows how items are related to one another in a repeating cycle. In a cycle diagram, you can explain the main events in the cycle, how they interact, and how the cycle repeats. These Diagrams can be used to interact visually and logically with audiences. -PowerPoint Slides Growth Cycle Chart PPT Presentation Imagine winning it all with our PowerPoint Slides Growth Cycle Chart Ppt Presentation. Download without worries with our money back guaranteee.
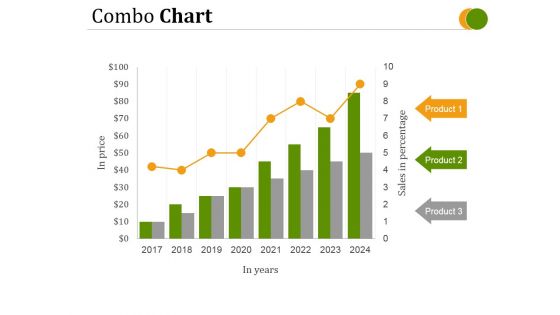
Combo Chart Ppt PowerPoint Presentation Deck
This is a combo chart ppt powerpoint presentation deck. This is a eight stage process. The stages in this process are in price, in years, product.
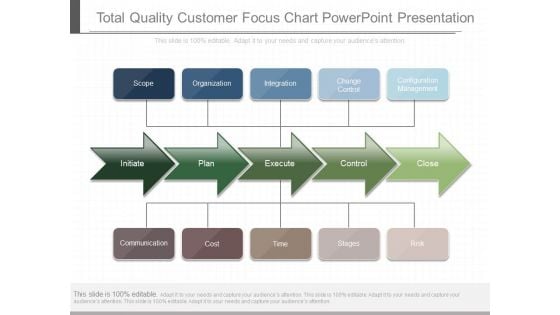
Total Quality Customer Focus Chart Powerpoint Presentation
This is a total quality customer focus chart powerpoint presentation. This is a five stage process. The stages in this process are scope, organization, integration, change control, configuration management, initiate, plan, execute, control, close, communication, cost, time, stages, risk.

Ecommerce Order Fulfillment Process Chart Ppt Slides
This is a ecommerce order fulfillment process chart ppt slides. This is a three stage process. The stages in this process are completely meet demand, fulfill at minimal cost, deliver at promised time.
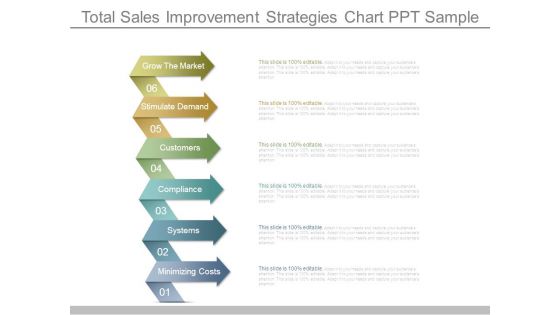
Total Sales Improvement Strategies Chart Ppt Sample
This is a total sales improvement strategies chart ppt sample. This is a six stage process. The stages in this process are grow the market, stimulate demand, customers, compliance, systems, minimizing costs.
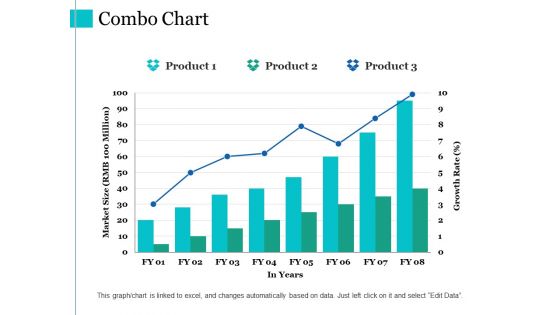
Combo Chart Ppt PowerPoint Presentation Gallery Diagrams
This is a combo chart ppt powerpoint presentation gallery diagrams. This is a three stage process. The stages in this process are combo chart, market size, product, in years, growth rate.
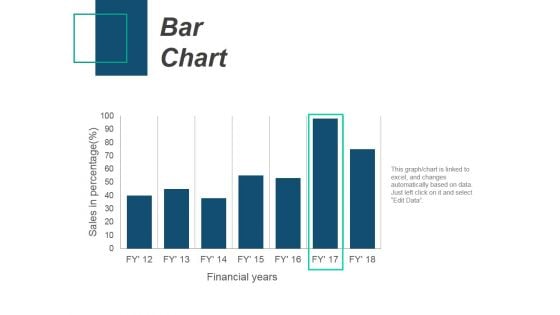
Bar Chart Ppt PowerPoint Presentation Professional Files
This is a bar chart ppt powerpoint presentation professional files. This is a seven stage process. The stages in this process are bar chart, product, sales in percentage, financial years.
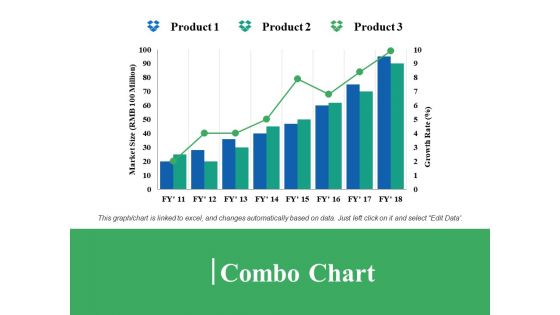
Combo Chart Ppt PowerPoint Presentation Model Microsoft
This is a combo chart ppt powerpoint presentation model microsoft. This is a three stage process. The stages in this process are combo chart, product, market size, growth rate.
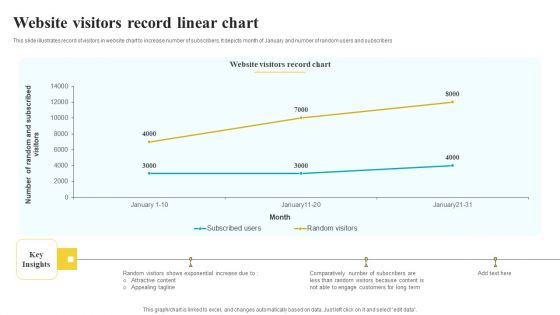
Website Visitors Record Linear Chart Summary PDF
This slide illustrates record of visitors in website chart to increase number of subscribers. It depicts month of January and number of random users and subscribers Showcasing this set of slides titled Website Visitors Record Linear Chart Summary PDF. The topics addressed in these templates are Key Insights, Record Chart, Long Term. All the content presented in this PPT design is completely editable. Download it and make adjustments in color, background, font etc. as per your unique business setting.
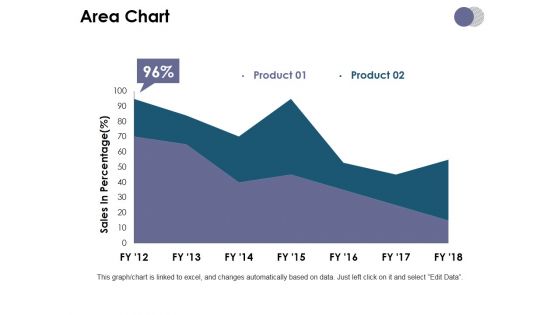
Area Chart Ppt PowerPoint Presentation Summary Format
This is a area chart ppt powerpoint presentation summary format. This is a two stage process. The stages in this process are area chart, planning, marketing, strategy, finance, business.
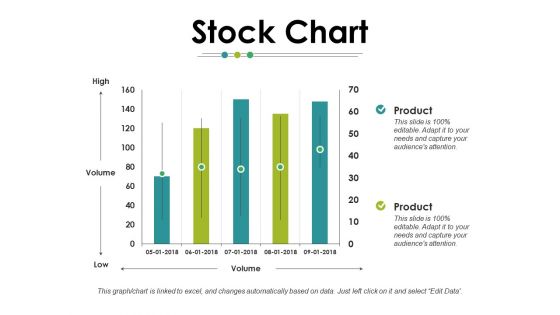
Stock Chart Ppt PowerPoint Presentation Infographics Smartart
This is a stock chart ppt powerpoint presentation infographics smartart. This is a two stages process. The stages in this process are stock chart, finance, business, planning, marketing, management.
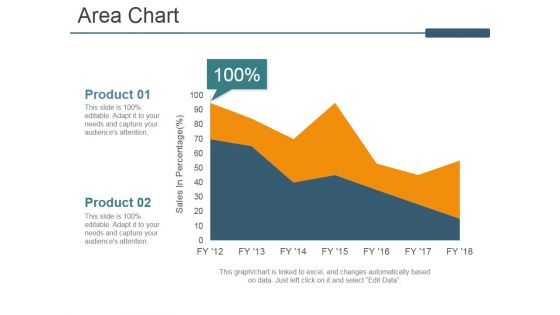
Area Chart Ppt PowerPoint Presentation Inspiration Rules
This is a area chart ppt powerpoint presentation inspiration rules. This is a two stage process. The stages in this process are area chart, business, marketing, sales in percentage, product.
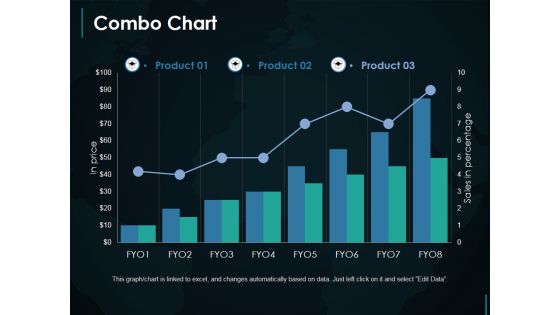
Combo Chart Ppt PowerPoint Presentation Gallery Themes
This is a combo chart ppt powerpoint presentation gallery themes. This is a three stage process. The stages in this process are combo chart, finance, marketing, strategy, investment, business.
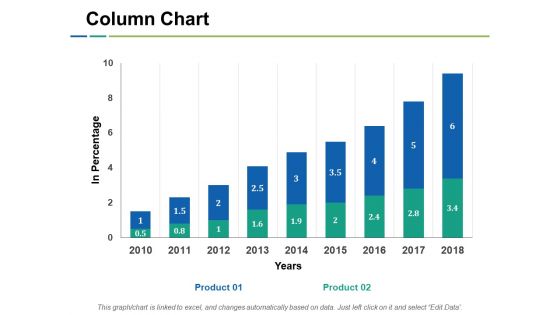
Column Chart Ppt PowerPoint Presentation Background Images
This is a column chart ppt powerpoint presentation background images. This is a two stage process. The stages in this process are column chart, financial, business, marketing, planning, strategy.
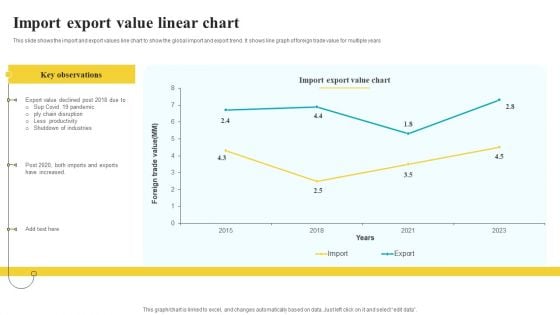
Import Export Value Linear Chart Summary PDF
This slide shows the import and export values line chart to show the global import and export trend. It shows line graph of foreign trade value for multiple years Showcasing this set of slides titled Import Export Value Linear Chart Summary PDF. The topics addressed in these templates are Key Observations, Value Chart, Industries. All the content presented in this PPT design is completely editable. Download it and make adjustments in color, background, font etc. as per your unique business setting.
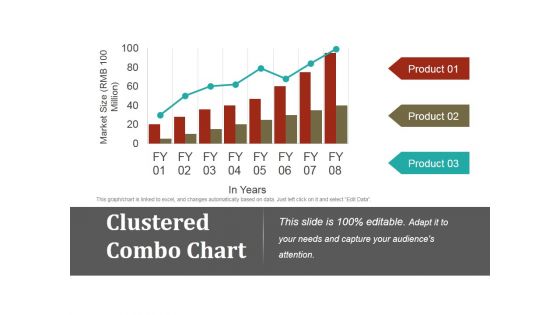
Clustered Combo Chart Ppt PowerPoint Presentation Show
This is a clustered combo chart ppt powerpoint presentation show. This is a eigth stage process. The stages in this process are clustered combo chart, finance, marketing, strategy, investment, business.
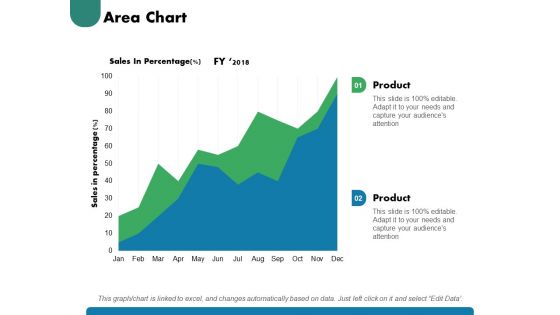
Area Chart Ppt PowerPoint Presentation Pictures Show
This is a area chart ppt powerpoint presentation pictures show. This is a two stage process. The stages in this process are area chart, finance, marketing, management, investment, analysis.
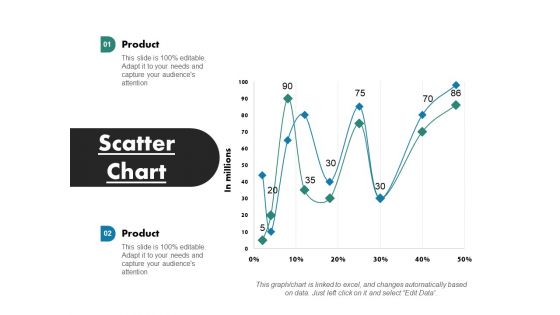
Scatter Chart Ppt PowerPoint Presentation Infographics Designs
This is a scatter chart ppt powerpoint presentation infographics designs. This is a two stage process. The stages in this process are scatter chart, finance, marketing, management, investment, analysis.
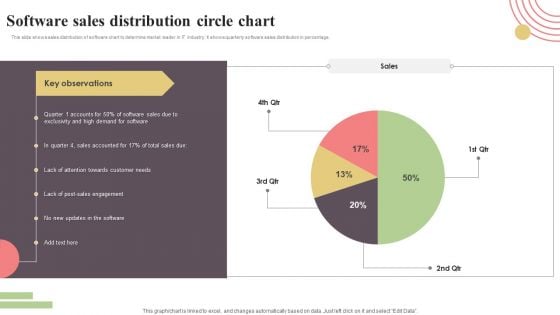
Software Sales Distribution Circle Chart Demonstration PDF
This slide shows sales distribution of software chart to determine market leader in IT industry. It shows quarterly software sales distribution in percentage. Pitch your topic with ease and precision using this Software Sales Distribution Circle Chart Demonstration PDF. This layout presents information on Software Sales Distribution, Circle Chart. It is also available for immediate download and adjustment. So, changes can be made in the color, design, graphics or any other component to create a unique layout.
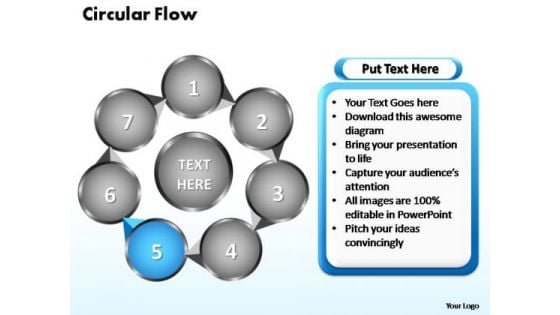
PowerPoint Designs Circular Flow Chart Ppt Design
PowerPoint Designs Circular Flow Chart PPT Design-Flowchart is a simple mapping tool that shows the sequence of actions within a process. Flowchart is widely used in business, education and economic presentations to help the audience visualize the content better, or to find flaws in a process.-PowerPoint Designs Circular Flow Chart PPT Design Lecture teams with our PowerPoint Designs Circular Flow Chart Ppt Design. Download without worries with our money back guaranteee.
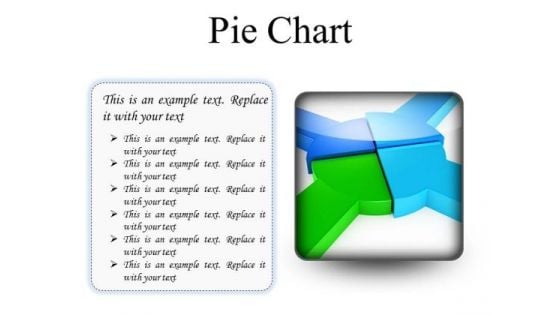
Pie Chart Business PowerPoint Presentation Slides S
Microsoft PowerPoint Slides and Backgrounds with render illustration of equal partnership pie chart Participate intelligently with our Pie Chart Business PowerPoint Presentation Slides S. Download without worries with our money back guaranteee.
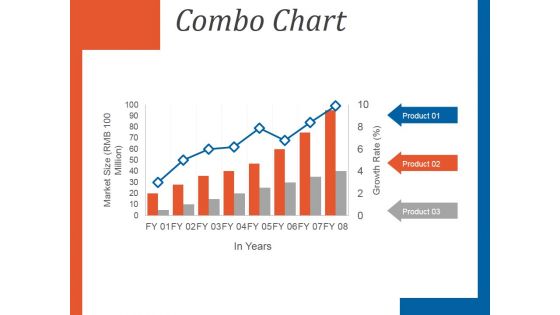
Combo Chart Ppt PowerPoint Presentation Design Ideas
This is a combo chart ppt powerpoint presentation design ideas. This is a eight stage process. The stages in this process are market size, combo chart, in years, product, growth rate.
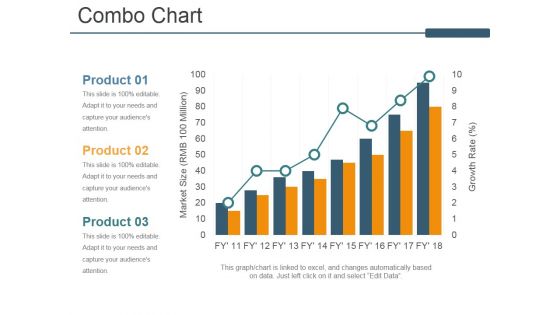
Combo Chart Ppt PowerPoint Presentation Layouts Portfolio
This is a combo chart ppt powerpoint presentation layouts portfolio. This is a three stage process. The stages in this process are combo chart, product, market size, growth rate.
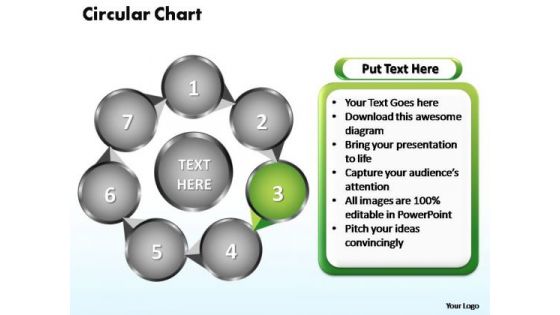
PowerPoint Designs Circular Flow Chart Ppt Theme
PowerPoint Designs Circular Flow Chart PPT Theme-Flowchart is a simple mapping tool that shows the sequence of actions within a process. Flowchart is widely used in business, education and economic presentations to help the audience visualize the content better, or to find flaws in a process.-PowerPoint Designs Circular Flow Chart PPT Theme Our PowerPoint Designs Circular Flow Chart Ppt Theme give it a festive look. Awe the audience with a decorative atmosphere.
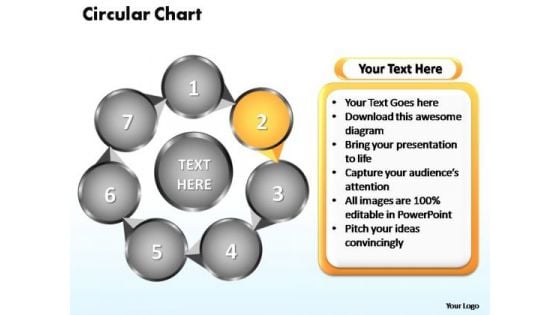
PowerPoint Designs Circular Flow Chart Ppt Themes
PowerPoint Designs Circular Flow Chart PPT Themes-Flowchart is a simple mapping tool that shows the sequence of actions within a process. Flowchart is widely used in business, education and economic presentations to help the audience visualize the content better, or to find flaws in a process.-PowerPoint Designs Circular Flow Chart PPT Themes Let our PowerPoint Designs Circular Flow Chart Ppt Themes dress up your thoughts. They will soon create a new fashion.
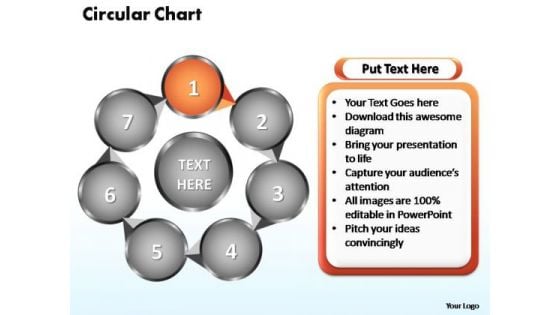
PowerPoint Designs Circular Flow Chart Ppt Template
PowerPoint Designs Circular Flow Chart PPT Template-Flowchart is a simple mapping tool that shows the sequence of actions within a process. Flowchart is widely used in business, education and economic presentations to help the audience visualize the content better, or to find flaws in a process.-PowerPoint Designs Circular Flow Chart PPT Template Learning from failures leads to success. Assimilate the lessons with our PowerPoint Designs Circular Flow Chart Ppt Template.


 Continue with Email

 Home
Home


