Cost Chart
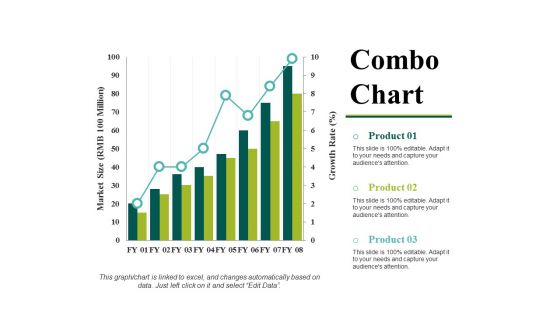
Combo Chart Ppt PowerPoint Presentation Show Information
This is a combo chart ppt powerpoint presentation show information. This is a three stage process. The stages in this process are business, marketing, strategy, planning, finance.
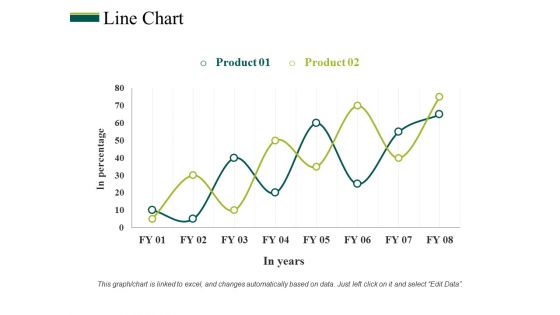
Line Chart Ppt PowerPoint Presentation Model Summary
This is a line chart ppt powerpoint presentation model summary. This is a two stage process. The stages in this process are business, marketing, strategy, planning, finance.
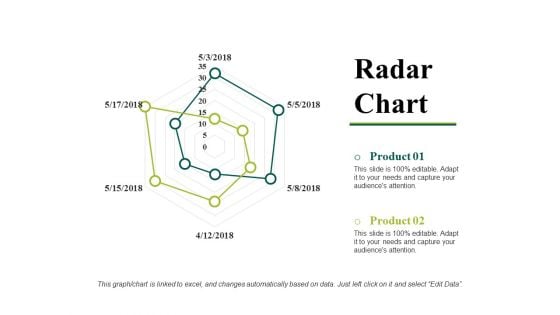
Radar Chart Ppt PowerPoint Presentation Model Objects
This is a radar chart ppt powerpoint presentation model objects. This is a two stage process. The stages in this process are business, marketing, strategy, planning, finance.
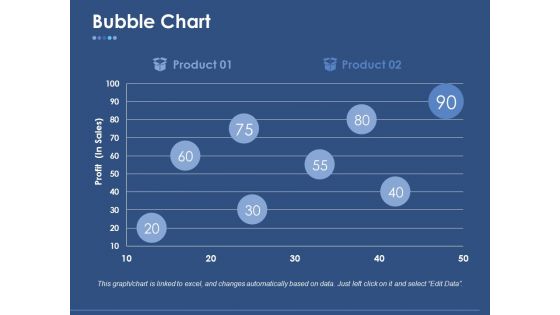
Bubble Chart Ppt PowerPoint Presentation Professional
This is a bubble chart ppt powerpoint presentation professional. This is a eight stage process. The stages in this process are business, marketing, strategy, planning, finance.
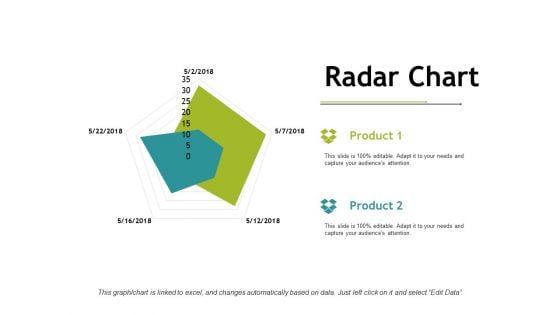
Radar Chart Ppt PowerPoint Presentation Model Slideshow
This is a radar chart ppt powerpoint presentation model slideshow. This is a two stage process. The stages in this process are finance, marketing, analysis, management, planning.
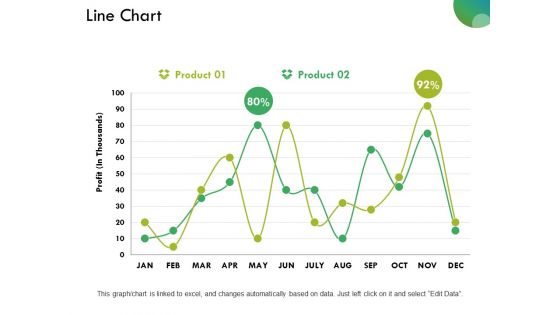
Line Chart Ppt PowerPoint Presentation Styles Backgrounds
This is a line chart ppt powerpoint presentation styles backgrounds. This is a three stage process. The stages in this process are business, marketing, strategy, planning, finance.
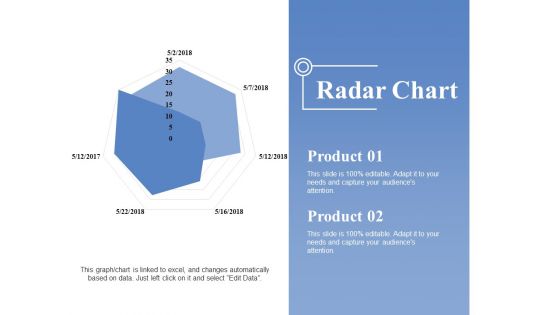
Radar Chart Ppt PowerPoint Presentation Shapes
This is a radar chart ppt powerpoint presentation shapes. This is a two stage process. The stages in this process are business, marketing, strategy, planning, finance.
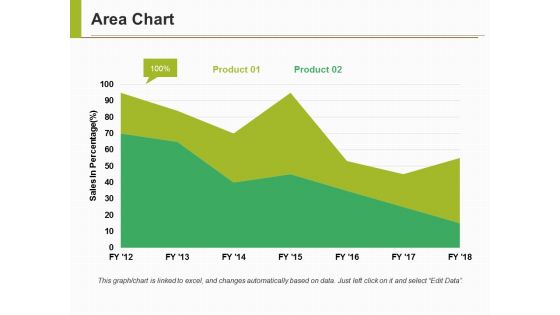
Area Chart Ppt PowerPoint Presentation Pictures Influencers
This is a area chart ppt powerpoint presentation pictures influencers. This is a two stage process. The stages in this process are business, marketing, strategy, finance, planning.
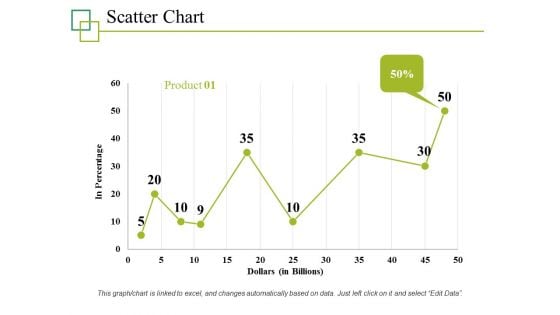
Scatter Chart Ppt PowerPoint Presentation File Graphics
This is a scatter chart ppt powerpoint presentation file graphics. This is a one stage process. The stages in this process are business, marketing, strategy, planning, finance.
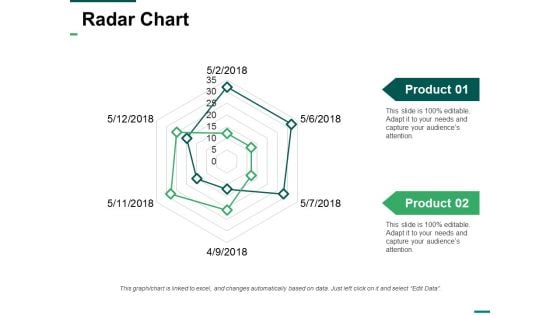
Radar Chart Ppt PowerPoint Presentation Slides Deck
This is a radar chart ppt powerpoint presentation slides deck. This is a two stage process. The stages in this process are radar, marketing, strategy, finance, planning.
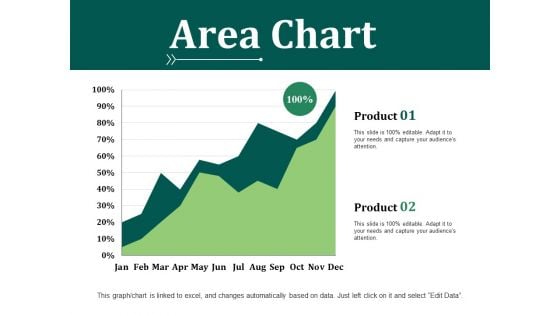
Area Chart Ppt PowerPoint Presentation Model Designs
This is a area chart ppt powerpoint presentation model designs. This is a three stage process. The stages in this process are business, marketing, strategy, planning, finance.
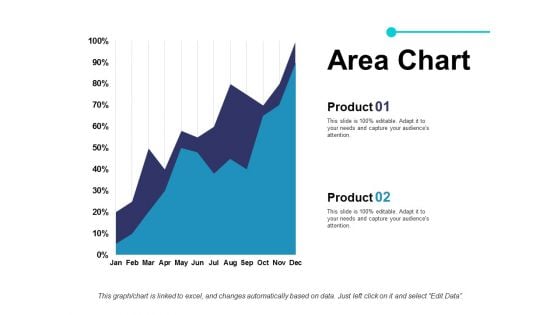
Area Chart Ppt PowerPoint Presentation File Outfit
This is a area chart ppt powerpoint presentation file outfit. This is a two stage process. The stages in this process are business, marketing, strategy, planning, finance.
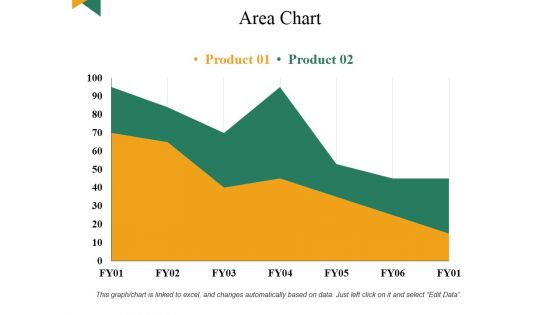
Area Chart Ppt PowerPoint Presentation Gallery Aids
This is a area chart ppt powerpoint presentation gallery aids. This is a two stage process. The stages in this process are business, graph, finance, marketing, planning.

Pie Chart Ppt PowerPoint Presentation Portfolio Maker
This is a pie chart ppt powerpoint presentation portfolio maker. This is a five stage process. The stages in this process are business, pie chart, finance, process, planning.

Product Pricing List Chart Ppt Slides
This is a product pricing list chart ppt slides. This is a four stage process. The stages in this process are arrows, business, marketing.
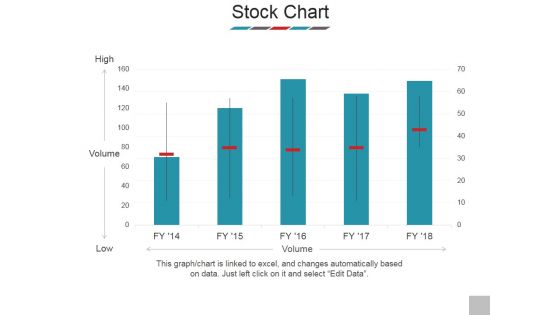
Stock Chart Ppt PowerPoint Presentation Show Templates
This is a stock chart ppt powerpoint presentation show templates. This is a five stage process. The stages in this process are high, volume, low, business, marketing.
Line Chart Ppt PowerPoint Presentation Icon Elements
This is a line chart ppt powerpoint presentation icon elements. This is a two stage process. The stages in this process are line graph, marketing, presentation, business, management.
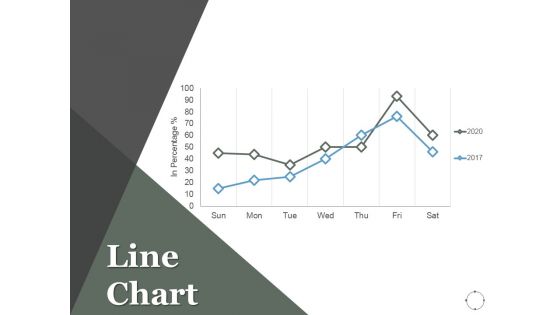
Line Chart Ppt PowerPoint Presentation Layouts Information
This is a line chart ppt powerpoint presentation layouts information. This is a two stage process. The stages in this process are business, marketing, line chart, analysis, growth.
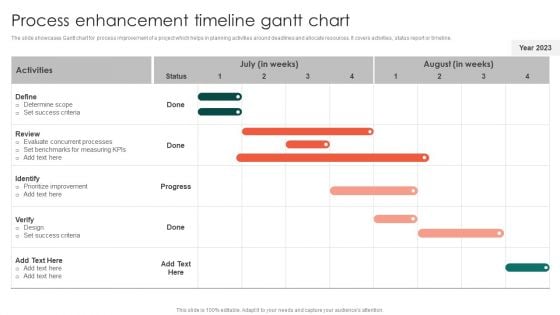
Process Enhancement Timeline Gantt Chart Clipart PDF
The slide showcases Gantt chart for process improvement of a project which helps in planning activities around deadlines and allocate resources. It covers activities, status report or timeline.Pitch your topic with ease and precision using this Process Enhancement Timeline Gantt Chart Clipart PDF. This layout presents information on Concurrent Processes, Prioritize Improvement, Determine Scope. It is also available for immediate download and adjustment. So, changes can be made in the color, design, graphics or any other component to create a unique layout.
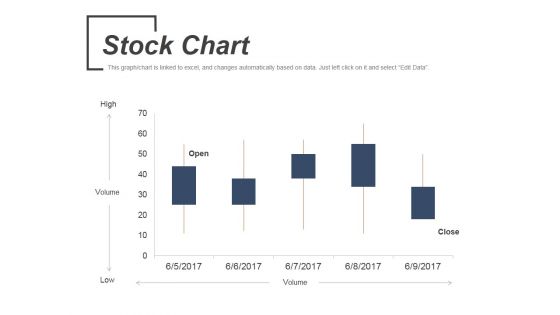
Stock Chart Ppt PowerPoint Presentation Ideas Topics
This is a stock chart ppt powerpoint presentation ideas topics. This is a five stage process. The stages in this process are volume, low, high, open, close.
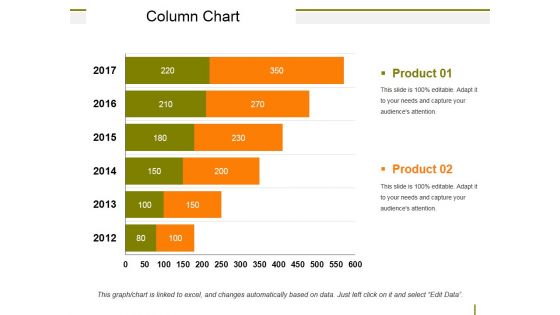
Column Chart Ppt PowerPoint Presentation Show Model
This is a column chart ppt powerpoint presentation show model. This is a six stage process. The stages in this process are business, marketing, bar, planning, strategy.
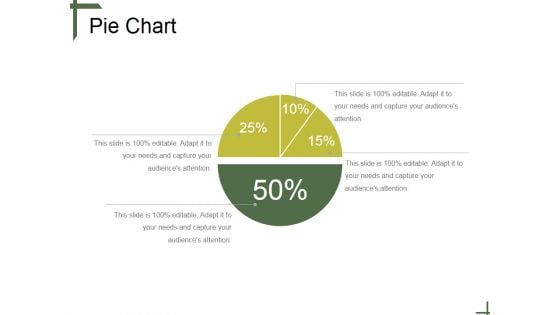
Pie Chart Ppt PowerPoint Presentation Summary
This is a pie chart ppt powerpoint presentation summary. This is a four stage process. The stages in this process are pie chart, marketing, strategy, analysis, investment, business.
Radar Chart Ppt PowerPoint Presentation Icon Skills
This is a radar chart ppt powerpoint presentation icon skills. This is a three stage process. The stages in this process are radar, business, marketing, strategy, planning.
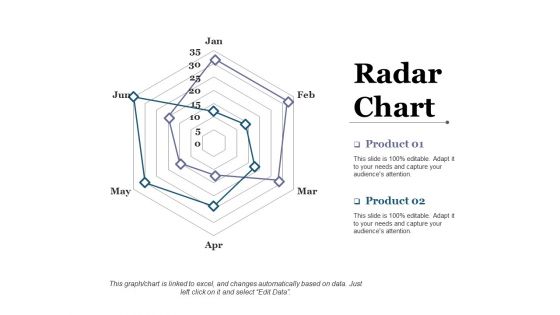
Radar Chart Ppt PowerPoint Presentation Inspiration Microsoft
This is a radar chart ppt powerpoint presentation inspiration microsoft. This is a two stage process. The stages in this process are business, radar chart, marketing, strategy, planning.
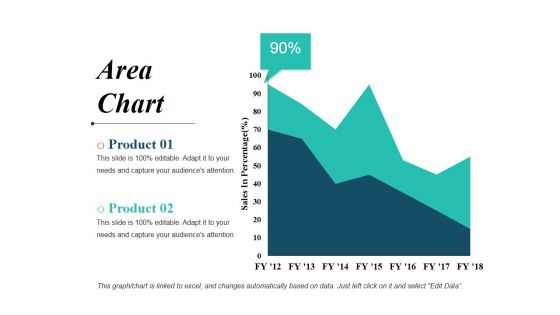
Area Chart Ppt PowerPoint Presentation Portfolio Skills
This is a area chart ppt powerpoint presentation portfolio skills. This is a two stage process. The stages in this process are business, marketing, strategy, planning, graph.

Yearly Selling Forecasts Revenue Chart Summary PDF
This slide covers projections for yearly revenue generation from product sales. It includes forecasted revenue for different years and a graph depicting the projected sales revenue growth. Showcasing this set of slides titled Yearly Selling Forecasts Revenue Chart Summary PDF. The topics addressed in these templates are Project Sales Revenue, Forecasts Revenue Chart. All the content presented in this PPT design is completely editable. Download it and make adjustments in color, background, font etc. as per your unique business setting.
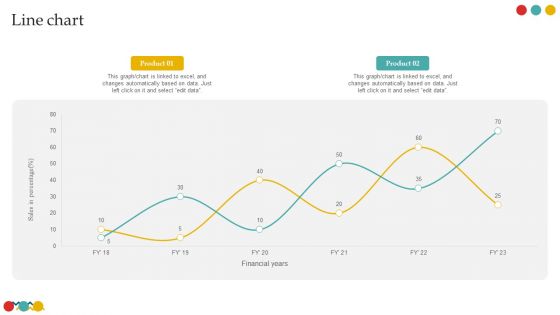
Line Chart Successful Rebranding Guide Designs PDF
Create an editable Line Chart Successful Rebranding Guide Designs PDF that communicates your idea and engages your audience. Whether you are presenting a business or an educational presentation, pre-designed presentation templates help save time. Line Chart Successful Rebranding Guide Designs PDF is highly customizable and very easy to edit, covering many different styles from creative to business presentations. Slidegeeks has creative team members who have crafted amazing templates. So, go and get them without any delay.
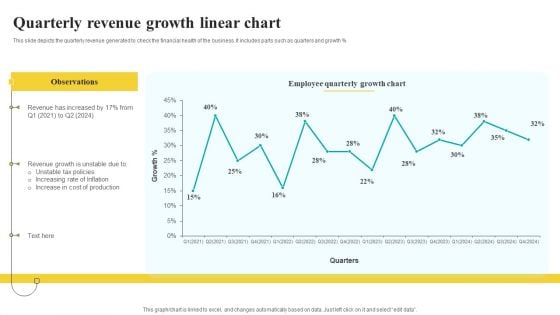
Quarterly Revenue Growth Linear Chart Elements PDF
This slide depicts the quarterly revenue generated to check the financial health of the business. It includes parts such as quarters and growth percent Showcasing this set of slides titled Quarterly Revenue Growth Linear Chart Elements PDF. The topics addressed in these templates are Observations, Growth Chart, Production. All the content presented in this PPT design is completely editable. Download it and make adjustments in color, background, font etc. as per your unique business setting.
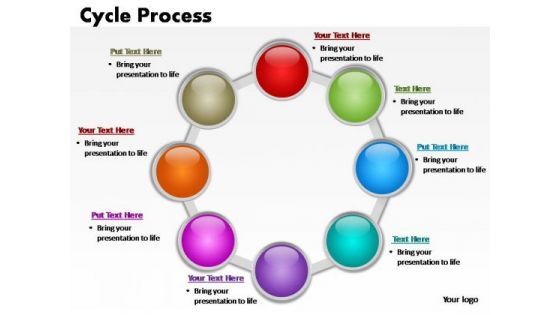
PowerPoint Backgrounds Chart Cycle Process Ppt Themes
PowerPoint Backgrounds Chart Cycle Process PPT Themes-Cycle Diagrams are a type of graphics that shows how items are related to one another in a repeating cycle. In a cycle diagram, you can explain the main events in the cycle, how they interact, and how the cycle repeats. These Diagrams can be used to interact visually and logically with audiences.-PowerPoint Backgrounds Chart Cycle Process PPT Themes People often criticise without any cause. With our PowerPoint Backgrounds Chart Cycle Process Ppt Themes you won't give a fig.
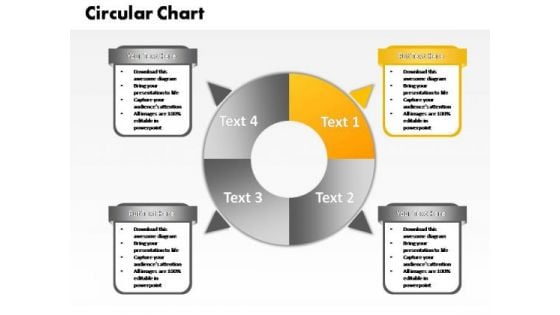
PowerPoint Slide Chart Four Circular Ppt Template
PowerPoint Slide Chart Four Circular PPT Template-PowerPoint Slide Designs Teamwork Round Moving PPT Slide Designs-Explore the various directions and layers existing in your in your plans and processes. Unravel the desired and essential elements of your overall strategy. Explain the relevance of the different layers and stages and directions in getting down to your core competence, ability and desired result.-PowerPoint Slide Chart Four Circular PPT Template Our PowerPoint Slide Chart Four Circular Ppt Template give expression to your drive. They emit the essence of your determination.
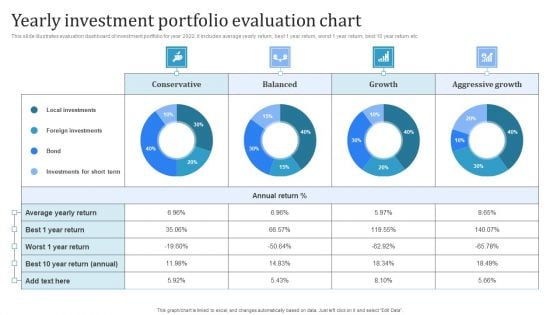
Yearly Investment Portfolio Evaluation Chart Information PDF
Showcasing this set of slides titled Yearly Investment Portfolio Evaluation Chart Information PDF. The topics addressed in these templates are Local Investments, Foreign Investments, Aggressive Growth. All the content presented in this PPT design is completely editable. Download it and make adjustments in color, background, font etc. as per your unique business setting.
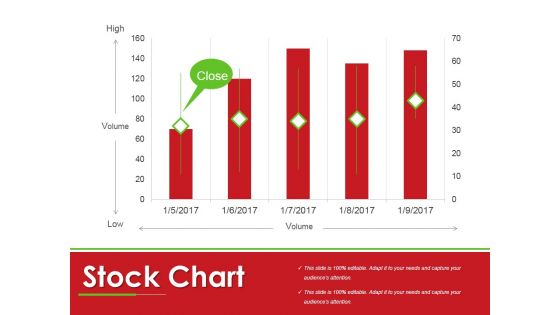
Stock Chart Ppt PowerPoint Presentation Professional Backgrounds
This is a stock chart ppt powerpoint presentation professional backgrounds. This is a five stage process. The stages in this process are business, marketing, graph, management, planning.
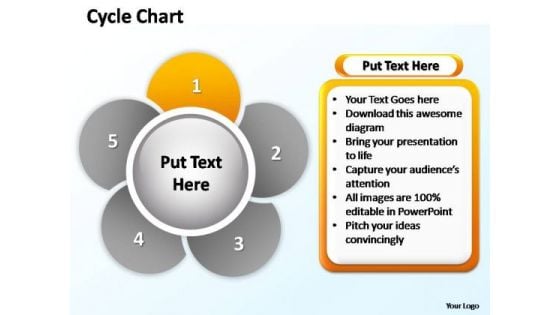
PowerPoint Backgrounds Image Cycle Chart Ppt Slide
PowerPoint Backgrounds Image Cycle Chart PPT Slide-Cycle Diagrams are a type of graphics that shows how items are related to one another in a repeating cycle. In a cycle diagram, you can explain the main events in the cycle, how they interact, and how the cycle repeats. These Diagrams can be used to interact visually and logically with audiences.-PowerPoint Backgrounds Image Cycle Chart PPT Slide Finalize your plans with our PowerPoint Backgrounds Image Cycle Chart Ppt Slide. Download without worries with our money back guaranteee.
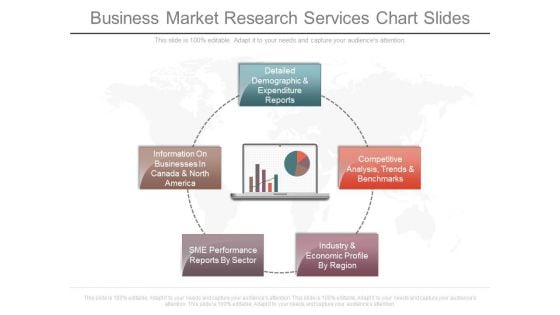
Business Market Research Services Chart Slides
This is a business market research services chart slides. This is a five stage process. The stages in this process are detailed demographic and expenditure reports, competitive analysis trends and benchmarks, industry and economic profile by region, sme performance reports by sector, information on businesses in canada and north america.
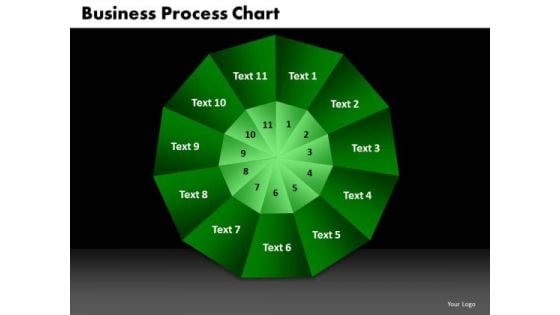
PowerPoint Designs Process Chart Education Ppt Designs
PowerPoint Designs Process Chart Education PPT Designs-The Circle of Life - a concept emmbedded in our minds and hence easy to comprehend. Life and Business is made up of processes comprising stages that flow from one to another. An excellent graphic to attract the attention of and understanding by your audience to improve earnings-PowerPoint Designs Process Chart Education PPT Designs-This ppt can be used for presentations relating to-Arrow, Bond, Business, Button, Buying, Career, Change, Chart, Children, Circle, College, Death, Diagram, Education, Financial, Future, Graphic, House, Illustration, Investing, Investment, Marriage, Menu, Personal, Plan, Process Your audience will never be left with mixed feelings. Our PowerPoint Designs Process Chart Education Ppt Designs will give them a clear choice.
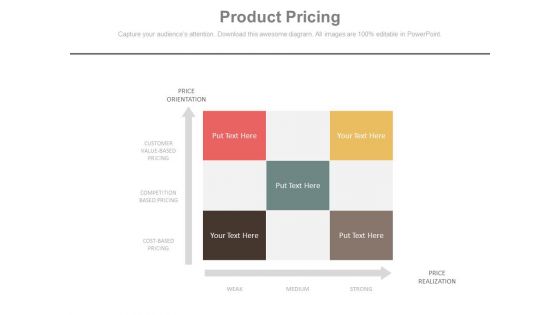
Product Pricing Tabulation Chart Ppt Slides
This is a product pricing tabulation chart ppt slides. This is a five stage process. The stages in this process are arrows, business, marketing.
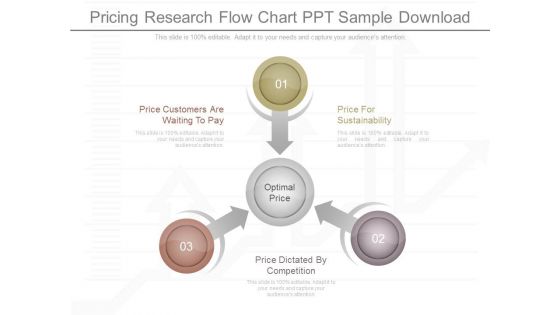
Pricing Research Flow Chart Ppt Sample Download
This is a pricing research flow chart ppt sample download. This is a three stage process. The stages in this process are price customers are waiting to pay, price dictated by competition, optimal price, price for sustainability.
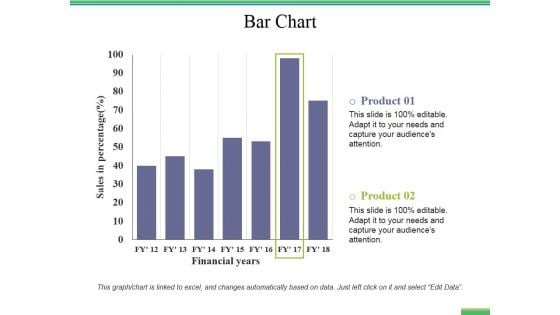
Bar Chart Ppt PowerPoint Presentation File Rules
This is a bar chart ppt powerpoint presentation file rules. This is a two stage process. The stages in this process are bar graph, finance, marketing, strategy, analysis.
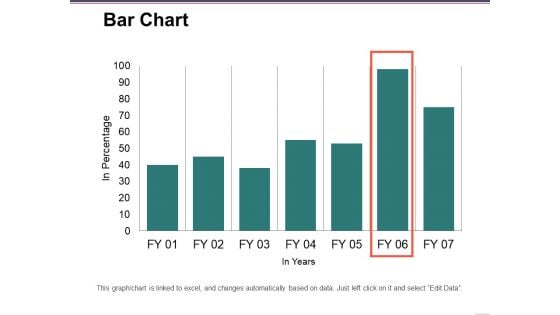
Bar Chart Ppt PowerPoint Presentation Pictures Inspiration
This is a bar chart ppt powerpoint presentation pictures inspiration. This is a seven stage process. The stages in this process are in percentage, business, marketing, finance, graph.
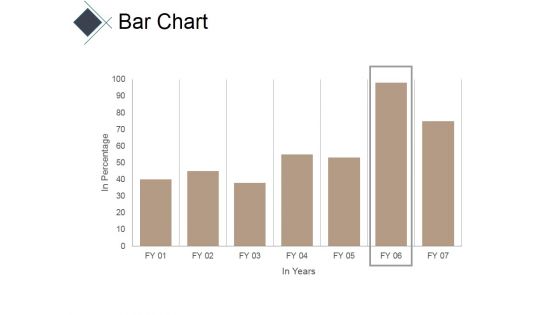
Bar Chart Ppt PowerPoint Presentation Model Good
This is a bar chart ppt powerpoint presentation model good. This is a seven stage process. The stages in this process are business, marketing, bar, success, finance.
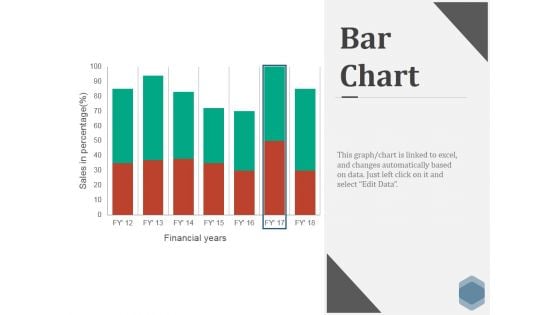
Bar Chart Ppt PowerPoint Presentation Infographics Skills
This is a bar chart ppt powerpoint presentation infographics skills. This is a seven stage process. The stages in this process are business, marketing, strategy, finance, bar.
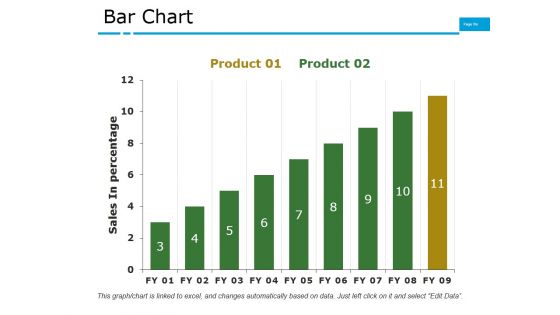
Bar Chart Ppt PowerPoint Presentation Model Influencers
This is a bar chart ppt powerpoint presentation model influencers. This is a two stage process. The stages in this process are business, marketing, finance, bar, growth.
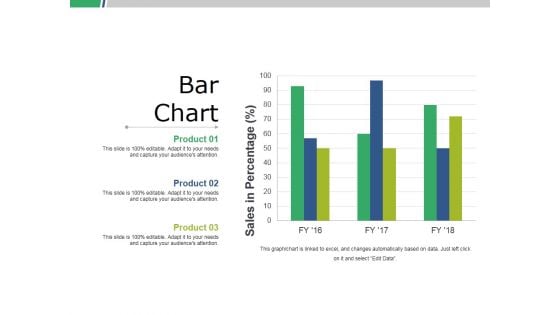
Bar Chart Ppt PowerPoint Presentation Show Slides
This is a bar chart ppt powerpoint presentation show slides. This is a three stage process. The stages in this process are business, marketing, strategy, bar, finance.
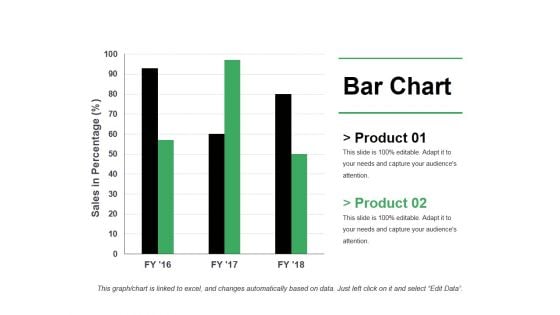
Bar Chart Ppt PowerPoint Presentation Model Professional
This is a bar chart ppt powerpoint presentation model professional. This is a three stage process. The stages in this process are business, marketing, strategy, finance, growth.
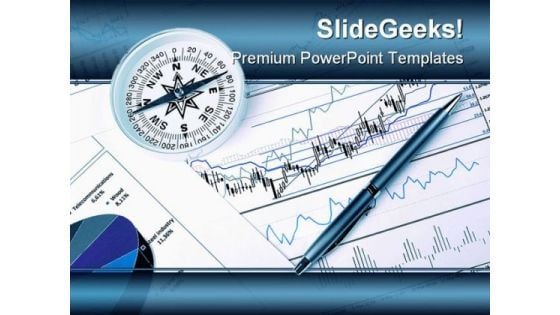
Graph And Chart Business PowerPoint Template 1110
Graphs and charts with compass. Workplace of businessman Our Graph And Chart Business PowerPoint Template 1110 can be very feisty. They takeup cudgels on your behalf.
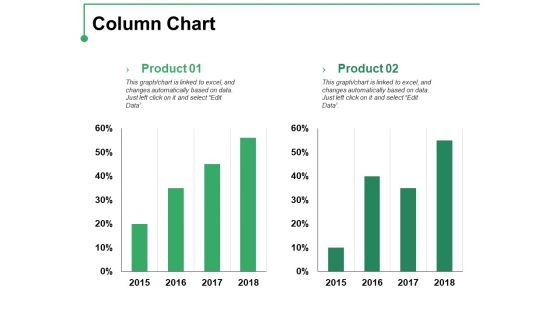
Column Chart Ppt PowerPoint Presentation Professional Template
This is a column chart ppt powerpoint presentation professional template. This is a two stage process. The stages in this process are product, percentage, finance, bar graph, growth.
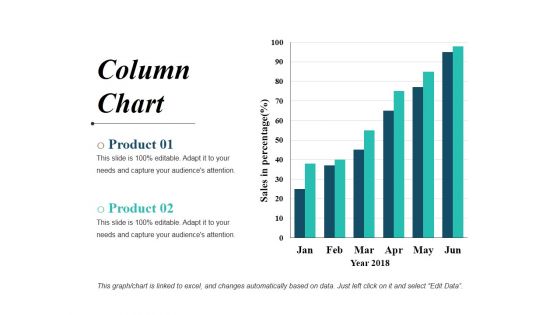
Column Chart Ppt PowerPoint Presentation Professional Layouts
This is a column chart ppt powerpoint presentation professional layouts. This is a six stage process. The stages in this process are bar graph, business, marketing, finance, planning.
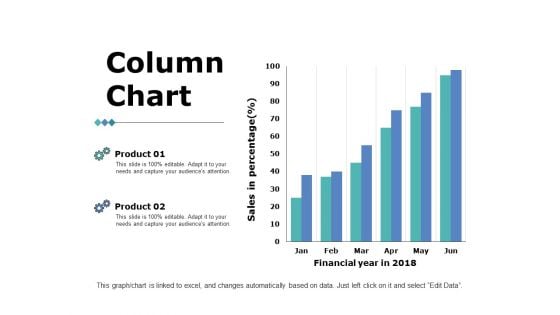
Column Chart Ppt PowerPoint Presentation Summary
This is a column chart ppt powerpoint presentation summary. This is a two stage process. The stages in this process are bar graph, marketing, strategy, finance, planning.
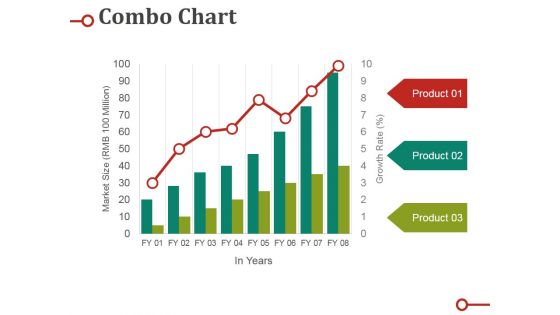
Combo Chart Ppt PowerPoint Presentation Gallery Sample
This is a combo chart ppt powerpoint presentation gallery sample. This is a three stage process. The stages in this process are market size, product, growth rate, bar, graph.
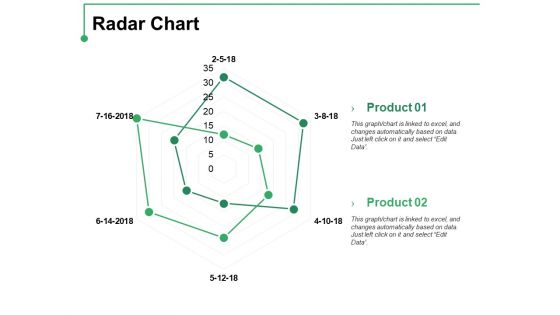
Radar Chart Ppt PowerPoint Presentation Pictures Themes
This is a radar chart ppt powerpoint presentation pictures themes. This is a two stage process. The stages in this process are product, radar chart, finance, business.
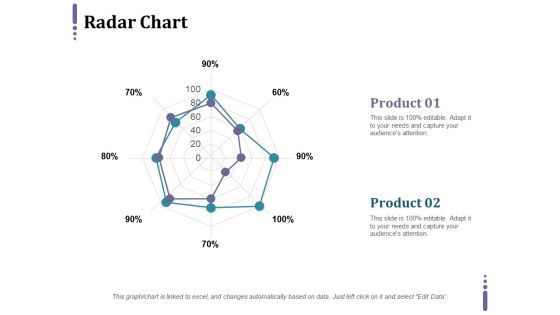
Radar Chart Ppt PowerPoint Presentation Styles Themes
This is a radar chart ppt powerpoint presentation styles themes. This is a two stage process. The stages in this process are product, finance, shape, radar chart, business.

PowerPoint Layouts Chart Quadrants Ppt Templates
PowerPoint Layouts Chart Quadrants PPT Templates-The Circle of Life - a concept emmbedded in our minds and hence easy to comprehend. Life and Business is made up of processes comprising stages that flow from one to another. An excellent graphic to attract the attention of and understanding by your audience to improve earnings. Teach your team with our PowerPoint Layouts Chart Quadrants Ppt Templates. Download without worries with our money back guaranteee.
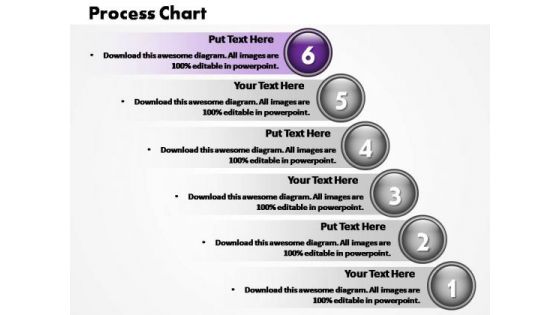
PowerPoint Themes Business Process Chart Ppt Layout
Highlight the key point in selling process with this diagram Surpass your colleagues with our PowerPoint Themes Business Process Chart Ppt Layout. Download without worries with our money back guaranteee.
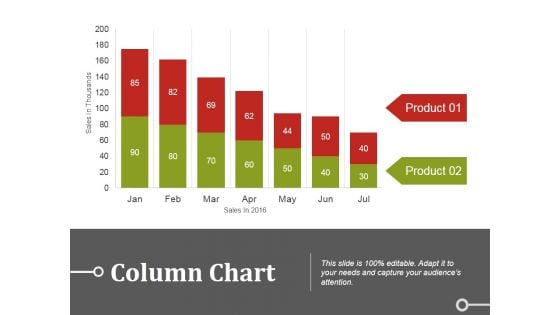
Column Chart Ppt PowerPoint Presentation Summary Introduction
This is a column chart ppt powerpoint presentation summary introduction. This is a two stage process. The stages in this process are business, marketing, bar, graph, finance.

Combo Chart Ppt PowerPoint Presentation Infographics Ideas
This is a combo chart ppt powerpoint presentation infographics ideas. This is a four stage process. The stages in this process are bar graph, marketing, strategy, finance, analysis.
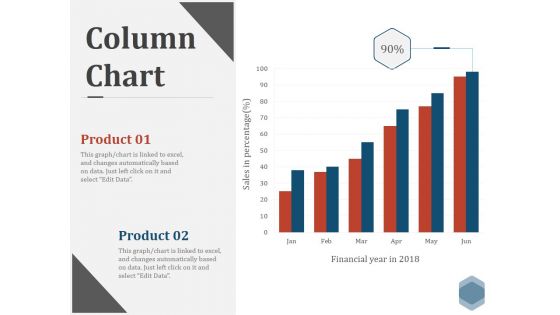
Column Chart Ppt PowerPoint Presentation File Formats
This is a column chart ppt powerpoint presentation file formats. This is a six stage process. The stages in this process are business, marketing, strategy, finance, bar.
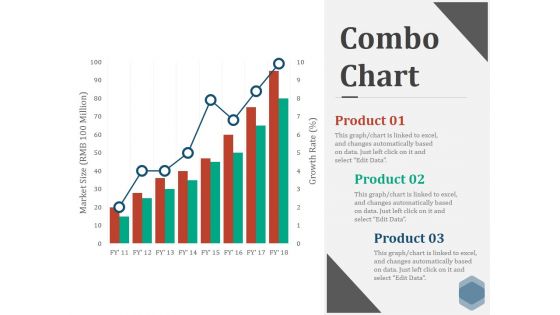
Combo Chart Ppt PowerPoint Presentation Pictures Graphics
This is a combo chart ppt powerpoint presentation pictures graphics. This is a eight stage process. The stages in this process are business, marketing, strategy, finance, bar.
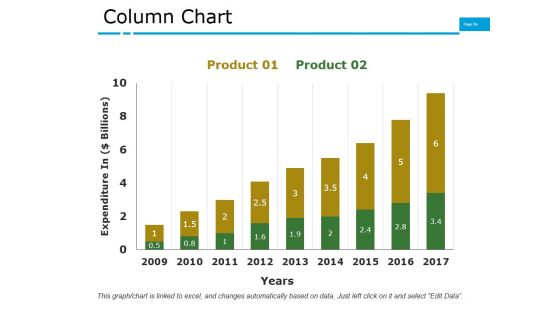
Column Chart Ppt PowerPoint Presentation Pictures Files
This is a column chart ppt powerpoint presentation pictures files. This is a nine stage process. The stages in this process are business, marketing, finance, bar, growth.
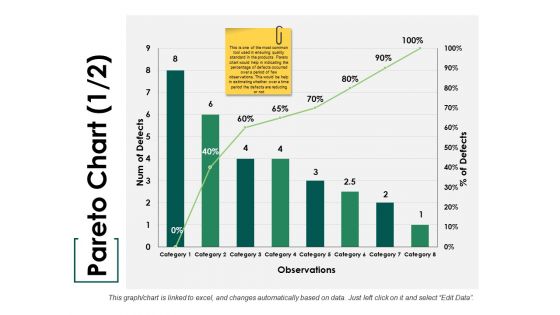
Pareto Chart Ppt PowerPoint Presentation Summary Show
This is a pareto chart ppt powerpoint presentation summary show. This is a eight stage process. The stages in this process are bar, marketing, strategy, finance, teamwork.
Pie Chart Ppt PowerPoint Presentation Model Icon
This is a pie chart ppt powerpoint presentation model icon. This is a five stage process. The stages in this process are pie chart, finance, marketing, strategy, business.


 Continue with Email

 Home
Home


