Cost Chart
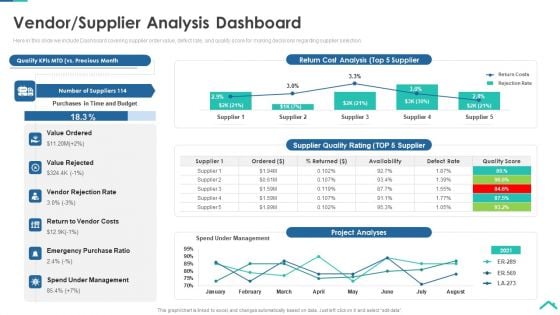
Risk Analysis Strategies For Real Estate Construction Project Vendor Supplier Analysis Dashboard Sample PDF
Here in this slide we include Dashboard covering supplier order value, defect rate, and quality score for making decisions regarding supplier selection. Deliver an awe inspiring pitch with this creative risk analysis strategies for real estate construction project vendor supplier analysis dashboard sample pdf bundle. Topics like value ordered, value rejected, vendor rejection rate, return to vendor costs, emergency purchase ratio, spend under management can be discussed with this completely editable template. It is available for immediate download depending on the needs and requirements of the user.
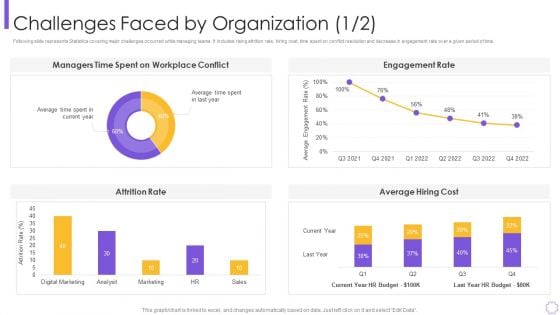
process optimization through product life process management techniques background pdf
Following slide represents Statistics covering major challenges occurred while managing teams. It includes rising attrition rate, hiring cost, time spent on conflict resolution and decrease in engagement rate over a given period of time.Deliver and pitch your topic in the best possible manner with this process optimization through product life process management techniques background pdf Use them to share invaluable insights on goals and timeline, promote participatory relations, develop strong commitment and impress your audience. This template can be altered and modified as per your expectations. So, grab it now.
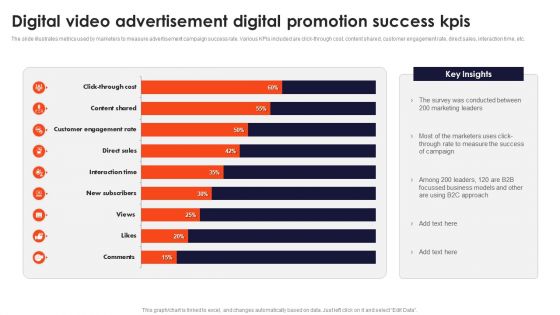
Digital Video Advertisement Digital Promotion Success Kpis Formats PDF
The slide illustrates metrics used by marketers to measure advertisement campaign success rate. Various KPIs included are click-through cost, content shared, customer engagement rate, direct sales, interaction time, etc. Showcasing this set of slides titled Digital Video Advertisement Digital Promotion Success Kpis Formats PDF. The topics addressed in these templates are Digital Video, Advertisement Digital, Promotion Success Kpis. All the content presented in this PPT design is completely editable. Download it and make adjustments in color, background, font etc. as per your unique business setting.
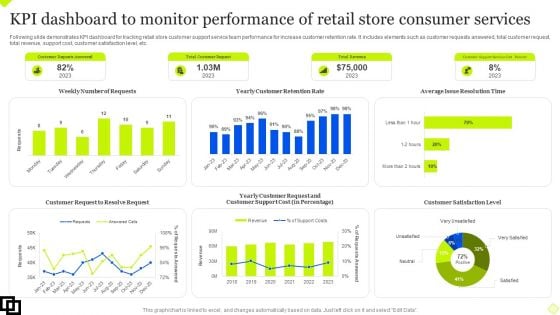
KPI Dashboard To Monitor Performance Of Retail Store Consumer Services Summary PDF
Following slide demonstrates KPI dashboard for tracking retail store customer support service team performance for increase customer retention rate. It includes elements such as customer requests answered, total customer request, total revenue, support cost, customer satisfaction level, etc. Showcasing this set of slides titled KPI Dashboard To Monitor Performance Of Retail Store Consumer Services Summary PDF. The topics addressed in these templates are Customer Request, Customer Retention Rate, Customer Satisfaction Level. All the content presented in this PPT design is completely editable. Download it and make adjustments in color, background, font etc. as per your unique business setting.
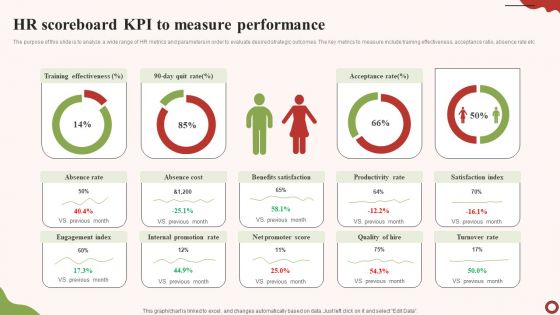
HR Scoreboard KPI To Measure Performance Inspiration PDF
The purpose of this slide is to analyze a wide range of HR metrics and parameters in order to evaluate desired strategic outcomes. The key metrics to measure include training effectiveness, acceptance ratio, absence rate etc. Showcasing this set of slides titled HR Scoreboard KPI To Measure Performance Inspiration PDF. The topics addressed in these templates are Training Effectiveness, Absence Rate, Absence Cost. All the content presented in this PPT design is completely editable. Download it and make adjustments in color, background, font etc. as per your unique business setting.
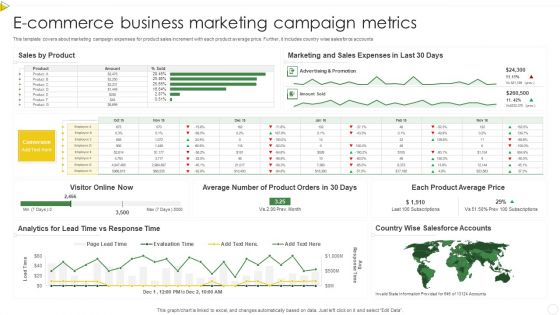
E Commerce Business Marketing Campaign Metrics Structure PDF
This template covers about marketing campaign expenses for product sales increment with each product average price. Further, it includes country wise salesforce accounts. Showcasing this set of slides titled E Commerce Business Marketing Campaign Metrics Structure PDF. The topics addressed in these templates are Sales By Product, Sales Expenses, Marketing. All the content presented in this PPT design is completely editable. Download it and make adjustments in color, background, font etc. as per your unique business setting.
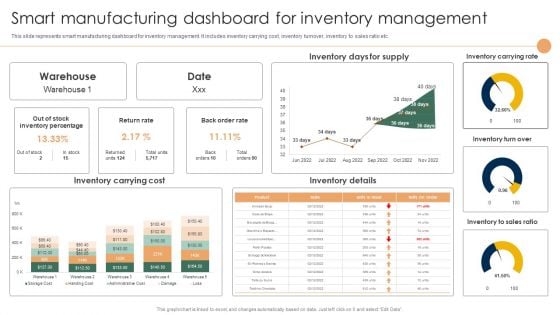
Smart Manufacturing Deployment Improve Production Procedures Smart Manufacturing Dashboard Summary PDF
This slide represents smart manufacturing dashboard for inventory management. It includes inventory carrying cost, inventory turnover, inventory to sales ratio etc.Slidegeeks has constructed Smart Manufacturing Deployment Improve Production Procedures Smart Manufacturing Dashboard Summary PDF after conducting extensive research and examination. These presentation templates are constantly being generated and modified based on user preferences and critiques from editors. Here, you will find the most attractive templates for a range of purposes while taking into account ratings and remarks from users regarding the content. This is an excellent jumping-off point to explore our content and will give new users an insight into our top-notch PowerPoint Templates.
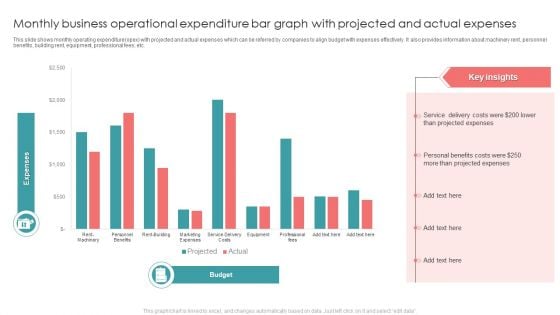
Monthly Business Operational Expenditure Bar Graph With Projected And Actual Expenses Introduction PDF
This slide shows monthly operating expenditure opex with projected and actual expenses which can be referred by companies to align budget with expenses effectively. It also provides information about machinery rent, personnel benefits, building rent, equipment, professional fees, etc. Pitch your topic with ease and precision using this Monthly Business Operational Expenditure Bar Graph With Projected And Actual Expenses Introduction PDF. This layout presents information on Projected Expenses, Costs, Service. It is also available for immediate download and adjustment. So, changes can be made in the color, design, graphics or any other component to create a unique layout.
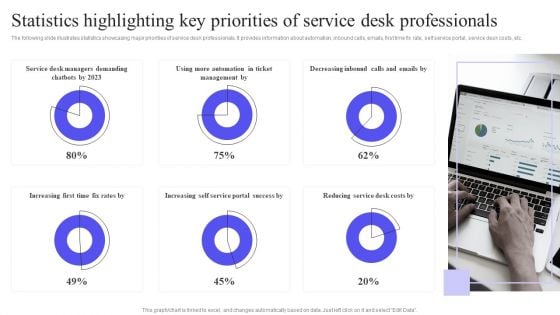
Statistics Highlighting Key Priorities Of Service Desk Professionals Graphics PDF
The following slide illustrates statistics showcasing major priorities of service desk professionals. It provides information about automation, inbound calls, emails, first time fix rate, self service portal, service desk costs, etc. If your project calls for a presentation, then Slidegeeks is your go to partner because we have professionally designed, easy to edit templates that are perfect for any presentation. After downloading, you can easily edit Statistics Highlighting Key Priorities Of Service Desk Professionals Graphics PDF and make the changes accordingly. You can rearrange slides or fill them with different images. Check out all the handy templates.
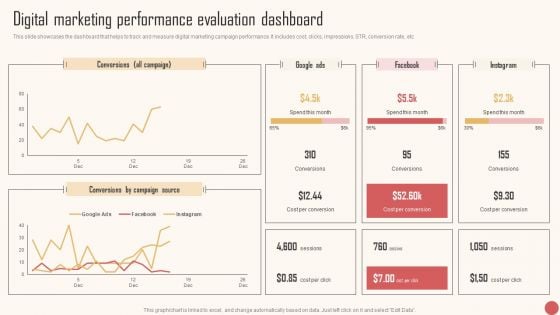
Digital Marketing Performance Evaluation Dashboard Microsoft PDF
This slide showcases the dashboard that helps to track and measure digital marketing campaign performance. It includes cost, clicks, impressions, STR, conversion rate, etc. Create an editable Digital Marketing Performance Evaluation Dashboard Microsoft PDF that communicates your idea and engages your audience. Whether you are presenting a business or an educational presentation, pre-designed presentation templates help save time. Digital Marketing Performance Evaluation Dashboard Microsoft PDF is highly customizable and very easy to edit, covering many different styles from creative to business presentations. Slidegeeks has creative team members who have crafted amazing templates. So, go and get them without any delay.
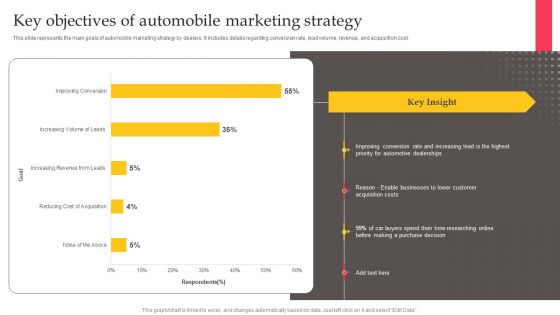
Executing Automotive Marketing Tactics For Sales Boost Key Objectives Of Automobile Formats PDF
This slide represents the main goals of automobile marketing strategy by dealers. It includes details regarding conversion rate, lead volume, revenue, and acquisition cost. From laying roadmaps to briefing everything in detail, our templates are perfect for you. You can set the stage with your presentation slides. All you have to do is download these easy to edit and customizable templates. Executing Automotive Marketing Tactics For Sales Boost Key Objectives Of Automobile Formats PDF will help you deliver an outstanding performance that everyone would remember and praise you for. Do download this presentation today.
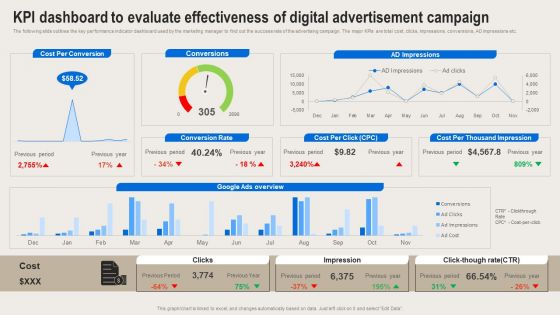
Formulating Branding Strategy To Enhance Revenue And Sales KPI Dashboard To Evaluate Effectivenessl Clipart PDF
The following slide outlines the key performance indicator dashboard used by the marketing manager to find out the success rate of the advertising campaign. The major KPIs are total cost, clicks, impressions, conversions, AD impressions etc. There are so many reasons you need a Formulating Branding Strategy To Enhance Revenue And Sales KPI Dashboard To Evaluate Effectivenessl Clipart PDF. The first reason is you cannot spend time making everything from scratch, Thus, Slidegeeks has made presentation templates for you too. You can easily download these templates from our website easily.
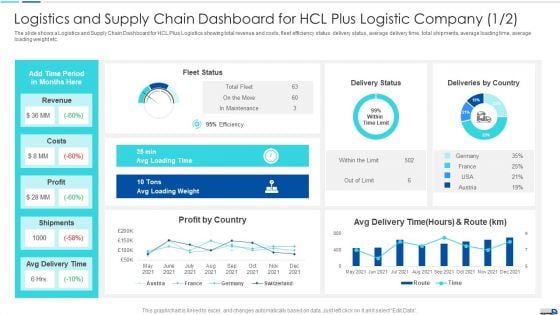
Initiatives To Produce Effective Concept For Logistic Firm Market Share Of HCL Plus Brochure PDF
This slide shows declining Market Share of HCL Plus Logistics Company on a global scale. The market share of the company is declining due to factors such as Declining Company Revenue, Falling Client Satisfaction Rate, Driver Shortage and Retention, High Compliance Regulations etc. Deliver and pitch your topic in the best possible manner with this initiatives to produce effective concept for logistic firm market share of hcl plus brochure pdf. Use them to share invaluable insights on procurement costs, revenue, market share and impress your audience. This template can be altered and modified as per your expectations. So, grab it now.
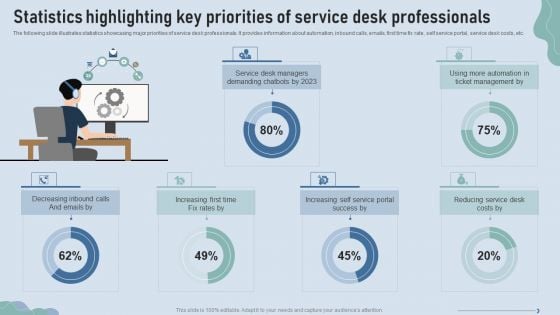
Improve IT Service Desk Statistics Highlighting Key Priorities Of Service Topics PDF
The following slide illustrates statistics showcasing major priorities of service desk professionals. It provides information about automation, inbound calls, emails, first time fix rate, self service portal, service desk costs, etc. Deliver and pitch your topic in the best possible manner with this Improve IT Service Desk Statistics Highlighting Key Priorities Of Service Topics PDF. Use them to share invaluable insights on Service Managers, Ticket Management, Increasing Time and impress your audience. This template can be altered and modified as per your expectations. So, grab it now.
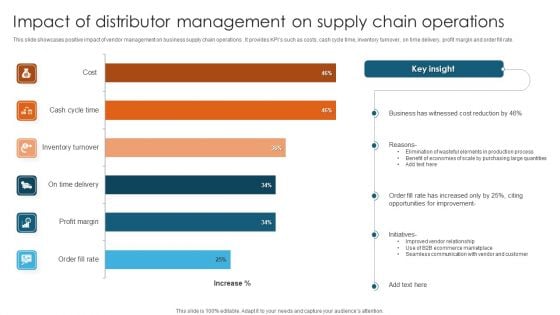
Impact Of Distributor Management On Supply Chain Operations Brochure PDF
This slide showcases positive impact of vendor management on business supply chain operations . It provides KPIs such as costs, cash cycle time, inventory turnover, on time delivery, profit margin and order fill rate.Showcasing this set of slides titled Impact Of Distributor Management On Supply Chain Operations Brochure PDF. The topics addressed in these templates are Business Witnessed, Elimination Wasteful, Opportunities Improvement. All the content presented in this PPT design is completely editable. Download it and make adjustments in color, background, font etc. as per your unique business setting.
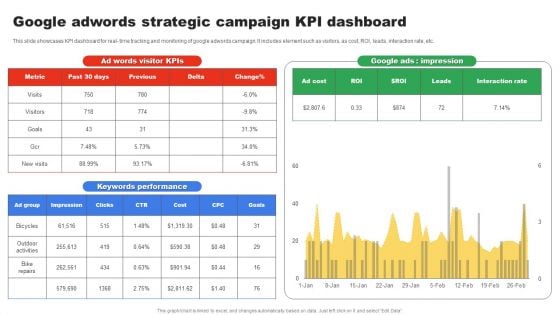
Google Adwords Strategic Campaign KPI Dashboard Topics PDF
This slide showcases KPI dashboard for real time tracking and monitoring of google adwords campaign. It includes element such as visitors, as cost, ROI, leads, interaction rate, etc. Showcasing this set of slides titled Google Adwords Strategic Campaign KPI Dashboard Topics PDF. The topics addressed in these templates are Keywords Performance, Google Ads Impression, Ad Words Visitor Kpis. All the content presented in this PPT design is completely editable. Download it and make adjustments in color, background, font etc. as per your unique business setting.
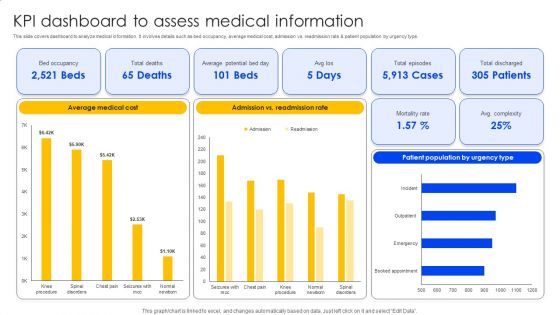
KPI Dashboard To Assess Medical Information Clipart PDF
This slide covers dashboard to analyze medical information. It involves details such as bed occupancy, average medical cost, admission vs. readmission rate and patient population by urgency type. Get a simple yet stunning designed KPI Dashboard To Assess Medical Information Clipart PDF. It is the best one to establish the tone in your meetings. It is an excellent way to make your presentations highly effective. So, download this PPT today from Slidegeeks and see the positive impacts. Our easy to edit KPI Dashboard To Assess Medical Information Clipart PDF can be your go to option for all upcoming conferences and meetings. So, what are you waiting for Grab this template today.
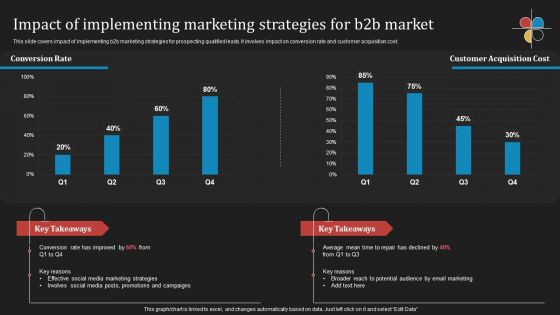
Deploying B2B Advertising Techniques For Lead Generation Impact Of Implementing Marketing Strategies Information PDF
This slide covers impact of implementing b2b marketing strategies for prospecting qualified leads. It involves impact on conversion rate and customer acquisition cost. The Deploying B2B Advertising Techniques For Lead Generation Impact Of Implementing Marketing Strategies Information PDF is a compilation of the most recent design trends as a series of slides. It is suitable for any subject or industry presentation, containing attractive visuals and photo spots for businesses to clearly express their messages. This template contains a variety of slides for the user to input data, such as structures to contrast two elements, bullet points, and slides for written information. Slidegeeks is prepared to create an impression.
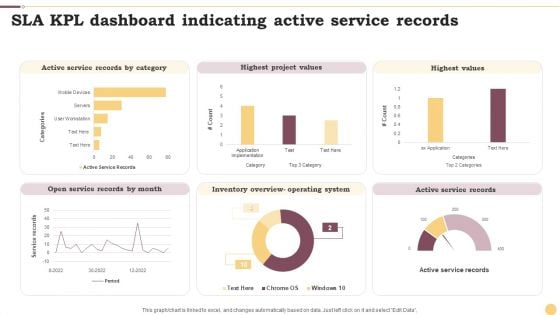
SLA KPL Dashboard Indicating Active Service Records Ppt Professional Graphics Example PDF
This graph or chart is linked to excel, and changes automatically based on data. Just left click on it and select Edit Data. Pitch your topic with ease and precision using this SLA KPL Dashboard Indicating Active Service Records Ppt Professional Graphics Example PDF. This layout presents information on Active Service Records, Highest Project Values, Highest Values. It is also available for immediate download and adjustment. So, changes can be made in the color, design, graphics or any other component to create a unique layout.

Risky Domino Financial Business PowerPoint Templates And PowerPoint Backgrounds 0211
Microsoft PowerPoint Template and Background with domino over business chart showing the risk of financial or banking crisis Make your presentation in a hurry with our Risky Domino Financial Business PowerPoint Templates And PowerPoint Backgrounds 0211. Make sure your presentation gets the attention it deserves.
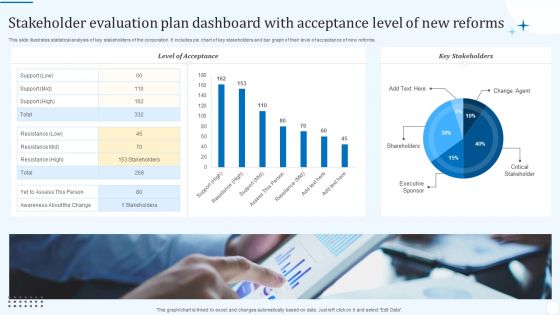
Stakeholder Evaluation Plan Dashboard With Acceptance Level Of New Reforms Background PDF
This slide illustrates statistical analysis of key stakeholders of the corporation. It includes pie chart of key stakeholders and bar graph of their level of acceptance of new reforms. Showcasing this set of slides titled Stakeholder Evaluation Plan Dashboard With Acceptance Level Of New Reforms Background PDF. The topics addressed in these templates are Level Acceptance, Key Stakeholders, Critical Stakeholder. All the content presented in this PPT design is completely editable. Download it and make adjustments in color, background, font etc. as per your unique business setting.
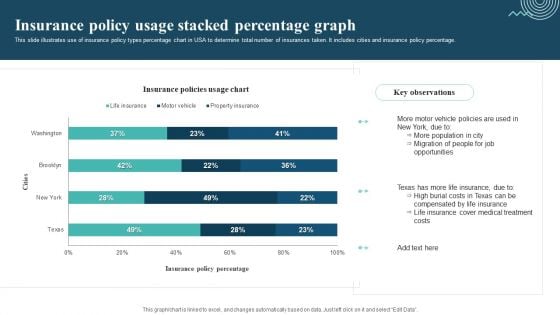
Insurance Policy Usage Stacked Percentage Graph Template PDF
This slide illustrates use of insurance policy types percentage chart in USA to determine total number of insurances taken. It includes cities and insurance policy percentage. Pitch your topic with ease and precision using this Insurance Policy Usage Stacked Percentage Graph Template PDF. This layout presents information on Motor Vehicle Policies, More Population, Migration Of People. It is also available for immediate download and adjustment. So, changes can be made in the color, design, graphics or any other component to create a unique layout.
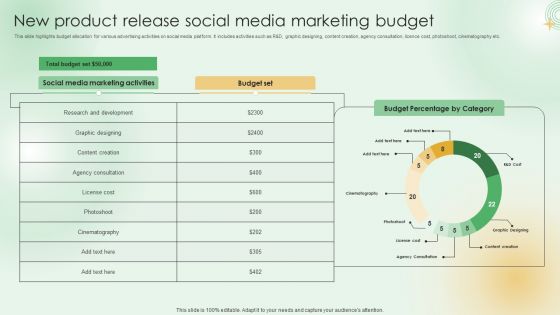
New Product Release Social Media Marketing Budget Clipart PDF
This slide highlights budget allocation for various advertising activities on social media platform. It includes activities such as R and D, graphic designing, content creation, agency consultation, licence cost, photoshoot, cinematography etc. Pitch your topic with ease and precision using this New Product Release Social Media Marketing Budget Clipart PDF. This layout presents information on Total Budget Set, Social Media Marketing Activities, Budget Percentage Category. It is also available for immediate download and adjustment. So, changes can be made in the color, design, graphics or any other component to create a unique layout.
Pitch Deck To Draw External Capital From Commercial Banking Institution Allocation Of Fund Raised Through Debt Financing Icons PDF
This slide shows that where the Debt Financing funds that the company has gathered, will be allocated like Capital Expenditure, Working Capital expenses, Business Acquisition Costs, Marketing Expenses etc. Deliver an awe-inspiring pitch with this creative pitch deck to draw external capital from commercial banking institution allocation of fund raised through debt financing icons pdf bundle. Topics like usiness acquisitions and marketing expenses, capital expenditure, working capital requirements can be discussed with this completely editable template. It is available for immediate download depending on the needs and requirements of the user.
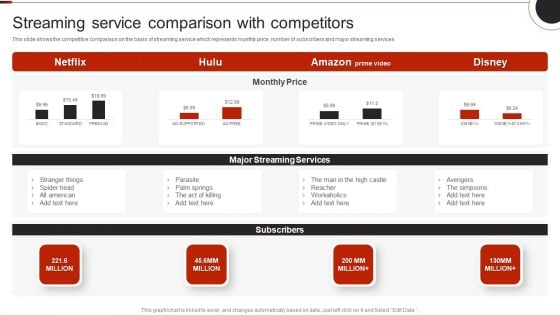
Netflix Company Outline Streaming Service Comparison With Competitors Structure PDF
This slide shows the competitive comparison on the basis of streaming service which represents monthly price, number of subscribers and major streaming services.Deliver and pitch your topic in the best possible manner with this Netflix Company Outline Streaming Service Comparison With Competitors Structure PDF. Use them to share invaluable insights on Streaming Services, Stranger Things, Palm Springs and impress your audience. This template can be altered and modified as per your expectations. So, grab it now.
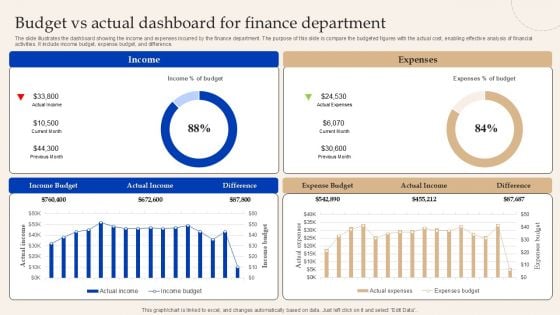
Budget Vs Actual Dashboard For Finance Department Brochure PDF
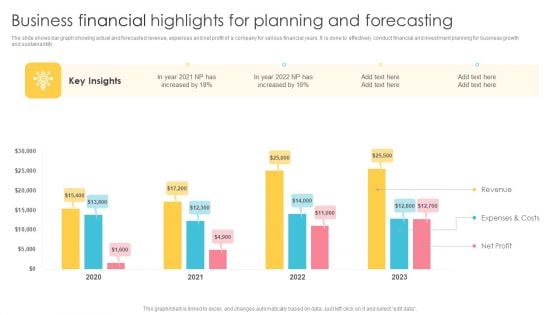
Business Financial Highlights For Planning And Forecasting Background PDF
The slide shows bar graph showing actual and forecasted revenue, expenses and net profit of a company for various financial years. It is done to effectively conduct financial and investment planning for business growth and sustainability. Pitch your topic with ease and precision using this Business Financial Highlights For Planning And Forecasting Background PDF. This layout presents information on Revenue, Expenses And Costs, Net Profit. It is also available for immediate download and adjustment. So, changes can be made in the color, design, graphics or any other component to create a unique layout.
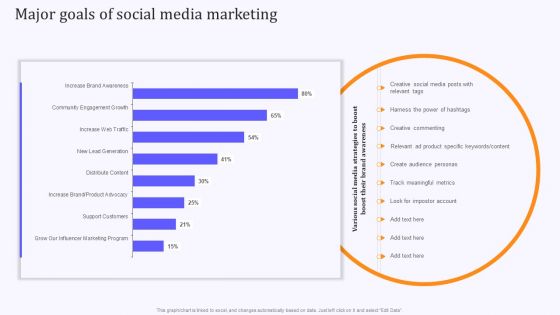
Product Marketing And Awareness Programs Major Goals Of Social Media Marketing Mockup PDF
This graph or chart is linked to excel, and changes automatically based on data. Just left click on it and select Edit Data. Find a pre-designed and impeccable Product Marketing And Awareness Programs Major Goals Of Social Media Marketing Mockup PDF. The templates can ace your presentation without additional effort. You can download these easy-to-edit presentation templates to make your presentation stand out from others. So, what are you waiting for Download the template from Slidegeeks today and give a unique touch to your presentation.
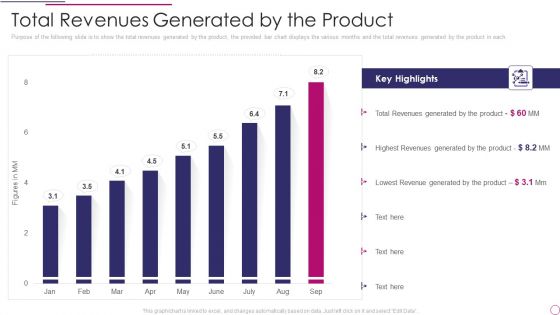
Performance Analysis Of New Product Development Total Revenues Generated By The Product Microsoft PDF
Purpose of the following slide is to show the total revenues generated by the product, the provided bar chart displays the various months and the total revenues generated by the product in each. Deliver and pitch your topic in the best possible manner with this performance analysis of new product development total revenues generated by the product microsoft pdf. Use them to share invaluable insights on total revenues generated by the product and impress your audience. This template can be altered and modified as per your expectations. So, grab it now.
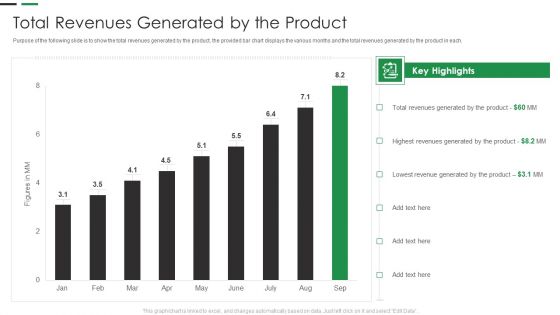
Evaluating New Commodity Impact On Market Total Revenues Generated By The Product Topics PDF
Purpose of the following slide is to show the total revenues generated by the product, the provided bar chart displays the various months and the total revenues generated by the product in each. Deliver an awe inspiring pitch with this creative Evaluating New Commodity Impact On Market Total Revenues Generated By The Product Topics PDF bundle. Topics like Key Highlights, Revenues Generated, Generated Product can be discussed with this completely editable template. It is available for immediate download depending on the needs and requirements of the user.
New Commodity Market Viability Review Total Revenues Generated By The Product Information PDF
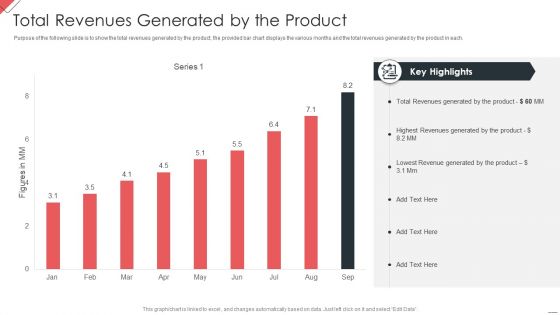
Purpose of the following slide is to show the total revenues generated by the product, the provided bar chart displays the various months and the total revenues generated by the product in each. Deliver an awe inspiring pitch with this creative New Commodity Market Viability Review Total Revenues Generated By The Product Information PDF bundle. Topics like Revenues Generated, Highest Revenues, Lowest Revenue can be discussed with this completely editable template. It is available for immediate download depending on the needs and requirements of the user.
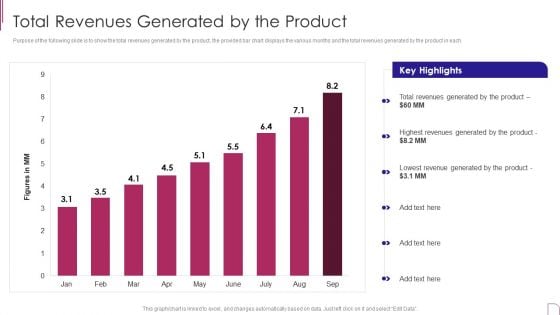
Yearly Product Performance Assessment Repor Total Revenues Generated By The Product Background PDF
Purpose of the following slide is to show the total revenues generated by the product, the provided bar chart displays the various months and the total revenues generated by the product in each. Deliver and pitch your topic in the best possible manner with this Yearly Product Performance Assessment Repor Total Revenues Generated By The Product Background PDF Use them to share invaluable insights on Key Highlights, Revenues Generated, Lowest Revenue and impress your audience. This template can be altered and modified as per your expectations. So, grab it now.
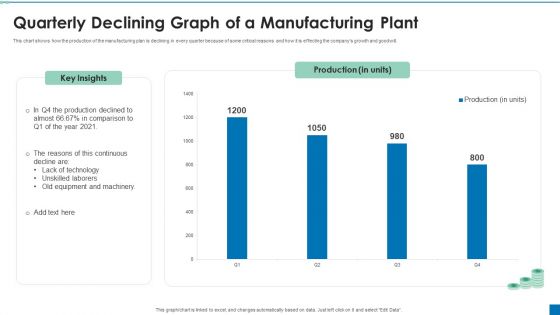
Quarterly Declining Graph Of A Manufacturing Plant Ppt PowerPoint Presentation File Example Topics PDF
This chart shows how the production of the manufacturing plan is declining in every quarter because of some critical reasons and how it is effecting the companys growth and goodwill. Showcasing this set of slides titled Quarterly Declining Graph Of A Manufacturing Plant Ppt PowerPoint Presentation File Example Topics PDF. The topics addressed in these templates are Production Declined, Lack Of Technology, Unskilled Laborers. All the content presented in this PPT design is completely editable. Download it and make adjustments in color, background, font etc. as per your unique business setting.
Departmental Tracking Goals Progress Dashboard Diagrams PDF
This slide depicts a progress chart for maintaining transparency and alignment in tracking cross-functional goals. It also includes organizational objective details such as total on track objectives, recently updated, overall progress, etc. Showcasing this set of slides titled Departmental Tracking Goals Progress Dashboard Diagrams PDF. The topics addressed in these templates are Departmental Tracking Goals, Progress Dashboard . All the content presented in this PPT design is completely editable. Download it and make adjustments in color, background, font etc. as per your unique business setting.
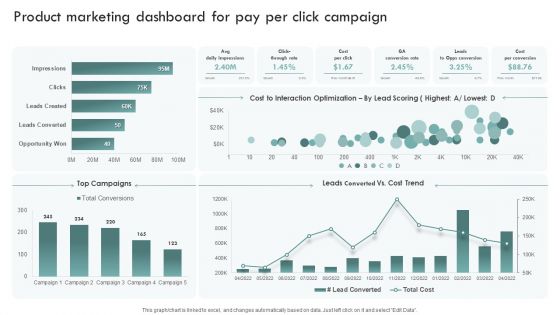
Brand Awareness Plan Product Marketing Dashboard For Pay Per Click Campaign Template PDF
This graph or chart is linked to excel, and changes automatically based on data. Just left click on it and select Edit Data. Get a simple yet stunning designed Brand Awareness Plan Product Marketing Dashboard For Pay Per Click Campaign Template PDF. It is the best one to establish the tone in your meetings. It is an excellent way to make your presentations highly effective. So, download this PPT today from Slidegeeks and see the positive impacts. Our easy-to-edit Brand Awareness Plan Product Marketing Dashboard For Pay Per Click Campaign Template PDF can be your go-to option for all upcoming conferences and meetings. So, what are you waiting for Grab this template today.
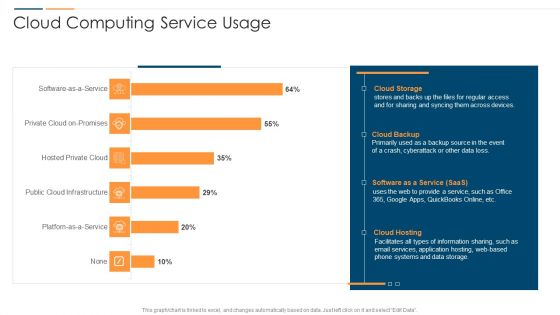
Revolution In Online Business Cloud Computing Service Usage Ppt PowerPoint Presentation File Themes PDF
This graph or chart is linked to excel, and changes automatically based on data. Just left click on it and select Edit Data. Deliver and pitch your topic in the best possible manner with this Revolution In Online Business Cloud Computing Service Usage Ppt PowerPoint Presentation File Themes PDF. Use them to share invaluable insights on Cloud Storage System, Cloud Backup Saas, Cloud Hosting Storage and impress your audience. This template can be altered and modified as per your expectations. So, grab it now.
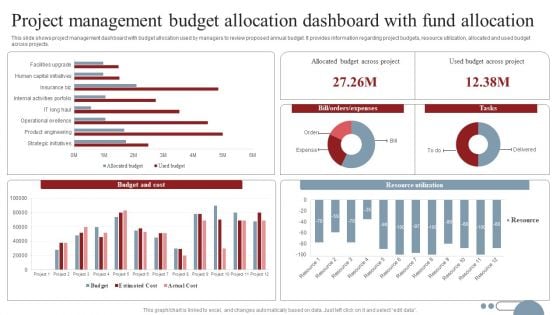
Project Management Budget Allocation Dashboard With Fund Allocation Mockup PDF
This slide shows project management dashboard with budget allocation used by managers to review proposed annual budget. It provides information regarding project budgets, resource utilization, allocated and used budget across projects. Showcasing this set of slides titled Project Management Budget Allocation Dashboard With Fund Allocation Mockup PDF. The topics addressed in these templates are Budget Cost, Resource Utilization, Budget Across Project. All the content presented in this PPT design is completely editable. Download it and make adjustments in color, background, font etc. as per your unique business setting.
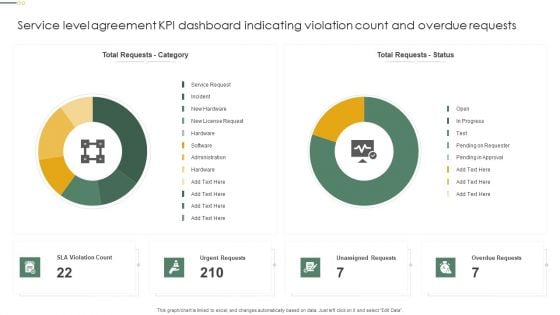
Service Level Agreement KPI Dashboard Indicating Violation Count And Overdue Requests Diagrams PDF
This graph or chart is linked to excel, and changes automatically based on data. Just left click on it and select Edit Data. Showcasing this set of slides titled Service Level Agreement KPI Dashboard Indicating Violation Count And Overdue Requests Diagrams PDF. The topics addressed in these templates are Total Requests Category, Total Requests Status, Urgent Requests. All the content presented in this PPT design is completely editable. Download it and make adjustments in color, background, font etc. as per your unique business setting.
Customer Relationship Management Dashboard CRM Application Dashboard Quarter Icons PDF
This graph or chart is linked to excel, and changes automatically based on data. Just left click on it and select Edit Data.Deliver and pitch your topic in the best possible manner with this customer relationship management dashboard crm application dashboard quarter icons pdf. Use them to share invaluable insights on marketing funnel all time, opportunity generation by quarter, active prospects, new prospects, new opportunities and impress your audience. This template can be altered and modified as per your expectations. So, grab it now.
Current State Of Security Automation With Projected Development Icons PDF
This slide highlights the current state of security automation in the pie chart format. It includes projected development of security automation and state of security automation.Want to ace your presentation in front of a live audience Our Current State Of Security Automation With Projected Development Icons PDF can help you do that by engaging all the users towards you.. Slidegeeks experts have put their efforts and expertise into creating these impeccable powerpoint presentations so that you can communicate your ideas clearly. Moreover, all the templates are customizable, and easy-to-edit and downloadable. Use these for both personal and commercial use.
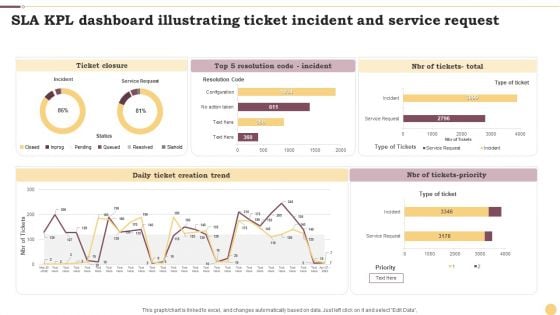
SLA KPL Dashboard Illustrating Ticket Incident And Service Request Ppt File Portrait PDF
This graph or chart is linked to excel, and changes automatically based on data. Just left click on it and select Edit Data. Showcasing this set of slides titled SLA KPL Dashboard Illustrating Ticket Incident And Service Request Ppt File Portrait PDF. The topics addressed in these templates are Ticket Closure, Daily Ticket, Creation Trend, NBR Tickets Priority. All the content presented in this PPT design is completely editable. Download it and make adjustments in color, background, font etc. as per your unique business setting.
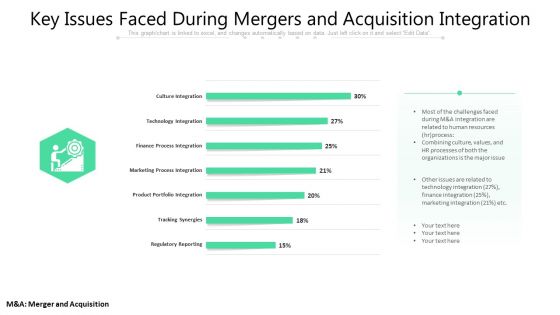
Key Issues Faced During Mergers And Acquisition Integration Ppt PowerPoint Presentation Summary Graphics PDF
This graph or chart is linked to excel, and changes automatically based on data. Just left click on it and select Edit Data. Showcasing this set of slides titled key issues faced during mergers and acquisition integration ppt powerpoint presentation summary graphics pdf. The topics addressed in these templates are culture integration, technology integration, finance process integration, marketing process integration, product portfolio integration, tracking synergies, regulatory reporting. All the content presented in this PPT design is completely editable. Download it and make adjustments in color, background, font etc. as per your unique business setting.
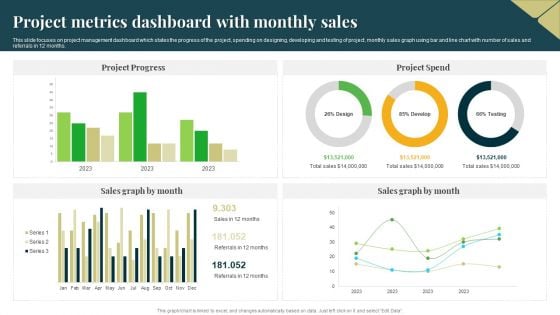
Project Metrics Dashboard With Monthly Sales Professional PDF
This slide focuses on project management dashboard which states the progress of the project, spending on designing, developing and testing of project, monthly sales graph using bar and line chart with number of sales and referrals in 12 months. Pitch your topic with ease and precision using this Project Metrics Dashboard With Monthly Sales Professional PDF. This layout presents information on Project Progress, Project Spend, Sales Graph. It is also available for immediate download and adjustment. So, changes can be made in the color, design, graphics or any other component to create a unique layout.
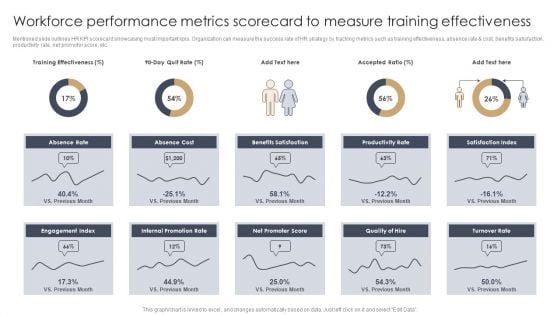
Workforce Performance Metrics Scorecard To Measure Training Effectiveness Information PDF
Mentioned slide outlines HR KPI scorecard showcasing most important kpis. Organization can measure the success rate of HR strategy by tracking metrics such as training effectiveness, absence rate and cost, benefits satisfaction, productivity rate, net promotor score, etc.Pitch your topic with ease and precision using this Workforce Performance Metrics Scorecard To Measure Training Effectiveness Information PDF. This layout presents information on Absence Rate, Internal Promotion, Engagement Index. It is also available for immediate download and adjustment. So, changes can be made in the color, design, graphics or any other component to create a unique layout.
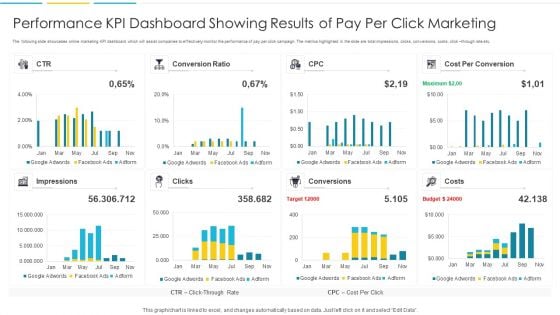
Performance KPI Dashboard Showing Results Of Pay Per Click Marketing Portrait PDF
The following slide showcases online marketing KPI dashboard which will assist companies to effectively monitor the performance of pay per click campaign. The metrics highlighted in the slide are total impressions, clicks, conversions, costs, click through rate etc. Pitch your topic with ease and precision using this Performance KPI Dashboard Showing Results Of Pay Per Click Marketing Portrait PDF. This layout presents information on Impressions, Target, Budget. It is also available for immediate download and adjustment. So, changes can be made in the color, design, graphics or any other component to create a unique layout.
Project Error Tracking KPI Dashboard Themes PDF
This slide illustrates the dashboard for the project issue tracking and management. It includes the column chart for issues assignee, incomplete issues by priority and project, monthly percentage increase in issues created and closed, etc. Pitch your topic with ease and precision using this Project Error Tracking KPI Dashboard Themes PDF. This layout presents information on Issues Assignee, Issue Status, Incomplete Issues. It is also available for immediate download and adjustment. So, changes can be made in the color, design, graphics or any other component to create a unique layout.
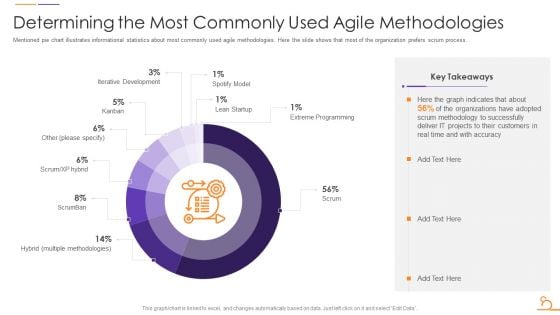
Agile Techniques For Data Migration Determining The Most Commonly Used Agile Methodologies Graphics PDF
Mentioned pie chart illustrates informational statistics about most commonly used agile methodologies. Here the slide shows that most of the organization prefers scrum process. Deliver and pitch your topic in the best possible manner with this Agile Techniques For Data Migration Determining The Most Commonly Used Agile Methodologies Graphics PDF. Use them to share invaluable insights on Iterative Development, Spotify Model, Lean Startup, Extreme Programming, Scrumban and impress your audience. This template can be altered and modified as per your expectations. So, grab it now.
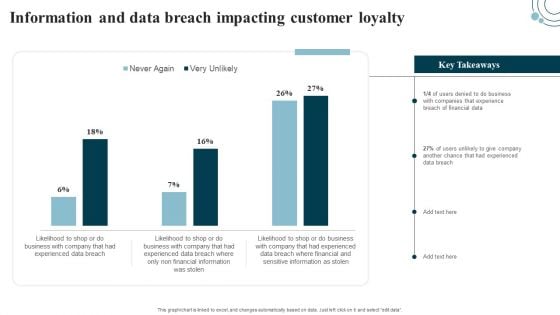
Developing IT Security Strategy Information And Data Breach Impacting Customer Loyalty Template PDF
This graph or chart is linked to excel, and changes automatically based on data. Just left click on it and select edit data. Get a simple yet stunning designed Developing IT Security Strategy Information And Data Breach Impacting Customer Loyalty Template PDF. It is the best one to establish the tone in your meetings. It is an excellent way to make your presentations highly effective. So, download this PPT today from Slidegeeks and see the positive impacts. Our easy-to-edit Developing IT Security Strategy Information And Data Breach Impacting Customer Loyalty Template PDF can be your go-to option for all upcoming conferences and meetings. So, what are you waiting for Grab this template today.

Talent Acquisition And Recruitment Methods Used By Hiring Department Ppt PowerPoint Presentation Layouts Templates PDF
This graph or chart is linked to excel, and changes automatically based on data. Just left click on it and select Edit Data. Showcasing this set of slides titled talent acquisition and recruitment methods used by hiring department ppt powerpoint presentation layouts templates pdf. The topics addressed in these templates are other methods, paid software, job fairs, employee referrals, jobs boards, social networks. All the content presented in this PPT design is completely editable. Download it and make adjustments in color, background, font etc. as per your unique business setting.
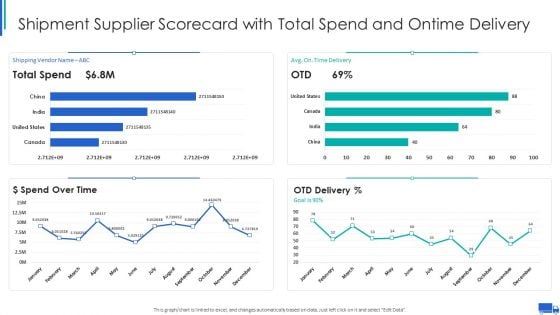
Shipment Supplier Scorecard With Total Spend And Ontime Delivery Ppt Slides Templates PDF
This graph or chart is linked to excel, and changes automatically based on data. Just left click on it and select Edit Data. Deliver and pitch your topic in the best possible manner with this Shipment Supplier Scorecard With Total Spend And Ontime Delivery Ppt Slides Templates PDF. Use them to share invaluable insights on Shipping Vendor Avg, Time Delivery Goal, Spend Over Time, OTD Delivery Percent and impress your audience. This template can be altered and modified as per your expectations. So, grab it now.
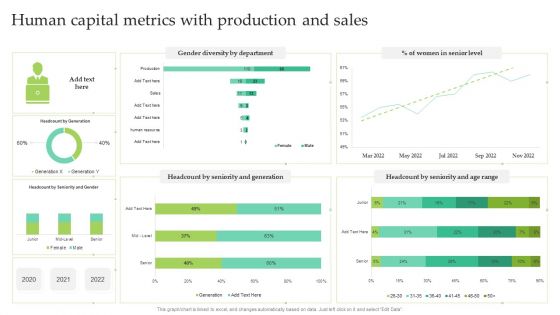
Human Capital Metrics With Production And Sales Ppt Infographic Template Summary PDF
This graph or chart is linked to excel, and changes automatically based on data. Just left click on it and select Edit Data. Showcasing this set of slides titled Human Capital Metrics With Production And Sales Ppt Infographic Template Summary PDF. The topics addressed in these templates are Women Senior Level, Gender Diversity Department, Seniority And Generation. All the content presented in this PPT design is completely editable. Download it and make adjustments in color, background, font etc. as per your unique business setting.
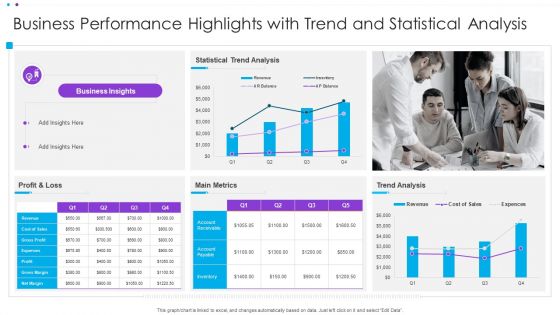
Business Performance Highlights With Trend And Statistical Analysis Ppt Infographic Template Display PDF
This graph or chart is linked to excel, and changes automatically based on data. Just left click on it and select Edit Data. Pitch your topic with ease and precision using this Business Performance Highlights With Trend And Statistical Analysis Ppt Infographic Template Display PDF. This layout presents information on Statistical Trend Analysis, Main Metrics, Profit And Loss. It is also available for immediate download and adjustment. So, changes can be made in the color, design, graphics or any other component to create a unique layout.
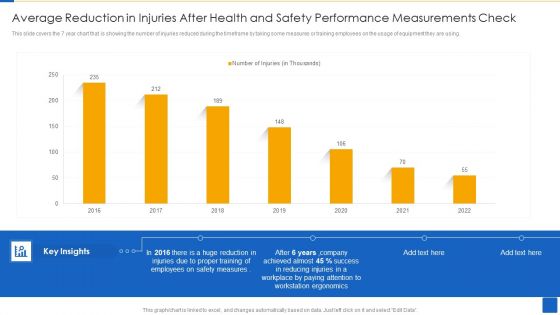
Average Reduction In Injuries After Health And Safety Performance Measurements Check Template PDF
This slide covers the 7 year chart that is showing the number of injuries reduced during the timeframe by taking some measures or training employees on the usage of equipment they are using. Showcasing this set of slides titled Average Reduction In Injuries After Health And Safety Performance Measurements Check Template PDF The topics addressed in these templates are Employees Safety Measures, Workstation Ergonomics, Workplace Paying Attention All the content presented in this PPT design is completely editable. Download it and make adjustments in color, background, font etc. as per your unique business setting.
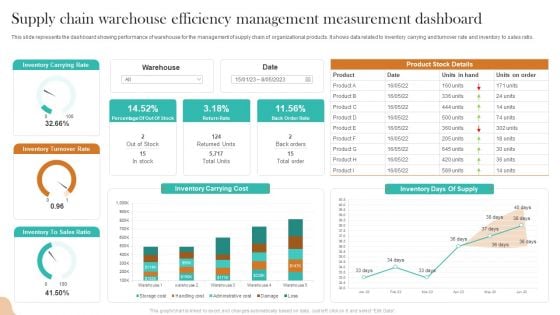
Supply Chain Warehouse Efficiency Management Measurement Dashboard Inspiration PDF
This slide represents the dashboard showing performance of warehouse for the management of supply chain of organizational products. It shows data related to inventory carrying and turnover rate and inventory to sales ratio. Pitch your topic with ease and precision using this Supply Chain Warehouse Efficiency Management Measurement Dashboard Inspiration PDF. This layout presents information on Inventory Carrying Rate, Inventory Turnover Rate, Inventory Carrying Cost. It is also available for immediate download and adjustment. So, changes can be made in the color, design, graphics or any other component to create a unique layout.

Organizing Security Awareness Major Statistics Of Cyber Security Awareness Formats PDF
This graph or chart is linked to excel, and changes automatically based on data. Just left click on it and select Edit Data. Welcome to our selection of the Organizing Security Awareness Major Statistics Of Cyber Security Awareness Formats PDF. These are designed to help you showcase your creativity and bring your sphere to life. Planning and Innovation are essential for any business that is just starting out. This collection contains the designs that you need for your everyday presentations. All of our PowerPoints are 100 percent editable, so you can customize them to suit your needs. This multi-purpose template can be used in various situations. Grab these presentation templates today.

Improving Corporate Performance Sales Opportunity Monitoring Dashboard Portrait PDF
This graph or chart is linked to excel, and changes automatically based on data. Just left click on it and select Edit Data. Welcome to our selection of the Improving Corporate Performance Sales Opportunity Monitoring Dashboard Portrait PDF. These are designed to help you showcase your creativity and bring your sphere to life. Planning and Innovation are essential for any business that is just starting out. This collection contains the designs that you need for your everyday presentations. All of our PowerPoints are 100 percent editable, so you can customize them to suit your needs. This multi-purpose template can be used in various situations. Grab these presentation templates today.

Modal Transportation Share In United States Brochure PDF
The slide shows the pie chart presentation of percentage share of all modes of transportations Trains, Passenger cars, Other motor, buses etc., that travelers used to commute. Additionally, it provides key details related to companys strategic plan to attract new customers.Deliver and pitch your topic in the best possible manner with this modal transportation share in united states brochure pdf. Use them to share invaluable insights on transportation share 2021 and impress your audience. This template can be altered and modified as per your expectations. So, grab it now.
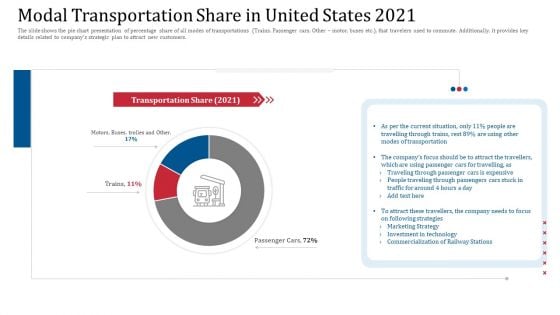
Modal Transportation Share In United States 2021 Introduction PDF
The slide shows the pie chart presentation of percentage share of all modes of transportations Trains, Passenger cars, Other motor, buses etc, that travelers used to commute. Additionally, it provides key details related to companys strategic plan to attract new customers.Deliver an awe inspiring pitch with this creative modal transportation share in united states 2021 introduction pdf bundle. Topics like modes of transportation, commercialization of railway, marketing strategy can be discussed with this completely editable template. It is available for immediate download depending on the needs and requirements of the user.
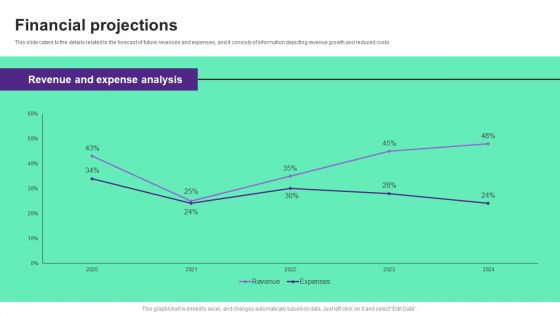
Online Store Investment Pitch Deck Financial Projections Information PDF
This slide caters to the details related to the forecast of future revenues and expenses, and it consists of information depicting revenue growth and reduced costs. Make sure to capture your audiences attention in your business displays with our gratis customizable Online Store Investment Pitch Deck Financial Projections Information PDF. These are great for business strategies, office conferences, capital raising or task suggestions. If you desire to acquire more customers for your tech business and ensure they stay satisfied, create your own sales presentation with these plain slides.
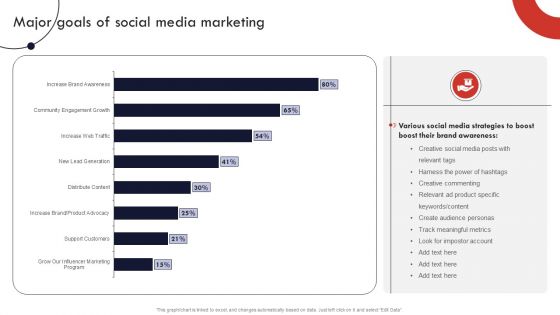
Product And Services Promotion Major Goals Of Social Media Marketing Slides PDF
This graph or chart is linked to excel, and changes automatically based on data. Just left click on it and select Edit Data. From laying roadmaps to briefing everything in detail, our templates are perfect for you. You can set the stage with your presentation slides. All you have to do is download these easy-to-edit and customizable templates. Product And Services Promotion Major Goals Of Social Media Marketing Slides PDF will help you deliver an outstanding performance that everyone would remember and praise you for. Do download this presentation today.


 Continue with Email

 Home
Home


