Cost Chart
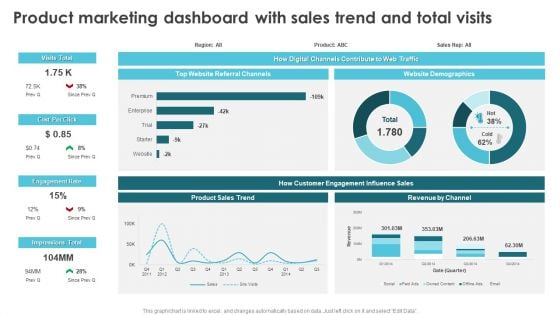
Product Marketing For Generating Product Marketing Dashboard With Sales Trend Designs PDF
This graph or chart is linked to excel, and changes automatically based on data. Just left click on it and select Edit Data. From laying roadmaps to briefing everything in detail, our templates are perfect for you. You can set the stage with your presentation slides. All you have to do is download these easy-to-edit and customizable templates. Product Marketing For Generating Product Marketing Dashboard With Sales Trend Designs PDF will help you deliver an outstanding performance that everyone would remember and praise you for. Do download this presentation today.
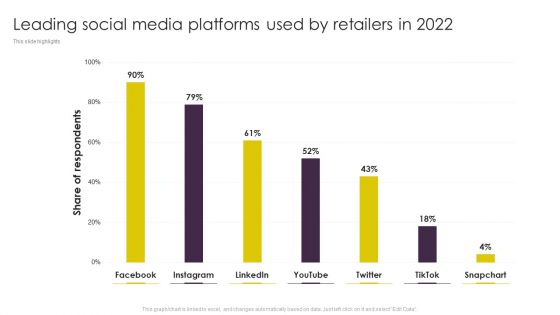
Implementing Digital Marketing Leading Social Media Platforms Used By Retailers In 2022 Structure PDF
This graph or chart is linked to excel, and changes automatically based on data. Just left click on it and select Edit Data. From laying roadmaps to briefing everything in detail, our templates are perfect for you. You can set the stage with your presentation slides. All you have to do is download these easy-to-edit and customizable templates. Implementing Digital Marketing Leading Social Media Platforms Used By Retailers In 2022 Structure PDF will help you deliver an outstanding performance that everyone would remember and praise you for. Do download this presentation today.
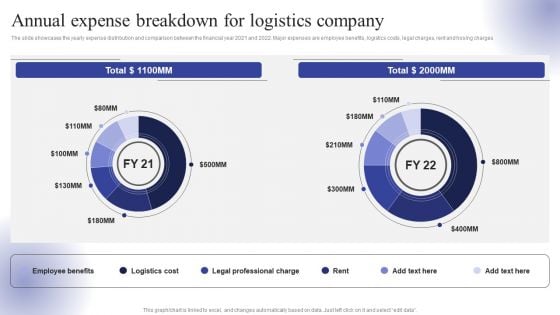
Annual Expense Breakdown For Logistics Company Ppt Summary Demonstration PDF
The slide showcases the yearly expense distribution and comparison between the financial year 2021 and 2022. Major expenses are employee benefits, logistics costs, legal charges, rent and hosing charges. Slidegeeks is one of the best resources for PowerPoint templates. You can download easily and regulate Annual Expense Breakdown For Logistics Company Ppt Summary Demonstration PDF for your personal presentations from our wonderful collection. A few clicks is all it takes to discover and get the most relevant and appropriate templates. Use our Templates to add a unique zing and appeal to your presentation and meetings. All the slides are easy to edit and you can use them even for advertisement purposes.
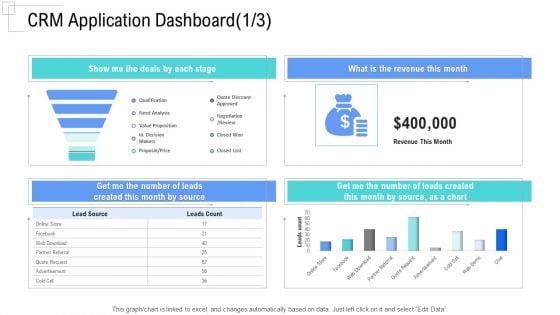
Managing Customer Experience CRM Application Dashboard Month Mockup PDF
This graph or chart is linked to excel, and changes automatically based on data. Just left click on it and select Edit Data.Deliver an awe-inspiring pitch with this creative managing customer experience crm application dashboard month mockup pdf bundle. Topics like show me the deals by each stage, what is the revenue this month, get me the number of leads created this month by source can be discussed with this completely editable template. It is available for immediate download depending on the needs and requirements of the user.

Managing Customer Experience CRM Data Analysis Sales Pictures PDF
This graph or chart is linked to excel, and changes automatically based on data. Just left click on it and select Edit Data.Deliver and pitch your topic in the best possible manner with this managing customer experience crm data analysis sales pictures pdf. Use them to share invaluable insights on entities by rep, completed activities l, biz notes this month, phone calls last 3 months, activity last 3 months and impress your audience. This template can be altered and modified as per your expectations. So, grab it now.
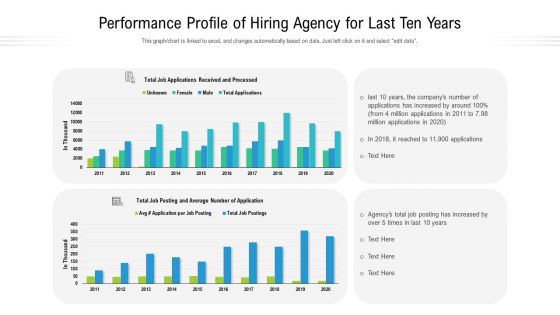
Performance Profile Of Hiring Agency For Last Ten Years Ppt Show Styles PDF
This graph to chart is linked to excel, and changes automatically based on data. Just left click on it and select edit data. Showcasing this set of slides titled performance profile of hiring agency for last ten years ppt show styles pdf. The topics addressed in these templates are performance profile of hiring agency for last ten years. All the content presented in this PPT design is completely editable. Download it and make adjustments in color, background, font etc. as per your unique business setting.
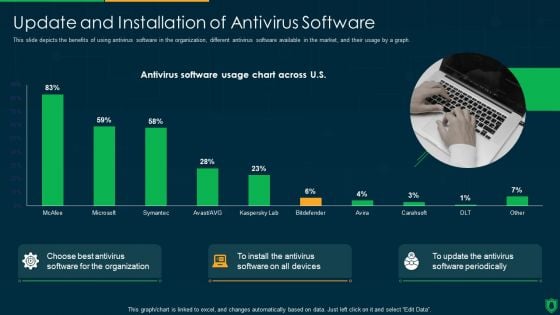
Info Security Update And Installation Of Antivirus Software Ppt PowerPoint Presentation File Designs PDF
This slide depicts the benefits of using antivirus software in the organization, different antivirus software available in the market, and their usage by a graph. Deliver and pitch your topic in the best possible manner with this info security update and installation of antivirus software ppt powerpoint presentation file designs pdf. Use them to share invaluable insights on antivirus software usage chart across us, choose best antivirus, organization and impress your audience. This template can be altered and modified as per your expectations. So, grab it now.
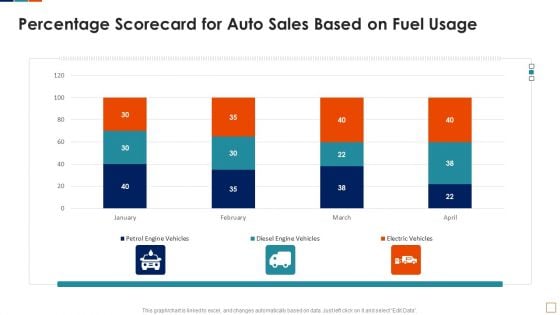
Automobile Sales Scorecard Percentage Scorecard For Auto Sales Based On Fuel Usage Graphics PDF
This graph or chart is linked to excel, and changes automatically based on data. Just left click on it and select Edit Data. Deliver and pitch your topic in the best possible manner with this Automobile Sales Scorecard Percentage Scorecard For Auto Sales Based On Fuel Usage Graphics PDF. Use them to share invaluable insights on Petrol Engine Vehicles, Diesel Engine Vehicles, Electric Vehicles Sales and impress your audience. This template can be altered and modified as per your expectations. So, grab it now.
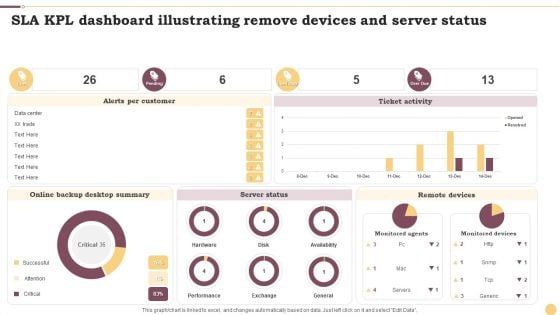
SLA KPL Dashboard Illustrating Remove Devices And Server Status Ppt Inspiration Layout Ideas PDF
This graph or chart is linked to excel, and changes automatically based on data. Just left click on it and select Edit Data. Showcasing this set of slides titled SLA KPL Dashboard Illustrating Remove Devices And Server Status Ppt Inspiration Layout Ideas PDF. The topics addressed in these templates are Alerts Per Customer, Ticket Activity, Server Status. All the content presented in this PPT design is completely editable. Download it and make adjustments in color, background, font etc. as per your unique business setting.

Prevention Of Information Key Statistics Showing The Impact Of Security Awareness Infographics PDF
This graph or chart is linked to excel, and changes automatically based on data. Just left click on it and select Edit Data. This modern and well-arranged Prevention Of Information Key Statistics Showing The Impact Of Security Awareness Infographics PDF provides lots of creative possibilities. It is very simple to customize and edit with the Powerpoint Software. Just drag and drop your pictures into the shapes. All facets of this template can be edited with Powerpoint, no extra software is necessary. Add your own material, put your images in the places assigned for them, adjust the colors, and then you can show your slides to the world, with an animated slide included.
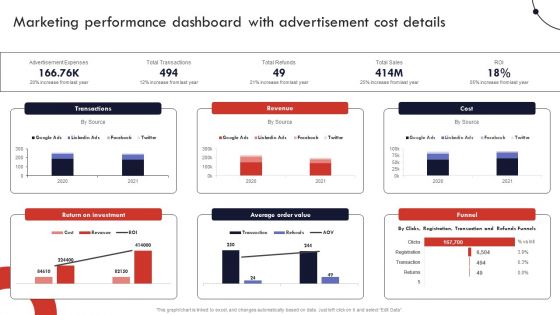
Product And Services Promotion Marketing Performance Dashboard With Advertisement Graphics PDF
This graph or chart is linked to excel, and changes automatically based on data. Just left click on it and select Edit Data. Slidegeeks is here to make your presentations a breeze with Product And Services Promotion Marketing Performance Dashboard With Advertisement Graphics PDF With our easy-to-use and customizable templates, you can focus on delivering your ideas rather than worrying about formatting. With a variety of designs to choose from, youre sure to find one that suits your needs. And with animations and unique photos, illustrations, and fonts, you can make your presentation pop. So whether youre giving a sales pitch or presenting to the board, make sure to check out Slidegeeks first.
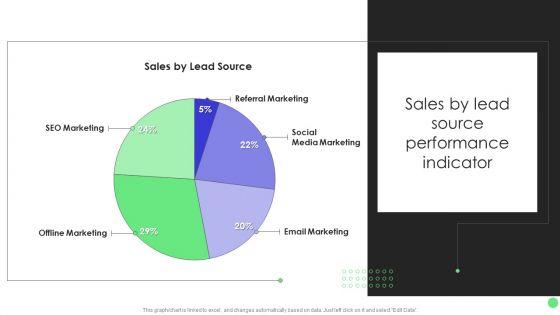
Comprehensive Guide For Launch Sales By Lead Source Performance Indicator Inspiration PDF
This graph or chart is linked to excel, and changes automatically based on data. Just left click on it and select Edit Data. The Comprehensive Guide For Launch Sales By Lead Source Performance Indicator Inspiration PDF is a compilation of the most recent design trends as a series of slides. It is suitable for any subject or industry presentation, containing attractive visuals and photo spots for businesses to clearly express their messages. This template contains a variety of slides for the user to input data, such as structures to contrast two elements, bullet points, and slides for written information. Slidegeeks is prepared to create an impression.
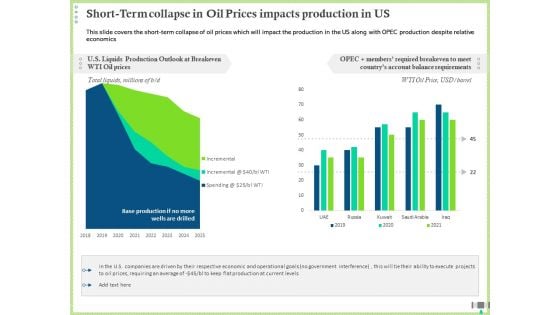
Post COVID Recovery Strategy Oil Gas Industry Short Term Collapse In Oil Prices Impacts Production In Us Download PDF
This slide covers the short-term collapse of oil prices which will impact the production in the US along with OPEC production despite relative economics. Deliver and pitch your topic in the best possible manner with this post covid recovery strategy oil gas industry short term collapse in oil prices impacts production in us download pdf. Use them to share invaluable insights on short term collapse in oil prices impacts production in us and impress your audience. This template can be altered and modified as per your expectations. So, grab it now.
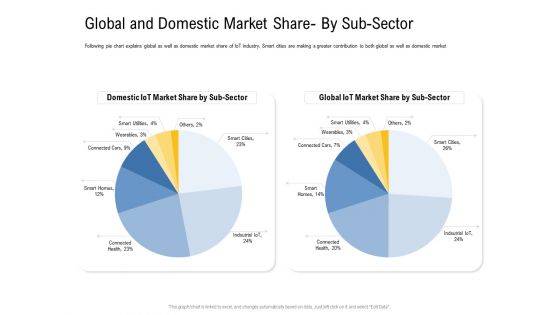
IOT Industry Assessment Global And Domestic Market Share By Sub Sector Ppt Layouts Graphics PDF
Following pie chart explains global as well as domestic market share of IoT industry. Smart cities are making a greater contribution to both global as well as domestic market. Deliver an awe inspiring pitch with this creative iot industry assessment global and domestic market share by sub sector ppt layouts graphics pdf bundle. Topics like global and domestic market share by sub sector can be discussed with this completely editable template. It is available for immediate download depending on the needs and requirements of the user.
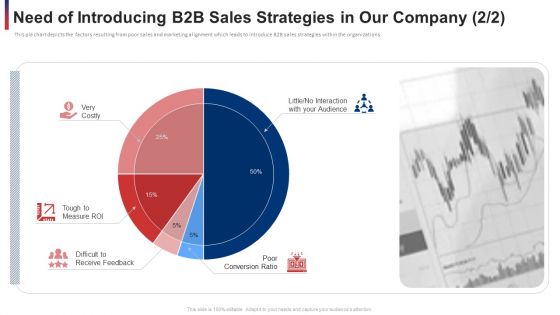
Need Of Introducing B2b Sales Strategies In Our Company Measure Ppt Infographics Skills PDF
This pie chart depicts the factors resulting from poor sales and marketing alignment which leads to introduce B2B sales strategies within the organizations. Deliver and pitch your topic in the best possible manner with this need of introducing b2b sales strategies in our company measure ppt infographics skills pdf. Use them to share invaluable insights on need of introducing b2b sales strategies in our company and impress your audience. This template can be altered and modified as per your expectations. So, grab it now.
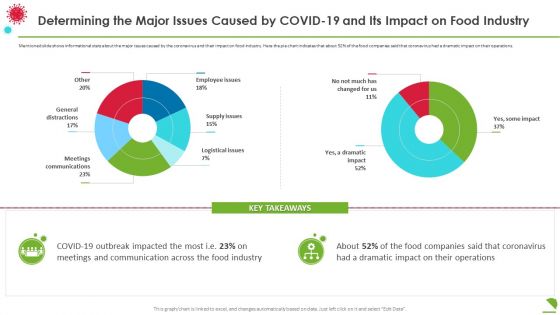
Determining The Major Issues Caused By Covid19 And Its Impact On Food Industry Demonstration PDF
Mentioned slide shows informational stats about the major issues caused by the coronavirus and their impact on food industry. Here the pie chart indicates that about 52 percentage of the food companies said that coronavirus had a dramatic impact on their operations. Deliver and pitch your topic in the best possible manner with this determining the major issues caused by covid19 and its impact on food industry demonstration pdf. Use them to share invaluable insights on communication, industry, dramatic and impress your audience. This template can be altered and modified as per your expectations. So, grab it now.
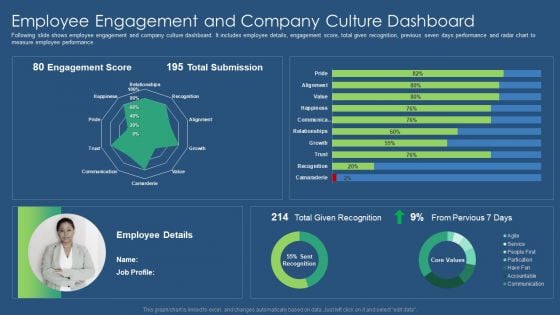
Sustainability Calculation With KPI Employee Engagement And Company Culture Sample PDF Topics PDF
Following slide shows employee engagement and company culture dashboard. It includes employee details, engagement score, total given recognition, previous seven days performance and radar chart to measure employee performance. Deliver and pitch your topic in the best possible manner with this sustainability calculation with kpi employee engagement and company culture sample pdf. Use them to share invaluable insights on employee engagement and company culture dashboard and impress your audience. This template can be altered and modified as per your expectations. So, grab it now.
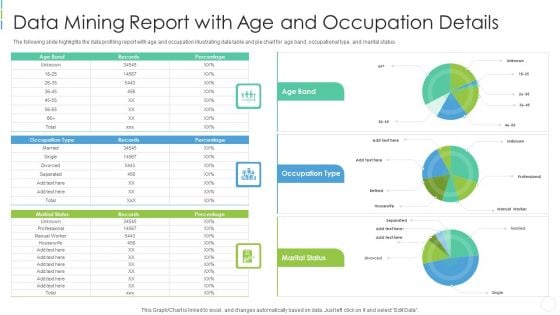
Data Mining Report With Age And Occupation Details Background PDF
The following slide highlights the data profiling report with age and occupation illustrating data table and pie chart for age band, occupational type, and marital status Showcasing this set of slides titled data mining report with age and occupation details background pdf . The topics addressed in these templates are data mining report with age and occupation details . All the content presented in this PPT design is completely editable. Download it and make adjustments in color, background, font etc. as per your unique business setting.
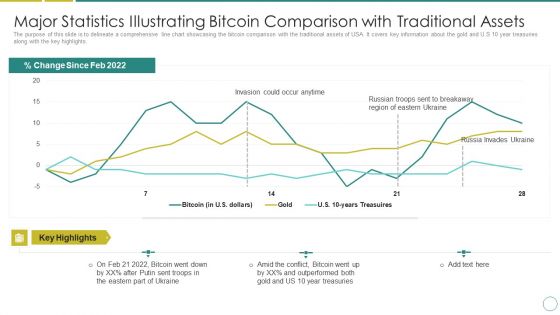
Russia Ukraine Major Statistics Illustrating Bitcoin Comparison With Traditional Assets Guidelines PDF
The purpose of this slide is to delineate a comprehensive line chart showcasing the bitcoin comparison with the traditional assets of USA. It covers key information about the gold and U.S 10 year treasuries along with the key highlights. Deliver an awe inspiring pitch with this creative russia ukraine major statistics illustrating bitcoin comparison with traditional assets guidelines pdf bundle. Topics like invasion could occur anytime, percent change since feb 2022 can be discussed with this completely editable template. It is available for immediate download depending on the needs and requirements of the user.
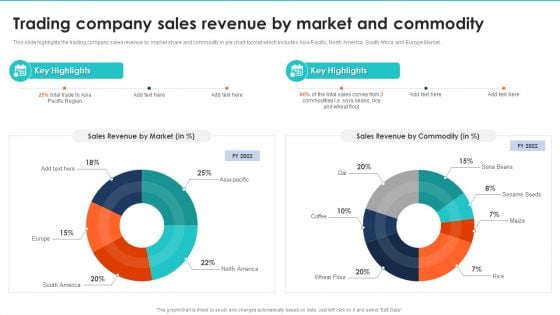
Export Management Company Profile Trading Company Sales Revenue By Market And Commodity Background PDF
This slide highlights the trading company sales revenue by market share and commodity in pie chart format which includes Asia Pacific, North America, South Africa and Europe Market. Deliver and pitch your topic in the best possible manner with this Export Management Company Profile Trading Company Sales Revenue By Market And Commodity Background PDF. Use them to share invaluable insights on Sales Revenue By Market, Sales Revenue By Commodity and impress your audience. This template can be altered and modified as per your expectations. So, grab it now.
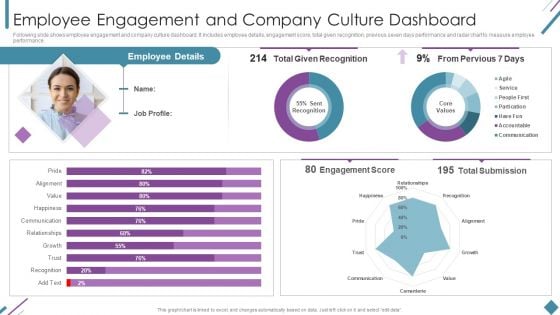
Metrics To Measure Business Performance Employee Engagement And Company Culture Demonstration PDF
Following slide shows employee engagement and company culture dashboard. It includes employee details, engagement score, total given recognition, previous seven days performance and radar chart to measure employee performance. Deliver and pitch your topic in the best possible manner with this Metrics To Measure Business Performance Employee Engagement And Company Culture Demonstration PDF. Use them to share invaluable insights on Employee Details, Total Given Recognition, Engagement Score and impress your audience. This template can be altered and modified as per your expectations. So, grab it now.
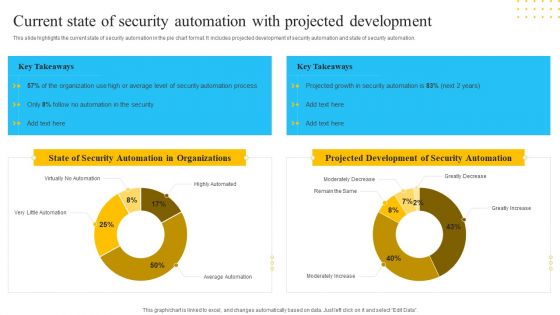
IT Security Automation Tools Integration Current State Of Security Automation With Projected Introduction PDF
This slide highlights the current state of security automation in the pie chart format. It includes projected development of security automation and state of security automation. Deliver and pitch your topic in the best possible manner with this IT Security Automation Tools Integration Current State Of Security Automation With Projected Introduction PDF. Use them to share invaluable insights on State Security, Automation Organizations, Projected Development, Security Automation and impress your audience. This template can be altered and modified as per your expectations. So, grab it now.
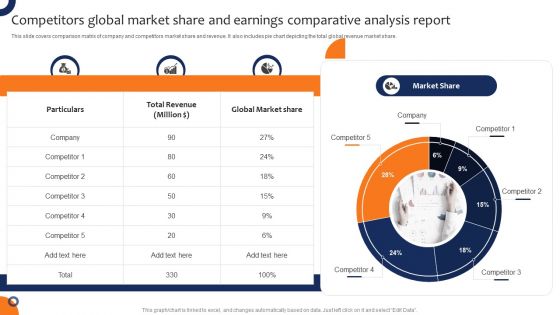
Competitors Global Market Share And Earnings Comparative Analysis Report Slides PDF
This slide covers comparison matrix of company and competitors market share and revenue. It also includes pie chart depicting the total global revenue market share. Showcasing this set of slides titled Competitors Global Market Share And Earnings Comparative Analysis Report Slides PDF. The topics addressed in these templates are Revenue, Global Market Share, Earnings Comparative Analysis Report. All the content presented in this PPT design is completely editable. Download it and make adjustments in color, background, font etc. as per your unique business setting.
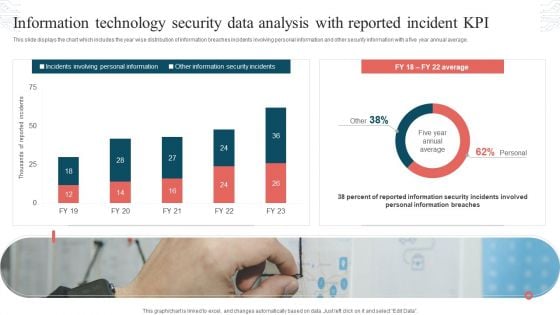
Information Technology Security Data Analysis With Reported Incident KPI Download PDF
This slide displays the chart which includes the year wise distribution of information breaches incidents involving personal information and other security information with a five year annual average. Showcasing this set of slides titled Information Technology Security Data Analysis With Reported Incident KPI Download PDF. The topics addressed in these templates are Incidents Involving, Personal Information, Other Information, Security Incidents. All the content presented in this PPT design is completely editable. Download it and make adjustments in color, background, font etc. as per your unique business setting.
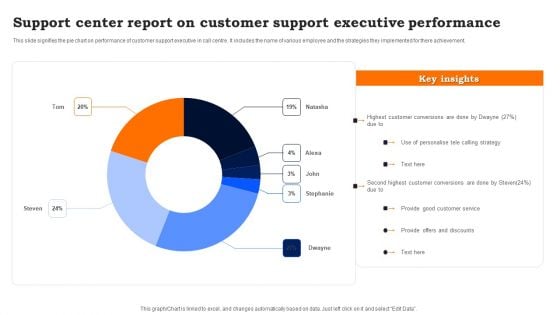
Support Center Report On Customer Support Executive Performance Sample PDF
This slide signifies the pie chart on performance of customer support executive in call centre. It includes the name of various employee and the strategies they implemented for there achievement. Showcasing this set of slides titled Support Center Report On Customer Support Executive Performance Sample PDF. The topics addressed in these templates are Use Of Personalise Telecalling, Provide Good Customer Service, Provide Offers And Discounts. All the content presented in this PPT design is completely editable. Download it and make adjustments in color, background, font etc. as per your unique business setting.
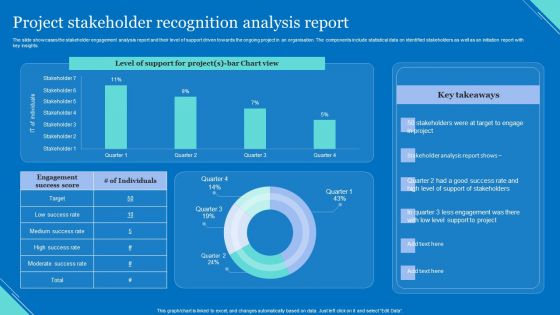
Project Stakeholder Recognition Analysis Report Elements PDF
The slide showcases the stakeholder engagement analysis report and their level of support driven towards the ongoing project in an organisation. The components include statistical data on identified stakeholders as well as an initiation report with key insights. Showcasing this set of slides titled Project Stakeholder Recognition Analysis Report Elements PDF. The topics addressed in these templates are Level Support, Chart View, Support Stakeholders. All the content presented in this PPT design is completely editable. Download it and make adjustments in color, background, font etc. as per your unique business setting.
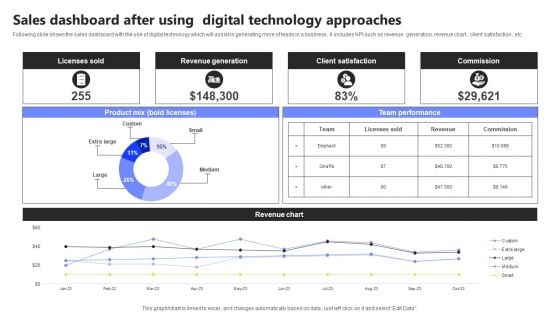
Sales Dashboard After Using Digital Technology Approaches Infographics PDF
Following slide shows the sales dashboard with the use of digital technology which will assist in generating more of leads in a business . It includes KPI such as revenue generation, revenue chart , client satisfaction , etc. Showcasing this set of slides titled Sales Dashboard After Using Digital Technology Approaches Infographics PDF. The topics addressed in these templates are Licenses Sold, Revenue Generation, Client Satisfaction. All the content presented in this PPT design is completely editable. Download it and make adjustments in color, background, font etc. as per your unique business setting.
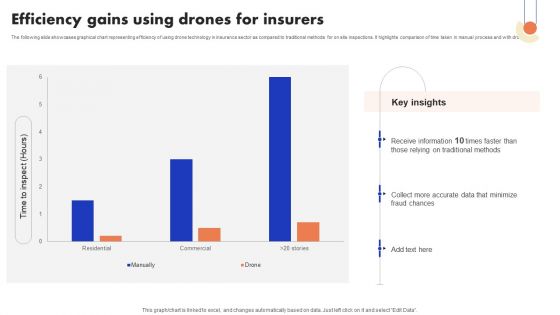
Implementation Of Digital Advancement Techniques Efficiency Gains Using Drones Pictures PDF
The following slide showcases graphical chart representing efficiency of using drone technology in insurance sector as compared to traditional methods for on site inspections. It highlights comparison of time taken in manual process and with drone. Want to ace your presentation in front of a live audience Our Implementation Of Digital Advancement Techniques Efficiency Gains Using Drones Pictures PDF can help you do that by engaging all the users towards you. Slidegeeks experts have put their efforts and expertise into creating these impeccable powerpoint presentations so that you can communicate your ideas clearly. Moreover, all the templates are customizable, and easy to edit and downloadable. Use these for both personal and commercial use.
Per Device Pricing Strategy For Managed Solutions Sales Projection For Future With A LA Carte Icons PDF
Purpose of the following slide is to show total projected sales based on A LA Crate based pricing model Boost your pitch with our creative Per Device Pricing Strategy For Managed Solutions Sales Projection For Future With A LA Carte Icons PDF. Deliver an awe-inspiring pitch that will mesmerize everyone. Using these presentation templates you will surely catch everyones attention. You can browse the ppts collection on our website. We have researchers who are experts at creating the right content for the templates. So you do not have to invest time in any additional work. Just grab the template now and use them.
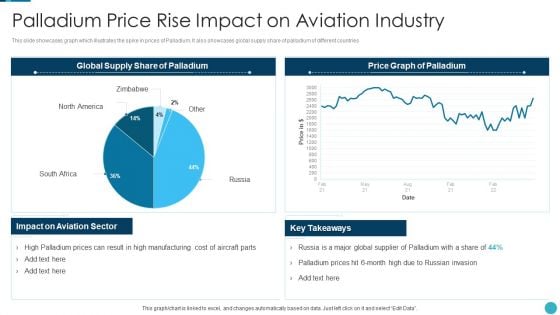
Russia Ukraine War Influence On Airline Sector Palladium Price Rise Impact On Aviation Industry Infographics PDF
This slide showcases graph which illustrates the spike in prices of Palladium. It also showcases global supply share of palladium of different countries Deliver an awe inspiring pitch with this creative russia ukraine war influence on airline sector palladium price rise impact on aviation industry infographics pdf bundle. Topics like palladium price rise impact on aviation industry can be discussed with this completely editable template. It is available for immediate download depending on the needs and requirements of the user.
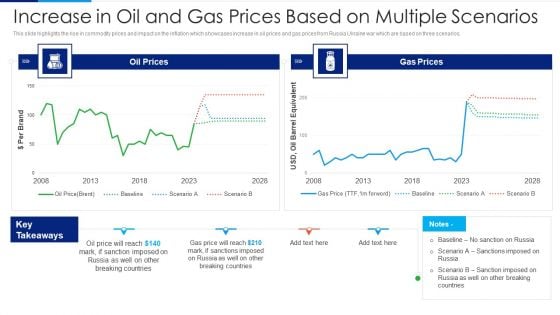
Russia Ukraine Conflict Effect Increase In Oil And Gas Prices Based On Multiple Scenarios Background PDF
This slide highlights the rise in commodity prices and impact on the inflation which showcases increase in oil prices and gas prices from Russia Ukraine war which are based on three scenarios. Deliver an awe inspiring pitch with this creative Russia Ukraine Conflict Effect Increase In Oil And Gas Prices Based On Multiple Scenarios Background PDF bundle. Topics like Oil Prices, Gas Prices, 2008 To 2028 can be discussed with this completely editable template. It is available for immediate download depending on the needs and requirements of the user.
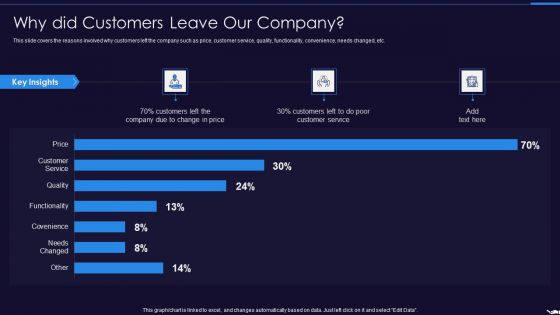
Optimize Marketing Pricing Why Did Customers Leave Our Company Themes PDF
This slide covers the reasons involved why customers left the company such as price, customer service, quality, functionality, convenience, needs changed, etc. Deliver and pitch your topic in the best possible manner with this optimize marketing pricing why did customers leave our company themes pdf. Use them to share invaluable insights on price, customer service, quality, functionality, convenience, needs changed and impress your audience. This template can be altered and modified as per your expectations. So, grab it now.
Customer Service Request Tickets Administration Dashboard Icons PDF
This slide covers division of tickets into different groups. It also includes a pie chart dividing tickets in multiple categories such as status, tech groups, alert level, request type and alert condition. Pitch your topic with ease and precision using this Customer Service Request Tickets Administration Dashboard Icons PDF. This layout presents information on Tickets Activity, Tickets Alert Level, Tickets Teach Group. It is also available for immediate download and adjustment. So, changes can be made in the color, design, graphics or any other component to create a unique layout.
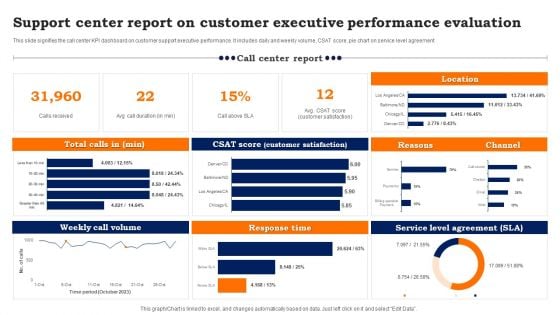
Support Center Report On Customer Executive Performance Evaluation Background PDF
This slide signifies the call center KPI dashboard on customer support executive performance. It includes daily and weekly volume, CSAT score, pie chart on service level agreement. Pitch your topic with ease and precision using this Support Center Report On Customer Executive Performance Evaluation Background PDF. This layout presents information on Weekly Call Volume, Response Time, Service Level Agreement. It is also available for immediate download and adjustment. So, changes can be made in the color, design, graphics or any other component to create a unique layout.
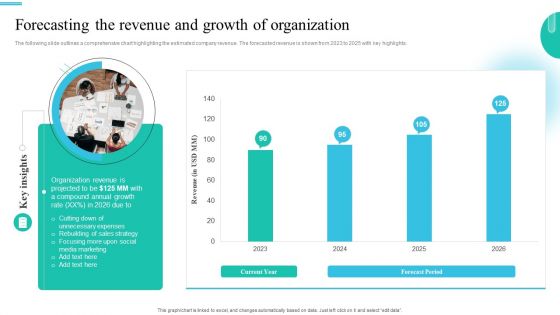
Monetary Planning And Evaluation Guide Forecasting The Revenue And Growth Of Organization Ppt Slides Outline PDF
The following slide outlines a comprehensive chart highlighting the estimated company revenue. The forecasted revenue is shown from 2023 to 2025 with key highlights. Make sure to capture your audiences attention in your business displays with our gratis customizable Monetary Planning And Evaluation Guide Forecasting The Revenue And Growth Of Organization Ppt Slides Outline PDF. These are great for business strategies, office conferences, capital raising or task suggestions. If you desire to acquire more customers for your tech business and ensure they stay satisfied, create your own sales presentation with these plain slides.
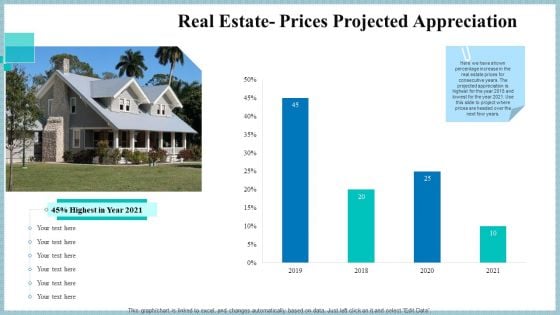
Real Property Strategic Plan Real Estate Prices Projected Appreciation Ppt Infographic Template Graphics Template PDF
Deliver an awe inspiring pitch with this creative real property strategic plan real estate prices projected appreciation ppt infographic template graphics template pdf bundle. Topics like real estate prices projected appreciation can be discussed with this completely editable template. It is available for immediate download depending on the needs and requirements of the user.
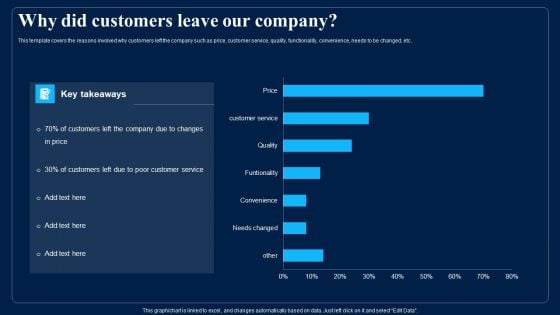
Identifying Optimum Pricing Methods For Business Why Did Customers Leave Our Company Diagrams PDF
This template covers the reasons involved why customers left the company such as price, customer service, quality, functionality, convenience, needs to be changed, etc. Deliver and pitch your topic in the best possible manner with this Identifying Optimum Pricing Methods For Business Why Did Customers Leave Our Company Diagrams PDF. Use them to share invaluable insights on Quality, Customer Service, Price and impress your audience. This template can be altered and modified as per your expectations. So, grab it now.
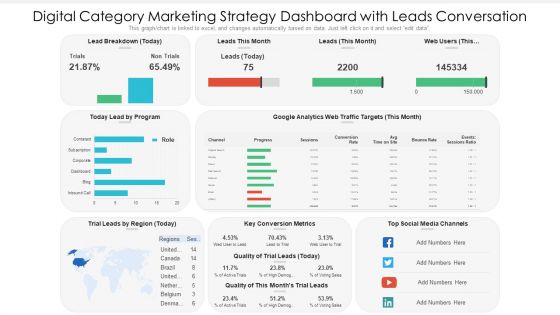
Digital Category Marketing Strategy Dashboard With Leads Conversation Ppt PowerPoint Presentation Slides Information PDF
This graph chart is linked to excel, and changes automatically based on data. Just left click on it and select edit data. Pitch your topic with ease and precision using this digital category marketing strategy dashboard with leads conversation ppt powerpoint presentation slides information pdf. This layout presents information on key conversion metrics, social media channels, lead by program. It is also available for immediate download and adjustment. So, changes can be made in the color, design, graphics or any other component to create a unique layout.
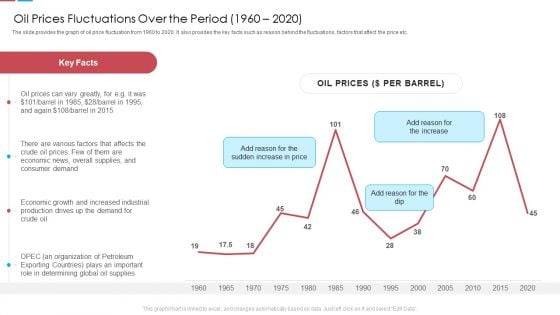
Oil Prices Fluctuations Over The Period 1960 2020 Ppt Styles Styles PDF
The slide provides the graph of oil price fluctuation from 1960 to 2020. It also provides the key facts such as reason behind the fluctuations, factors that affect the price etc. Deliver an awe inspiring pitch with this creative oil prices fluctuations over the period 1960 2020 ppt styles styles pdf bundle. Topics like oil prices fluctuations over the period 1960 to 2020 can be discussed with this completely editable template. It is available for immediate download depending on the needs and requirements of the user.
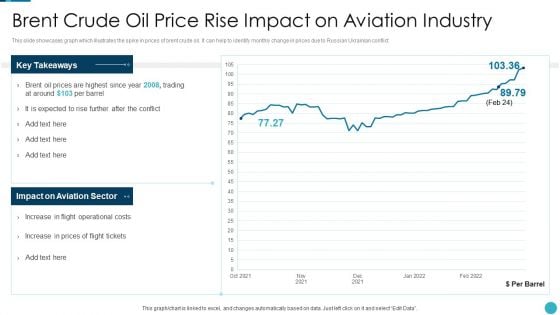
Russia Ukraine War Influence On Airline Sector Brent Crude Oil Price Rise Impact Ideas PDF
This slide showcases graph which illustrates the spike in prices of brent crude oil. It can help to identify monthly change in prices due to Russian Ukrainian conflict Deliver an awe inspiring pitch with this creative russia ukraine war influence on airline sector brent crude oil price rise impact ideas pdf bundle. Topics like brent crude oil price rise impact on aviation industry can be discussed with this completely editable template. It is available for immediate download depending on the needs and requirements of the user.
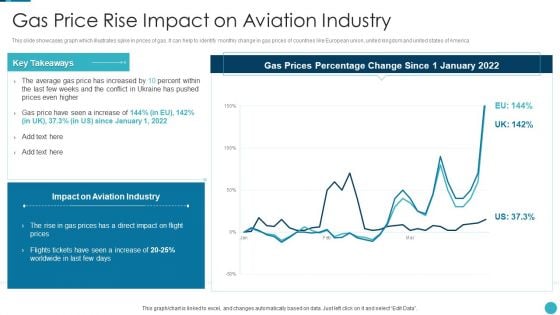
Russia Ukraine War Influence On Airline Sector Gas Price Rise Impact On Aviation Industry Infographics PDF
This slide showcases graph which illustrates spike in prices of gas. It can help to identify monthly change in gas prices of countries like European union, united kingdom and united states of America Deliver and pitch your topic in the best possible manner with this russia ukraine war influence on airline sector gas price rise impact on aviation industry infographics pdf Use them to share invaluable insights on gas price rise impact on aviation industry and impress your audience. This template can be altered and modified as per your expectations. So, grab it now.
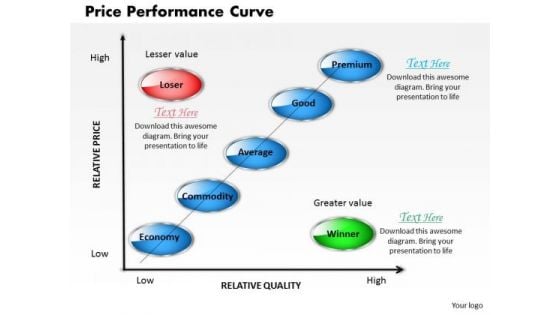
Business Diagram Price Performance Curve PowerPoint Ppt Presentation
Double The Impact With Our Business Diagram Price Performance Curve PowerPoint PPT Presentation PowerPoint Templates. Your Thoughts Will Have An Imposing Effect.
Strategic Plan To Optimize Budget Allocation To Prepare Recruitment Strategy Icons PDF
This slide focuses on budget allocation to prepare recruitment strategy which includes recruiting tools, jib advertising, employer branding, hiring agency costs, employee referral program, etc. Boost your pitch with our creative Strategic Plan To Optimize Budget Allocation To Prepare Recruitment Strategy Icons PDF. Deliver an awe-inspiring pitch that will mesmerize everyone. Using these presentation templates you will surely catch everyones attention. You can browse the ppts collection on our website. We have researchers who are experts at creating the right content for the templates. So you dont have to invest time in any additional work. Just grab the template now and use them.
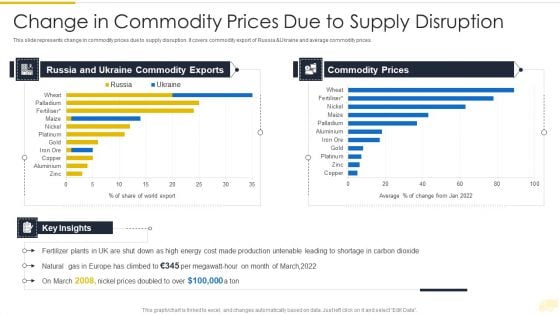
Russia Ukraine War Influence On International Supply Chain Change In Commodity Prices Summary PDF
This slide represents change in commodity prices due to supply disruption. It covers commodity export of Russia and Ukraine and average commodity prices. Deliver and pitch your topic in the best possible manner with this russia ukraine war influence on international supply chain change in commodity prices summary pdf Use them to share invaluable insights on change in commodity prices due to supply disruption and impress your audience. This template can be altered and modified as per your expectations. So, grab it now.
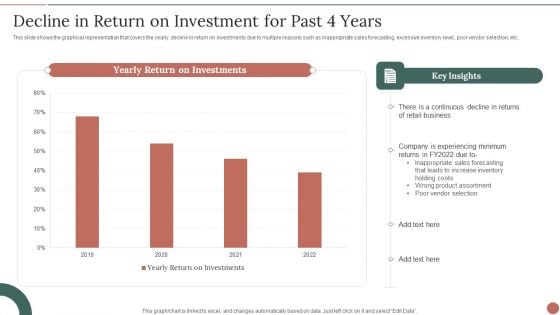
Retail Business Product Planning Procedure Decline In Return On Investment For Past 4 Years Rules PDF
This slide shows the graphical representation that covers the yearly decline in return on investments due to multiple reasons such as inappropriate sales forecasting, excessive inventory level, poor vendor selection, etc. Deliver an awe inspiring pitch with this creative Retail Business Product Planning Procedure Decline In Return On Investment For Past 4 Years Rules PDF bundle. Topics like Inappropriate Sales Forecasting, Holding Costs, Retail Business can be discussed with this completely editable template. It is available for immediate download depending on the needs and requirements of the user.
Customers Segmentation Based On Price Brand And Quality Ppt Icon Files PDF
In this slide, we group consumers based on low-price shoppers, local premium shoppers, Brand Loyal Shopper and lovers of premium. Deliver an awe inspiring pitch with this creative customers segmentation based on price brand and quality ppt icon files pdf bundle. Topics like customers segmentation based on price brand and quality can be discussed with this completely editable template. It is available for immediate download depending on the needs and requirements of the user.
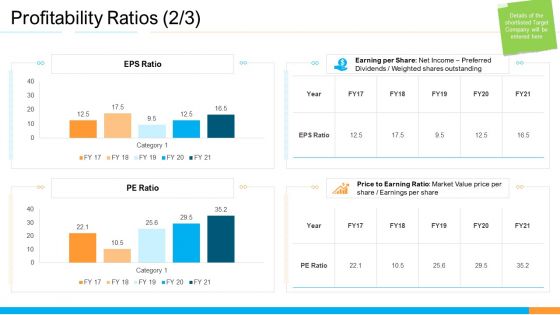
Business Takeover Plan For Inorganic Growth Profitability Ratios Price Mockup PDF
Deliver and pitch your topic in the best possible manner with this business takeover plan for inorganic growth profitability ratios price mockup pdf. Use them to share invaluable insights on earning per share net income preferred, dividends or weighted shares outstanding, price to earning ratio market value price and impress your audience. This template can be altered and modified as per your expectations. So, grab it now.
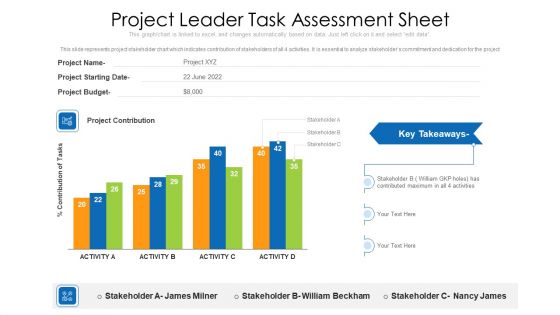
Project Leader Task Assessment Sheet Ppt PowerPoint Presentation Gallery Outline PDF
This slide represents project stakeholder chart which indicates contribution of stakeholders of all 4 activities. It is essential to analyze stakeholders commitment and dedication for the project. Pitch your topic with ease and precision using this project leader task assessment sheet ppt powerpoint presentation gallery outline pdf. This layout presents information on project leader task assessment sheet. It is also available for immediate download and adjustment. So, changes can be made in the color, design, graphics or any other component to create a unique layout.
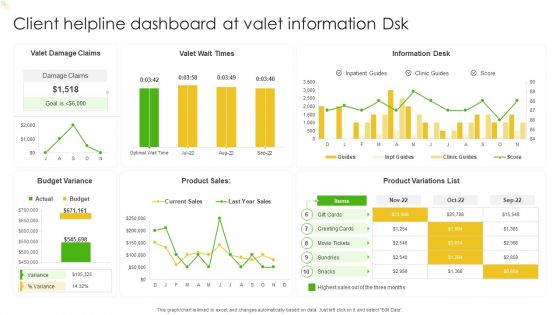
Client Helpline Dashboard At Valet Information Dsk Ppt Gallery Slide Portrait PDF
This graph or chart is linked to excel, and changes automatically based on data. Just left click on it and select Edit Data. Pitch your topic with ease and precision using this Client Helpline Dashboard At Valet Information Dsk Ppt Gallery Slide Portrait PDF. This layout presents information on Valet Damage Claims, Valet Wait Times, Information Desk. It is also available for immediate download and adjustment. So, changes can be made in the color, design, graphics or any other component to create a unique layout.
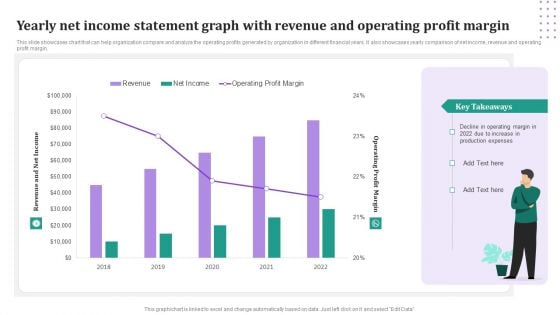
Yearly Net Income Statement Graph With Revenue And Operating Profit Margin Download PDF
This slide showcases chart that can help organization compare and analyze the operating profits generated by organization in different financial years. It also showcases yearly comparison of net income, revenue and operating profit margin. Pitch your topic with ease and precision using this Yearly Net Income Statement Graph With Revenue And Operating Profit Margin Download PDF. This layout presents information on Revenue, Net Income, Operating Profit Margin. It is also available for immediate download and adjustment. So, changes can be made in the color, design, graphics or any other component to create a unique layout.
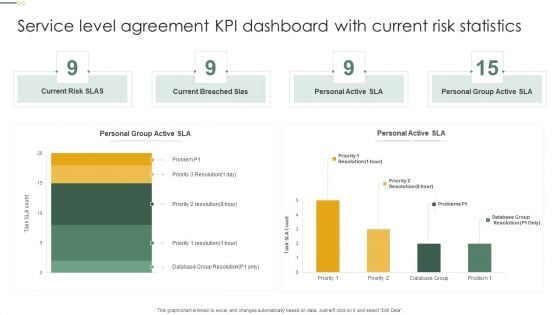
Service Level Agreement KPI Dashboard With Current Risk Statistics Topics PDF
This graph or chart is linked to excel, and changes automatically based on data. Just left click on it and select Edit Data. Pitch your topic with ease and precision using this Service Level Agreement KPI Dashboard With Current Risk Statistics Topics PDF. This layout presents information on Current Risk SLAS, Current Breached Slas, Personal Active SLA It is also available for immediate download and adjustment. So, changes can be made in the color, design, graphics or any other component to create a unique layout.
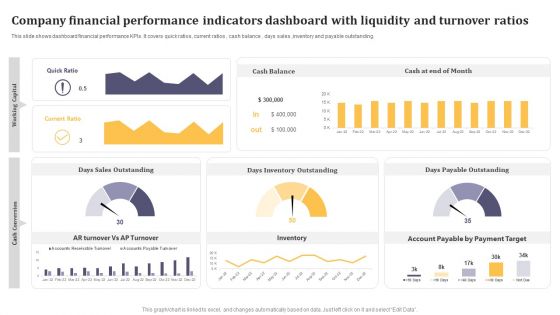
Company Financial Performance Indicators Dashboard With Liquidity And Turnover Ratios Formats PDF
This graph or chart is linked to excel, and changes automatically based on data. Just left click on it and select Edit Data. Pitch your topic with ease and precision using this Company Financial Performance Indicators Dashboard With Liquidity And Turnover Ratios Formats PDF. This layout presents information on Cash Balance, Days Inventory Outstanding, Days Payable Outstanding. It is also available for immediate download and adjustment. So, changes can be made in the color, design, graphics or any other component to create a unique layout.
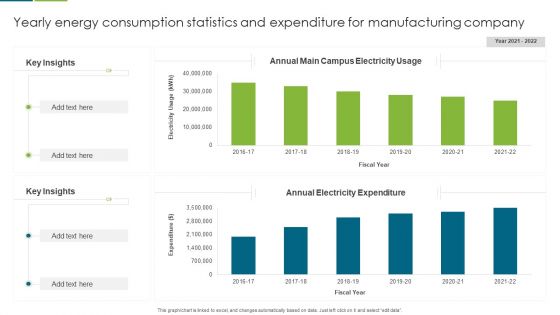
Yearly Energy Consumption Statistics And Expenditure For Manufacturing Company Guidelines PDF
This graph or chart is linked to excel, and changes automatically based on data. Just left click on it and select edit data. Pitch your topic with ease and precision using this Yearly Energy Consumption Statistics And Expenditure For Manufacturing Company Guidelines PDF. This layout presents information on Key Insights, Annual Electricity Expenditure, Annual Main Campus, Electricity Usage. It is also available for immediate download and adjustment. So, changes can be made in the color, design, graphics or any other component to create a unique layout.
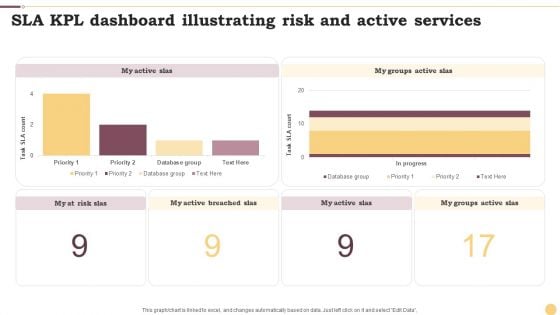
SLA KPL Dashboard Illustrating Risk And Active Services Ppt Portfolio Design Inspiration PDF
This graph or chart is linked to excel, and changes automatically based on data. Just left click on it and select Edit Data. Pitch your topic with ease and precision using this SLA KPL Dashboard Illustrating Risk And Active Services Ppt Portfolio Design Inspiration PDF. This layout presents information on My Active SLAs, Database Group, Priority. It is also available for immediate download and adjustment. So, changes can be made in the color, design, graphics or any other component to create a unique layout.
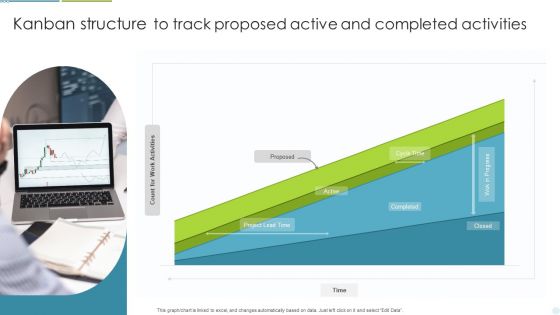
Kanban Structure To Track Proposed Active And Completed Activities Ppt Outline Slide Portrait PDF
This graph or chart is linked to excel, and changes automatically based on data. Just left click on it and select Edit Data. Pitch your topic with ease and precision using this Kanban Structure To Track Proposed Active And Completed Activities Ppt Outline Slide Portrait PDF. This layout presents information on Project Lead Time, Cycle Time, Completed. It is also available for immediate download and adjustment. So, changes can be made in the color, design, graphics or any other component to create a unique layout.
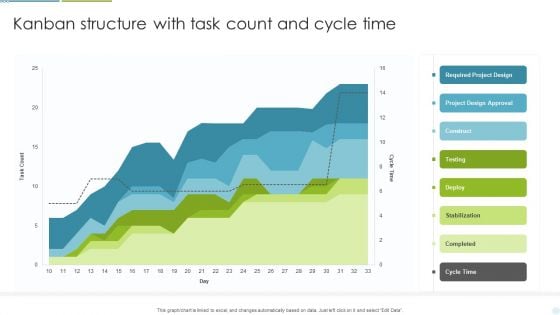
Kanban Structure With Task Count And Cycle Time Ppt Layouts Background Designs PDF
This graph or chart is linked to excel, and changes automatically based on data. Just left click on it and select Edit Data. Pitch your topic with ease and precision using this Kanban Structure With Task Count And Cycle Time Ppt Layouts Background Designs PDF. This layout presents information on Required Project Design, Project Design Approval, Construct. It is also available for immediate download and adjustment. So, changes can be made in the color, design, graphics or any other component to create a unique layout.
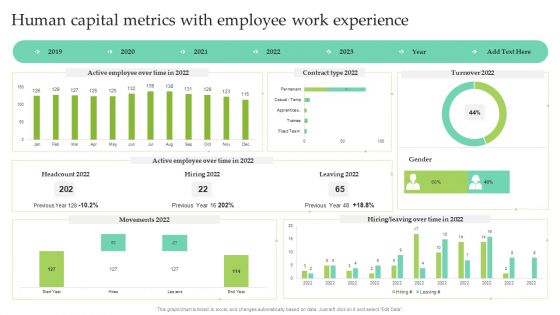
Human Capital Metrics With Employee Work Experience Ppt Show Images PDF
This graph or chart is linked to excel, and changes automatically based on data. Just left click on it and select Edit Data. Pitch your topic with ease and precision using this Human Capital Metrics With Employee Work Experience Ppt Show Images PDF. This layout presents information on Active Employee, Over Time, Contract Type 2022, Leaving 2022. It is also available for immediate download and adjustment. So, changes can be made in the color, design, graphics or any other component to create a unique layout.
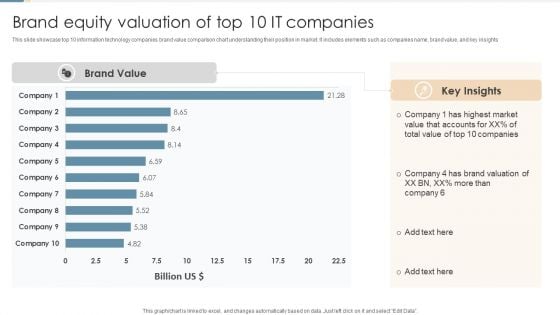
Brand Equity Valuation Of Top 10 IT Companies Ppt Portfolio Rules PDF
This slide showcase top 10 information technology companies brand value comparison chart understanding their position in market. It includes elements such as companies name, brand value, and key insights. Pitch your topic with ease and precision using this Brand Equity Valuation Of Top 10 IT Companies Ppt Portfolio Rules PDF. This layout presents information on Highest Market Value, Total Value, Brand Valuation. It is also available for immediate download and adjustment. So, changes can be made in the color, design, graphics or any other component to create a unique layout.
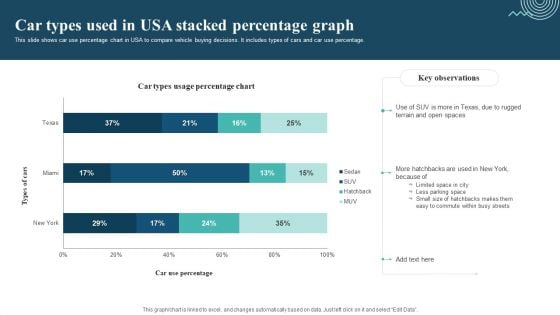
Car Types Used In Usa Stacked Percentage Graph Sample PDF
This slide shows car use percentage chart in USA to compare vehicle buying decisions. It includes types of cars and car use percentage. Pitch your topic with ease and precision using this Car Types Used In Usa Stacked Percentage Graph Sample PDF. This layout presents information on Limited Space In City, Less Parking Space, Easy To Commute. It is also available for immediate download and adjustment. So, changes can be made in the color, design, graphics or any other component to create a unique layout.
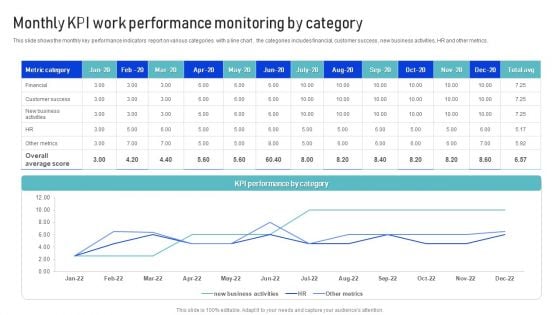
Monthly KPI Work Performance Monitoring By Category Microsoft PDF
This slide shows the monthly key performance indicators report on various categories with a line chart . the categories includes financial, customer success , new business activities, HR and other metrics. Pitch your topic with ease and precision using this Monthly KPI Work Performance Monitoring By Category Microsoft PDF. This layout presents information on Metrics, Financial, Customer Success. It is also available for immediate download and adjustment. So, changes can be made in the color, design, graphics or any other component to create a unique layout.


 Continue with Email

 Home
Home


