Cost Comparison
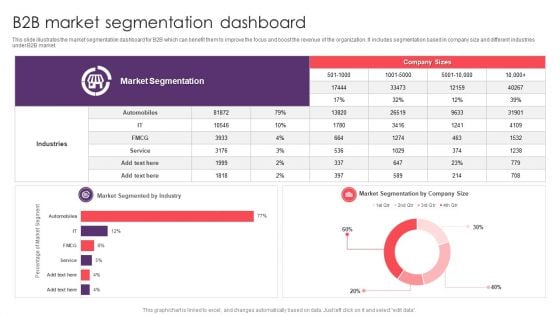
B2B Market Segmentation Dashboard Microsoft PDF
This slide illustrates the market segmentation dashboard for B2B which can benefit them to improve the focus and boost the revenue of the organization. It includes segmentation based in company size and different industries under B2B market. Pitch your topic with ease and precision using this B2B Market Segmentation Dashboard Microsoft PDF. This layout presents information on Industries, Market Segmentation, Service. It is also available for immediate download and adjustment. So, changes can be made in the color, design, graphics or any other component to create a unique layout.
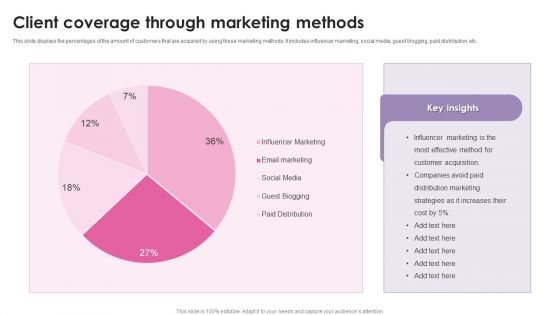
Client Coverage Through Marketing Methods Ppt Inspiration Maker PDF
This slide displays the percentages of the amount of customers that are acquired by using these marketing methods. It includes influencer marketing, social media, guest blogging, paid distribution, etc. Pitch your topic with ease and precision using this Client Coverage Through Marketing Methods Ppt Inspiration Maker PDF. This layout presents information on Influencer Marketing, Paid Distribution, Social Media. It is also available for immediate download and adjustment. So, changes can be made in the color, design, graphics or any other component to create a unique layout.
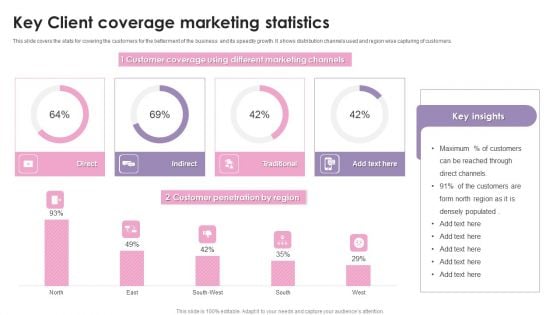
Key Client Coverage Marketing Statistics Ppt Inspiration Design Inspiration PDF
This slide covers the stats for covering the customers for the betterment of the business and its speedily growth. It shows distribution channels used and region wise capturing of customers. Pitch your topic with ease and precision using this Key Client Coverage Marketing Statistics Ppt Inspiration Design Inspiration PDF. This layout presents information on Customer Penetration, Traditional, Indirect, Direct. It is also available for immediate download and adjustment. So, changes can be made in the color, design, graphics or any other component to create a unique layout.
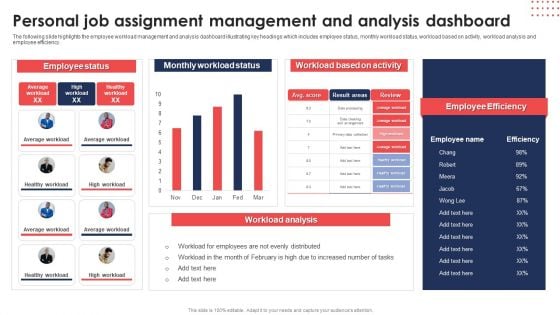
Personal Job Assignment Management And Analysis Dashboard Diagrams PDF
The following slide highlights the employee workload management and analysis dashboard illustrating key headings which includes employee status, monthly workload status, workload based on activity, workload analysis and employee efficiency. Pitch your topic with ease and precision using thisPersonal Job Assignment Management And Analysis Dashboard Diagrams PDF. This layout presents information on Employee Status, Monthly Workload Status, Workload Based Activity. It is also available for immediate download and adjustment. So, changes can be made in the color, design, graphics or any other component to create a unique layout.
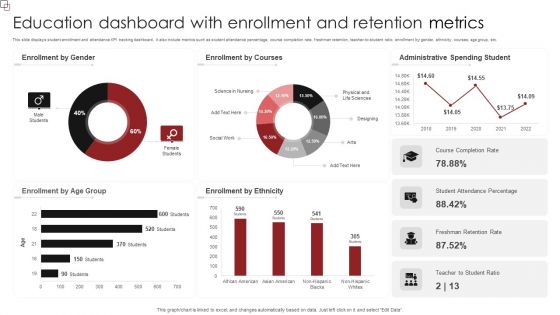
Education Dashboard With Enrollment And Retention Metrics Sample PDF
This slide displays student enrollment and attendance KPI tracking dashboard. It also include metrics such as student attendance percentage, course completion rate, freshman retention, teacher-to-student ratio, enrollment by gender, ethnicity, courses, age group, etc. Pitch your topic with ease and precision using this Education Dashboard With Enrollment And Retention Metrics Sample PDF. This layout presents information on Enrollment Gender, Enrollment Courses, Administrative Spending Student. It is also available for immediate download and adjustment. So, changes can be made in the color, design, graphics or any other component to create a unique layout.
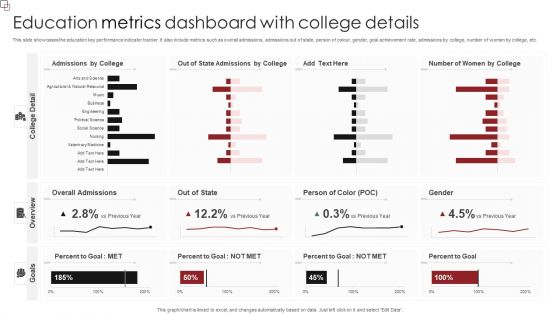
Education Metrics Dashboard With College Details Formats PDF
This slide showcases the education key performance indicator tracker. It also include metrics such as overall admissions, admissions out of state, person of colour, gender, goal achievement rate, admissions by college, number of women by college, etc. Pitch your topic with ease and precision using this Education Metrics Dashboard With College Details Formats PDF. This layout presents information on Overall Admissions, Person Of Color, Percent To Goal. It is also available for immediate download and adjustment. So, changes can be made in the color, design, graphics or any other component to create a unique layout.
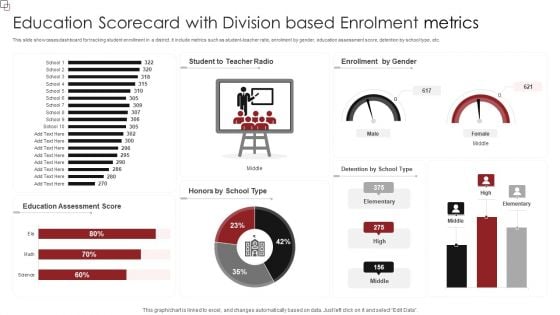
Education Scorecard With Division Based Enrolment Metrics Professional PDF
This slide showcases dashboard for tracking student enrollment in a district. It include metrics such as student-teacher ratio, enrolment by gender, education assessment score, detention by school type, etc. Pitch your topic with ease and precision using this Education Scorecard With Division Based Enrolment Metrics Professional PDF. This layout presents information on Education Assessment Score, Enrollment Gender. It is also available for immediate download and adjustment. So, changes can be made in the color, design, graphics or any other component to create a unique layout.
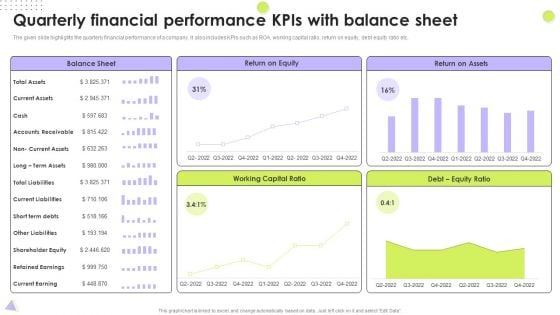
Quarterly Financial Performance Kpis With Balance Sheet Designs PDF
The given slide highlights the quarterly financial performance of a company. It also includes KPIs such as ROA, working capital ratio, return on equity, debt equity ratio etc. Pitch your topic with ease and precision using this Quarterly Financial Performance Kpis With Balance Sheet Designs PDF. This layout presents information on Total Liabilities, Return On Equity, Working Capital Ratio. It is also available for immediate download and adjustment. So, changes can be made in the color, design, graphics or any other component to create a unique layout.
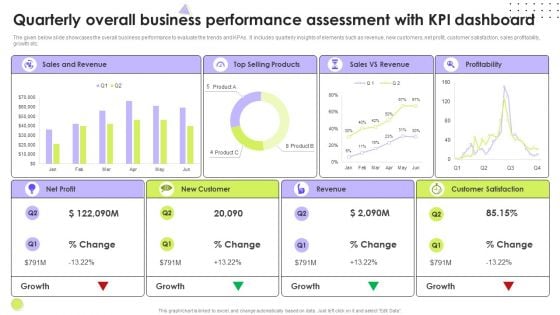
Quarterly Overall Business Performance Assessment With Kpi Dashboard Microsoft PDF
The given below slide showcases the overall business performance to evaluate the trends and KPAs. It includes quarterly insights of elements such as revenue, new customers, net profit, customer satisfaction, sales profitability, growth etc. Pitch your topic with ease and precision using this Quarterly Overall Business Performance Assessment With Kpi Dashboard Microsoft PDF. This layout presents information on Revenue, Customer Satisfaction, Net Profit. It is also available for immediate download and adjustment. So, changes can be made in the color, design, graphics or any other component to create a unique layout.
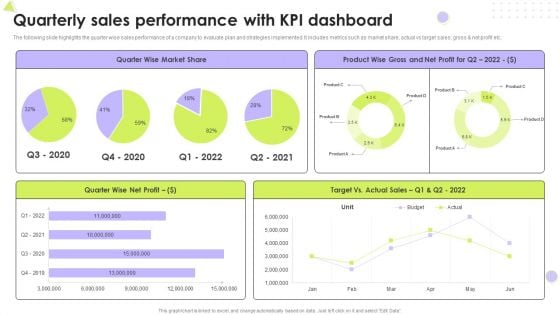
Quarterly Sales Performance With Kpi Dashboard Introduction PDF
The following slide highlights the quarter wise sales performance of a company to evaluate plan and strategies implemented. It includes metrics such as market share, actual vs target sales, gross and net profit etc. Pitch your topic with ease and precision using this Quarterly Sales Performance With Kpi Dashboard Introduction PDF. This layout presents information on Market Share, Net Profit, Target. It is also available for immediate download and adjustment. So, changes can be made in the color, design, graphics or any other component to create a unique layout.
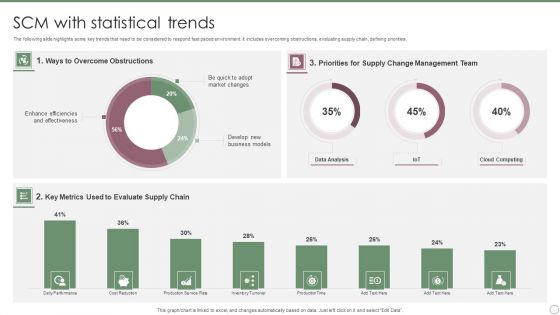
SCM With Statistical Trends Ppt PowerPoint Presentation Gallery Examples PDF
The following slide highlights some key trends that need to be considered to respond fast paced environment. It includes overcoming obstructions, evaluating supply chain, defining priorities. Pitch your topic with ease and precision using this SCM With Statistical Trends Ppt PowerPoint Presentation Gallery Examples PDF. This layout presents information on Ways To Overcome, Obstructions, Key Metrics, Evaluate Supply Chain. It is also available for immediate download and adjustment. So, changes can be made in the color, design, graphics or any other component to create a unique layout.
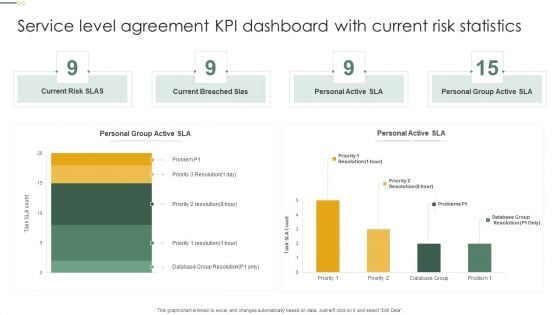
Service Level Agreement KPI Dashboard With Current Risk Statistics Topics PDF
This graph or chart is linked to excel, and changes automatically based on data. Just left click on it and select Edit Data. Pitch your topic with ease and precision using this Service Level Agreement KPI Dashboard With Current Risk Statistics Topics PDF. This layout presents information on Current Risk SLAS, Current Breached Slas, Personal Active SLA It is also available for immediate download and adjustment. So, changes can be made in the color, design, graphics or any other component to create a unique layout.

Critical Statistics Of Blockchain And Distributed Ledger Technology Market Structure PDF
Mentioned slide highlights various insights of blockchain technology market. This slide shows key statistics about blockchain market outlook, blockchain spenders worldwide and by country. Organization can decide if embracing the technology is the right move for company using these statistics. Pitch your topic with ease and precision using this Critical Statistics Of Blockchain And Distributed Ledger Technology Market Structure PDF. This layout presents information on USA Contribution, Projected Blockchain, Market Value. It is also available for immediate download and adjustment. So, changes can be made in the color, design, graphics or any other component to create a unique layout.
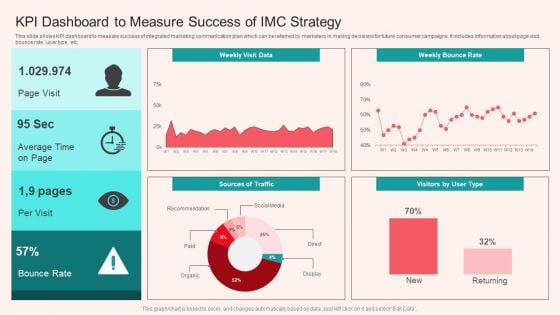
KPI Dashboard To Measure Success Of IMC Strategy Microsoft PDF
This slide shows KPI dashboard to measure success of integrated marketing communication plan which can be referred by marketers in making decisions for future consumer campaigns. It includes information about page visit, bounce rate, user type, etc. Pitch your topic with ease and precision using this KPI Dashboard To Measure Success Of IMC Strategy Microsoft PDF. This layout presents information on Average, Bounce Rate. It is also available for immediate download and adjustment. So, changes can be made in the color, design, graphics or any other component to create a unique layout.
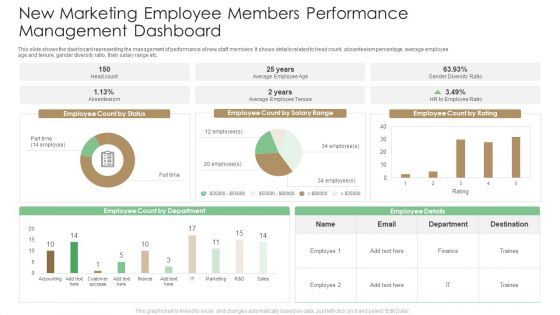
New Marketing Employee Members Performance Management Dashboard Summary PDF
This slide shows the dashboard representing the management of performance of new staff members. It shows details related to head count, absenteeism percentage, average employee age and tenure, gender diversity ratio, their salary range etc. Pitch your topic with ease and precision using this New Marketing Employee Members Performance Management Dashboard Summary PDF. This layout presents information on Employee Ratio, Average Employee Tenure. It is also available for immediate download and adjustment. So, changes can be made in the color, design, graphics or any other component to create a unique layout.
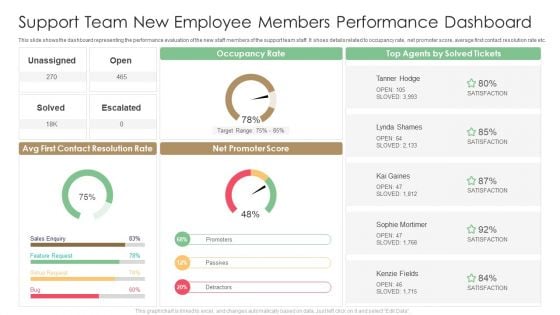
Support Team New Employee Members Performance Dashboard Designs PDF
This slide shows the dashboard representing the performance evaluation of the new staff members of the support team staff. It shoes details related to occupancy rate, net promoter score, average first contact resolution rate etc. Pitch your topic with ease and precision using this Support Team New Employee Members Performance Dashboard Designs PDF. This layout presents information on Target Range, Occupancy Rate, Contact Resolution Rate. It is also available for immediate download and adjustment. So, changes can be made in the color, design, graphics or any other component to create a unique layout.
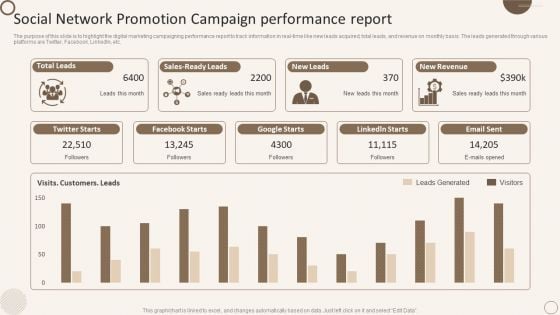
Social Network Promotion Campaign Performance Report Demonstration PDF
The purpose of this slide is to highlight the digital marketing campaigning performance report to track information in real-time like new leads acquired, total leads, and revenue on monthly basis. The leads generated through various platforms are Twitter, Facebook, LinkedIn, etc. Pitch your topic with ease and precision using this Social Network Promotion Campaign Performance Report Demonstration PDF. This layout presents information on Sales Ready Leads, New Leads, New Revenue. It is also available for immediate download and adjustment. So, changes can be made in the color, design, graphics or any other component to create a unique layout.
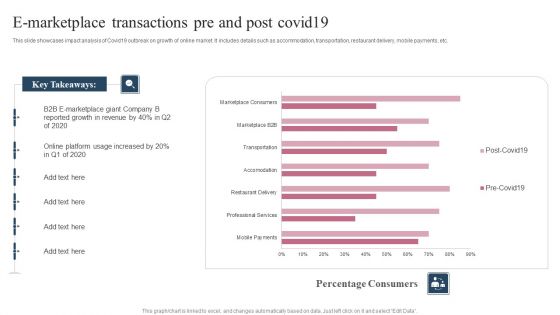
E Marketplace Transactions Pre And Post Covid19 Ppt Pictures Files PDF
This slide showcases impact analysis of Covid19 outbreak on growth of online market. It includes details such as accommodation, transportation, restaurant delivery, mobile payments, etc. Pitch your topic with ease and precision using this E Marketplace Transactions Pre And Post Covid19 Ppt Pictures Files PDF. This layout presents information on Key Takeaways, B2B E Marketplace, Online Platform. It is also available for immediate download and adjustment. So, changes can be made in the color, design, graphics or any other component to create a unique layout.
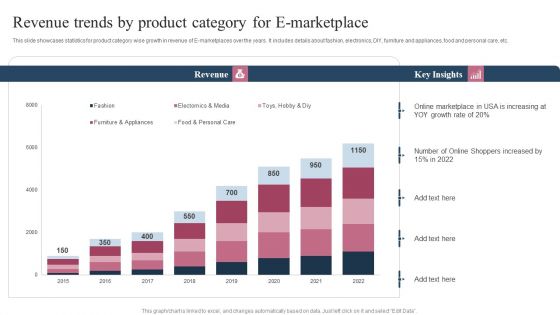
Revenue Trends By Product Category For E Marketplace Ppt Pictures Slide Portrait PDF
This slide showcases statistics for product category wise growth in revenue of E-marketplaces over the years. It includes details about fashion, electronics, DIY, furniture and appliances, food and personal care, etc. Pitch your topic with ease and precision using this Revenue Trends By Product Category For E Marketplace Ppt Pictures Slide Portrait PDF. This layout presents information on Revenue, Online Marketplace, Number Online, Shoppers Increased, 2015 To 2022. It is also available for immediate download and adjustment. So, changes can be made in the color, design, graphics or any other component to create a unique layout.
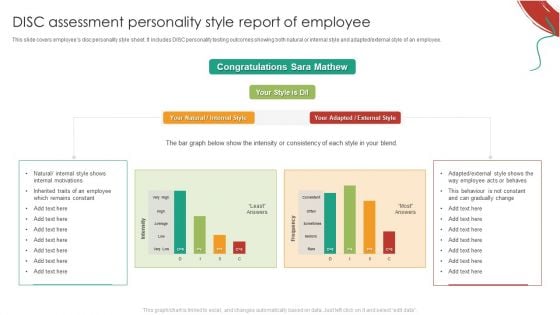
DISC Assessment Personality Style Report Of Employee Sample PDF
This slide covers employees disc personality style sheet. It includes DISC personality testing outcomes showing both natural or internal style and adapted or external style of an employee. Pitch your topic with ease and precision using this DISC Assessment Personality Style Report Of Employee Sample PDF. This layout presents information on Congratulations Sara Mathew, Internal Motivations, Remains Constant. It is also available for immediate download and adjustment. So, changes can be made in the color, design, graphics or any other component to create a unique layout.
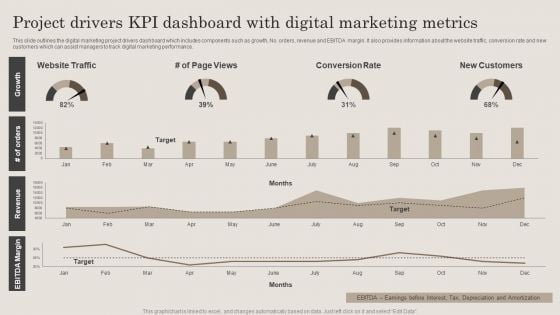
Project Drivers Kpi Dashboard With Digital Marketing Metrics Ppt PowerPoint Presentation File Clipart PDF
This slide outlines the digital marketing project drivers dashboard which includes components such as growth, No. orders, revenue and EBITDA margin. It also provides information about the website traffic, conversion rate and new customers which can assist managers to track digital marketing performance. Showcasing this set of slides titled Project Drivers Kpi Dashboard With Digital Marketing Metrics Ppt PowerPoint Presentation File Clipart PDF. The topics addressed in these templates are Website Traffic, Conversion Rate, New Customers. All the content presented in this PPT design is completely editable. Download it and make adjustments in color, background, font etc. as per your unique business setting.
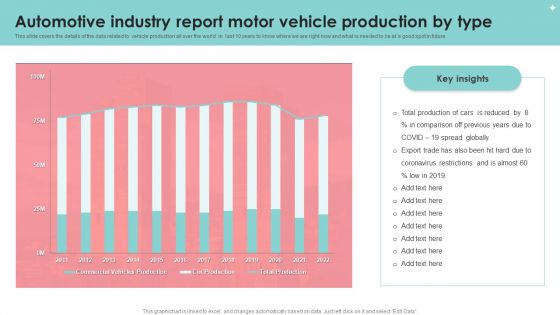
Automotive Industry Report Motor Vehicle Production By Type Portrait PDF
This slide covers the details of the data related to vehicle production all over the world in last 10 years to know where we are right now and what is needed to be at a good spot in future. Pitch your topic with ease and precision using this Automotive Industry Report Motor Vehicle Production By Type Portrait PDF. This layout presents information on Automotive Industry Report, Motor Vehicle Production. It is also available for immediate download and adjustment. So, changes can be made in the color, design, graphics or any other component to create a unique layout.
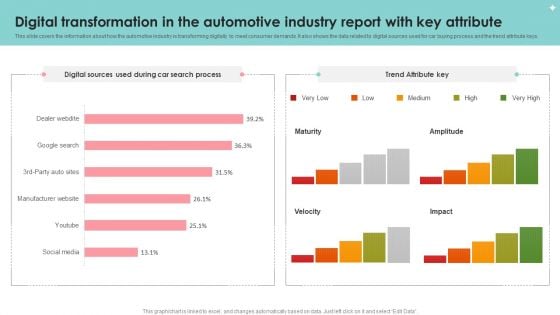
Digital Transformation In The Automotive Industry Report With Key Attribute Slides PDF
This slide covers the information about how the automotive industry is transforming digitally to meet consumer demands. It also shows the data related to digital sources used for car buying process and the trend attribute keys. Pitch your topic with ease and precision using this Digital Transformation In The Automotive Industry Report With Key Attribute Slides PDF. This layout presents information on Digital Transformation, Automotive Industry Report, Key Attribute. It is also available for immediate download and adjustment. So, changes can be made in the color, design, graphics or any other component to create a unique layout.
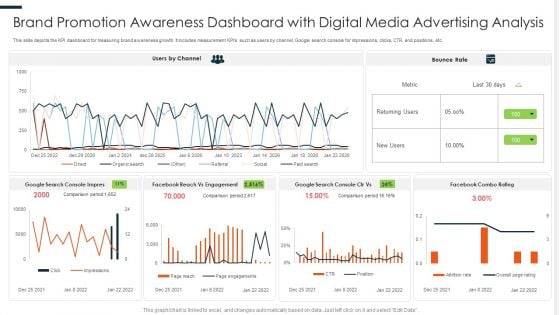
Brand Promotion Awareness Dashboard With Digital Media Advertising Analysis Ppt PowerPoint Presentation Design Ideas PDF
This slide depicts the KPI dashboard for measuring brand awareness growth. It includes measurement KPIs such as users by channel, Google search console for impressions, clicks, CTR, and positions, etc. Pitch your topic with ease and precision using this Brand Promotion Awareness Dashboard With Digital Media Advertising Analysis Ppt PowerPoint Presentation Design Ideas PDF. This layout presents information on Console Impress, Reach Engagement, Combo Rating. It is also available for immediate download and adjustment. So, changes can be made in the color, design, graphics or any other component to create a unique layout.
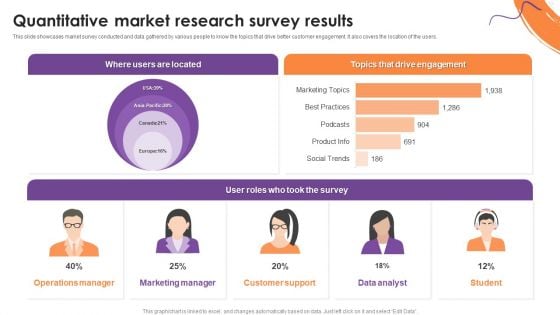
Quantitative Market Research Survey Results Structure PDF
This slide showcases market survey conducted and data gathered by various people to know the topics that drive better customer engagement. It also covers the location of the users. Pitch your topic with ease and precision using this Quantitative Market Research Survey Results Structure PDF. This layout presents information on Marketing Manager, Customer Support, Data Analyst. It is also available for immediate download and adjustment. So, changes can be made in the color, design, graphics or any other component to create a unique layout.
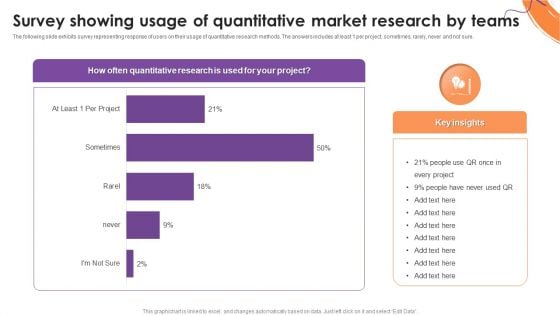
Survey Showing Usage Of Quantitative Market Research By Teams Formats PDF
The following slide exhibits survey representing response of users on their usage of quantitative research methods. The answers includes at least 1 per project, sometimes, rarely, never and not sure. Pitch your topic with ease and precision using this Survey Showing Usage Of Quantitative Market Research By Teams Formats PDF. This layout presents information on Quantitative Market Research, Survey, Teams. It is also available for immediate download and adjustment. So, changes can be made in the color, design, graphics or any other component to create a unique layout.
Project Metrics Dashboard Depicting Tracking System Inspiration PDF
This slide focuses on project management dashboard which covers the four spirit teams, iteration defects by priority with quarterly roadmap with legends such as high attention, low, none, normal and resolved immediately with time in iteration, etc. Pitch your topic with ease and precision using this Project Metrics Dashboard Depicting Tracking System Inspiration PDF. This layout presents information on Project Metrics, Dashboard Depicting, Tracking System. It is also available for immediate download and adjustment. So, changes can be made in the color, design, graphics or any other component to create a unique layout.
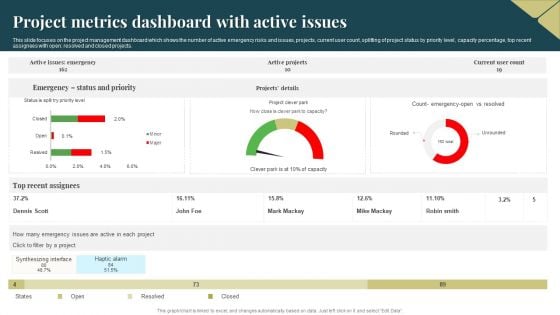
Project Metrics Dashboard With Active Issues Topics PDF
This slide focuses on the project management dashboard which shows the number of active emergency risks and issues, projects, current user count, splitting of project status by priority level, capacity percentage, top recent assignees with open, resolved and closed projects. Pitch your topic with ease and precision using this Project Metrics Dashboard With Active Issues Topics PDF. This layout presents information on Project Metrics, Dashboard With Active Issues. It is also available for immediate download and adjustment. So, changes can be made in the color, design, graphics or any other component to create a unique layout.
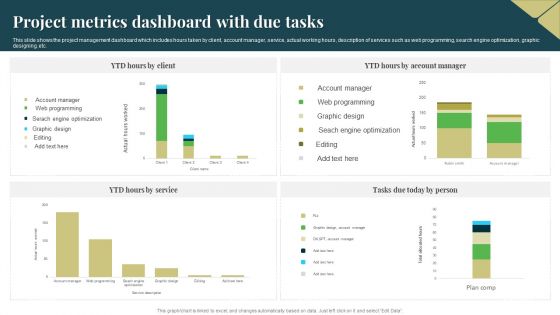
Project Metrics Dashboard With Due Tasks Microsoft PDF
This slide shows the project management dashboard which includes hours taken by client, account manager, service, actual working hours, description of services such as web programming, search engine optimization, graphic designing, etc. Pitch your topic with ease and precision using this Project Metrics Dashboard With Due Tasks Microsoft PDF. This layout presents information on Service, Optimization, Graphic Design. It is also available for immediate download and adjustment. So, changes can be made in the color, design, graphics or any other component to create a unique layout.
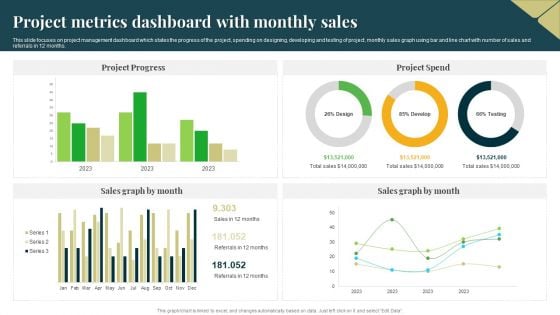
Project Metrics Dashboard With Monthly Sales Professional PDF
This slide focuses on project management dashboard which states the progress of the project, spending on designing, developing and testing of project, monthly sales graph using bar and line chart with number of sales and referrals in 12 months. Pitch your topic with ease and precision using this Project Metrics Dashboard With Monthly Sales Professional PDF. This layout presents information on Project Progress, Project Spend, Sales Graph. It is also available for immediate download and adjustment. So, changes can be made in the color, design, graphics or any other component to create a unique layout.
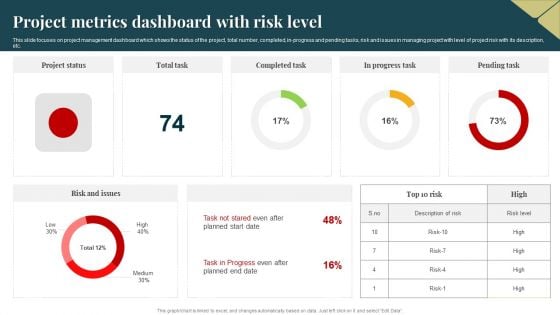
Project Metrics Dashboard With Risk Level Guidelines PDF
This slide focuses on project management dashboard which shows the status of the project, total number, completed, in progress and pending tasks, risk and issues in managing project with level of project risk with its description, etc. Pitch your topic with ease and precision using this Project Metrics Dashboard With Risk Level Guidelines PDF. This layout presents information on Project Metrics Dashboard, Risk Level. It is also available for immediate download and adjustment. So, changes can be made in the color, design, graphics or any other component to create a unique layout.

Project Metrics Dashboard With Task Status Rules PDF
This slide shows the project management dashboard which shows the number of team members of managing project activities, estimated and actual time to complete the project task, hours taken by employees with achieved and open milestones and progress status. Pitch your topic with ease and precision using this Project Metrics Dashboard With Task Status Rules PDF. This layout presents information on Team Members, Employee. It is also available for immediate download and adjustment. So, changes can be made in the color, design, graphics or any other component to create a unique layout.
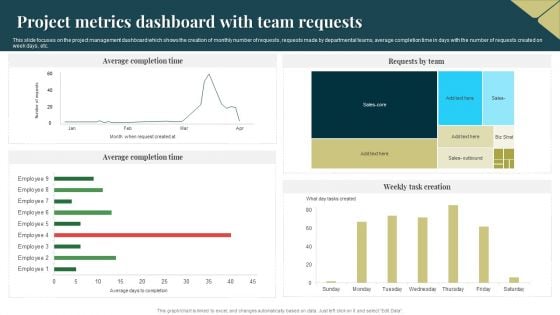
Project Metrics Dashboard With Team Requests Background PDF
This slide focuses on the project management dashboard which shows the creation of monthly number of requests, requests made by departmental teams, average completion time in days with the number of requests created on week days, etc. Pitch your topic with ease and precision using this Project Metrics Dashboard With Team Requests Background PDF. This layout presents information on Project Metrics Dashboard, Team Requests. It is also available for immediate download and adjustment. So, changes can be made in the color, design, graphics or any other component to create a unique layout.
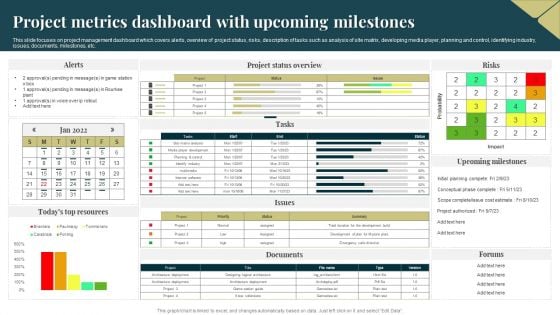
Project Metrics Dashboard With Upcoming Milestones Demonstration PDF
This slide focuses on project management dashboard which covers alerts, overview of project status, risks, description of tasks such as analysis of site matrix, developing media player, planning and control, identifying industry, issues, documents, milestones, etc. Pitch your topic with ease and precision using this Project Metrics Dashboard With Upcoming Milestones Demonstration PDF. This layout presents information on Probability, Project, Risks. It is also available for immediate download and adjustment. So, changes can be made in the color, design, graphics or any other component to create a unique layout.
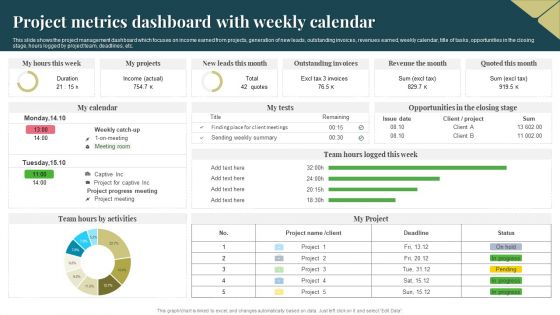
Project Metrics Dashboard With Weekly Calendar Download PDF
This slide shows the project management dashboard which focuses on income earned from projects, generation of new leads, outstanding invoices, revenues earned, weekly calendar, title of tasks, opportunities in the closing stage, hours logged by project team, deadlines, etc. Pitch your topic with ease and precision using this Project Metrics Dashboard With Weekly Calendar Download PDF. This layout presents information on Income, Revenue, Project. It is also available for immediate download and adjustment. So, changes can be made in the color, design, graphics or any other component to create a unique layout.
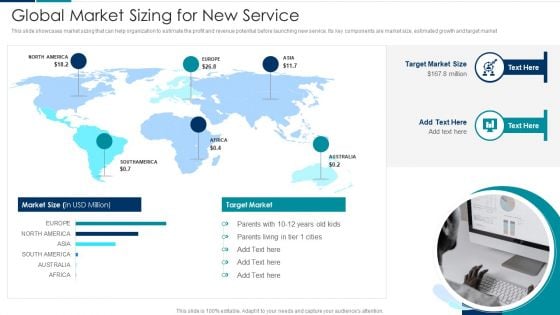
Managing New Service Roll Out And Marketing Procedure Global Market Sizing For New Service Inspiration PDF
This slide showcases market sizing that can help organization to estimate the profit and revenue potential before launching new service. Its key components are market size, estimated growth and target market. Deliver an awe inspiring pitch with this creative Managing New Service Roll Out And Marketing Procedure Global Market Sizing For New Service Inspiration PDF bundle. Topics like Market Size, Target Market, Global can be discussed with this completely editable template. It is available for immediate download depending on the needs and requirements of the user.
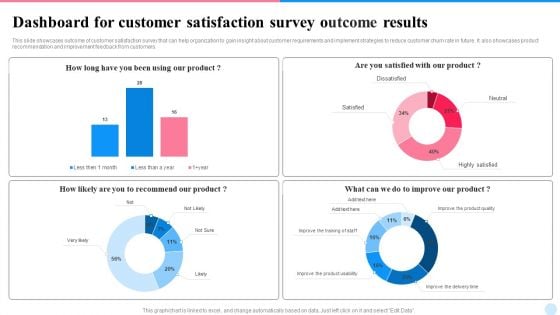
Dashboard For Customer Satisfaction Survey Outcome Results Topics PDF
This slide showcases outcome of customer satisfaction survey that can help organization to gain insight about customer requirements and implement strategies to reduce customer churn rate in future. It also showcases product recommendation and improvement feedback from customers. Pitch your topic with ease and precision using this Dashboard For Customer Satisfaction Survey Outcome Results Topics PDF. This layout presents information on Dashboard, Customer Satisfaction, Survey Outcome Results. It is also available for immediate download and adjustment. So, changes can be made in the color, design, graphics or any other component to create a unique layout.
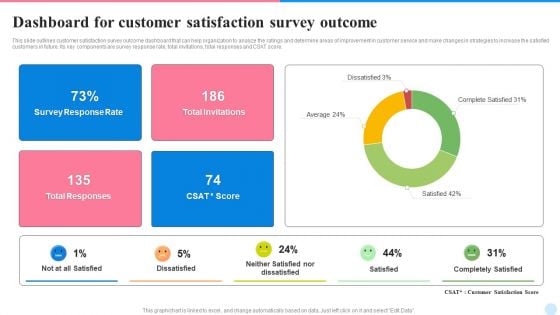
Dashboard For Customer Satisfaction Survey Outcome Demonstration PDF
This slide outlines customer satisfaction survey outcome dashboard that can help organization to analyze the ratings and determine areas of improvement in customer service and make changes in strategies to increase the satisfied customers in future. Its key components are survey response rate, total invitations, total responses and CSAT score. Showcasing this set of slides titled Dashboard For Customer Satisfaction Survey Outcome Demonstration PDF. The topics addressed in these templates are Total Invitations, Survey Response Rate, Total Responses. All the content presented in this PPT design is completely editable. Download it and make adjustments in color, background, font etc. as per your unique business setting.

Customer Grievance Call Handling Dashboard With Abandon Rate Introduction PDF
This slide showcases dashboard that can help organization to identify the resolution time and average abandon rate of customer grievance calls. Its key components are average answer speed, avg calls or minute and overall satisfaction score. Showcasing this set of slides titled Customer Grievance Call Handling Dashboard With Abandon Rate Introduction PDF. The topics addressed in these templates are Customer Grievance Call Handling, Dashboard With Abandon Rate. All the content presented in this PPT design is completely editable. Download it and make adjustments in color, background, font etc. as per your unique business setting.
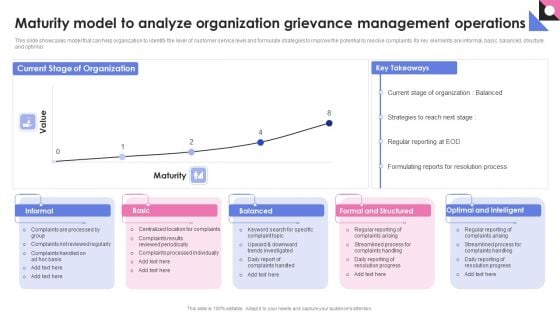
Maturity Model To Analyze Organization Grievance Management Operations Elements PDF
This slide showcases model that can help organization to identify the level of customer service level and formulate strategies to improve the potential to resolve complaints. Its key elements are informal, basic, balanced, structure and optimal. Pitch your topic with ease and precision using this Maturity Model To Analyze Organization Grievance Management Operations Elements PDF. This layout presents information on Informal, Balanced, Formal And Structured, Optimal And Intelligent. It is also available for immediate download and adjustment. So, changes can be made in the color, design, graphics or any other component to create a unique layout.
Weekly Customer Grievance Tracking Dashboard Designs PDF
This slide showcases dashboard that can help organization to identify the open and overdue status of customer grievance . It can guide managers to resolve the complaints and issues within stipulated time for customer satisfaction. Pitch your topic with ease and precision using this Weekly Customer Grievance Tracking Dashboard Designs PDF. This layout presents information on Average, Traffic Analysis, Customer Satisfaction Ratings. It is also available for immediate download and adjustment. So, changes can be made in the color, design, graphics or any other component to create a unique layout.
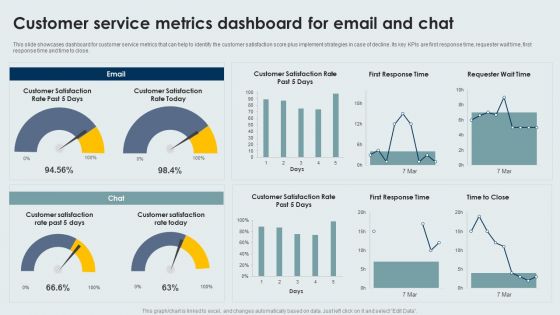
Customer Service Metrics Dashboard For Email And Chat Infographics PDF
This slide showcases dashboard for customer service metrics that can help to identify the customer satisfaction score plus implement strategies in case of decline. Its key KPIs are first response time, requester wait time, first response time and time to close. Pitch your topic with ease and precision using this Customer Service Metrics Dashboard For Email And Chat Infographics PDF. This layout presents information on Customer Service, Metrics Dashboard, Email And Chat. It is also available for immediate download and adjustment. So, changes can be made in the color, design, graphics or any other component to create a unique layout.
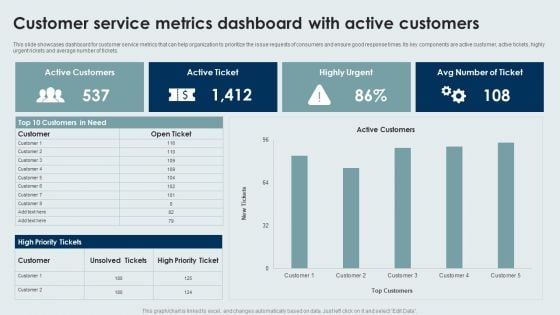
Customer Service Metrics Dashboard With Active Customers Ideas PDF
This slide showcases dashboard for customer service metrics that can help organization to prioritize the issue requests of consumers and ensure good response times. Its key components are active customer, active tickets, highly urgent rickets and average number of tickets. Showcasing this set of slides titled Customer Service Metrics Dashboard With Active Customers Ideas PDF. The topics addressed in these templates are Customer Service, Metrics Dashboard, Active Customers. All the content presented in this PPT design is completely editable. Download it and make adjustments in color, background, font etc. as per your unique business setting.
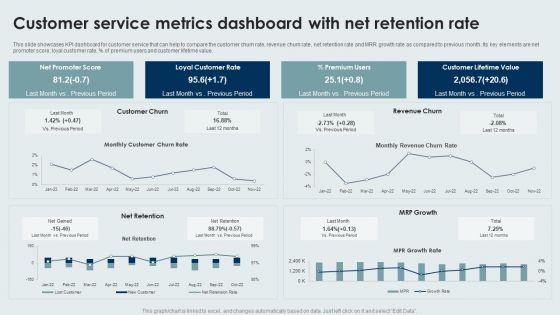
Customer Service Metrics Dashboard With Net Retention Rate Sample PDF
This slide showcases KPI dashboard for customer service that can help to compare the customer churn rate, revenue churn rate, net retention rate and MRR growth rate as compared to previous month. Its key elements are net promoter score, loyal customer rate, percentage of premium users and customer lifetime value. Pitch your topic with ease and precision using this Customer Service Metrics Dashboard With Net Retention Rate Sample PDF. This layout presents information on Loyal Customer Rate, Premium Users, Customer Lifetime Value. It is also available for immediate download and adjustment. So, changes can be made in the color, design, graphics or any other component to create a unique layout.
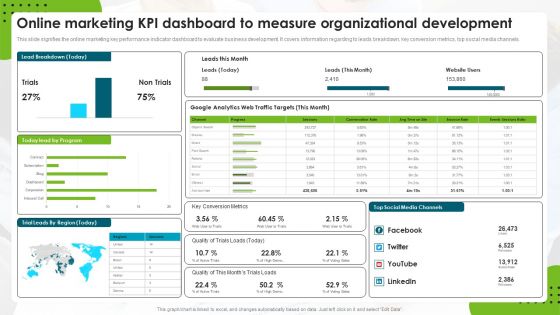
Online Marketing Kpi Dashboard To Measure Organizational Development Rules PDF
This slide signifies the online marketing key performance indicator dashboard to evaluate business development. It covers information regarding to leads breakdown, key conversion metrics, top social media channels. Pitch your topic with ease and precision using this Online Marketing Kpi Dashboard To Measure Organizational Development Rules PDF. This layout presents information on Web Traffic Targets, Google Analytics, Social Media Channels. It is also available for immediate download and adjustment. So, changes can be made in the color, design, graphics or any other component to create a unique layout.
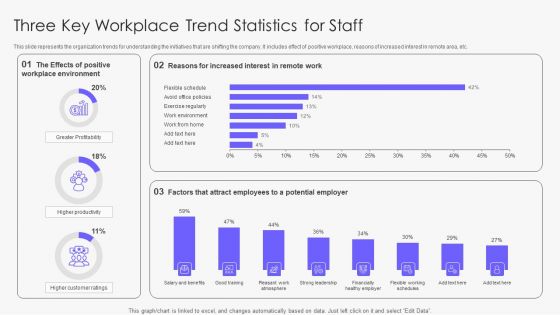
Three Key Workplace Trend Statistics For Staff Slides PDF
This slide represents the organization trends for understanding the initiatives that are shifting the company. It includes effect of positive workplace, reasons of increased interest in remote area, etc. Pitch your topic with ease and precision using this Three Key Workplace Trend Statistics For Staff Slides PDF. This layout presents information on Workplace Environment, Greater Profitability, Customer. It is also available for immediate download and adjustment. So, changes can be made in the color, design, graphics or any other component to create a unique layout.

Impact Of Insider Threat In Cyber Security On Business Operations Microsoft PDF
This slide shows impact of insider threat on business operations. It contains information about operational disruption, damaging brand image, loss of sensitive information, market value, etc. Pitch your topic with ease and precision using this Impact Of Insider Threat In Cyber Security On Business Operations Microsoft PDF. This layout presents information on Operational Disruption Or Outage, Brand Damage, Loss Critical Data. It is also available for immediate download and adjustment. So, changes can be made in the color, design, graphics or any other component to create a unique layout.
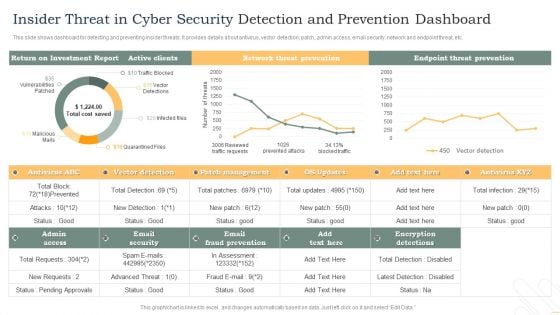
Insider Threat In Cyber Security Detection And Prevention Dashboard Diagrams PDF
This slide shows dashboard for detecting and preventing insider threats. It provides details about antivirus, vector detection, patch, admin access, email security, network and endpoint threat, etc. Pitch your topic with ease and precision using this Insider Threat In Cyber Security Detection And Prevention Dashboard Diagrams PDF. This layout presents information on Active Clients, Network Threat Prevention, Endpoint Threat Prevention. It is also available for immediate download and adjustment. So, changes can be made in the color, design, graphics or any other component to create a unique layout.
Insider Threat In Cyber Security Tracking Dashboard With User Details Portrait PDF
This slide shows user details tracked by insider threat dashboard. It provides information such as exposure events, file activity, archive, document, image, pdf, ppt, scripts, etc. Pitch your topic with ease and precision using this Insider Threat In Cyber Security Tracking Dashboard With User Details Portrait PDF. This layout presents information on Private Data, Exposure Events, User Activity, File Activity, Over Time. It is also available for immediate download and adjustment. So, changes can be made in the color, design, graphics or any other component to create a unique layout.
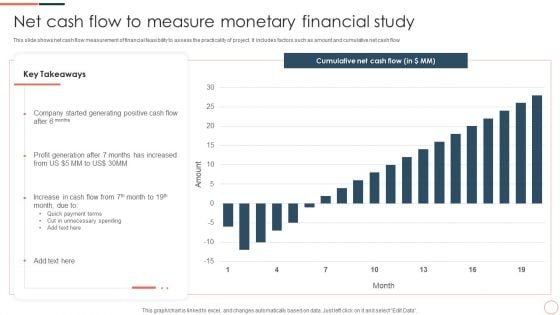
Net Cash Flow To Measure Monetary Financial Study Ppt Layouts Clipart Images PDF
This slide shows net cash flow measurement of financial feasibility to assess the practicality of project. It includes factors such as amount and cumulative net cash flow. Pitch your topic with ease and precision using this Net Cash Flow To Measure Monetary Financial Study Ppt Layouts Clipart Images PDF. This layout presents information on Cash Flow, Profit Generation, Quick Payment Terms. It is also available for immediate download and adjustment. So, changes can be made in the color, design, graphics or any other component to create a unique layout.
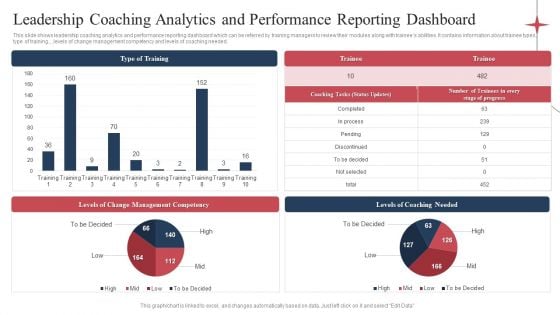
Leadership Coaching Analytics And Performance Reporting Dashboard Demonstration PDF
This slide shows leadership coaching analytics and performance reporting dashboard which can be referred by training managers to review their modules along with trainees abilities. It contains information about trainee types, type of training., ,levels of change management competency and levels of coaching needed. Pitch your topic with ease and precision using this Leadership Coaching Analytics And Performance Reporting Dashboard Demonstration PDF. This layout presents information on Levels Coaching Needed, Levels Change Management, Type Training. It is also available for immediate download and adjustment. So, changes can be made in the color, design, graphics or any other component to create a unique layout.
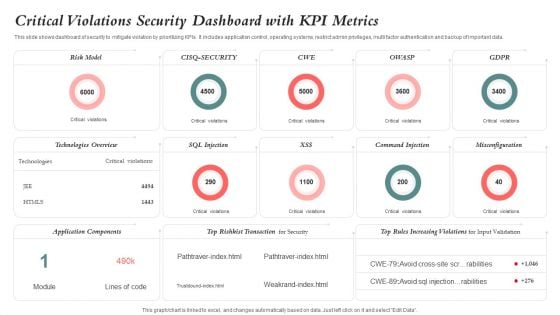
Critical Violations Security Dashboard With KPI Metrics Graphics PDF
This slide shows dashboard of security to mitigate violation by prioritizing KPIs. It includes application control, operating systems, restrict admin privileges, multi factor authentication and backup of important data. Showcasing this set of slides titled Critical Violations Security Dashboard With KPI Metrics Graphics PDF. The topics addressed in these templates are Risk Model, Application Components, Technologies Overview. All the content presented in this PPT design is completely editable. Download it and make adjustments in color, background, font etc. as per your unique business setting.
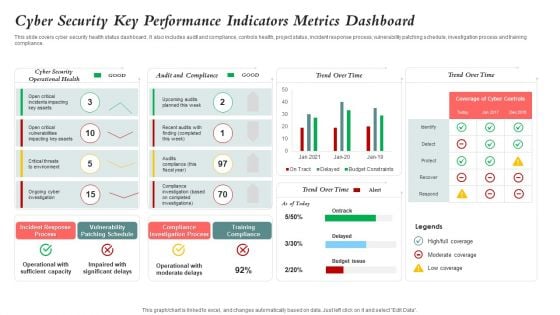
Cyber Security Key Performance Indicators Metrics Dashboard Mockup PDF
This slide covers cyber security health status dashboard . It also includes audit and compliance, controls health, project status, incident response process, vulnerability patching schedule, investigation process and training compliance. Pitch your topic with ease and precision using this Cyber Security Key Performance Indicators Metrics Dashboard Mockup PDF. This layout presents information on Cyber Security, Vulnerability Patching Schedule, Compliance Investigation Process. It is also available for immediate download and adjustment. So, changes can be made in the color, design, graphics or any other component to create a unique layout.
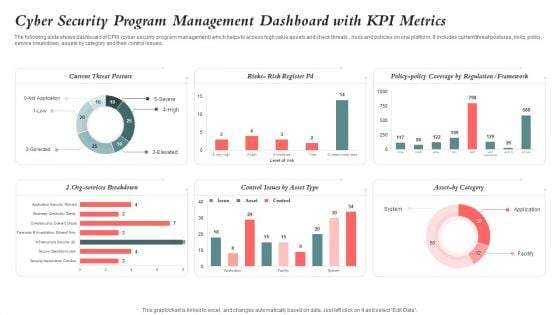
Cyber Security Program Management Dashboard With KPI Metrics Ideas PDF
The following slide shows dashboard of CPM cyber security program management which helps to access high value assets and check threats , risks and policies on one platform. It includes current threat postures, risks, policy, service breakdown, assets by category and their control issues. Pitch your topic with ease and precision using this Cyber Security Program Management Dashboard With KPI Metrics Ideas PDF. This layout presents information on Cyber Security, Program Management Dashboard, Kpi Metrics. It is also available for immediate download and adjustment. So, changes can be made in the color, design, graphics or any other component to create a unique layout.
Cyber Security Team Analytics Dashboard With KPI Metrics Icons PDF
The following slide shows cyber analytics dashboard to monitor and inspect threats and accordingly plan preventive actions. It includes open and resolved incidents and tickets. Pitch your topic with ease and precision using this Cyber Security Team Analytics Dashboard With KPI Metrics Icons PDF. This layout presents information on Energy Security Team, Digital Security Center, Security Operations Center. It is also available for immediate download and adjustment. So, changes can be made in the color, design, graphics or any other component to create a unique layout.
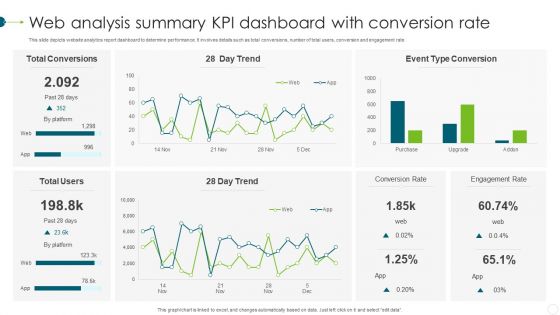
Web Analysis Summary KPI Dashboard With Conversion Rate Themes PDF
This slide depicts website analytics report dashboard to determine performance. It involves details such as total conversions, number of total users, conversion and engagement rate. Pitch your topic with ease and precision using this Web Analysis Summary KPI Dashboard With Conversion Rate Themes PDF. This layout presents information on Web Analysis Summary, KPI Dashboard, Conversion Rate. It is also available for immediate download and adjustment. So, changes can be made in the color, design, graphics or any other component to create a unique layout.
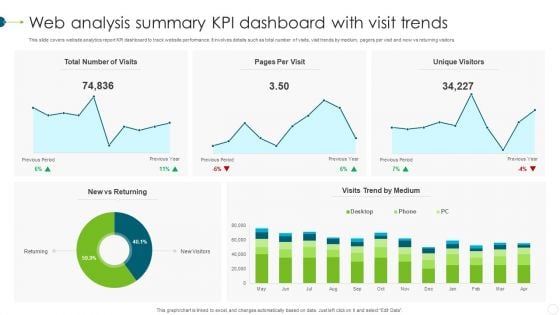
Web Analysis Summary KPI Dashboard With Visit Trends Professional PDF
This slide covers website analytics report KPI dashboard to track website performance. It involves details such as total number of visits, visit trends by medium, pagers per visit and new vs returning visitors. Pitch your topic with ease and precision using this Web Analysis Summary KPI Dashboard With Visit Trends Professional PDF. This layout presents information on Web Analysis Summary, KPI Dashboard, Visit Trends. It is also available for immediate download and adjustment. So, changes can be made in the color, design, graphics or any other component to create a unique layout.

Consulting Project Status Report Dashboard With Workspaces Diagrams PDF
The following slide showcases dashboard to provide an insight of active projects, their status and areas that require attention and improvement. Status included are on track, at risk and late Pitch your topic with ease and precision using this Consulting Project Status Report Dashboard With Workspaces Diagrams PDF. This layout presents information on Consulting Project Status Report, Dashboard With Workspaces. It is also available for immediate download and adjustment. So, changes can be made in the color, design, graphics or any other component to create a unique layout.
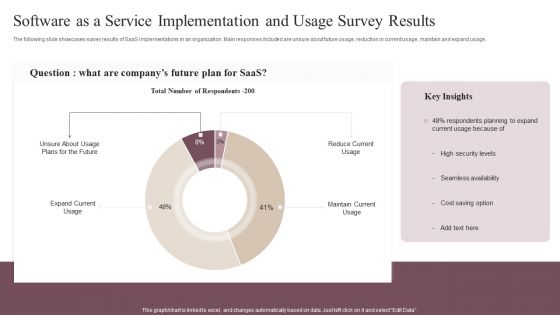
Software As A Service Implementation And Usage Survey Results Clipart PDF
The following slide showcases survey results of SaaS implementations in an organization. Main responses included are unsure about future usage, reduction in current usage, maintain and expand usage. Pitch your topic with ease and precision using this Software As A Service Implementation And Usage Survey Results Clipart PDF. This layout presents information on Reduce Current Usage, Maintain Current Usage, Expand Current Usage . It is also available for immediate download and adjustment. So, changes can be made in the color, design, graphics or any other component to create a unique layout.
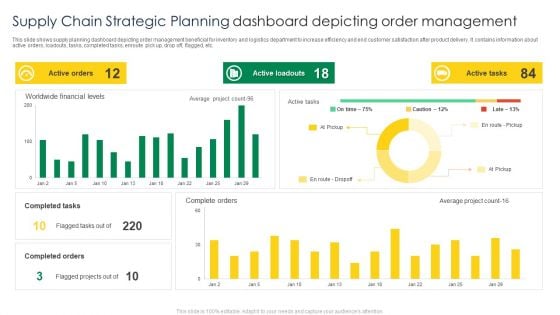
Supply Chain Strategic Planning Dashboard Depicting Order Management Mockup PDF
This slide shows supply planning dashboard depicting order management beneficial for inventory and logistics department to increase efficiency and end customer satisfaction after product delivery. It contains information about active orders, loadouts, tasks, completed tasks, enroute pick up, drop off, flagged, etc. Pitch your topic with ease and precision using this Supply Chain Strategic Planning Dashboard Depicting Order Management Mockup PDF. This layout presents information on Active Orders, Active Loadouts, Active Tasks. It is also available for immediate download and adjustment. So, changes can be made in the color, design, graphics or any other component to create a unique layout.


 Continue with Email

 Home
Home


