Cost Comparison
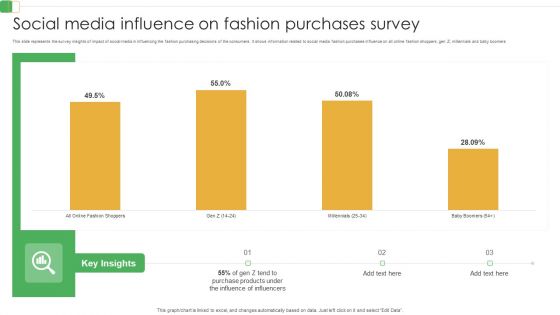
Social Media Influence On Fashion Purchases Survey Ppt PowerPoint Presentation File Portfolio PDF
This slide represents the survey insights of impact of social media in influencing the fashion purchasing decisions of the consumers. It shows information related to social media fashion purchases influence on all online fashion shoppers, gen Z, millennials and baby boomersPitch your topic with ease and precision using this Social Media Influence On Fashion Purchases Survey Ppt PowerPoint Presentation File Portfolio PDF. This layout presents information on Social Media, Influence Fashion, Purchases Survey. It is also available for immediate download and adjustment. So, changes can be made in the color, design, graphics or any other component to create a unique layout.
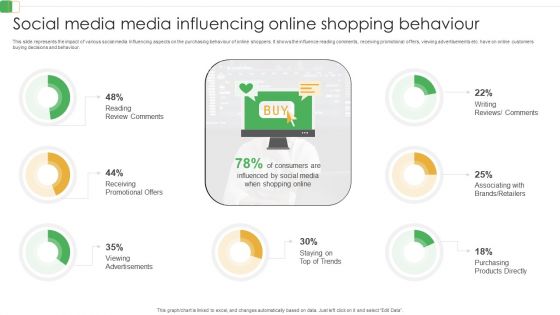
Social Media Media Influencing Online Shopping Behaviour Ppt PowerPoint Presentation File Outline PDF
This slide represents the impact of various social media Influencing aspects on the purchasing behaviour of online shoppers. It shows the influence reading comments, receiving promotional offers, viewing advertisements etc. have on online customers buying decisions and behaviour.Pitch your topic with ease and precision using this Social Media Media Influencing Online Shopping Behaviour Ppt PowerPoint Presentation File Outline PDF. This layout presents information on Review Comments, Promotional Offers, Viewing Advertisemen. It is also available for immediate download and adjustment. So, changes can be made in the color, design, graphics or any other component to create a unique layout.
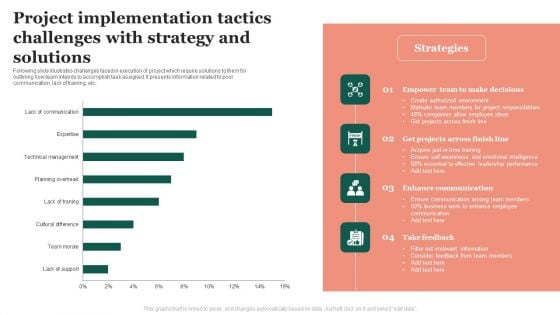
Project Implementation Tactics Challenges With Strategy And Solutions Microsoft PDF
Following slide illustrates challenges faced in execution of project which require solutions to them for outlining how team intends to accomplish task assigned. It presents information related to poor communication, lack of training, etc. Pitch your topic with ease and precision using this Project Implementation Tactics Challenges With Strategy And Solutions Microsoft PDF. This layout presents information on Enhance Communication, Empower Team, Leadership Performance. It is also available for immediate download and adjustment. So, changes can be made in the color, design, graphics or any other component to create a unique layout.
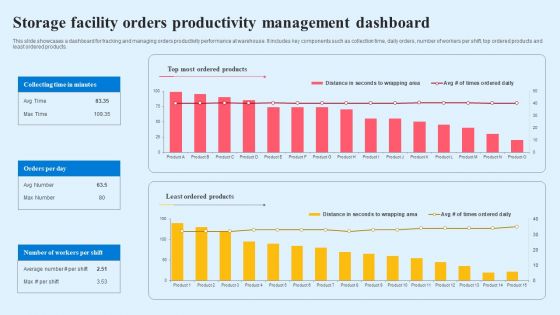
Storage Facility Orders Productivity Management Dashboard Diagrams PDF
This slide showcases a dashboard for tracking and managing orders productivity performance at warehouse. It includes key components such as collection time, daily orders, number of workers per shift, top ordered products and least ordered products. Showcasing this set of slides titled Storage Facility Orders Productivity Management Dashboard Diagrams PDF. The topics addressed in these templates are Top Most Ordered Products, Least Ordered Products, Orders Per Day. All the content presented in this PPT design is completely editable. Download it and make adjustments in color, background, font etc. as per your unique business setting.
Storage Facility Productivity Tracking And Management System Dashboard Diagrams PDF
This slide showcases a dashboard for managing and tracking warehouse productivity to optimize operational process. It includes key components such as user registered, subscribers request, orders, sales, transaction summary and top profiles. Showcasing this set of slides titled Storage Facility Productivity Tracking And Management System Dashboard Diagrams PDF. The topics addressed in these templates are Transaction Summary, Registered Users, Tracking Management. All the content presented in this PPT design is completely editable. Download it and make adjustments in color, background, font etc. as per your unique business setting.
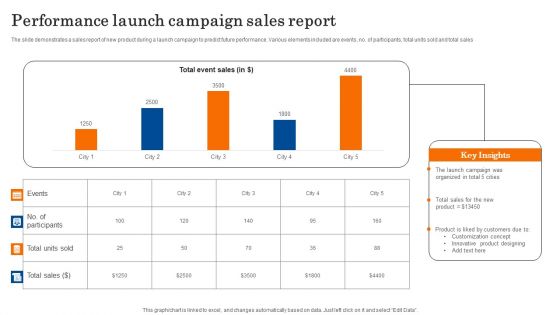
Performance Launch Campaign Sales Report Demonstration PDF
The slide demonstrates a sales report of new product during a launch campaign to predict future performance. Various elements included are events, no. of participants, total units sold and total sales. Pitch your topic with ease and precision using this Performance Launch Campaign Sales Report Demonstration PDF. This layout presents information on Sales, Product, Customization Concept. It is also available for immediate download and adjustment. So, changes can be made in the color, design, graphics or any other component to create a unique layout.
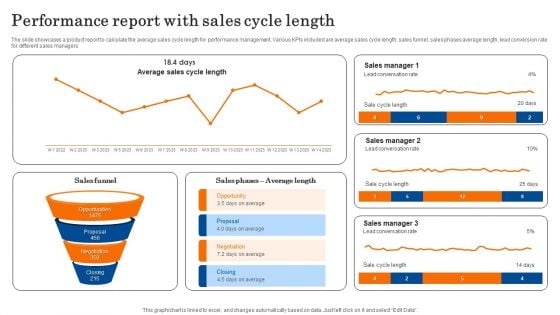
Performance Report With Sales Cycle Length Template PDF
The slide showcases a product report to calculate the average sales cycle length for performance management. Various KPIs included are average sales cycle length, sales funnel, sales phases average length, lead conversion rate for different sales managers. sPitch your topic with ease and precision using this Performance Report With Sales Cycle Length Template PDF. This layout presents information on Sales Manager, Conversation Rate, Opportunity. It is also available for immediate download and adjustment. So, changes can be made in the color, design, graphics or any other component to create a unique layout.
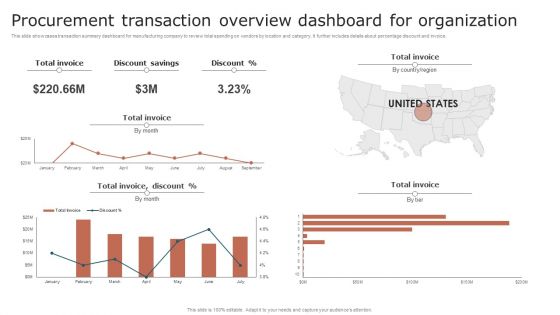
Procurement Transaction Overview Dashboard For Organization Background PDF
This slide showcases transaction summary dashboard for manufacturing company to review total spending on vendors by location and category. It further includes details about percentage discount and invoice. Pitch your topic with ease and precision using this Procurement Transaction Overview Dashboard For Organization Background PDF. This layout presents information on Procurement Transaction, Overview Dashboard For Organization. It is also available for immediate download and adjustment. So, changes can be made in the color, design, graphics or any other component to create a unique layout.
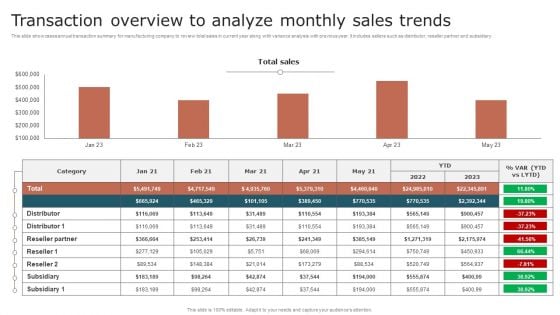
Transaction Overview To Analyze Monthly Sales Trends Inspiration PDF
This slide showcases annual transaction summary for manufacturing company to review total sales in current year along with variance analysis with previous year. It includes sellers such as distributor, reseller partner and subsidiary. Pitch your topic with ease and precision using this Transaction Overview To Analyze Monthly Sales Trends Inspiration PDF. This layout presents information on Transaction Overview, Analyze Monthly Sales Trends. It is also available for immediate download and adjustment. So, changes can be made in the color, design, graphics or any other component to create a unique layout.
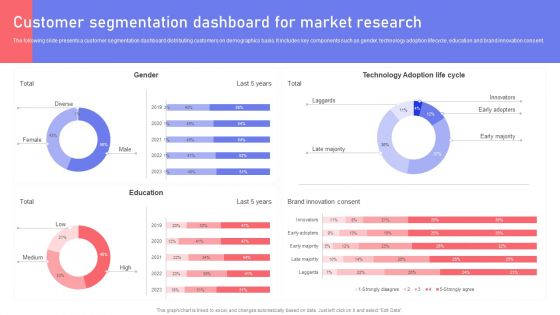
Customer Segmentation Dashboard For Market Research Ppt PowerPoint Presentation File Professional PDF
The following slide presents a customer segmentation dashboard distributing customers on demographics basis. It includes key components such as gender, technology adoption lifecycle, education and brand innovation consent. Make sure to capture your audiences attention in your business displays with our gratis customizable Customer Segmentation Dashboard For Market Research Ppt PowerPoint Presentation File Professional PDF. These are great for business strategies, office conferences, capital raising or task suggestions. If you desire to acquire more customers for your tech business and ensure they stay satisfied, create your own sales presentation with these plain slides.
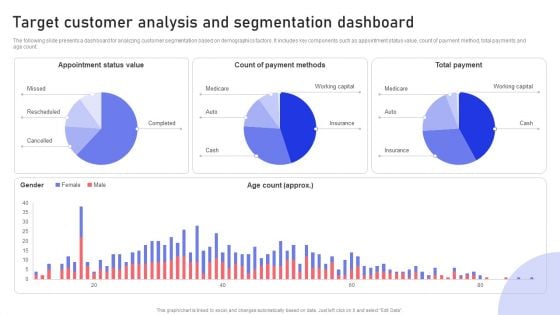
Target Customer Analysis And Segmentation Dashboard Ppt PowerPoint Presentation File Professional PDF
The following slide presents a dashboard for analyzing customer segmentation based on demographics factors. It includes key components such as appointment status value, count of payment method, total payments and age count. There are so many reasons you need a Target Customer Analysis And Segmentation Dashboard Ppt PowerPoint Presentation File Professional PDF. The first reason is you can not spend time making everything from scratch, Thus, Slidegeeks has made presentation templates for you too. You can easily download these templates from our website easily.

Agile IT Project Management Survey Of Issues Faced By IT Employees Topics PDF
This Agile IT Project Management Survey Of Issues Faced By IT Employees Topics PDF from Slidegeeks makes it easy to present information on your topic with precision. It provides customization options, so you can make changes to the colors, design, graphics, or any other component to create a unique layout. It is also available for immediate download, so you can begin using it right away. Slidegeeks has done good research to ensure that you have everything you need to make your presentation stand out. Make a name out there for a brilliant performance.
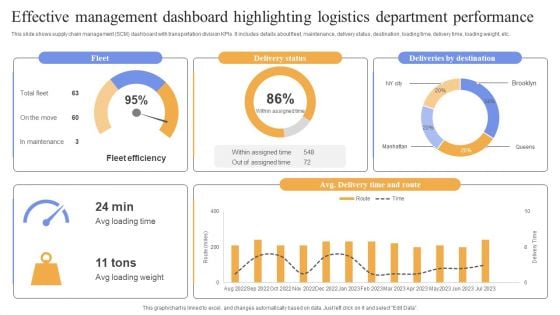
Effective Management Dashboard Highlighting Logistics Department Performance Topics PDF
This slide shows supply chain management SCM dashboard with transportation division KPIs. It includes details about fleet, maintenance, delivery status, destination, loading time, delivery time, loading weight, etc. Pitch your topic with ease and precision using this Effective Management Dashboard Highlighting Logistics Department Performance Topics PDF. This layout presents information on Fleet, Delivery Status, Deliveries Destination. It is also available for immediate download and adjustment. So, changes can be made in the color, design, graphics or any other component to create a unique layout.
Production Department Open And Closed Error Tracking Report Sample PDF
This slide showcases the tracking report for opened and closed issues concerning the manufacturing department. It also includes the priority level, open date, close date, current status, closed by, etc. Pitch your topic with ease and precision using this Production Department Open And Closed Error Tracking Report Sample PDF. This layout presents information on Open Issue Tracker, Issues Closed, Error Tracking Report. It is also available for immediate download and adjustment. So, changes can be made in the color, design, graphics or any other component to create a unique layout.
Project Error Tracking KPI Dashboard Themes PDF
This slide illustrates the dashboard for the project issue tracking and management. It includes the column chart for issues assignee, incomplete issues by priority and project, monthly percentage increase in issues created and closed, etc. Pitch your topic with ease and precision using this Project Error Tracking KPI Dashboard Themes PDF. This layout presents information on Issues Assignee, Issue Status, Incomplete Issues. It is also available for immediate download and adjustment. So, changes can be made in the color, design, graphics or any other component to create a unique layout.
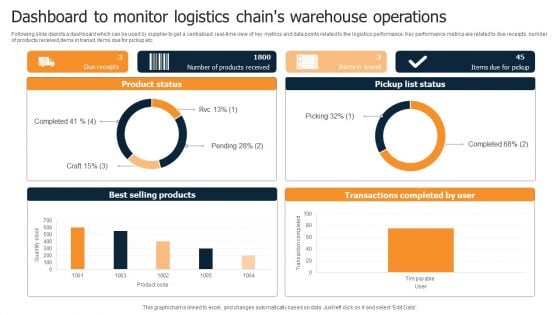
Dashboard To Monitor Logistics Chains Warehouse Operations Diagrams PDF
Following slide depicts a dashboard which can be used by supplier to get a centralized, real-time view of key metrics and data points related to the logistics performance. Key performance metrics are related to due receipts, number of products received,items in transit, items due for pickup etc. Pitch your topic with ease and precision using this Dashboard To Monitor Logistics Chains Warehouse Operations Diagrams PDF. This layout presents information on Product Status, Pickup List Status, Best Selling Products. It is also available for immediate download and adjustment. So, changes can be made in the color, design, graphics or any other component to create a unique layout.
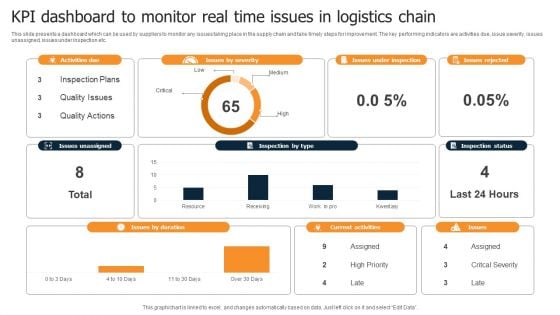
KPI Dashboard To Monitor Real Time Issues In Logistics Chain Rules PDF
This slide presents a dashboard which can be used by suppliers to monitor any issues taking place in the supply chain and take timely steps for improvement. The key performing indicators are activities due, issue severity, issues unassigned, issues under inspection etc. Pitch your topic with ease and precision using this KPI Dashboard To Monitor Real Time Issues In Logistics Chain Rules PDF. This layout presents information on Activities Due, Issues By Severity, Issues Rejected, Inspection Status. It is also available for immediate download and adjustment. So, changes can be made in the color, design, graphics or any other component to create a unique layout.
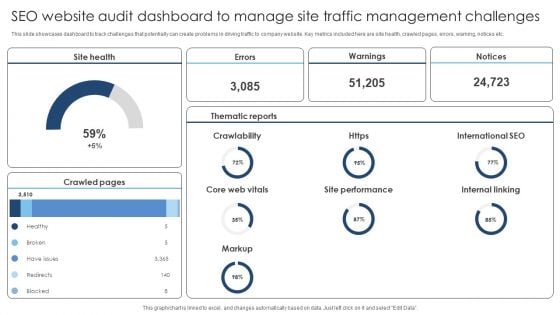
SEO Website Audit Dashboard To Manage Site Traffic Management Challenges Summary PDF
This slide showcases dashboard to track challenges that potentially can create problems in driving traffic to company website. Key metrics included here are site health, crawled pages, errors, warning, notices etc. Pitch your topic with ease and precision using this SEO Website Audit Dashboard To Manage Site Traffic Management Challenges Summary PDF. This layout presents information on Site Health, Errors, Warnings. It is also available for immediate download and adjustment. So, changes can be made in the color, design, graphics or any other component to create a unique layout.
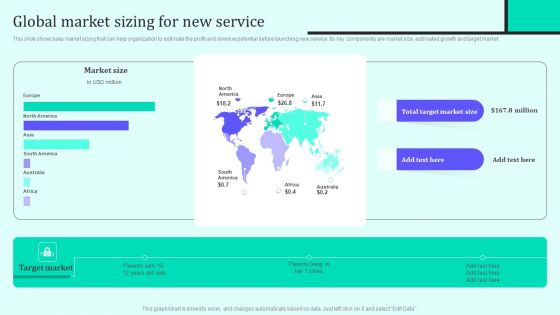
Implementing New Sales And Marketing Process For Services Global Market Sizing For New Service Information PDF
This slide showcases market sizing that can help organization to estimate the profit and revenue potential before launching new service. Its key components are market size, estimated growth and target market. Want to ace your presentation in front of a live audience Our Implementing New Sales And Marketing Process For Services Global Market Sizing For New Service Information PDF can help you do that by engaging all the users towards you. Slidegeeks experts have put their efforts and expertise into creating these impeccable powerpoint presentations so that you can communicate your ideas clearly. Moreover, all the templates are customizable, and easy to edit and downloadable. Use these for both personal and commercial use.
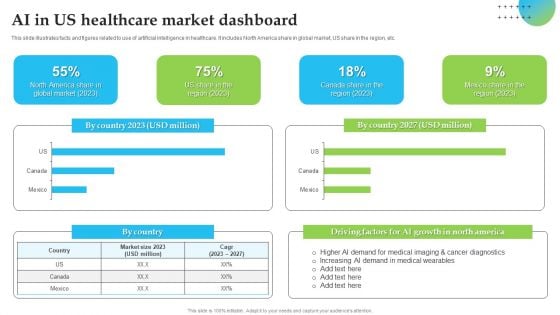
AI In US Healthcare Market Dashboard Brochure PDF
This slide illustrates facts and figures related to use of artificial intelligence in healthcare. It includes North America share in global market, US share in the region, etc. Pitch your topic with ease and precision using this AI In US Healthcare Market Dashboard Brochure PDF. This layout presents information on Driving Factors, AI Growth, Market Dashboard. It is also available for immediate download and adjustment. So, changes can be made in the color, design, graphics or any other component to create a unique layout.
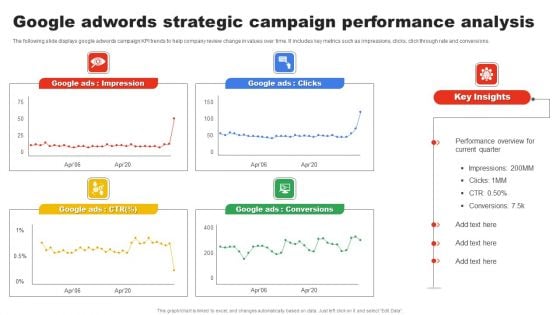
Google Adwords Strategic Campaign Performance Analysis Download PDF
The following slide displays google adwords campaign KPI trends to help company review change in values over time. It includes key metrics such as impressions, clicks, click through rate and conversions. Pitch your topic with ease and precision using this Google Adwords Strategic Campaign Performance Analysis Download PDF. This layout presents information on Google Ads Impression, Google Ads Clicks, Google Ads Conversions. It is also available for immediate download and adjustment. So, changes can be made in the color, design, graphics or any other component to create a unique layout.
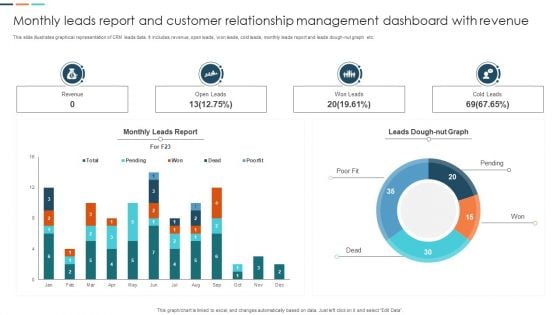
Monthly Leads Report And Customer Relationship Management Dashboard With Revenue Information PDF
This slide illustrates graphical representation of CRM leads data. It includes revenue, open leads, won leads, cold leads, monthly leads report and leads dough nut graph etc. Pitch your topic with ease and precision using this Monthly Leads Report And Customer Relationship Management Dashboard With Revenue Information PDF. This layout presents information on Monthly Leads Report, Customer Relationship Management, Dashboard With Revenue. It is also available for immediate download and adjustment. So, changes can be made in the color, design, graphics or any other component to create a unique layout.
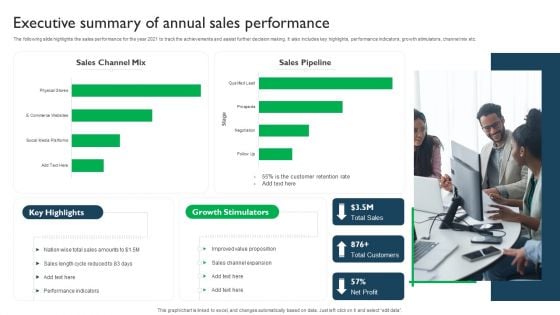
Executive Summary Of Annual Sales Performance Topics PDF
The following slide highlights the sales performance for the year 2021 to track the achievements and assist further decision making. It also includes key highlights, performance indicators, growth stimulators, channel mix etc. Pitch your topic with ease and precision using this Executive Summary Of Annual Sales Performance Topics PDF. This layout presents information on Growth Stimulators, Sales, Value Proposition. It is also available for immediate download and adjustment. So, changes can be made in the color, design, graphics or any other component to create a unique layout.
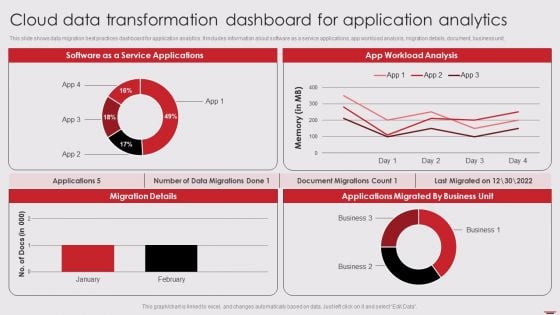
Cloud Data Transformation Dashboard For Application Analytics Information PDF
This slide shows data migration best practices dashboard for application analytics. It includes information about software as a service applications, app workload analysis, migration details, document, business unit. Pitch your topic with ease and precision using this Cloud Data Transformation Dashboard For Application Analytics Information PDF. This layout presents information on Software Service Applications, App Workload Analysis, Migration Details. It is also available for immediate download and adjustment. So, changes can be made in the color, design, graphics or any other component to create a unique layout.
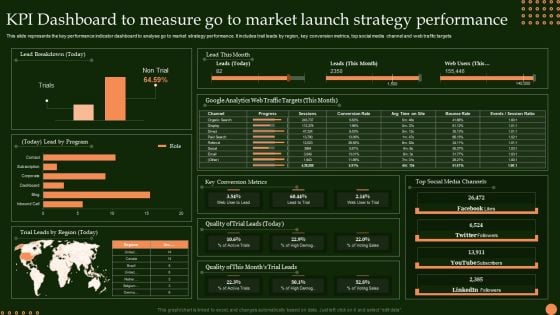
KPI Dashboard To Measure Go To Market Launch Strategy Performance Sample PDF
This slide represents the key performance indicator dashboard to analyse go to market strategy performance. It includes trail leads by region, key conversion metrics, top social media channel and web traffic targets Pitch your topic with ease and precision using this KPI Dashboard To Measure Go To Market Launch Strategy Performance Sample PDF. This layout presents information on Lead Breakdown, Lead By Program, Trial Leads Region. It is also available for immediate download and adjustment. So, changes can be made in the color, design, graphics or any other component to create a unique layout.
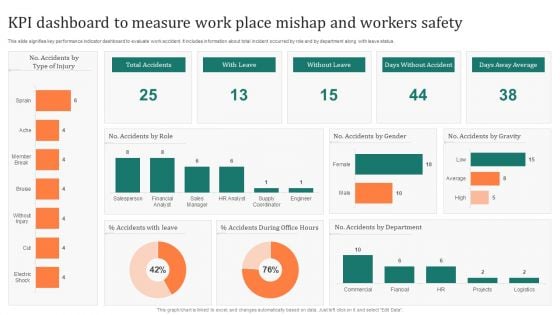
KPI Dashboard To Measure Work Place Mishap And Workers Safety Inspiration PDF
This slide signifies key performance indicator dashboard to evaluate work accident. It includes information about total incident occurred by role and by department along with leave status. Pitch your topic with ease and precision using this KPI Dashboard To Measure Work Place Mishap And Workers Safety Inspiration PDF. This layout presents information on Accidents Role, Accidents Leave, Accidents Department. It is also available for immediate download and adjustment. So, changes can be made in the color, design, graphics or any other component to create a unique layout.
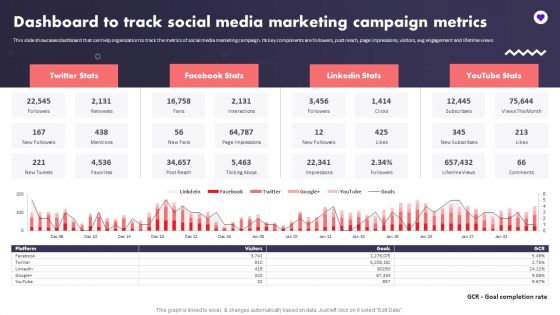
Social Media Promotional Technique Dashboard To Track Social Media Marketing Inspiration PDF
This slide showcases dashboard that can help organization to track the metrics of social media marketing campaign. Its key components are followers, post reach, page impressions, visitors, avg engagement and lifetime views. Want to ace your presentation in front of a live audience Our Social Media Promotional Technique Dashboard To Track Social Media Marketing Inspiration PDF can help you do that by engaging all the users towards you.. Slidegeeks experts have put their efforts and expertise into creating these impeccable powerpoint presentations so that you can communicate your ideas clearly. Moreover, all the templates are customizable, and easy-to-edit and downloadable. Use these for both personal and commercial use.
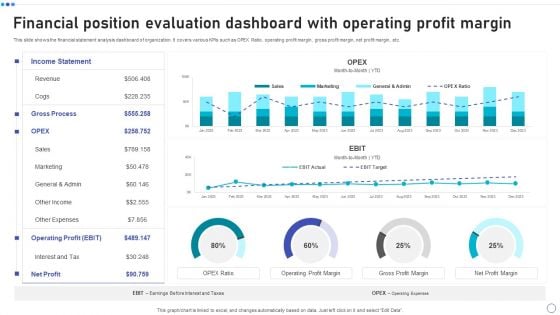
Financial Position Evaluation Dashboard With Operating Profit Margin Elements PDF
This slide shows the financial statement analysis dashboard of organization. It covers various KPIs such as OPEX Ratio, operating profit margin, gross profit margin, net profit margin, etc. Pitch your topic with ease and precision using this Financial Position Evaluation Dashboard With Operating Profit Margin Elements PDF. This layout presents information on Income Statement, Revenue, Operating Profit, Net Profit. It is also available for immediate download and adjustment. So, changes can be made in the color, design, graphics or any other component to create a unique layout.

KPI Dashboard Of Managing Innovative Business Project Ppt Pictures Show PDF
This slide shows the KPI dashboard of innovation project management. It covers the following KPIs such as innovation success rate, value in project, total revenue, active projects, etc. Pitch your topic with ease and precision using this KPI Dashboard Of Managing Innovative Business Project Ppt Pictures Show PDF. This layout presents information on Innovation Success Rate, Total Active Projects, Amount Mission. It is also available for immediate download and adjustment. So, changes can be made in the color, design, graphics or any other component to create a unique layout.
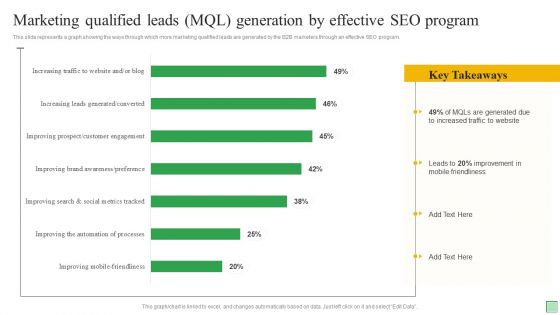
Marketing Qualified Leads MQL Generation By Effective SEO Program Ppt Slides Example Topics PDF
This slide represents a graph showing the ways through which more marketing qualified leads are generated by the B2B marketers through an effective SEO program. Pitch your topic with ease and precision using this Marketing Qualified Leads MQL Generation By Effective SEO Program Ppt Slides Example Topics PDF. This layout presents information on Mobile Friendliness, Due To Increased, Traffic To Website. It is also available for immediate download and adjustment. So, changes can be made in the color, design, graphics or any other component to create a unique layout.
Yearly Status Report For Average Customer Effort Score Assessment Ppt Icon Layout Ideas PDF
The slide carries a summary report to assess average CES for predicting the customer behaviour and purchasing habits. Various elements included are average rating, yearly graphs and key takeaways. Pitch your topic with ease and precision using this Yearly Status Report For Average Customer Effort Score Assessment Ppt Icon Layout Ideas PDF. This layout presents information on Good Customer Experience, Easy To Purchase, Processes, Increase Churn Rate. It is also available for immediate download and adjustment. So, changes can be made in the color, design, graphics or any other component to create a unique layout.
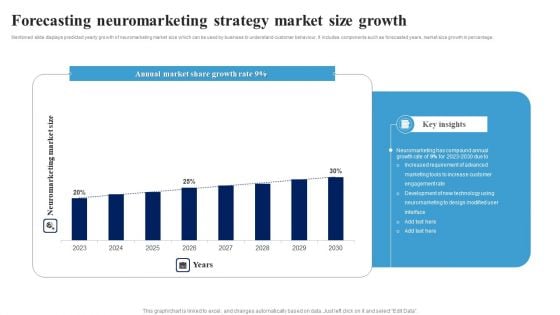
Forecasting Neuromarketing Strategy Market Size Growth Ppt Ideas Slideshow PDF
Mentioned slide displays predicted yearly growth of neuromarketing market size which can be used by business to understand customer behaviour. It includes components such as forecasted years, market size growth in percentage. Showcasing this set of slides titled Forecasting Neuromarketing Strategy Market Size Growth Ppt Ideas Slideshow PDF. The topics addressed in these templates are Annual Market Share, Growth Rate, Neuromarketing Compound, Annual Growth Rate. All the content presented in this PPT design is completely editable. Download it and make adjustments in color, background, font etc. as per your unique business setting.
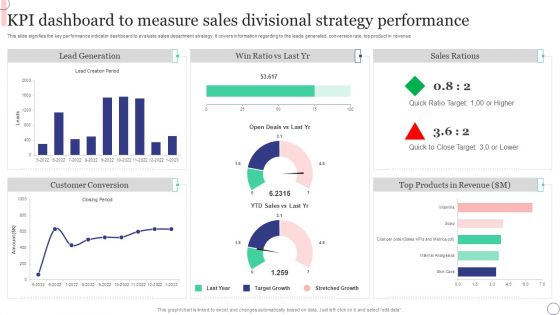
KPI Dashboard To Measure Sales Divisional Strategy Performance Microsoft PDF
This slide signifies the key performance indicator dashboard to evaluate sales department strategy. It covers information regarding to the leads generated, conversion rate, top product in revenue. Pitch your topic with ease and precision using this KPI Dashboard To Measure Sales Divisional Strategy Performance Microsoft PDF. This layout presents information on Sales Rations, Lead Generation, Customer Conversion. It is also available for immediate download and adjustment. So, changes can be made in the color, design, graphics or any other component to create a unique layout.
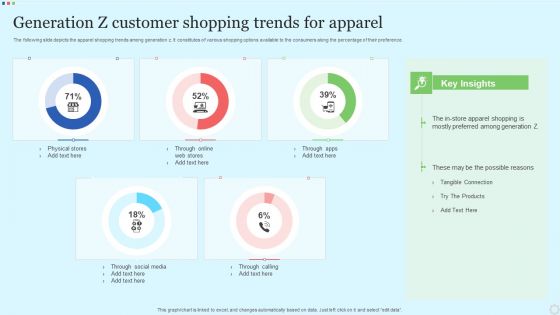
Generation Z Customer Shopping Trends For Apparel Designs PDF
The following slide depicts the apparel shopping trends among generation z. It constitutes of various shopping options available to the consumers along the percentage of their preference. Pitch your topic with ease and precision using this Generation Z Customer Shopping Trends For Apparel Designs PDF. This layout presents information on Physical Stores, Through Social Media, Through Calling. It is also available for immediate download and adjustment. So, changes can be made in the color, design, graphics or any other component to create a unique layout.
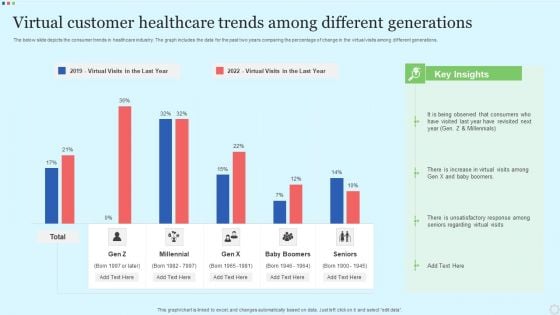
Virtual Customer Healthcare Trends Among Different Generations Professional PDF
The below slide depicts the consumer trends in healthcare industry. The graph includes the data for the past two years comparing the percentage of change in the virtual visits among different generations. Pitch your topic with ease and precision using this Virtual Customer Healthcare Trends Among Different Generations Professional PDF. This layout presents information on Millennial, Baby Boomers, Seniors. It is also available for immediate download and adjustment. So, changes can be made in the color, design, graphics or any other component to create a unique layout.
Digital Marketing Dashboard For Tracking Lead Generation Guidelines PDF
This slide showcases dashboard for digital marketing that can help organization track the monthly leads generated and performance of online marketing campaigns. Its key components are lead breakdown, total lead by program, web traffic targets, key conversion metrics, trial leads by region, total social media channels and key conversion metrics. Showcasing this set of slides titled Digital Marketing Dashboard For Tracking Lead Generation Guidelines PDF. The topics addressed in these templates are Lead By Program, Lead Breakdown, Key Conversion Metrics. All the content presented in this PPT design is completely editable. Download it and make adjustments in color, background, font etc. as per your unique business setting.
Sales Performance Dashboard With Average Lead Tracking Time Background PDF
This slide showcases dashboard for sales performance that can help organization to analyze the effectiveness of sales campaigns and average response time of lead. Its key components are average contract value, average sales cycle length, follow up contract rate and sales activity. Showcasing this set of slides titled Sales Performance Dashboard With Average Lead Tracking Time Background PDF. The topics addressed in these templates are Avg Contract Value, Sales Activity, Contract Rate. All the content presented in this PPT design is completely editable. Download it and make adjustments in color, background, font etc. as per your unique business setting.
Website Leads Tracking Dashboard With Traffic Sources Infographics PDF
This slide showcases dashboard for lead generation that can help organziation to identify the traffic sources plus visitors and make changes in SEO of website. It also showcases key metrics that are bounce rate by week, visitors by user type, top channels by conversion, top campaign by conversion and top pages by conversion. Pitch your topic with ease and precision using this Website Leads Tracking Dashboard With Traffic Sources Infographics PDF. This layout presents information on Visitors User Type, Traffic Sources, Bounce Rate Week. It is also available for immediate download and adjustment. So, changes can be made in the color, design, graphics or any other component to create a unique layout.
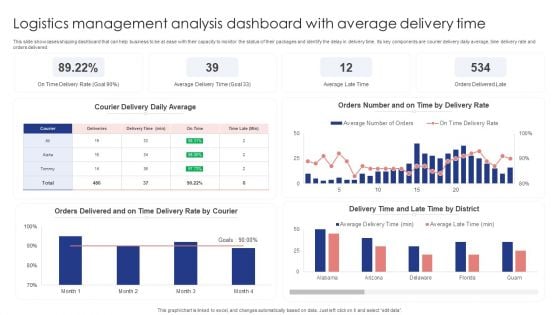
Logistics Management Analysis Dashboard With Average Delivery Time Themes PDF
This slide showcases shipping dashboard that can help business to be at ease with their capacity to monitor the status of their packages and identify the delay in delivery time. Its key components are courier delivery daily average, time delivery rate and orders delivered. Showcasing this set of slides titled Logistics Management Analysis Dashboard With Average Delivery Time Themes PDF. The topics addressed in these templates are Courier Delivery Daily Average, Delivery Rate, Orders Delivered. All the content presented in this PPT design is completely editable. Download it and make adjustments in color, background, font etc. as per your unique business setting.
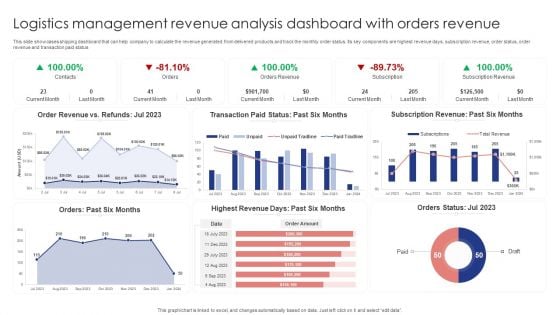
Logistics Management Revenue Analysis Dashboard With Orders Revenue Brochure PDF
This slide showcases shipping dashboard that can help company to calculate the revenue generated from delivered products and track the monthly order status. Its key components are highest revenue days, subscription revenue, order status, order revenue and transaction paid status. Showcasing this set of slides titled Logistics Management Revenue Analysis Dashboard With Orders Revenue Brochure PDF. The topics addressed in these templates are Order Revenue, Transaction Paid, Subscription Revenue. All the content presented in this PPT design is completely editable. Download it and make adjustments in color, background, font etc. as per your unique business setting.

Virtual Performance Management And Monitoring Dashboard Pictures PDF
Following slide illustrates remote performance dashboard utilized by organizations to monitor active issues and stay ahead of problems. This slide provides data regarding issues, problematic servers, unmonitored devices, server status, reboot time, etc. Pitch your topic with ease and precision using this Virtual Performance Management And Monitoring Dashboard Pictures PDF. This layout presents information on Total Devices, Devices With Problem, Regular Safety Check Problems. It is also available for immediate download and adjustment. So, changes can be made in the color, design, graphics or any other component to create a unique layout.
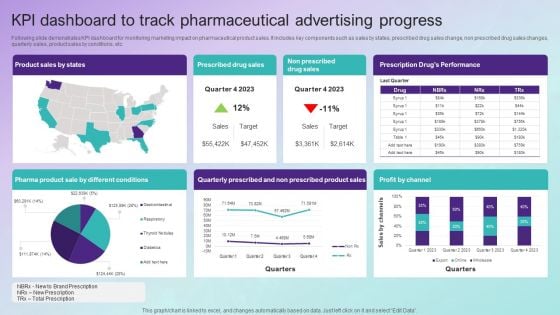
KPI Dashboard To Track Pharmaceutical Advertising Progress Topics PDF
Following slide demonstrates KPI dashboard for monitoring marketing impact on pharmaceutical product sales. It includes key components such as sales by states, prescribed drug sales change, non prescribed drug sales changes, quarterly sales, product sales by conditions, etc. Showcasing this set of slides titled KPI Dashboard To Track Pharmaceutical Advertising Progress Topics PDF. The topics addressed in these templates are Product Sales By States, Prescribed Drug Sales, Non Prescribed Drug Sales, Profit By Channel. All the content presented in this PPT design is completely editable. Download it and make adjustments in color, background, font etc. as per your unique business setting.
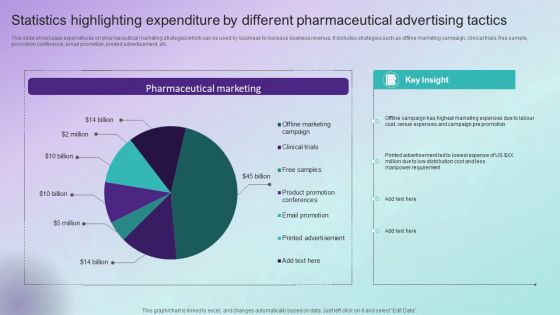
Statistics Highlighting Expenditure By Different Pharmaceutical Advertising Tactics Mockup PDF
This slide showcases expenditures on pharmaceutical marketing strategies which can be used by business to increase business revenue. It includes strategies such as offline marketing campaign, clinical trials, free sample, promotion conference, email promotion, printed advertisement, etc. Pitch your topic with ease and precision using this Statistics Highlighting Expenditure By Different Pharmaceutical Advertising Tactics Mockup PDF. This layout presents information on Offline Marketing Campaign, Clinical Trials, Free Sample, Promotion Conference, Email Promotion, Printed Advertisement. It is also available for immediate download and adjustment. So, changes can be made in the color, design, graphics or any other component to create a unique layout.
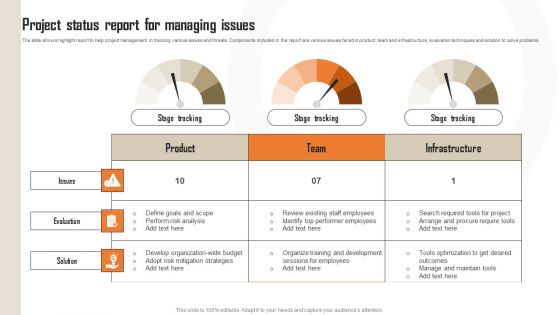
Project Status Report For Managing Issues Mockup PDF
The slide shows highlight report to help project management in tracking various issues and threats. Components included in the report are various issues faced in product, team and infrastructure, evaluation techniques and solution to solve problems. Showcasing this set of slides titled Project Status Report For Managing Issues Mockup PDF. The topics addressed in these templates are Issues, Evaluation, Solution. All the content presented in this PPT design is completely editable. Download it and make adjustments in color, background, font etc. as per your unique business setting.
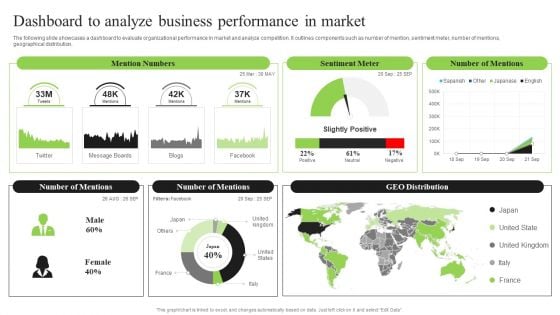
Guidebook For Executing Business Market Intelligence Dashboard To Analyze Business Brochure PDF
The following slide showcases a dashboard to evaluate organizational performance in market and analyze competition. It outlines components such as number of mention, sentiment meter, number of mentions, geographical distribution. Find a pre designed and impeccable Guidebook For Executing Business Market Intelligence Dashboard To Analyze Business Brochure PDF. The templates can ace your presentation without additional effort. You can download these easy to edit presentation templates to make your presentation stand out from others. So, what are you waiting for Download the template from Slidegeeks today and give a unique touch to your presentation.
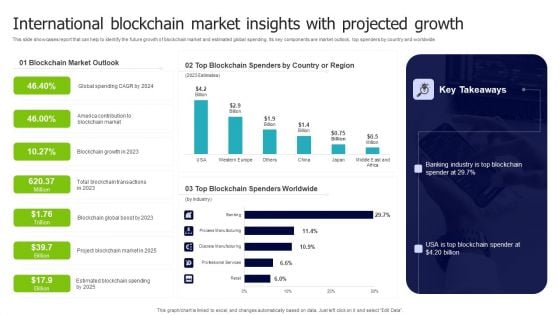
International Blockchain Market Insights With Projected Growth Microsoft PDF
This slide showcases report that can help to identify the future growth of blockchain market and estimated global spending. Its key components are market outlook, top spenders by country and worldwide. Showcasing this set of slides titled International Blockchain Market Insights With Projected Growth Microsoft PDF. The topics addressed in these templates are Blockchain Market Outlook, Blockchain Spenders, Country Region. All the content presented in this PPT design is completely editable. Download it and make adjustments in color, background, font etc. as per your unique business setting.
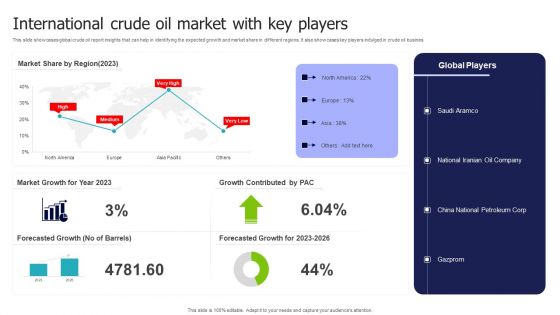
International Crude Oil Market With Key Players Demonstration PDF
This slide showcases global crude oil report insights that can help in identifying the expected growth and market share in different regions. It also showcases key players indulged in crude oil busines. Pitch your topic with ease and precision using this International Crude Oil Market With Key Players Demonstration PDF. This layout presents information on Market Share, Market Growth, Growth Contributed . It is also available for immediate download and adjustment. So, changes can be made in the color, design, graphics or any other component to create a unique layout.

International Housing Market Trends With Key Drivers Inspiration PDF
This slide showcases global statistics that can help organizations to estimate the forecasted growth of housing market and identify stock by region. It also showcases key drivers contributing in new housing developments. Pitch your topic with ease and precision using this International Housing Market Trends With Key Drivers Inspiration PDF. This layout presents information on Key Drivers, Housing Market, Forecasted. It is also available for immediate download and adjustment. So, changes can be made in the color, design, graphics or any other component to create a unique layout.
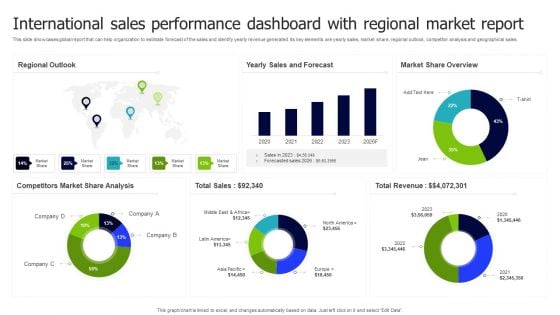
International Sales Performance Dashboard With Regional Market Report Inspiration PDF
This slide showcases global report that can help organization to estimate forecast of the sales and identify yearly revenue generated. Its key elements are yearly sales, market share, regional outlook, competitor analysis and geographical sales. Pitch your topic with ease and precision using this International Sales Performance Dashboard With Regional Market Report Inspiration PDF. This layout presents information on Regional Outlook, Sales And Forecast, Market Share Overview. It is also available for immediate download and adjustment. So, changes can be made in the color, design, graphics or any other component to create a unique layout.
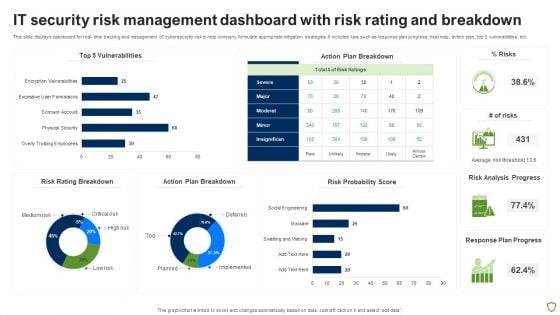
IT Security Risk Management Dashboard With Risk Rating And Breakdown Pictures PDF
This slide displays dashboard for real- time tracking and management of cybersecurity risk to help company formulate appropriate mitigation strategies. It includes kpis such as response plan progress, heat map, action plan, top 5 vulnerabilities, etc. Pitch your topic with ease and precision using this IT Security Risk Management Dashboard With Risk Rating And Breakdown Pictures PDF. This layout presents information on Risk Rating Breakdown, Action Plan Breakdown, Risk Probability Score, Risk Analysis Progress. It is also available for immediate download and adjustment. So, changes can be made in the color, design, graphics or any other component to create a unique layout.
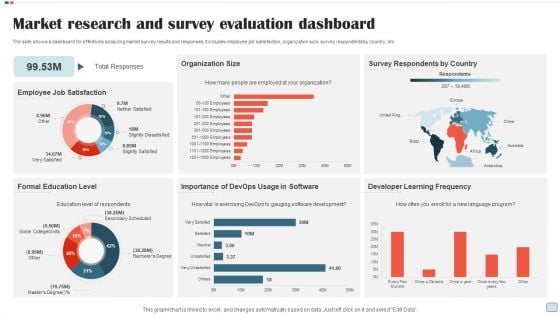
Market Research And Survey Evaluation Dashboard Rules PDF
The slide shows a dashboard for effectively analyzing market survey results and responses. It includes employee job satisfaction, organization size, survey respondents by country, etc. Pitch your topic with ease and precision using this Market Research And Survey Evaluation Dashboard Rules PDF. This layout presents information on Employee Job Satisfaction, Organization Size, Survey Respondents By Country. It is also available for immediate download and adjustment. So, changes can be made in the color, design, graphics or any other component to create a unique layout.

Quarterly Sales Performance Of Business Analysis With Key Insights Information PDF
In this slide sales performance of each product is recorded as their percentage share in total sales first quarter of company. The goods include headphones, joystick, mouse pad, bluetooth speaker, etc. Pitch your topic with ease and precision using this Quarterly Sales Performance Of Business Analysis With Key Insights Information PDF. This layout presents information on Wireless Mouse, Keyboard, Mouse Pad, Joystick, Headsets. It is also available for immediate download and adjustment. So, changes can be made in the color, design, graphics or any other component to create a unique layout.
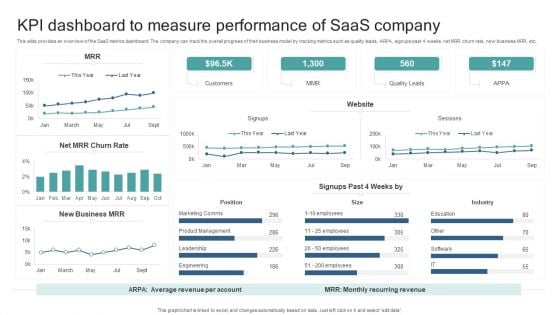
KPI Dashboard To Measure Performance Of Saas Company Introduction PDF
This slide provides an overview of the SaaS metrics dashboard. The company can track the overall progress of their business model by tracking metrics such as quality leads, ARPA, signups past 4 weeks, net MRR churn rate, new business MRR, etc. Pitch your topic with ease and precision using this KPI Dashboard To Measure Performance Of Saas Company Introduction PDF. This layout presents information on Industry, Position, Customers, Quality Leads. It is also available for immediate download and adjustment. So, changes can be made in the color, design, graphics or any other component to create a unique layout.
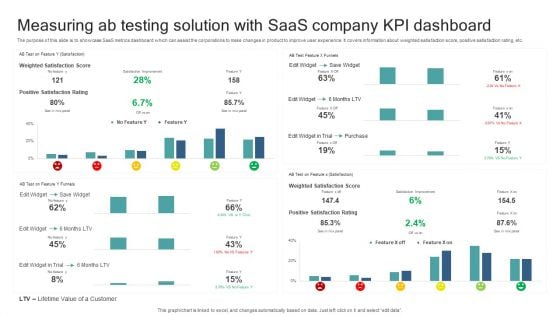
Measuring Ab Testing Solution With Saas Company KPI Dashboard Guidelines PDF
The purpose of this slide is to showcase SaaS metrics dashboard which can assist the corporations to make changes in product to improve user experience. It covers information about weighted satisfaction score, positive satisfaction rating, etc. Pitch your topic with ease and precision using this Measuring Ab Testing Solution With Saas Company KPI Dashboard Guidelines PDF. This layout presents information on Lifetime Value Customer, Positive Satisfaction Rating, Save Widget, Weighted Satisfaction Score. It is also available for immediate download and adjustment. So, changes can be made in the color, design, graphics or any other component to create a unique layout.
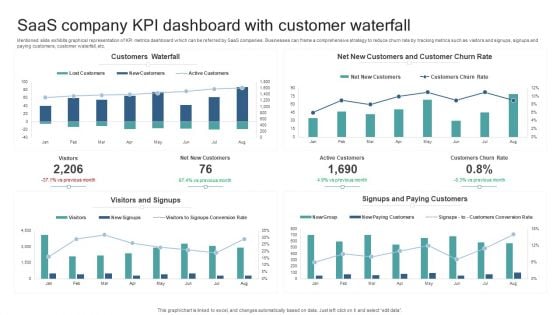
Saas Company KPI Dashboard With Customer Waterfall Slides PDF
Mentioned slide exhibits graphical representation of KPI metrics dashboard which can be referred by SaaS companies. Businesses can frame a comprehensive strategy to reduce churn rate by tracking metrics such as visitors and signups, signups and paying customers, customer waterfall, etc. Pitch your topic with ease and precision using this Saas Company KPI Dashboard With Customer Waterfall Slides PDF. This layout presents information on Customers Waterfall, Visitors And Signups, Signups And Paying Customers. It is also available for immediate download and adjustment. So, changes can be made in the color, design, graphics or any other component to create a unique layout.
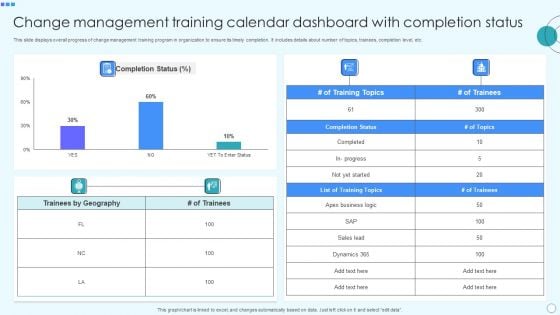
Change Management Training Calendar Dashboard With Completion Status Portrait PDF
This slide displays overall progress of change management training program in organization to ensure its timely completion. It includes details about number of topics, trainees, completion level, etc. Pitch your topic with ease and precision using this Change Management Training Calendar Dashboard With Completion Status Portrait PDF. This layout presents information on Business Logic, Geography, Completion Status, Sales Lead, Dynamics. It is also available for immediate download and adjustment. So, changes can be made in the color, design, graphics or any other component to create a unique layout.
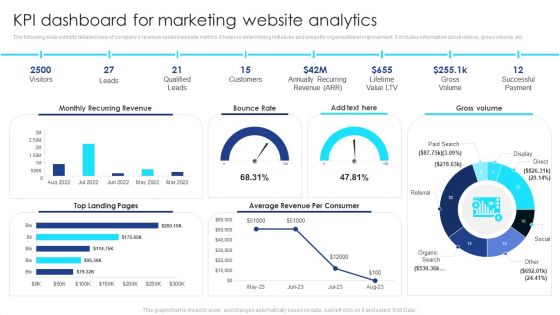
KPI Dashboard For Marketing Website Analytics Summary PDF
The following slide exhibits detailed view of companys revenue-related website metrics. It helps in determining initiatives and areas for organisational improvement. It includes information about visitors, gross volume, etc. Pitch your topic with ease and precision using this KPI Dashboard For Marketing Website Analytics Summary PDF. This layout presents information on Visitors, Leads, Qualified Leads, Customers, Gross Volume, Successful Payment. It is also available for immediate download and adjustment. So, changes can be made in the color, design, graphics or any other component to create a unique layout.
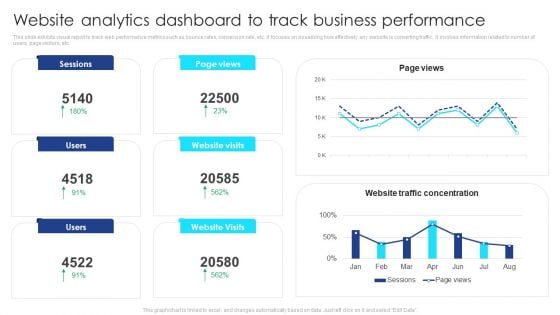
Website Analytics Dashboard To Track Business Performance Guidelines PDF
This slide exhibits visual report to track web performance metrics such as bounce rates, conversion rate, etc. It focuses on visualizing how effectively any website is converting traffic. It involves information related to number of users, page visitors, etc. Pitch your topic with ease and precision using this Website Analytics Dashboard To Track Business Performance Guidelines PDF. This layout presents information on Website Analytics, Dashboard To Track, Business Performance. It is also available for immediate download and adjustment. So, changes can be made in the color, design, graphics or any other component to create a unique layout.
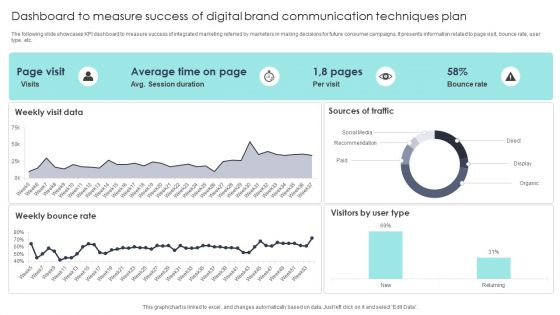
Dashboard To Measure Success Of Digital Brand Communication Techniques Plan Themes PDF
The following slide showcases KPI dashboard to measure success of integrated marketing referred by marketers in making decisions for future consumer campaigns. It presents information related to page visit, bounce rate, user type, etc. Pitch your topic with ease and precision using this Dashboard To Measure Success Of Digital Brand Communication Techniques Plan Themes PDF. This layout presents information on Sources Of Traffic, Social Media, Brand Communication Techniques Plan. It is also available for immediate download and adjustment. So, changes can be made in the color, design, graphics or any other component to create a unique layout.
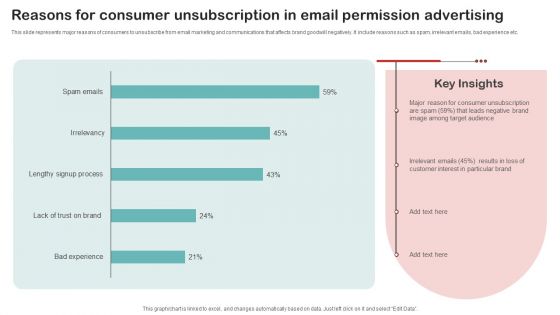
Reasons For Consumer Unsubscription In Email Permission Advertising Diagrams PDF
This slide represents major reasons of consumers to unsubscribe from email marketing and communications that affects brand goodwill negatively. It include reasons such as spam, irrelevant emails, bad experience etc. Pitch your topic with ease and precision using this Reasons For Consumer Unsubscription In Email Permission Advertising Diagrams PDF. This layout presents information on Irrelevant Emails, Customer Interest, Target Audience. It is also available for immediate download and adjustment. So, changes can be made in the color, design, graphics or any other component to create a unique layout.


 Continue with Email

 Home
Home


