Cost Dashboard
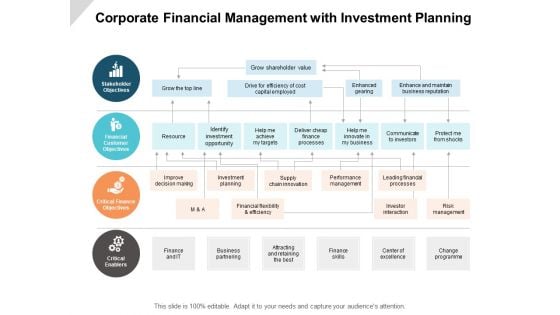
Corporate Financial Management With Investment Planning Ppt PowerPoint Presentation Inspiration Example
Presenting this set of slides with name corporate financial management with investment planning ppt powerpoint presentation inspiration example. This is a four stage process. The stages in this process are financial strategy, business financial trend, business strategy. This is a completely editable PowerPoint presentation and is available for immediate download. Download now and impress your audience.
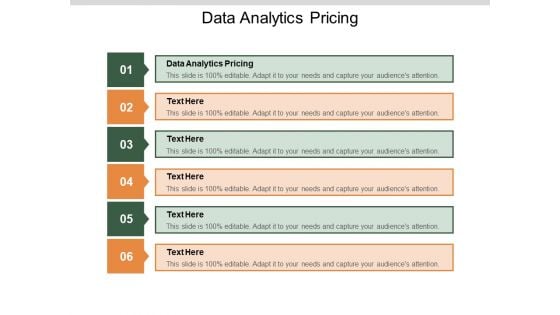
Data Analytics Pricing Ppt PowerPoint Presentation Show Designs Cpb Pdf
Presenting this set of slides with name data analytics pricing ppt powerpoint presentation show designs cpb pdf. This is an editable Powerpoint six stages graphic that deals with topics like data analytics pricing to help convey your message better graphically. This product is a premium product available for immediate download and is 100 percent editable in Powerpoint. Download this now and use it in your presentations to impress your audience.
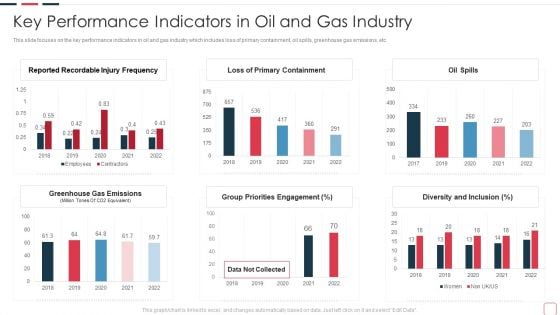
Price Benefit Internet Things Digital Twins Execution After Covid Key Performance Indicators In Oil Slides PDF
This slide focuses on the key performance indicators in oil and gas industry which includes loss of primary containment, oil spills, greenhouse gas emissions, etc. Deliver an awe inspiring pitch with this creative price benefit internet things digital twins execution after covid key performance indicators in oil slides pdf bundle. Topics like key performance indicators in oil and gas industry can be discussed with this completely editable template. It is available for immediate download depending on the needs and requirements of the user.
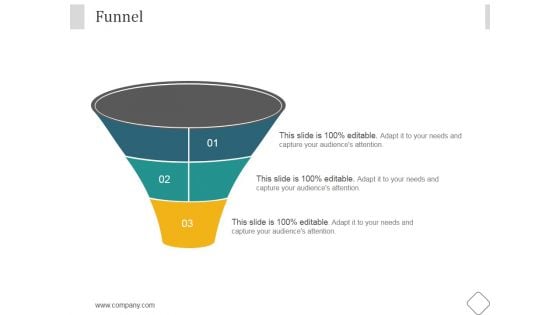
Funnel Ppt PowerPoint Presentation Backgrounds
This is a funnel ppt powerpoint presentation backgrounds. This is a three stage process. The stages in this process are business, marketing, management, funnel, planning.
E Commerce Business Data Reference Diagram Icon Portrait PDF
Pitch your topic with ease and precision using this E Commerce Business Data Reference Diagram Icon Portrait PDF. This layout presents information on Ecommerce Business, Data Reference Diagram. It is also available for immediate download and adjustment. So, changes can be made in the color, design, graphics or any other component to create a unique layout.
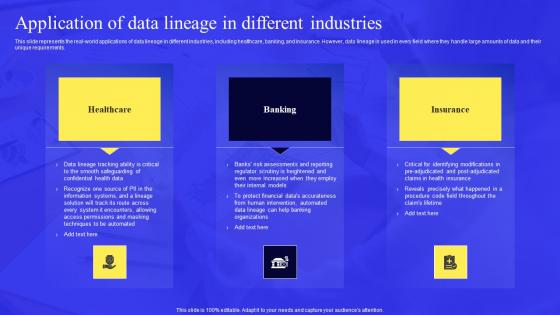
Business Process Data Lineage Application Of Data Lineage In Different Industries Microsoft Pdf
This slide represents the real world applications of data lineage in different industries, including healthcare, banking, and insurance. However, data lineage is used in every field where they handle large amounts of data and their unique requirements. Slidegeeks is one of the best resources for PowerPoint templates. You can download easily and regulate Business Process Data Lineage Application Of Data Lineage In Different Industries Microsoft Pdf for your personal presentations from our wonderful collection. A few clicks is all it takes to discover and get the most relevant and appropriate templates. Use our Templates to add a unique zing and appeal to your presentation and meetings. All the slides are easy to edit and you can use them even for advertisement purposes. This slide represents the real-world applications of data lineage in different industries, including healthcare, banking, and insurance. However, data lineage is used in every field where they handle large amounts of data and their unique requirements.
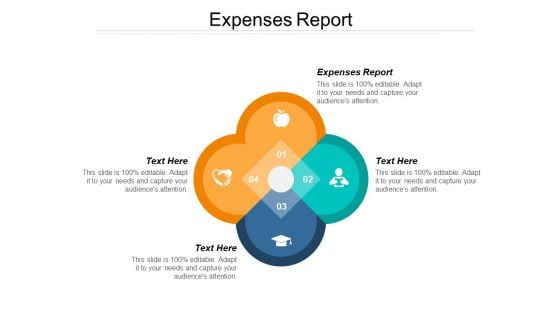
Expenses Report Ppt PowerPoint Presentation Gallery Microsoft
This is a expenses report ppt powerpoint presentation gallery microsoft. This is a four stage process. The stages in this process are expenses report.
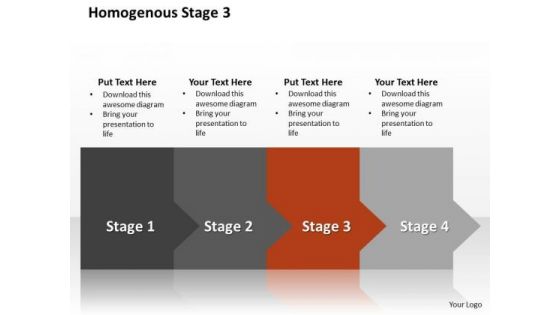
Ppt Homogenous Way To Prevent Banking Losses Stage 3 PowerPoint Templates
PPT homogenous way to prevent banking losses stage 3 PowerPoint Templates-The theme of this PowerPoint template is linear arrows. Use them to illustrate a stepwise process or a phase structure. You can easily change its colors-PPT homogenous way to prevent banking losses stage 3 PowerPoint Templates-Arrow, Bank, Benefit, Business, Calculate, Calculation, Capitalist, Communication, Company, Concern, Connection, Data, Diagram, Digital, Drawing, Earnings, Economic, Finance, Financial, Flow, Forecast, Gain, Goal, Graph, Growth, Illustration, Increase, Information, Interest, Investing, Management, Market, Money, Move, Network, Objective, Plan, Process, Profit, Progress, Report, Rise, Risk, Shares, Statistics, Stock, System, Technology Making plans with our Ppt Homogenous Way To Prevent Banking Losses Stage 3 PowerPoint Templates entails success. They ensure automatic returns.
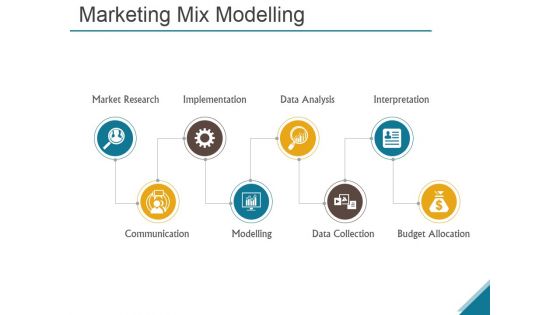
Marketing Mix Modelling Ppt PowerPoint Presentation Good
This is a marketing mix modelling ppt powerpoint presentation good. This is a eight stage process. The stages in this process are market research, implementation, data analysis, interpretation, communication, modelling, data collection, budget allocation.
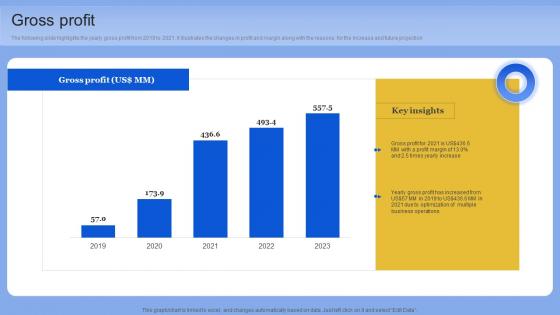
Gross Profit Data Analytics Company Outline Pictures PDF
The following slide highlights the yearly gross profit from 2019 to 2021. it illustrates the changes in profit and margin along with the reasons for the increase and future projection. Formulating a presentation can take up a lot of effort and time, so the content and message should always be the primary focus. The visuals of the PowerPoint can enhance the presenters message, so our Gross Profit Data Analytics Company Outline Pictures PDF was created to help save time. Instead of worrying about the design, the presenter can concentrate on the message while our designers work on creating the ideal templates for whatever situation is needed. Slidegeeks has experts for everything from amazing designs to valuable content, we have put everything into Gross Profit Data Analytics Company Outline Pictures PDF The following slide highlights the yearly gross profit from 2019 to 2021. it illustrates the changes in profit and margin along with the reasons for the increase and future projection
Vector Of Sales Planning To Ascertain Annual Financial Goals Ppt PowerPoint Presentation Icon Infographics PDF
Presenting this set of slides with name vector of sales planning to ascertain annual financial goals ppt powerpoint presentation icon infographics pdf. This is a three stage process. The stages in this process are vector of sales planning to ascertain annual financial goals. This is a completely editable PowerPoint presentation and is available for immediate download. Download now and impress your audience.

Commercial Marketing KPI With Return On Investment Diagrams PDF
This slide templates covers about trade marketing key performing indicators with website visitors, leads by channel, social media reach with yearly goal achievement.Pitch your topic with ease and precision using this Commercial Marketing KPI With Return On Investment Diagrams PDF. This layout presents information on Marketing Spend, Return Investment, Budget Remaining. It is also available for immediate download and adjustment. So, changes can be made in the color, design, graphics or any other component to create a unique layout.
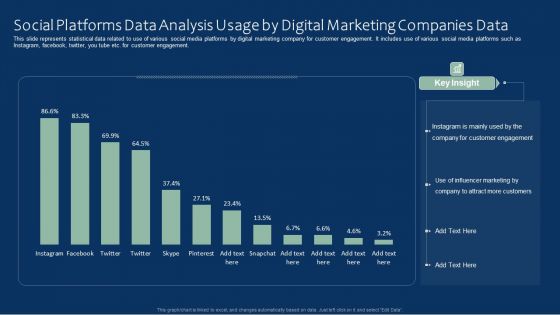
Social Platforms Data Analysis Usage By Digital Marketing Companies Data Clipart PDF
This slide represents statistical data related to use of various social media platforms by digital marketing company for customer engagement. It includes use of various social media platforms such as Instagram, facebook, twitter, you tube etc. for customer engagement. Pitch your topic with ease and precision using this Social Platforms Data Analysis Usage By Digital Marketing Companies Data Clipart PDF. This layout presents information on Social Platforms Data Analysis, Digital Marketing Companies Data. It is also available for immediate download and adjustment. So, changes can be made in the color, design, graphics or any other component to create a unique layout.
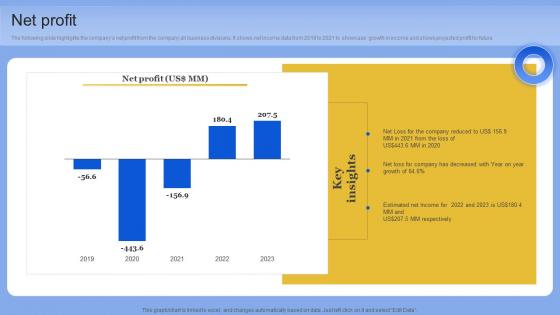
Net Profit Data Analytics Company Outline Diagrams PDF
The following slide highlights the companys net profit from the company all business divisions. It shows net income data from 2019 to 2021 to showcase growth in income and shows projected profit for future. Retrieve professionally designed Net Profit Data Analytics Company Outline Diagrams PDF to effectively convey your message and captivate your listeners. Save time by selecting pre-made slideshows that are appropriate for various topics, from business to educational purposes. These themes come in many different styles, from creative to corporate, and all of them are easily adjustable and can be edited quickly. Access them as PowerPoint templates or as Google Slides themes. You do not have to go on a hunt for the perfect presentation because Slidegeeks got you covered from everywhere. The following slide highlights the companys net profit from the company all business divisions. It shows net income data from 2019 to 2021 to showcase growth in income and shows projected profit for future
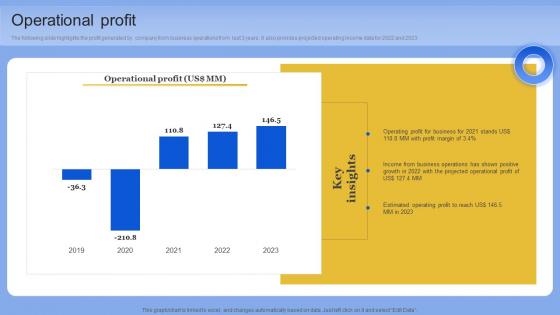
Operational Profit Data Analytics Company Outline Pictures PDF
The following slide highlights the profit generated by company from business operations from last 3 years. It also provides projected operating income data for 2022 and 2023. Slidegeeks has constructed Operational Profit Data Analytics Company Outline Pictures PDF after conducting extensive research and examination. These presentation templates are constantly being generated and modified based on user preferences and critiques from editors. Here, you will find the most attractive templates for a range of purposes while taking into account ratings and remarks from users regarding the content. This is an excellent jumping-off point to explore our content and will give new users an insight into our top-notch PowerPoint Templates. The following slide highlights the profit generated by company from business operations from last 3 years. It also provides projected operating income data for 2022 and 2023
Statistical Data On Social Platforms Data Analysis Services Offered By Marketing Agencies Icons PDF
This slide shows the statistics related to social media services provided by the marketing agencies to their clients. It includes various services such as content creation, social media monitoring, strategy building, campaign analysis etc. Pitch your topic with ease and precision using this Statistical Data On Social Platforms Data Analysis Services Offered By Marketing Agencies Icons PDF. This layout presents information on Statistical Data, Social Platforms Data, Analysis Services, Marketing Agencies. It is also available for immediate download and adjustment. So, changes can be made in the color, design, graphics or any other component to create a unique layout.
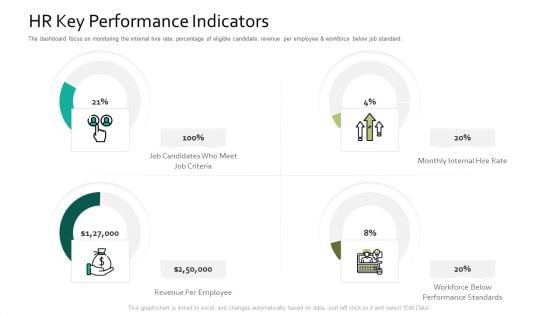
HR Key Performance Indicators Human Resource Information System For Organizational Effectiveness Pictures PDF
Deliver an awe inspiring pitch with this creative hr key performance indicators human resource information system for organizational effectiveness pictures pdf bundle. Topics like revenue, employee, performance, rate can be discussed with this completely editable template. It is available for immediate download depending on the needs and requirements of the user.

Exit Strategy Carelulu Shareholders Fund Raising Pitch Deck Infographics Pdf
The slide provides most profitable feasible ways for investors to exit from their investment in the company. It includes initial public offering and private offerings. From laying roadmaps to briefing everything in detail, our templates are perfect for you. You can set the stage with your presentation slides. All you have to do is download these easy to edit and customizable templates. Exit Strategy Carelulu Shareholders Fund Raising Pitch Deck Infographics Pdf will help you deliver an outstanding performance that everyone would remember and praise you for. Do download this presentation today. The slide provides most profitable feasible ways for investors to exit from their investment in the company. It includes initial public offering and private offerings.
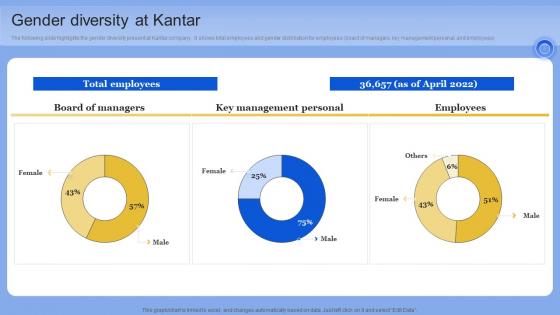
Gender Diversity At Kantar Data Analytics Company Outline Portrait PDF
The following slide highlights the gender diversity present at Kantar company. It shows total employees and gender distribution for employees board of managers, key management personal, and employees. If you are looking for a format to display your unique thoughts, then the professionally designed Gender Diversity At Kantar Data Analytics Company Outline Portrait PDF is the one for you. You can use it as a Google Slides template or a PowerPoint template. Incorporate impressive visuals, symbols, images, and other charts. Modify or reorganize the text boxes as you desire. Experiment with shade schemes and font pairings. Alter, share or cooperate with other people on your work. Download Gender Diversity At Kantar Data Analytics Company Outline Portrait PDF and find out how to give a successful presentation. Present a perfect display to your team and make your presentation unforgettable. The following slide highlights the gender diversity present at Kantar company. It shows total employees and gender distribution for employees board of managers, key management personal, and employees
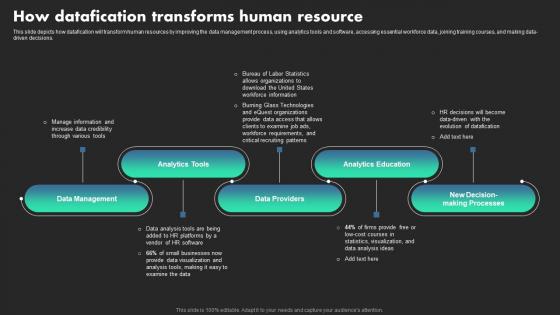
How Datafication Transforms Human Resource Ethical Dimensions Of Datafication Sample Pdf
This slide depicts how datafication will transform human resources by improving the data management process, using analytics tools and software, accessing essential workforce data, joining training courses, and making data-driven decisions. Explore a selection of the finest How Datafication Transforms Human Resource Ethical Dimensions Of Datafication Sample Pdf here. With a plethora of professionally designed and pre-made slide templates, you can quickly and easily find the right one for your upcoming presentation. You can use our How Datafication Transforms Human Resource Ethical Dimensions Of Datafication Sample Pdf to effectively convey your message to a wider audience. Slidegeeks has done a lot of research before preparing these presentation templates. The content can be personalized and the slides are highly editable. Grab templates today from Slidegeeks. This slide depicts how datafication will transform human resources by improving the data management process, using analytics tools and software, accessing essential workforce data, joining training courses, and making data-driven decisions.
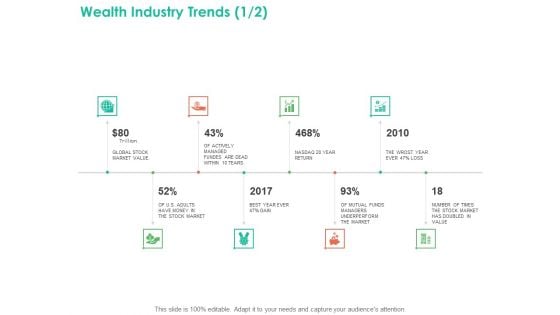
Investment Portfolio Management Wealth Industry Trends Market Background PDF
Presenting this set of slides with name investment portfolio management wealth industry trends market background pdf. This is a eight stage process. The stages in this process are market, value, return. This is a completely editable PowerPoint presentation and is available for immediate download. Download now and impress your audience.
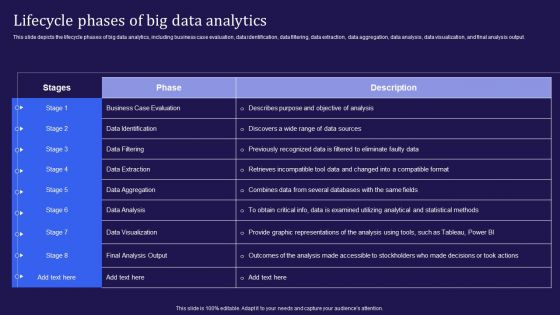
Big Data Analytics Lifecycle Lifecycle Phases Of Big Data Analytics Ppt Gallery Sample PDF
This slide depicts the lifecycle phases of big data analytics, including business case evaluation, data identification, data filtering, data extraction, data aggregation, data analysis, data visualization, and final analysis output. Slidegeeks is one of the best resources for PowerPoint templates. You can download easily and regulate Big Data Analytics Lifecycle Lifecycle Phases Of Big Data Analytics Ppt Gallery Sample PDF for your personal presentations from our wonderful collection. A few clicks is all it takes to discover and get the most relevant and appropriate templates. Use our Templates to add a unique zing and appeal to your presentation and meetings. All the slides are easy to edit and you can use them even for advertisement purposes.
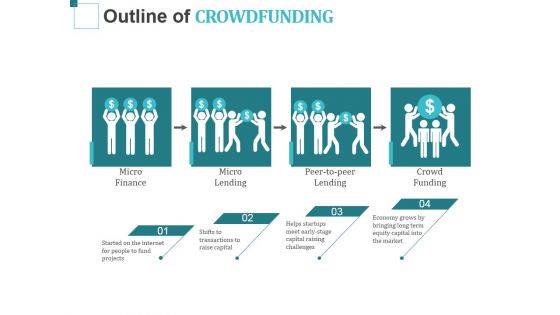
Outline Of Crowdfunding Ppt PowerPoint Presentation Layouts Example
This is a outline of crowdfunding ppt powerpoint presentation layouts example. This is a four stage process. The stages in this process are micro, finance, micro lending, peer to peer lending, crowd funding.
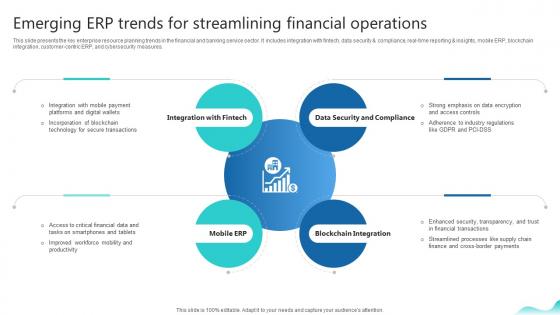
Emerging Erp Trends For Streamlining Financial Operations Erp And Digital Transformation For Maximizing DT SS V
This slide presents the key enterprise resource planning trends in the financial and banking service sector. It includes integration with fintech, data security and compliance, real-time reporting and insights, mobile ERP, blockchain integration, customer-centric ERP, and cybersecurity measures.Welcome to our selection of the Emerging Erp Trends For Streamlining Financial Operations Erp And Digital Transformation For Maximizing DT SS V. These are designed to help you showcase your creativity and bring your sphere to life. Planning and Innovation are essential for any business that is just starting out. This collection contains the designs that you need for your everyday presentations. All of our PowerPoints are 100 percent editable, so you can customize them to suit your needs. This multi-purpose template can be used in various situations. Grab these presentation templates today. This slide presents the key enterprise resource planning trends in the financial and banking service sector. It includes integration with fintech, data security and compliance, real-time reporting and insights, mobile ERP, blockchain integration, customer-centric ERP, and cybersecurity measures.
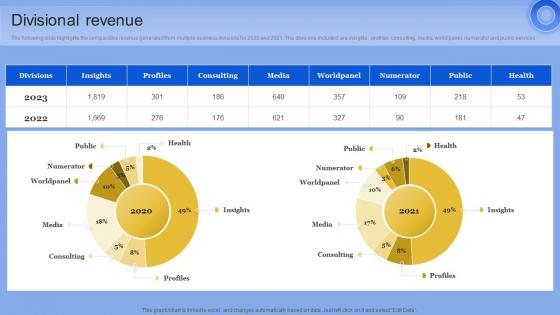
Divisional Revenue Data Analytics Company Outline Pictures PDF
The following slide highlights the comparative revenue generated from multiple business divisions for 2020 and 2021. The divisions included are insights, profiles, consulting, media, world panel, numerator and public services From laying roadmaps to briefing everything in detail, our templates are perfect for you. You can set the stage with your presentation slides. All you have to do is download these easy-to-edit and customizable templates. Divisional Revenue Data Analytics Company Outline Pictures PDF will help you deliver an outstanding performance that everyone would remember and praise you for. Do download this presentation today. The following slide highlights the comparative revenue generated from multiple business divisions for 2020 and 2021. The divisions included are insights, profiles, consulting, media, world panel, numerator and public services
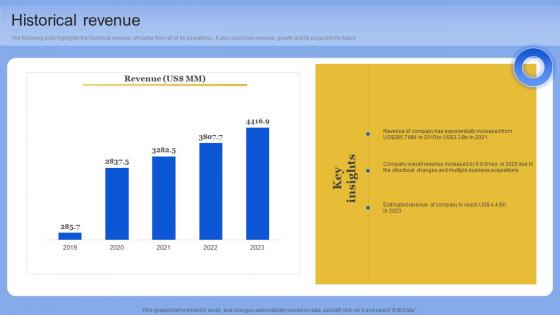
Historical Revenue Data Analytics Company Outline Information PDF
The following slide highlights the historical revenue of Kantar from all of its operations. It also describes revenue growth and its projection for future. This modern and well-arranged Historical Revenue Data Analytics Company Outline Information PDF provides lots of creative possibilities. It is very simple to customize and edit with the Powerpoint Software. Just drag and drop your pictures into the shapes. All facets of this template can be edited with Powerpoint, no extra software is necessary. Add your own material, put your images in the places assigned for them, adjust the colors, and then you can show your slides to the world, with an animated slide included. The following slide highlights the historical revenue of Kantar from all of its operations. It also describes revenue growth and its projection for future
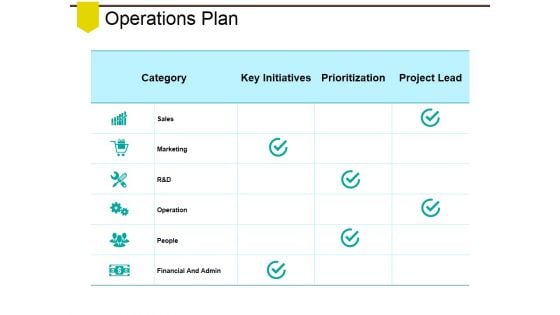
Operations Plan Ppt PowerPoint Presentation Model Samples
This is a operations plan ppt powerpoint presentation model samples. This is a three stage process. The stages in this process are sales, marketing, operation, people, financial and admin.
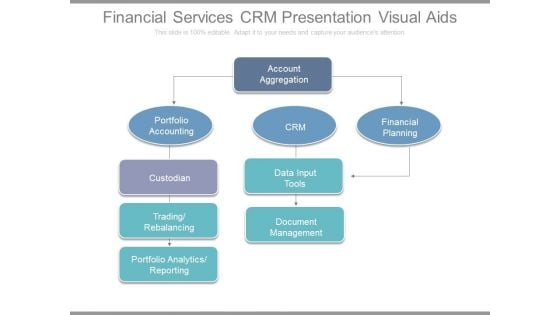
Financial Services Crm Presentation Visual Aids
This is a financial services crm presentation visual aids. This is a five stage process. The stages in this process are account aggregation, financial planning, crm, data input tools, document management, portfolio accounting, custodian, trading rebalancing, portfolio analytics reporting.
Splunk Big Data Analytics Ppt Powerpoint Presentation Complete Deck With Slides
Share a great deal of information on the topic by deploying this Splunk Big Data Analytics Ppt Powerpoint Presentation Complete Deck With Slides Support your ideas and thought process with this prefabricated set. It includes a set of fifteen slides, all fully modifiable and editable. Each slide can be restructured and induced with the information and content of your choice. You can add or remove large content boxes as well, to make this PPT slideshow more personalized. Its high-quality graphics and visuals help in presenting a well-coordinated pitch. This PPT template is also a resourceful tool to take visual cues from and implement the best ideas to help your business grow and expand. The main attraction of this well-formulated deck is that everything is editable, giving you the freedom to adjust it to your liking and choice. Changes can be made in the background and theme as well to deliver an outstanding pitch. Therefore, click on the download button now to gain full access to this multifunctional set. Our Splunk Big Data Analytics Ppt Powerpoint Presentation Complete Deck With Slides are topically designed to provide an attractive backdrop to any subject. Use them to look like a presentation pro.

Big Data Analytics In The Manufacturing Industry Ppt Powerpoint Presentation Complete Deck With Slides
If designing a presentation takes a lot of your time and resources and you are looking for a better alternative, then this Big Data Analytics In The Manufacturing Industry Ppt Powerpoint Presentation Complete Deck With Slides is the right fit for you. This is a prefabricated set that can help you deliver a great presentation on the topic. All the twenty slides included in this sample template can be used to present a birds-eye view of the topic. These slides are also fully editable, giving you enough freedom to add specific details to make this layout more suited to your business setting. Apart from the content, all other elements like color, design, theme are also replaceable and editable. This helps in designing a variety of presentations with a single layout. Not only this, you can use this PPT design in formats like PDF, PNG, and JPG once downloaded. Therefore, without any further ado, download and utilize this sample presentation as per your liking. Our Big Data Analytics In The Manufacturing Industry Ppt Powerpoint Presentation Complete Deck With Slides are topically designed to provide an attractive backdrop to any subject. Use them to look like a presentation pro.
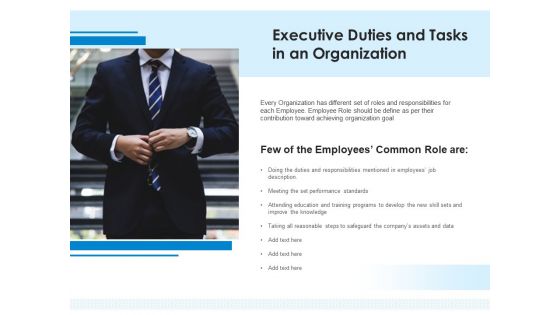
Executive Duties And Tasks In An Organization Ppt PowerPoint Presentation File Guidelines PDF
Showcasing this set of slides titled executive duties and tasks in an organization ppt powerpoint presentation file guidelines pdf. The topics addressed in these templates are performance, training, assets and data. All the content presented in this PPT design is completely editable. Download it and make adjustments in color, background, font etc. as per your unique business setting.
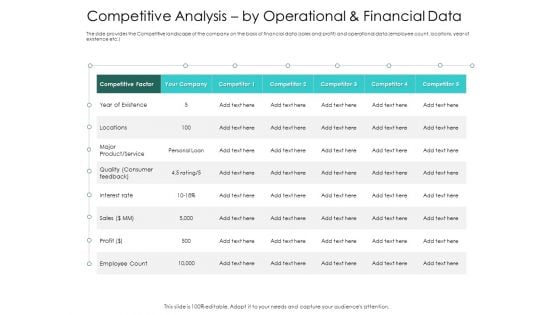
Hybrid Investment Pitch Deck Competitive Analysis By Operational And Financial Data Ppt Ideas Background Designs PDF
The slide provides the Competitive landscape of the company on the basis of financial data sales and profit and operational data employee count, locations, year of existence etc. Deliver and pitch your topic in the best possible manner with this hybrid investment pitch deck competitive analysis by operational and financial data ppt ideas background designs pdf. Use them to share invaluable insights on sales, service, existence, competitive, quality and impress your audience. This template can be altered and modified as per your expectations. So, grab it now.
Property Investment Strategies Real Estate Market Trends One Trend Per Slide Slide Ppt PowerPoint Presentation Icon Styles PDF
Deliver and pitch your topic in the best possible manner with thisproperty investment strategies real estate market trends one trend per slide slide ppt powerpoint presentation icon styles pdf. Use them to share invaluable insights on house prices keep rising deterring would be buyers, new home construction, recession, markets, francisco. and impress your audience. This template can be altered and modified as per your expectations. So, grab it now.
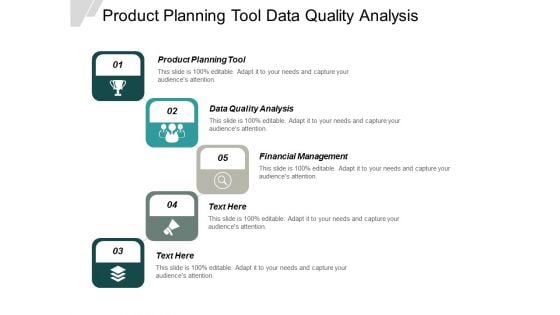
Product Planning Tool Data Quality Analysis Financial Management Ppt PowerPoint Presentation Styles Graphics Template
This is a product planning tool data quality analysis financial management ppt powerpoint presentation styles graphics template. This is a five stage process. The stages in this process are product planning tool, data quality analysis, financial management.
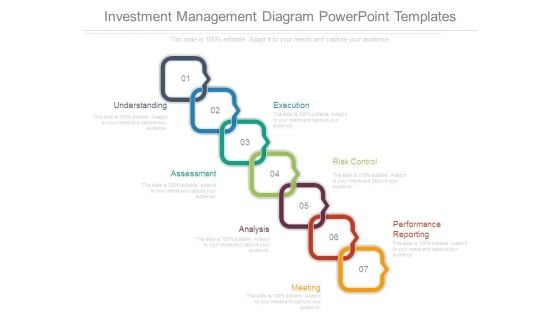
Investment Management Diagram Powerpoint Templates
This is a investment management diagram powerpoint templates. This is a seven stage process. The stages in this process are understanding, execution, risk control, performance reporting, meeting, analysis, assessment.
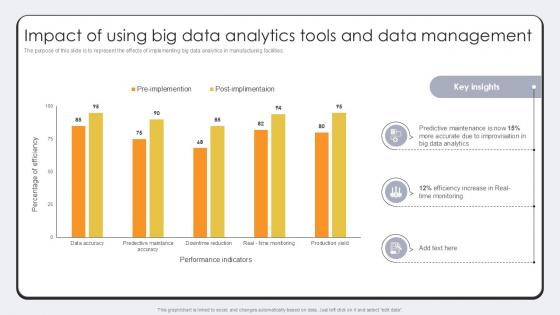
Impact Of Using Big Data Analytics Revolutionizing Production IoT Ppt Sample
The purpose of this slide is to represent the effects of implementing big data analytics in manufacturing facilities. The Impact Of Using Big Data Analytics Revolutionizing Production IoT Ppt Sample is a compilation of the most recent design trends as a series of slides. It is suitable for any subject or industry presentation, containing attractive visuals and photo spots for businesses to clearly express their messages. This template contains a variety of slides for the user to input data, such as structures to contrast two elements, bullet points, and slides for written information. Slidegeeks is prepared to create an impression. The purpose of this slide is to represent the effects of implementing big data analytics in manufacturing facilities.

Trends Mutual Fund Investing Ppt PowerPoint Presentation Model Outline Cpb Pdf
Presenting this set of slides with name trends mutual fund investing ppt powerpoint presentation model outline cpb pdf. This is an editable Powerpoint three stages graphic that deals with topics like trends mutual fund investing to help convey your message better graphically. This product is a premium product available for immediate download and is 100 percent editable in Powerpoint. Download this now and use it in your presentations to impress your audience.

Investment Fund Industry Trends Ppt PowerPoint Presentation Model Pictures Cpb Pdf
Presenting this set of slides with name investment fund industry trends ppt powerpoint presentation model pictures cpb pdf. This is an editable Powerpoint one stages graphic that deals with topics like investment fund industry trends to help convey your message better graphically. This product is a premium product available for immediate download and is 100 percent editable in Powerpoint. Download this now and use it in your presentations to impress your audience.
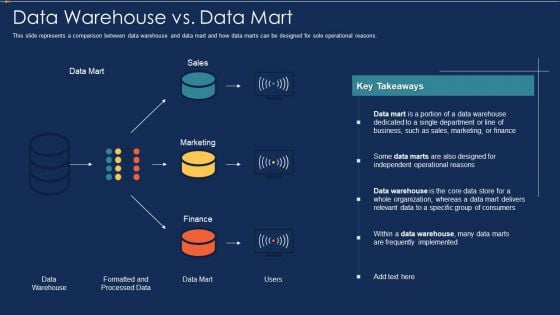
Data Warehousing IT Data Warehouse Vs Data Mart Ppt Infographic Template Background Image PDF
This slide represents a comparison between data warehouse and data mart and how data marts can be designed for sole operational reasons. Deliver an awe inspiring pitch with this creative data warehousing it data warehouse vs data mart ppt infographic template background image pdf bundle. Topics like marketing, finance, sales, formatted and processed data, data mart, data warehouse can be discussed with this completely editable template. It is available for immediate download depending on the needs and requirements of the user.
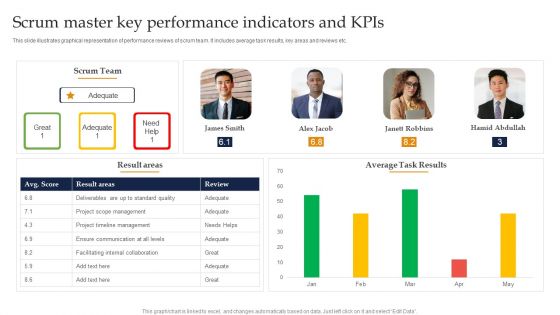
Scrum Master Key Performance Indicators And Kpis Ppt Gallery Files PDF
This slide illustrates graphical representation of performance reviews of scrum team. It includes average task results, key areas and reviews etc. Showcasing this set of slides titled Scrum Master Key Performance Indicators And Kpis Ppt Gallery Files PDF. The topics addressed in these templates are Scrum Team, Average Task Results, Project Timeline Management. All the content presented in this PPT design is completely editable. Download it and make adjustments in color, background, font etc. as per your unique business setting.
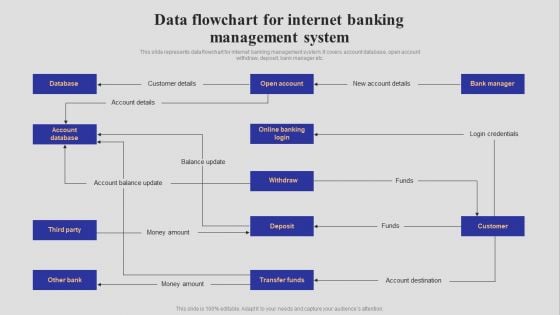
Introduction To Digital Banking Services Data Flowchart For Internet Banking Management System Guidelines PDF
This slide represents data flowchart for internet banking management system. It covers account database, open account withdraw, deposit, bank manager etc. Boost your pitch with our creative Introduction To Digital Banking Services Data Flowchart For Internet Banking Management System Guidelines PDF. Deliver an awe-inspiring pitch that will mesmerize everyone. Using these presentation templates you will surely catch everyones attention. You can browse the ppts collection on our website. We have researchers who are experts at creating the right content for the templates. So you do not have to invest time in any additional work. Just grab the template now and use them.
Human Resource Strategy For Company Employee Vector Icon Ppt PowerPoint Presentation Show Icons PDF
Persuade your audience using this human resource strategy for company employee vector icon ppt powerpoint presentation show icons pdf. This PPT design covers three stages, thus making it a great tool to use. It also caters to a variety of topics including human resource strategy for company employee vector icon. Download this PPT design now to present a convincing pitch that not only emphasizes the topic but also showcases your presentation skills.
Magnifying Glass Ppt PowerPoint Presentation Gallery Outfit
This is a magnifying glass ppt powerpoint presentation gallery outfit. This is a four stage process. The stages in this process are magnifier glass, finance, research, business.
Bank Credit Score Monitor Vector Icon Ppt PowerPoint Presentation Gallery Graphics Design PDF
Presenting bank credit score monitor vector icon ppt powerpoint presentation gallery graphics design pdf to dispense important information. This template comprises three stages. It also presents valuable insights into the topics including bank credit score monitor vector icon. This is a completely customizable PowerPoint theme that can be put to use immediately. So, download it and address the topic impactfully.
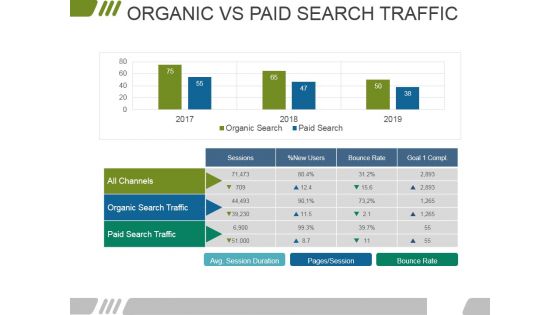
Organic Vs Paid Search Traffic Ppt PowerPoint Presentation Summary Visuals
This is a organic vs paid search traffic ppt powerpoint presentation summary visuals. This is a two stage process. The stages in this process are all channels, organic search traffic, paid search traffic, sessions, bounce rate.
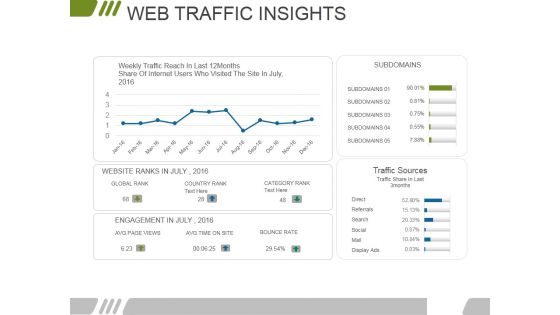
Web Traffic Insights Ppt PowerPoint Presentation Pictures Portrait
This is a web traffic insights ppt powerpoint presentation pictures portrait. This is a four stage process. The stages in this process are subdomains, traffic sources, category rank, country rank, global rank.
Website Performance Review Template 1 Ppt PowerPoint Presentation Slides Icons
This is a website performance review template 1 ppt powerpoint presentation slides icons. This is a three stage process. The stages in this process are online transaction, conversion rate, traffic source, site consumption time, organic branded.
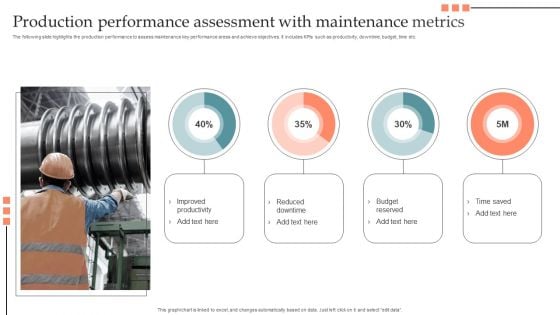
Production Performance Assessment With Maintenance Metrics Portrait PDF
The following slide highlights the production performance to assess maintenance key performance areas and achieve objectives. It includes KPIs such as productivity, downtime, budget, time etc. Showcasing this set of slides titled Production Performance Assessment With Maintenance Metrics Portrait PDF. The topics addressed in these templates are Improved Productivity, Reduced Downtime, Budget Reserved, Time Saved. All the content presented in this PPT design is completely editable. Download it and make adjustments in color, background, font etc. as per your unique business setting.
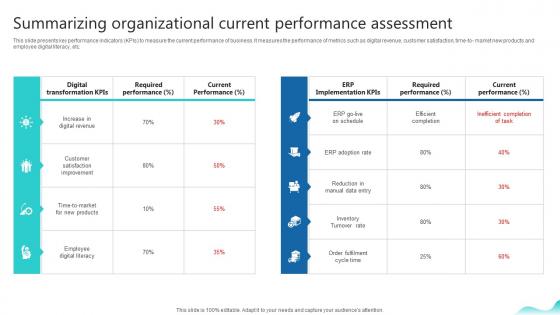
Summarizing Organizational Current Performance Erp And Digital Transformation For Maximizing DT SS V
This slide presents key performance indicators KPIs to measure the current performance of business. It measures the performance of metrics such as digital revenue, customer satisfaction, time-to- market new products and employee digital literacy, etc. Boost your pitch with our creative Summarizing Organizational Current Performance Erp And Digital Transformation For Maximizing DT SS V. Deliver an awe-inspiring pitch that will mesmerize everyone. Using these presentation templates you will surely catch everyones attention. You can browse the ppts collection on our website. We have researchers who are experts at creating the right content for the templates. So you do not have to invest time in any additional work. Just grab the template now and use them. This slide presents key performance indicators KPIs to measure the current performance of business. It measures the performance of metrics such as digital revenue, customer satisfaction, time-to- market new products and employee digital literacy, etc.
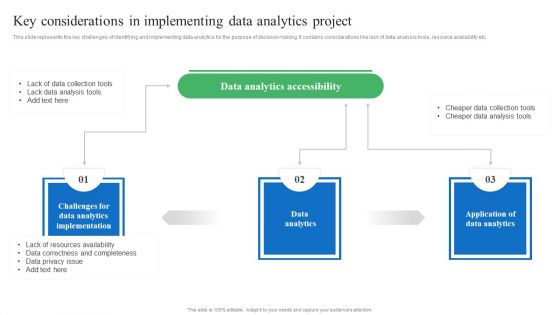
Toolkit For Data Science And Analytics Transition Key Considerations In Implementing Data Analytics Project Download PDF
This slide represents the key challenges of identifying and implementing data analytics for the purpose of decision making. It contains considerations like lack of data analysis tools, resource availability etc. From laying roadmaps to briefing everything in detail, our templates are perfect for you. You can set the stage with your presentation slides. All you have to do is download these easy to edit and customizable templates. Toolkit For Data Science And Analytics Transition Key Considerations In Implementing Data Analytics Project Download PDF will help you deliver an outstanding performance that everyone would remember and praise you for. Do download this presentation today.
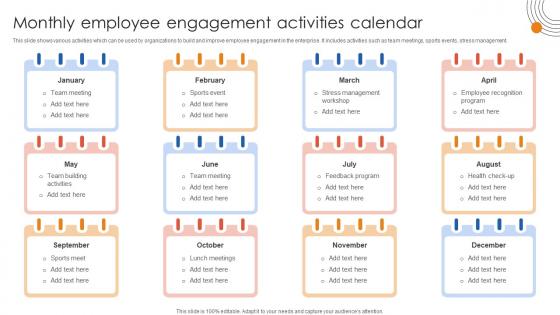
Human Resource Industrial Relationship Monthly Employee Engagement Activities Calendar
This slide shows various activities which can be used by organizations to build and improve employee engagement in the enterprise. It includes activities such as team meetings, sports events, stress management. The Human Resource Industrial Relationship Monthly Employee Engagement Activities Calendar is a compilation of the most recent design trends as a series of slides. It is suitable for any subject or industry presentation, containing attractive visuals and photo spots for businesses to clearly express their messages. This template contains a variety of slides for the user to input data, such as structures to contrast two elements, bullet points, and slides for written information. Slidegeeks is prepared to create an impression. This slide shows various activities which can be used by organizations to build and improve employee engagement in the enterprise. It includes activities such as team meetings, sports events, stress management.
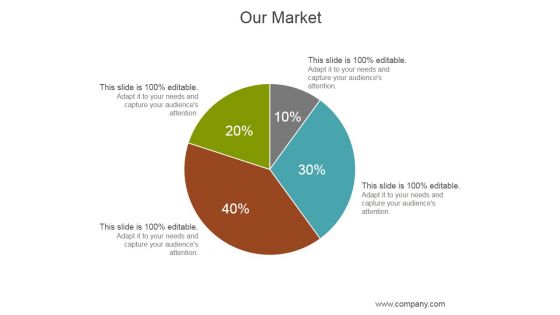
Our Market Ppt PowerPoint Presentation Deck
This is a our market ppt powerpoint presentation deck. This is a four stage process. The stages in this process are business, marketing, management, finance, analysis.
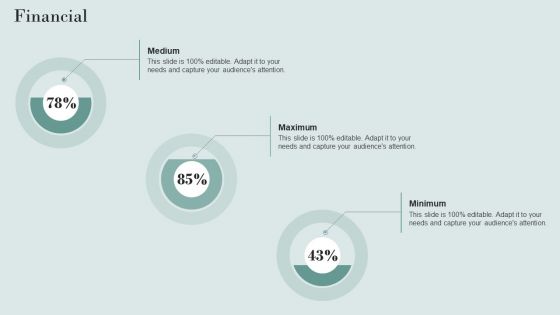
Data Structure IT Financial Clipart PDF
If your project calls for a presentation, then Slidegeeks is your go-to partner because we have professionally designed, easy-to-edit templates that are perfect for any presentation. After downloading, you can easily edit Data Structure IT Financial Clipart PDF and make the changes accordingly. You can rearrange slides or fill them with different images. Check out all the handy templates
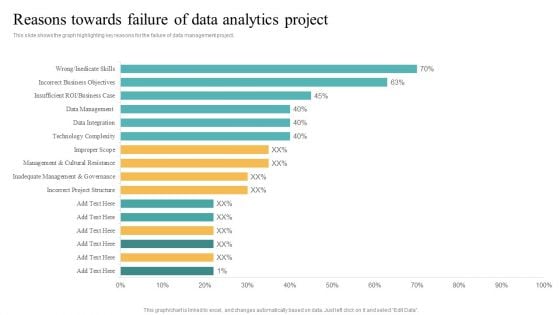
Transformation Toolkit Competitive Intelligence Information Analysis Reasons Towards Failure Of Data Analytics Project Introduction PDF
This slide shows the graph highlighting key reasons for the failure of data management project. Find highly impressive Transformation Toolkit Competitive Intelligence Information Analysis Reasons Towards Failure Of Data Analytics Project Introduction PDF on Slidegeeks to deliver a meaningful presentation. You can save an ample amount of time using these presentation templates. No need to worry to prepare everything from scratch because Slidegeeks experts have already done a huge research and work for you. You need to download Transformation Toolkit Competitive Intelligence Information Analysis Reasons Towards Failure Of Data Analytics Project Introduction PDF for your upcoming presentation. All the presentation templates are 100 percent editable and you can change the color and personalize the content accordingly. Download now.
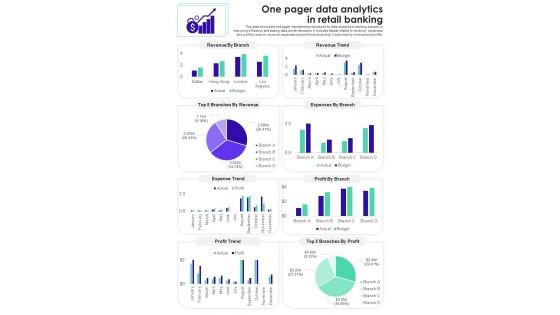
One Pager Data Analytics In Retail Banking PDF Document PPT Template
Heres a predesigned One Pager Data Analytics In Retail Banking PDF Document PPT Template for you. Built on extensive research and analysis, this one-pager template has all the centerpieces of your specific requirements. This temple exudes brilliance and professionalism. Being completely editable, you can make changes to suit your purpose. Get this One Pager Data Analytics In Retail Banking PDF Document PPT Template Download now.
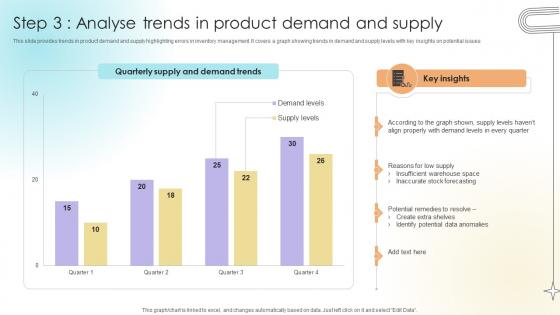
Step 3 Analyse Trends In Product Demand And Supply Data Analytics SS V
This slide provides trends in product demand and supply highlighting errors in inventory management. It covers a graph showing trends in demand and supply levels with key insights on potential issues.Formulating a presentation can take up a lot of effort and time, so the content and message should always be the primary focus. The visuals of the PowerPoint can enhance the presenters message, so our Step 3 Analyse Trends In Product Demand And Supply Data Analytics SS V was created to help save time. Instead of worrying about the design, the presenter can concentrate on the message while our designers work on creating the ideal templates for whatever situation is needed. Slidegeeks has experts for everything from amazing designs to valuable content, we have put everything into Step 3 Analyse Trends In Product Demand And Supply Data Analytics SS V. This slide provides trends in product demand and supply highlighting errors in inventory management. It covers a graph showing trends in demand and supply levels with key insights on potential issues.
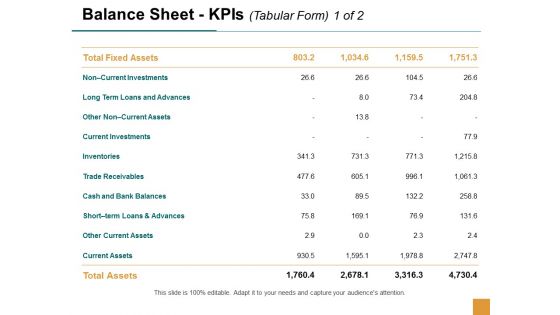
Balance Sheet Kpis Current Investments Ppt Powerpoint Presentation Professional Deck
This is a balance sheet kpis current investments ppt powerpoint presentation professional deck. This is a four stage process. The stages in this process are business, management, planning, strategy, marketing.
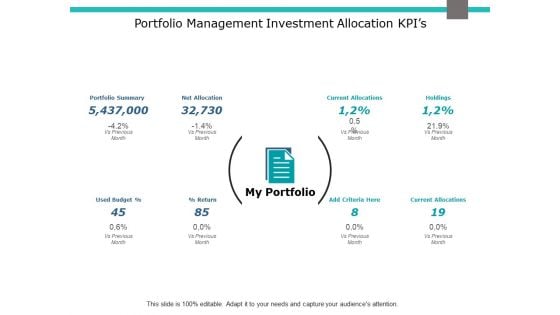
Portfolio Management Investment Allocation Kpis Ppt PowerPoint Presentation Gallery Slide
This is a portfolio management investment allocation kpis ppt powerpoint presentation gallery slide. This is a eight stage process. The stages in this process are business, management, marketing, agenda.
Portfolio Management Investment Allocation Kpis Ppt PowerPoint Presentation Icon Show
This is a portfolio management investment allocation kpis ppt powerpoint presentation icon show. The topics discussed in this diagram are management, marketing, business, strategy, planning. This is a completely editable PowerPoint presentation, and is available for immediate download.
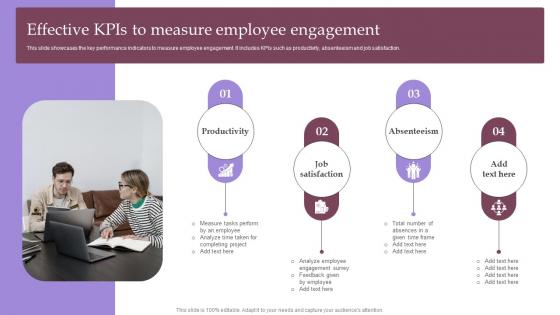
Employee Involvement Tactics Effective KPIs To Measure Employee Engagement Mockup Pdf
This slide showcases the key performance indicators to measure employee engagement. It includes KPIs such as productivity, absenteeism and job satisfaction. Boost your pitch with our creative Employee Involvement Tactics Effective KPIs To Measure Employee Engagement Mockup Pdf. Deliver an awe-inspiring pitch that will mesmerize everyone. Using these presentation templates you will surely catch everyones attention. You can browse the ppts collection on our website. We have researchers who are experts at creating the right content for the templates. So you do not have to invest time in any additional work. Just grab the template now and use them. This slide showcases the key performance indicators to measure employee engagement. It includes KPIs such as productivity, absenteeism and job satisfaction.


 Continue with Email

 Home
Home


