Cost Icon

Employee Training And Development Strategy 70 2010 Rule For Leadership Development Diagrams PDF
The slide showcases 70 20 10 rule which focuses on daily learning along with processional training program. Key focus area of this rule is to make employees learn through peers, social group, daily challenging tasks, etc. Presenting this PowerPoint presentation, titled Employee Training And Development Strategy 70 2010 Rule For Leadership Development Diagrams PDF, with topics curated by our researchers after extensive research. This editable presentation is available for immediate download and provides attractive features when used. Download now and captivate your audience. Presenting this Employee Training And Development Strategy 70 2010 Rule For Leadership Development Diagrams PDF. Our researchers have carefully researched and created these slides with all aspects taken into consideration. This is a completely customizable Employee Training And Development Strategy 70 2010 Rule For Leadership Development Diagrams PDF that is available for immediate downloading. Download now and make an impact on your audience. Highlight the attractive features available with our PPTs.
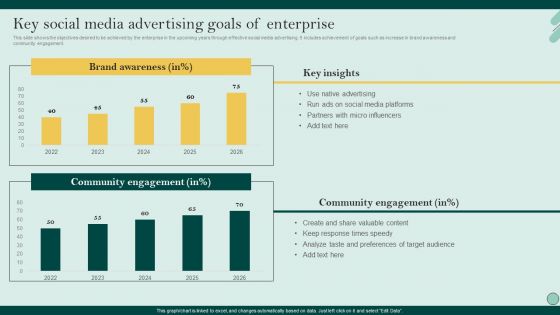
Social Networks Marketing To Improve Key Social Media Advertising Goals Of Enterprise Diagrams PDF
This slide shows the objectives desired to be achieved by the enterprise in the upcoming years through effective social media advertising. It includes achievement of goals such as increase in brand awareness and community engagement. Presenting this PowerPoint presentation, titled Social Networks Marketing To Improve Key Social Media Advertising Goals Of Enterprise Diagrams PDF, with topics curated by our researchers after extensive research. This editable presentation is available for immediate download and provides attractive features when used. Download now and captivate your audience. Presenting this Social Networks Marketing To Improve Key Social Media Advertising Goals Of Enterprise Diagrams PDF. Our researchers have carefully researched and created these slides with all aspects taken into consideration. This is a completely customizable Social Networks Marketing To Improve Key Social Media Advertising Goals Of Enterprise Diagrams PDF that is available for immediate downloading. Download now and make an impact on your audience. Highlight the attractive features available with our PPTs.
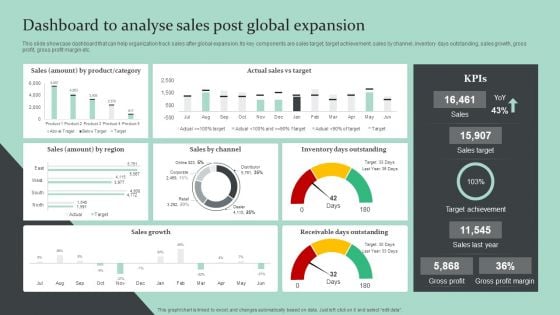
Strategic Global Expansion Business Plan Dashboard To Analyse Sales Post Global Expansion Diagrams PDF
This slide showcase dashboard that can help organization track sales after global expansion. Its key components are sales target, target achievement, sales by channel, inventory days outstanding, sales growth, gross profit, gross profit margin etc. Presenting this PowerPoint presentation, titled Strategic Global Expansion Business Plan Dashboard To Analyse Sales Post Global Expansion Diagrams PDF, with topics curated by our researchers after extensive research. This editable presentation is available for immediate download and provides attractive features when used. Download now and captivate your audience. Presenting this Strategic Global Expansion Business Plan Dashboard To Analyse Sales Post Global Expansion Diagrams PDF. Our researchers have carefully researched and created these slides with all aspects taken into consideration. This is a completely customizable Strategic Global Expansion Business Plan Dashboard To Analyse Sales Post Global Expansion Diagrams PDF that is available for immediate downloading. Download now and make an impact on your audience. Highlight the attractive features available with our PPTs.
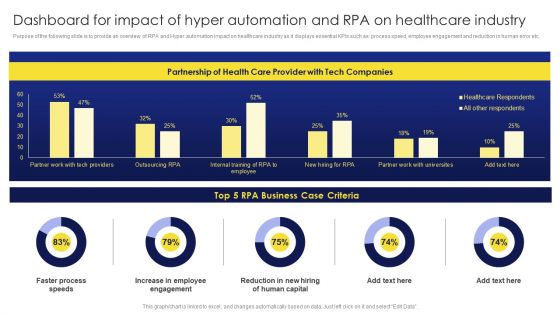
Dashboard For Impact Of Hyper Automation And RPA On Healthcare Industry Diagrams PDF
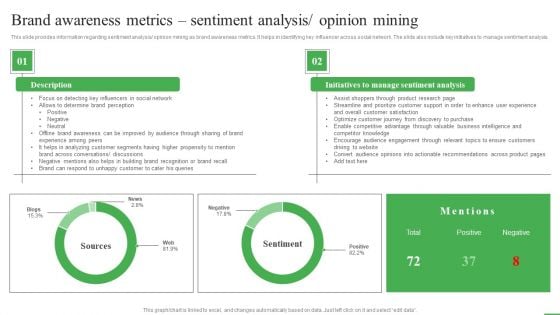
How To Boost Brand Recognition Brand Awareness Metrics Sentiment Analysis Diagrams PDF
This slide provides information regarding sentiment analysis or opinion mining as brand awareness metrics. It helps in identifying key influencer across social network. The slide also include key initiatives to manage sentiment analysis. Presenting this PowerPoint presentation, titled How To Boost Brand Recognition Brand Awareness Metrics Sentiment Analysis Diagrams PDF, with topics curated by our researchers after extensive research. This editable presentation is available for immediate download and provides attractive features when used. Download now and captivate your audience. Presenting this How To Boost Brand Recognition Brand Awareness Metrics Sentiment Analysis Diagrams PDF. Our researchers have carefully researched and created these slides with all aspects taken into consideration. This is a completely customizable How To Boost Brand Recognition Brand Awareness Metrics Sentiment Analysis Diagrams PDF that is available for immediate downloading. Download now and make an impact on your audience. Highlight the attractive features available with our PPTs.
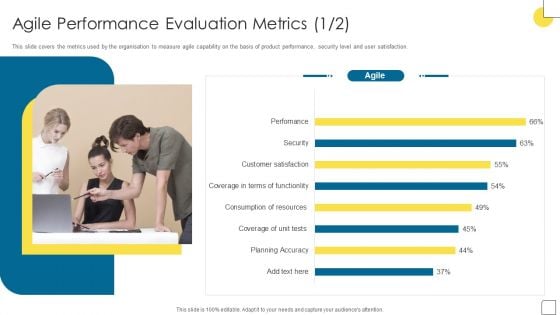
Agile Software Programming Module For IT Agile Performance Evaluation Metrics Diagrams PDF
This slide covers the metrics used by the organisation to measure agile capability on the basis of product performance, security level and user satisfaction. Presenting this PowerPoint presentation, titled Agile Software Programming Module For IT Agile Performance Evaluation Metrics Diagrams PDF, with topics curated by our researchers after extensive research. This editable presentation is available for immediate download and provides attractive features when used. Download now and captivate your audience. Presenting this Agile Software Programming Module For IT Agile Performance Evaluation Metrics Diagrams PDF. Our researchers have carefully researched and created these slides with all aspects taken into consideration. This is a completely customizable Agile Software Programming Module For IT Agile Performance Evaluation Metrics Diagrams PDF that is available for immediate downloading. Download now and make an impact on your audience. Highlight the attractive features available with our PPTs.
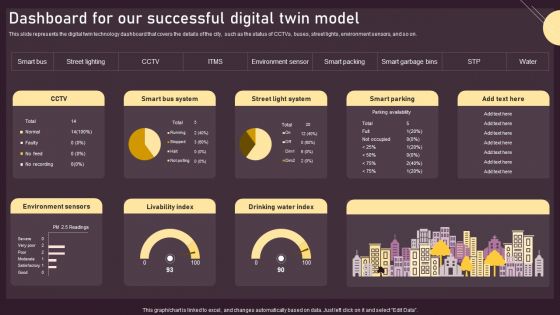
Dashboard For Our Successful Digital Twin Model Ppt PowerPoint Presentation Diagram Templates PDF
This slide represents the digital twin technology dashboard that covers the details of the city, such as the status of CCTVs, buses, street lights, environment sensors, and so on. Presenting this PowerPoint presentation, titled Dashboard For Our Successful Digital Twin Model Ppt PowerPoint Presentation Diagram Templates PDF, with topics curated by our researchers after extensive research. This editable presentation is available for immediate download and provides attractive features when used. Download now and captivate your audience. Presenting this Dashboard For Our Successful Digital Twin Model Ppt PowerPoint Presentation Diagram Templates PDF. Our researchers have carefully researched and created these slides with all aspects taken into consideration. This is a completely customizable Dashboard For Our Successful Digital Twin Model Ppt PowerPoint Presentation Diagram Templates PDF that is available for immediate downloading. Download now and make an impact on your audience. Highlight the attractive features available with our PPTs.
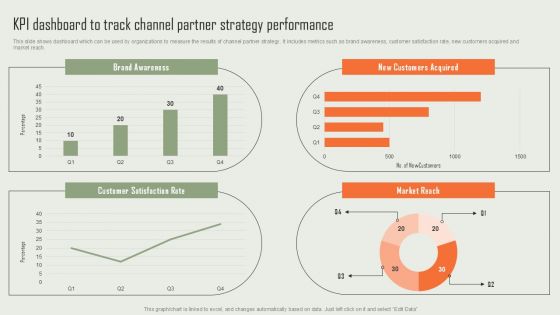
Product Marketing And Sales Expansion Through Channel KPI Dashboard To Track Channel Partner Strategy Diagrams PDF
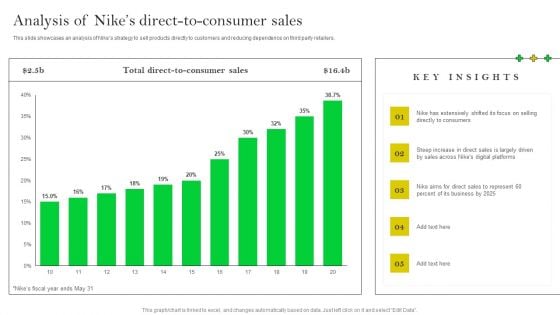
How Nike Developed And Executed Strategic Promotion Techniques Analysis Of Nikes Direct Diagrams PDF
This slide showcases an analysis of Nikes strategy to sell products directly to customers and reducing dependence on third party retailers. Presenting this PowerPoint presentation, titled How Nike Developed And Executed Strategic Promotion Techniques Analysis Of Nikes Direct Diagrams PDF, with topics curated by our researchers after extensive research. This editable presentation is available for immediate download and provides attractive features when used. Download now and captivate your audience. Presenting this How Nike Developed And Executed Strategic Promotion Techniques Analysis Of Nikes Direct Diagrams PDF. Our researchers have carefully researched and created these slides with all aspects taken into consideration. This is a completely customizable How Nike Developed And Executed Strategic Promotion Techniques Analysis Of Nikes Direct Diagrams PDF that is available for immediate downloading. Download now and make an impact on your audience. Highlight the attractive features available with our PPTs.
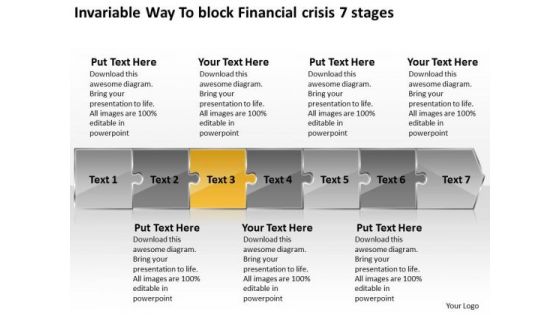
Invariable Way To Block Financial Crisis 7 Stages Making Flowchart PowerPoint Templates
We present our invariable way to block financial crisis 7 stages making flowchart PowerPoint templates.Use our Arrows PowerPoint Templates because,They are the indicators of the path you have in mind. Use our Marketing PowerPoint Templates because,Like your thoughts arrows are inherently precise and true. Use our Process and Flows PowerPoint Templates because, You know what it takes to keep it fit and healthy. Use our Finance PowerPoint Templates because,our Templates will enthuse your colleagues. Use our Business PowerPoint Templates because, Your product has established a foothold in the market. Customers are happy with the value it brings to their livesUse these PowerPoint slides for presentations relating to Abstract, Arrow, Arrows, Business, Chart, Design, Development, Diagram, Direction, Element, Flow, Flowchart, Graph, Linear, Management, Model, Motion, Organization, Plan, Process, Program, Section, Segment, Set, Sign, Solution, Strategy, Symbol, Technology. The prominent colors used in the PowerPoint template are Yellow, Gray, Black There is nothing far fetched about our Invariable Way To Block Financial Crisis 7 Stages Making Flowchart PowerPoint Templates. Every aspect is correct and achievable.
Pie Chart Showing Current Business Performance Optimization New Operations Strategy Portrait Pdf
Here you can discover an assortment of the finest PowerPoint and Google Slides templates. With these templates, you can create presentations for a variety of purposes while simultaneously providing your audience with an eye catching visual experience. Download Pie Chart Showing Current Business Performance Optimization New Operations Strategy Portrait Pdf to deliver an impeccable presentation. These templates will make your job of preparing presentations much quicker, yet still, maintain a high level of quality. Slidegeeks has experienced researchers who prepare these templates and write high quality content for you. Later on, you can personalize the content by editing the Pie Chart Showing Current Business Performance Optimization New Operations Strategy Portrait Pdf. Our Pie Chart Showing Current Business Performance Optimization New Operations Strategy Portrait Pdf are topically designed to provide an attractive backdrop to any subject. Use them to look like a presentation pro.
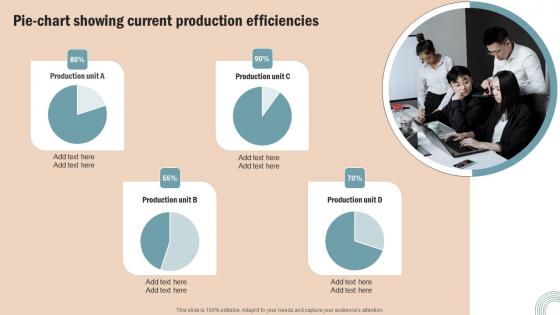
Pie Chart Showing Current Operations Strategy Improve Business Productivity Clipart Pdf
Here you can discover an assortment of the finest PowerPoint and Google Slides templates. With these templates, you can create presentations for a variety of purposes while simultaneously providing your audience with an eye catching visual experience. Download Pie Chart Showing Current Operations Strategy Improve Business Productivity Clipart Pdf to deliver an impeccable presentation. These templates will make your job of preparing presentations much quicker, yet still, maintain a high level of quality. Slidegeeks has experienced researchers who prepare these templates and write high quality content for you. Later on, you can personalize the content by editing the Pie Chart Showing Current Operations Strategy Improve Business Productivity Clipart Pdf. Our Pie Chart Showing Current Operations Strategy Improve Business Productivity Clipart Pdf are topically designed to provide an attractive backdrop to any subject. Use them to look like a presentation pro.
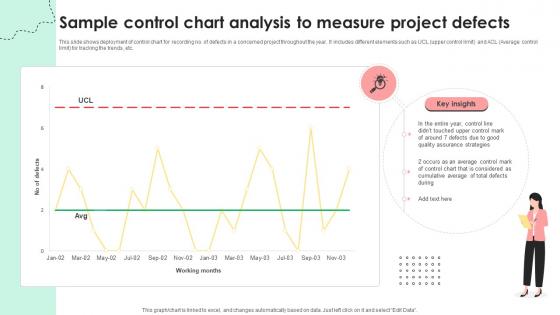
Administering Quality Assurance Sample Control Chart Analysis To Measure Project Defects PM SS V
This slide shows deployment of control chart for recording no. of defects in a concerned project throughout the year. It includes different elements such as UCL upper control limit and ACL Average control limit for tracking the trends, etc. From laying roadmaps to briefing everything in detail, our templates are perfect for you. You can set the stage with your presentation slides. All you have to do is download these easy-to-edit and customizable templates. Administering Quality Assurance Sample Control Chart Analysis To Measure Project Defects PM SS V will help you deliver an outstanding performance that everyone would remember and praise you for. Do download this presentation today. This slide shows deployment of control chart for recording no. of defects in a concerned project throughout the year. It includes different elements such as UCL upper control limit and ACL Average control limit for tracking the trends, etc.

Predicted Benefits Achieve From Implementing Chatbot On Ecommerce Website Diagrams PDF
This slide shows the key benefits achieve by the company after implementing chatbot on companys website. Do you have an important presentation coming up Are you looking for something that will make your presentation stand out from the rest Look no further than Predicted Benefits Achieve From Implementing Chatbot On Ecommerce Website Diagrams PDF. With our professional designs, you can trust that your presentation will pop and make delivering it a smooth process. And with Slidegeeks, you can trust that your presentation will be unique and memorable. So why wait Grab Predicted Benefits Achieve From Implementing Chatbot On Ecommerce Website Diagrams PDF today and make your presentation stand out from the rest.

Marketing Plan To Sustain Competitive Advantage With Focus Strategy Diagrams PDF
Get a simple yet stunning designed Marketing Plan To Sustain Competitive Advantage With Focus Strategy Diagrams PDF. It is the best one to establish the tone in your meetings. It is an excellent way to make your presentations highly effective. So, download this PPT today from Slidegeeks and see the positive impacts. Our easy-to-edit Marketing Plan To Sustain Competitive Advantage With Focus Strategy Diagrams PDF can be your go-to option for all upcoming conferences and meetings. So, what are you waiting for Grab this template today.
Brand Identity Management Toolkit Overall Brand Performance Tracking Dashboard Diagrams PDF
This slide provides information regarding brand performance tracking dashboard capturing KPIs such as brand metric, brand commitment, advertising metrics, and purchase metrics. Create an editable Brand Identity Management Toolkit Overall Brand Performance Tracking Dashboard Diagrams PDF that communicates your idea and engages your audience. Whether youre presenting a business or an educational presentation, pre-designed presentation templates help save time. Brand Identity Management Toolkit Overall Brand Performance Tracking Dashboard Diagrams PDF is highly customizable and very easy to edit, covering many different styles from creative to business presentations. Slidegeeks has creative team members who have crafted amazing templates. So, go and get them without any delay.
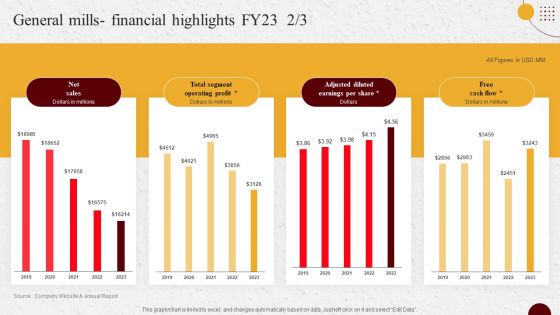
Industry Report Of Packaged Food Products Part 2 General Mills Financial Highlights Fy23 Diagrams PDF
Do you have to make sure that everyone on your team knows about any specific topic I yes, then you should give Industry Report Of Packaged Food Products Part 2 General Mills Financial Highlights Fy23 Diagrams PDF a try. Our experts have put a lot of knowledge and effort into creating this impeccable Industry Report Of Packaged Food Products Part 2 General Mills Financial Highlights Fy23 Diagrams PDF. You can use this template for your upcoming presentations, as the slides are perfect to represent even the tiniest detail. You can download these templates from the Slidegeeks website and these are easy to edit. So grab these today.
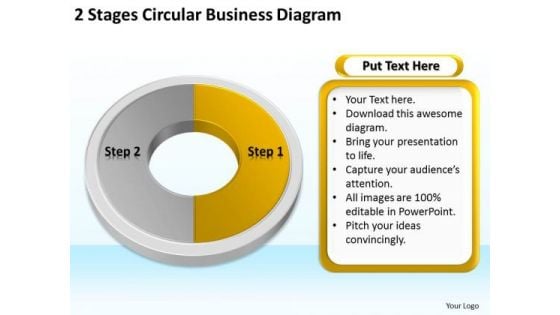
World Business PowerPoint Templates Diagram Continuity Plan
We present our world business powerpoint templates diagram continuity plan.Download our Business PowerPoint Templates because It will Give impetus to the hopes of your colleagues. Our PowerPoint Templates and Slides will aid you in winning their trust. Download and present our Process and Flows PowerPoint Templates because Our PowerPoint Templates and Slides will give good value for money. They also have respect for the value of your time. Download our Shapes PowerPoint Templates because Our PowerPoint Templates and Slides are effectively colour coded to prioritise your plans They automatically highlight the sequence of events you desire. Download and present our Circle Charts PowerPoint Templates because Our PowerPoint Templates and Slides will let you Hit the target. Go the full distance with ease and elan. Present our Flow Charts PowerPoint Templates because Our PowerPoint Templates and Slides will provide weight to your words. They will bring out the depth of your thought process.Use these PowerPoint slides for presentations relating to Website, speech, form, special, corporate, order, business, concept, vector, bright, template, circle, match, usable, graphic, process,element, different, idea, shape, abstract, cycle, creative, illustration, piece, connection, chart, strategy, place, frame, web, solution, design, group, blue, text, empty, banner, access, part, background, conceptual . The prominent colors used in the PowerPoint template are Orange, Gray, White. They say appropriate facial expressions aid communication. Our World Business PowerPoint Templates Diagram Continuity Plan can be effective too.
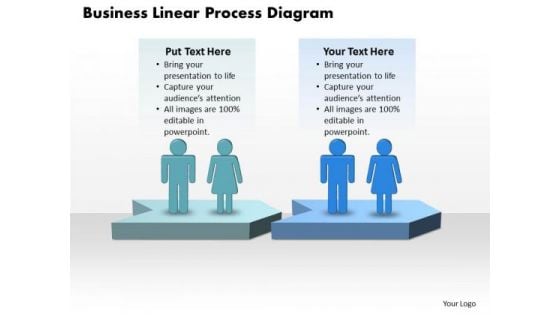
Sales Ppt Theme Concept Free Download Linear Process Diagram 1 Graphic
We present our sales PPT Theme concept free download linear process diagram 1 Graphic. Use our People PowerPoint Templates because; Get them in the desired sequence into the bracket. Use our Arrows PowerPoint Templates because, now you need to get it all together to form the complete picture and reach the goal. Use our Communication PowerPoint Templates because, Show how one can contribute to the overall feeling of well being. Use our Teamwork PowerPoint Templates because, you have it all down to a nicety, slice by slice, layer by layer. Use our Marketing PowerPoint Templates because, Pin-point the manner and processes for them to follow in order to interconnect with each other. Use these PowerPoint slides forpresentations relating to Business,chart, Continue growing with our Sales Ppt Theme Concept Free Download Linear Process Diagram 1 Graphic. Download without worries with our money back guaranteee.
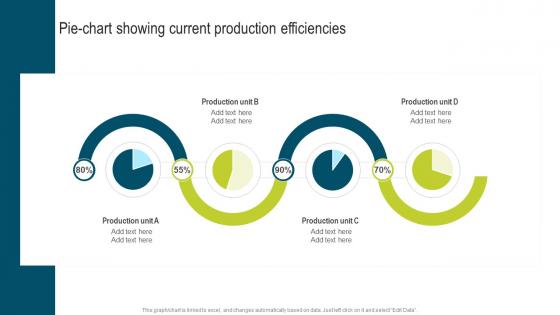
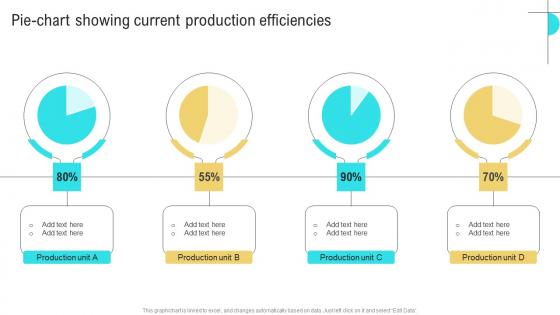
Pie Chart Showing Current Production Developing Extensive Plan For Operational Guidelines Pdf
Take your projects to the next level with our ultimate collection of Pie Chart Showing Current Production Developing Extensive Plan For Operational Guidelines Pdf. Slidegeeks has designed a range of layouts that are perfect for representing task or activity duration, keeping track of all your deadlines at a glance. Tailor these designs to your exact needs and give them a truly corporate look with your own brand colors they well make your projects stand out from the rest. Our Pie Chart Showing Current Production Developing Extensive Plan For Operational Guidelines Pdf are topically designed to provide an attractive backdrop to any subject. Use them to look like a presentation pro.
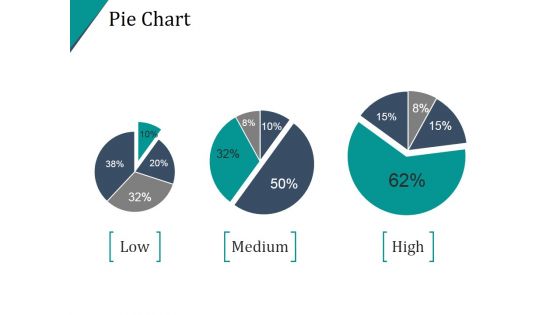
Pie Chart Template Ppt PowerPoint Presentation Example 2015
This is a pie chart template ppt powerpoint presentation example 2015. This is a four stage process. The stages in this process are pie, division, percentage, finance, analysis.

Combo Chart Template 1 Ppt PowerPoint Presentation Inspiration
This is a combo chart template 1 ppt powerpoint presentation inspiration. This is a four stage process. The stages in this process are business, marketing, growth, product, finance.
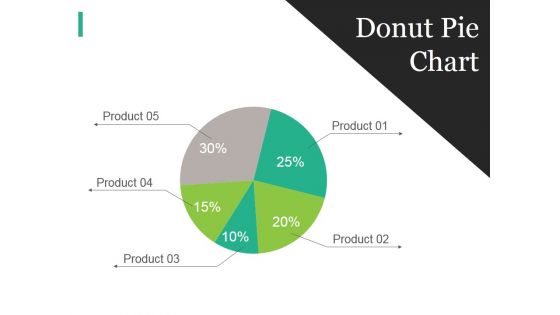
Donut Pie Chart Ppt PowerPoint Presentation Designs Download
This is a donut pie chart ppt powerpoint presentation designs download. This is a five stage process. The stages in this process are business, strategy, marketing, analysis, finance.
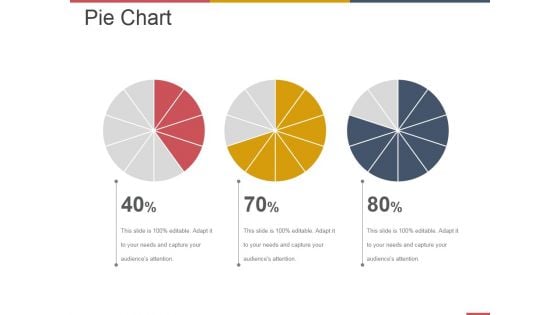
Pie Chart Ppt PowerPoint Presentation Professional Example File
This is a pie chart ppt powerpoint presentation professional example file. This is a three stage process. The stages in this process are business, strategy, marketing, analysis, finance.
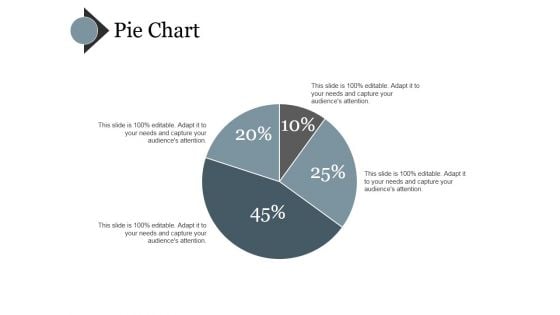
Pie Chart Ppt PowerPoint Presentation Pictures File Formats
This is a pie chart ppt powerpoint presentation pictures file formats. This is a four stage process. The stages in this process are finance, pie, business, marketing, strategy.
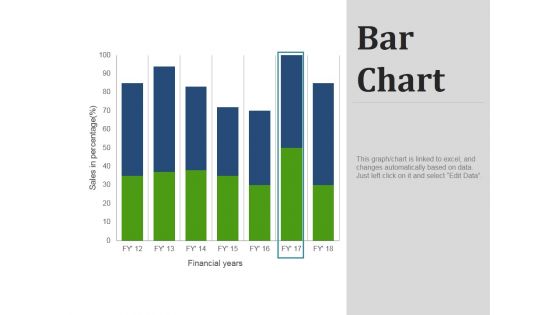
Bar Chart Ppt PowerPoint Presentation Visual Aids Files
This is a bar chart ppt powerpoint presentation visual aids files. This is a seven stage process. The stages in this process are bar, graph, finance, business, marketing.
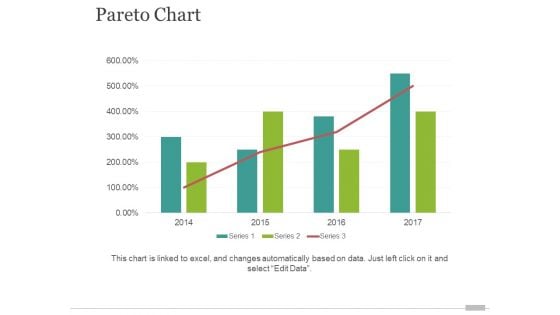
Pareto Chart Ppt PowerPoint Presentation File Design Ideas
This is a pareto chart ppt powerpoint presentation file design ideas. This is a four stage process. The stages in this process are finance, analysis, business, strategy, marketing.
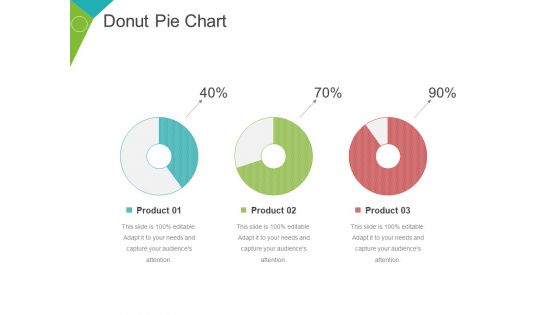
Donut Pie Chart Ppt PowerPoint Presentation Inspiration Guidelines
This is a donut pie chart ppt powerpoint presentation inspiration guidelines. This is a three stage process. The stages in this process are finance, percentage, business, marketing, management.
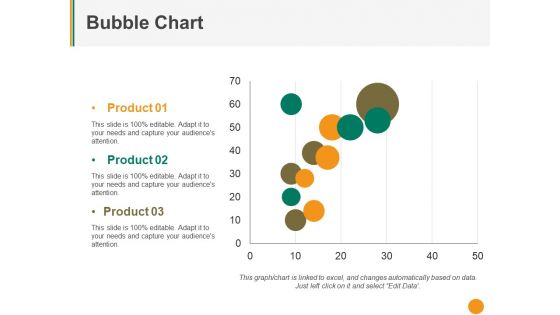
Bubble Chart Ppt PowerPoint Presentation Pictures Slide Download
This is a bubble chart ppt powerpoint presentation pictures slide download. This is a three stage process. The stages in this process are product, business, graph, finance.
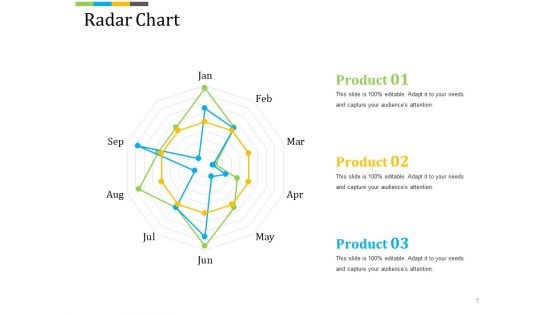
Radar Chart Ppt PowerPoint Presentation Summary Master Slide
This is a radar chart ppt powerpoint presentation summary master slide. This is a three stage process. The stages in this process are product, business, marketing, finance.
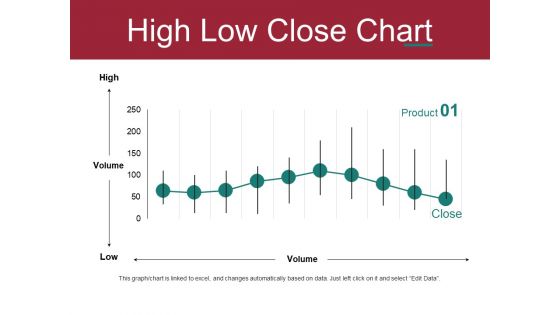
High Low Close Chart Ppt PowerPoint Presentation Deck
This is a high low close chart ppt powerpoint presentation deck. This is a one stage process. The stages in this process are high, volume, low, business, finance.
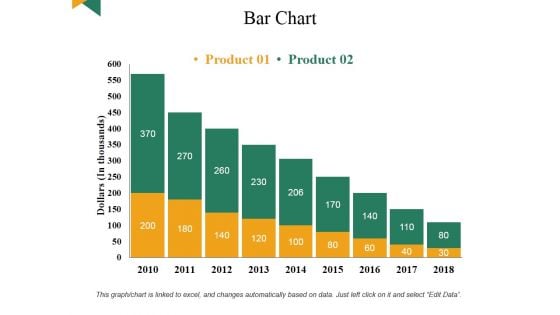
Bar Chart Ppt PowerPoint Presentation Infographic Template Portfolio
This is a bar chart ppt powerpoint presentation infographic template portfolio. This is a two stage process. The stages in this process are bar, strategy, finance, marketing, planning.
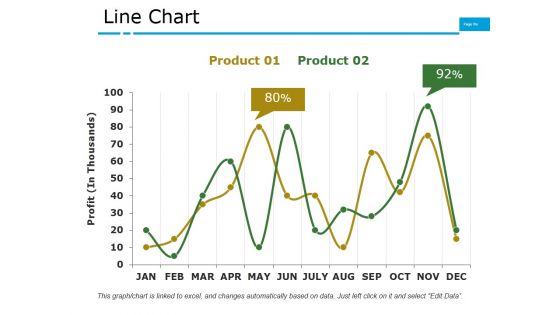
Line Chart Ppt PowerPoint Presentation File Graphics Pictures
This is a line chart ppt powerpoint presentation file graphics pictures. This is a two stage process. The stages in this process are business, marketing, finance, graph, growth.
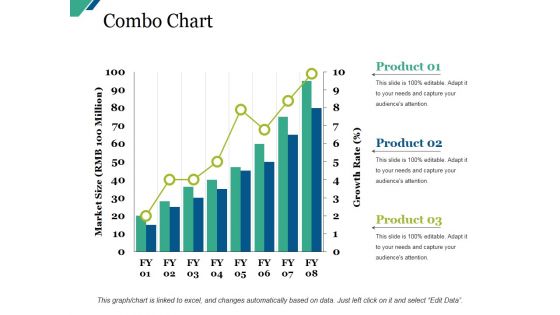
Combo Chart Ppt PowerPoint Presentation Visual Aids Outline
This is a combo chart ppt powerpoint presentation visual aids outline. This is a three stage process. The stages in this process are business, marketing, strategy, finance, growth.
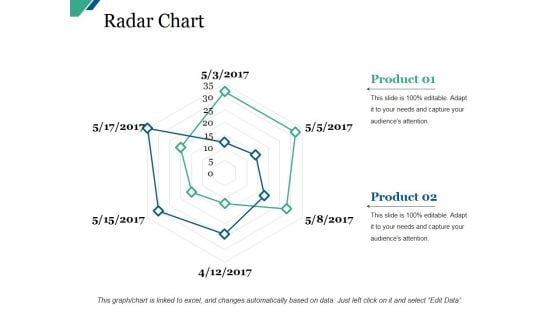
Radar Chart Ppt PowerPoint Presentation Styles Layout Ideas
This is a radar chart ppt powerpoint presentation styles layout ideas. This is a two stage process. The stages in this process are business, marketing, graph, finance, analysis.
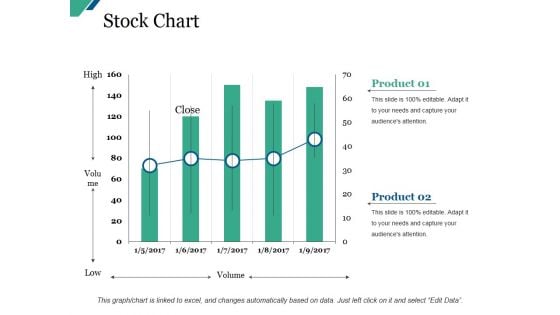
Stock Chart Ppt PowerPoint Presentation Inspiration Background Image
This is a stock chart ppt powerpoint presentation inspiration background image. This is a five stage process. The stages in this process are business, marketing, graph, finance, analysis.

Donut Pie Chart Ppt PowerPoint Presentation Professional Microsoft
This is a donut pie chart ppt powerpoint presentation professional microsoft. This is a five stage process. The stages in this process are donut, marketing, strategy, finance, planning.
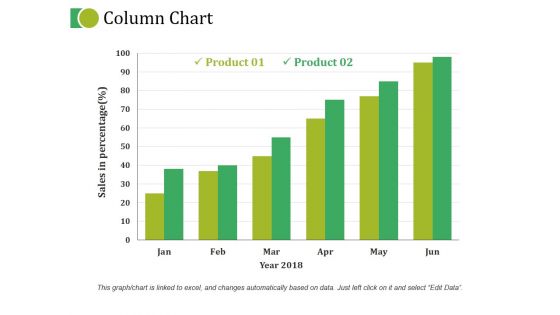
Column Chart Ppt PowerPoint Presentation Gallery File Formats
This is a column chart ppt powerpoint presentation gallery file formats. This is a six stage process. The stages in this process are growth, marketing, strategy, planning, finance.
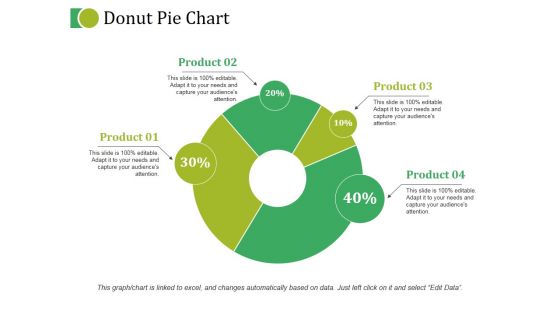
Donut Pie Chart Ppt PowerPoint Presentation Outline Layouts
This is a donut pie chart ppt powerpoint presentation outline layouts. This is a four stage process. The stages in this process are business, marketing, strategy, planning, finance.
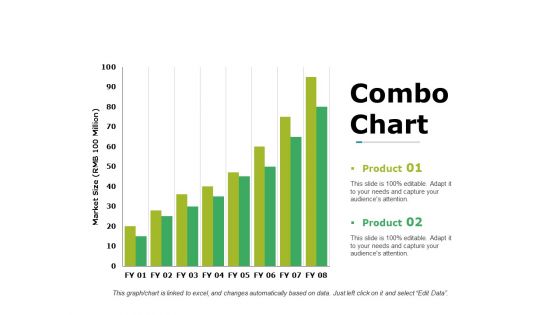
Combo Chart Ppt PowerPoint Presentation Gallery Background Designs
This is a combo chart ppt powerpoint presentation gallery background designs. This is a two stage process. The stages in this process are business, marketing, planning, finance, growth.
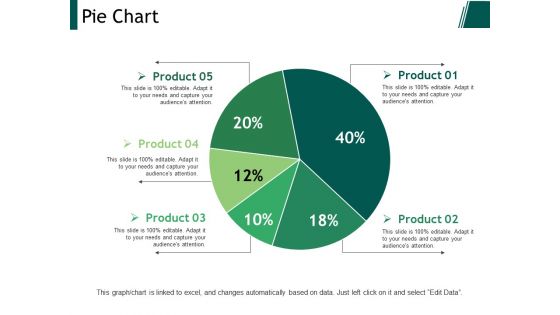
Pie Chart Ppt PowerPoint Presentation Infographic Template Graphics
This is a pie chart ppt powerpoint presentation infographic template graphics. This is a five stage process. The stages in this process are business, marketing, strategy, planning, finance.
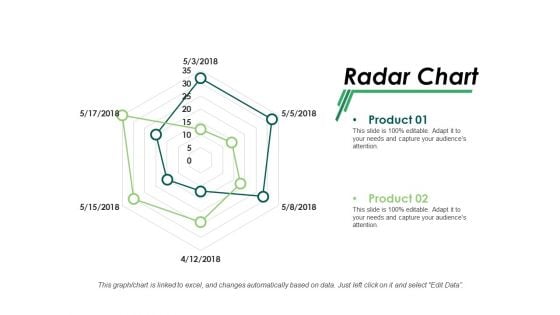
Radar Chart Ppt PowerPoint Presentation Infographic Template Summary
This is a radar chart ppt powerpoint presentation infographic template summary. This is a two stage process. The stages in this process are business, marketing, strategy, finance, analysis.
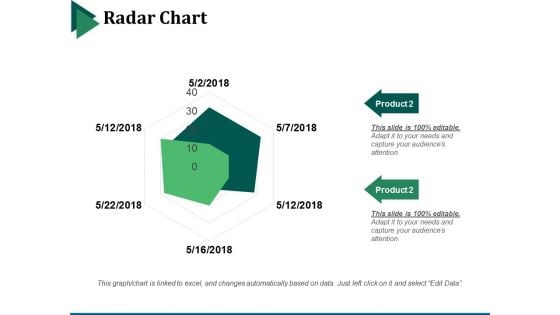
Radar Chart Ppt PowerPoint Presentation Infographic Template Guidelines
This is a radar chart ppt powerpoint presentation infographic template guidelines. This is a two stage process. The stages in this process are business, marketing, strategy, finance, analysis.
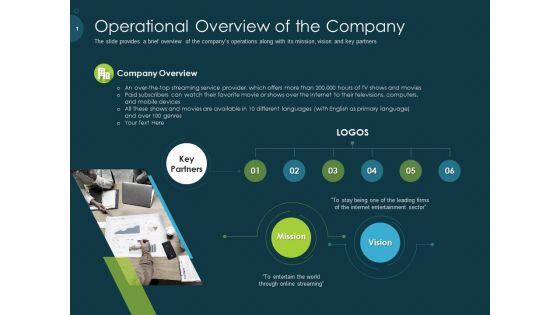
Raise Funding From Pre Seed Capital Operational Overview Of The Company Elements PDF
The slide provides a brief overview of the companys operations along with its mission, vision and key partners. Presenting raise funding from pre seed capital operational overview of the company elements pdf to dispense important information. This template comprises six stages. It also presents valuable insights into the topics including company overview, provider, service, partners, mission. This is a completely customizable PowerPoint theme that can be put to use immediately. So, download it and address the topic impactfully.

Business Success Global PowerPoint Templates And PowerPoint Themes 0512
Microsoft Powerpoint Templates and Background with business-Business Success Global PowerPoint Templates And PowerPoint Themes 0512-These PowerPoint designs and slide layouts can be used for themes relating to -Business success global, background, success, finance, marketing, abstract Formalize plans with our Business Success Global PowerPoint Templates And PowerPoint Themes 0512. Download without worries with our money back guaranteee.

Business Target Gearwheels PowerPoint Templates And PowerPoint Themes 0512
Microsoft Powerpoint Templates and Background with colorful gears-Business Target Gearwheels PowerPoint Templates And PowerPoint Themes 0512-These PowerPoint designs and slide layouts can be used for themes relating to -Business gearwheels, abstract, background, design, finance, teamwork Offer solutions with our Business Target Gearwheels PowerPoint Templates And PowerPoint Themes 0512. Download without worries with our money back guaranteee.
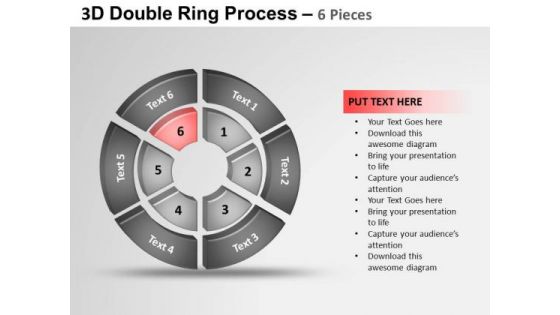
PowerPoint Template Chart Double Ring Ppt Slide
PowerPoint Template Chart Double Ring PPT Slide Business Power Points-Inspired by the indelible Olympic logo this graphic exemplifies the benefits of teamwork. Different people with differing ideas and priorities perform together to score. Hence this diagram has the unique ability to drive home your ideas and show how they mesh to guarantee success.-These amazing PowerPoint pre-designed slides and PowerPoint templates have been carefully created by our team of experts to help you impress your audience. Our stunning collection of Powerpoint slides are 100% editable and can easily fit in any PowerPoint presentations. By using these animations and graphics in PowerPoint and you can easily make professional presentations. Any text can be entered at any point in the PowerPoint template or slide. Just DOWNLOAD our awesome PowerPoint templates and you are ready to go. Locate problems with our PowerPoint Template Chart Double Ring Ppt Slide. Download without worries with our money back guaranteee.
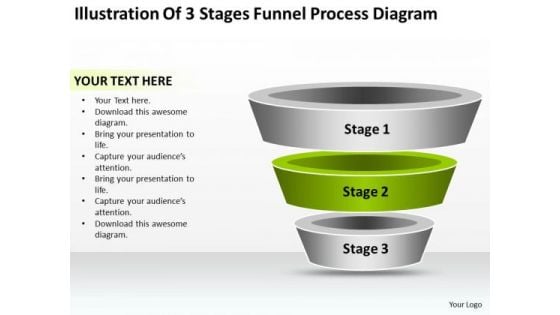
Business Process Flow Funnel Diagram PowerPoint Templates Backgrounds For Slide
We present our business process flow funnel diagram PowerPoint templates backgrounds for slide.Present our Funnels PowerPoint Templates because Our PowerPoint Templates and Slides will give you great value for your money. Be assured of finding the best projection to highlight your words. Download our Process and Flows PowerPoint Templates because You can Raise a toast with our PowerPoint Templates and Slides. Spread good cheer amongst your audience. Present our Business PowerPoint Templates because You will get more than you ever bargained for. Present our Circle Charts PowerPoint Templates because Our PowerPoint Templates and Slides come in all colours, shades and hues. They help highlight every nuance of your views. Download and present our Shapes PowerPoint Templates because Our PowerPoint Templates and Slides will let you Leave a lasting impression to your audiences. They possess an inherent longstanding recall factor.Use these PowerPoint slides for presentations relating to Funnel, recruitment, recruiting, recruiter, talent, business, job, diagram, interest, identify, final, headhunter, chart, head-hunter, human resource, selection, career, resource, candidate. The prominent colors used in the PowerPoint template are Green lime , Black, Gray. Equalize the odds with our Business Process Flow Funnel Diagram PowerPoint Templates Backgrounds For Slide. Better the chances of your ideas working.
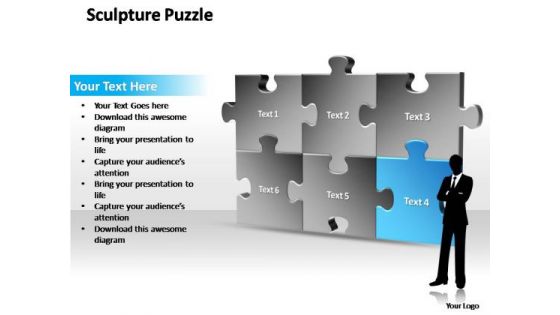
PowerPoint Themes Sale Sculpture Puzzle Ppt Templates
PowerPoint Themes Sale Sculpture Puzzle PPT Templates-This 3D Sclupture puzzle diagram is an unconventional shape to catch your audience attention.\n-PowerPoint Themes Sale Sculpture Puzzle PPT Templates Classify goals with our PowerPoint Themes Sale Sculpture Puzzle Ppt Templates. Download without worries with our money back guaranteee.
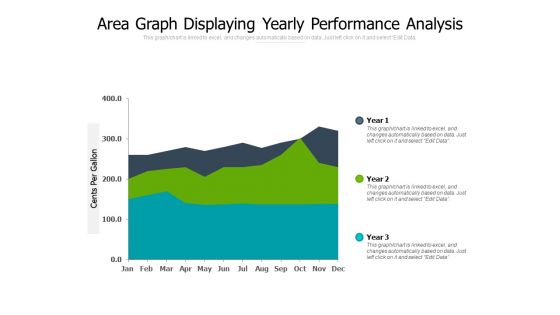
Area Graph Displaying Yearly Performance Analysis Ppt PowerPoint Presentation Slides Diagrams
Presenting this set of slides with name area graph displaying yearly performance analysis ppt powerpoint presentation slides diagrams. The topics discussed in these slide is area graph displaying yearly performance analysis. This is a completely editable PowerPoint presentation and is available for immediate download. Download now and impress your audience.
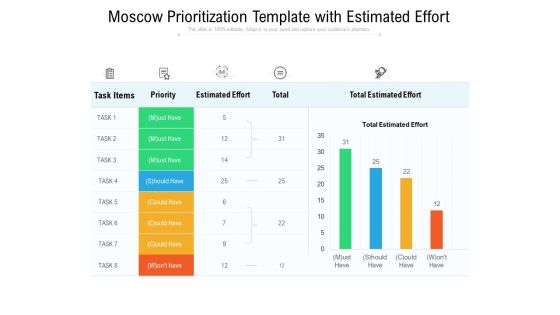
Moscow Prioritization Template With Estimated Effort Ppt PowerPoint Presentation Styles Diagrams PDF
Presenting this set of slides with name moscow prioritization template with estimated effort ppt powerpoint presentation styles diagrams pdf. The topics discussed in these slides are task items, priority, estimated effort, total, total estimated effort. This is a completely editable PowerPoint presentation and is available for immediate download. Download now and impress your audience.
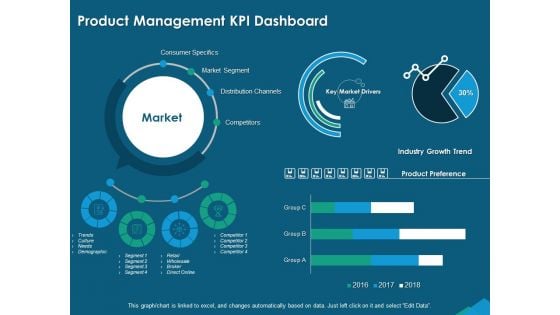
Guide For Managers To Effectively Handle Products Product Management KPI Dashboard Diagrams PDF
Presenting this set of slides with name guide for managers to effectively handle products product management kpi dashboard diagrams pdf. The topics discussed in these slides are consumer specifics, market segment, distribution channels, competitors, industry growth trend, product preference, key market drivers. This is a completely editable PowerPoint presentation and is available for immediate download. Download now and impress your audience.
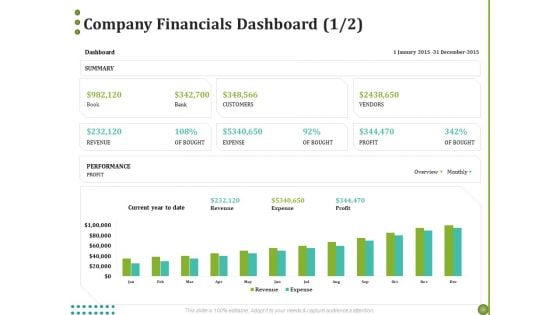
BPO Managing Enterprise Financial Transactions Company Financials Dashboard Profit Diagrams PDF
Presenting this set of slides with name bpo managing enterprise financial transactions company financials dashboard profit diagrams pdf. The topics discussed in these slide is company financials dashboard. This is a completely editable PowerPoint presentation and is available for immediate download. Download now and impress your audience.
Quality Management Plan QMP Dashboard Tracking Quality Ppt Infographic Template Diagrams PDF
Presenting this set of slides with name quality management plan qmp dashboard tracking quality ppt infographic template diagrams pdf. The topics discussed in these slide is dashboard tracking quality. This is a completely editable PowerPoint presentation and is available for immediate download. Download now and impress your audience.
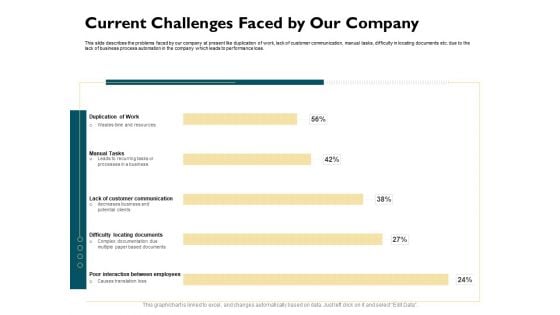
Automatically Controlling Process Current Challenges Faced By Our Company Diagrams PDF
Presenting this set of slides with name automatically controlling process current challenges faced by our company diagrams pdf. The topics discussed in these slides are duplication of work, manual tasks, customer communication, locating documents. This is a completely editable PowerPoint presentation and is available for immediate download. Download now and impress your audience.
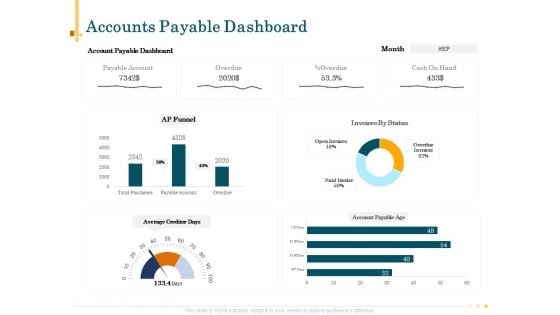
Outsource Bookkeeping Service Manage Financial Transactions Accounts Payable Dashboard Diagrams PDF
Presenting this set of slides with name outsource bookkeeping service manage financial transactions accounts payable dashboard diagrams pdf. The topics discussed in these slide is accounts payable dashboard. This is a completely editable PowerPoint presentation and is available for immediate download. Download now and impress your audience.
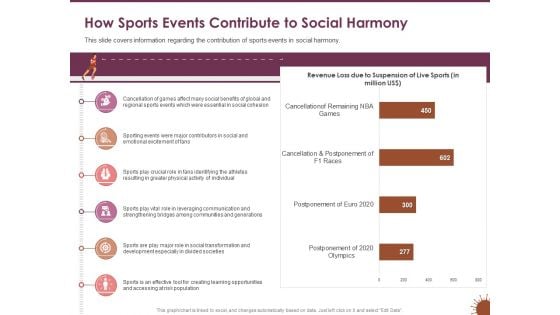
COVID 19 Effect Risk Management Strategies How Sports Events Contribute To Social Harmony Diagrams PDF
Presenting this set of slides with name covid 19 effect risk management strategies how sports events contribute to social harmony diagrams pdf. The topics discussed in these slides are social, communication, transformation, opportunities. This is a completely editable PowerPoint presentation and is available for immediate download. Download now and impress your audience.

Action Plan Or Hospitality Industry Non Alcoholic Market Revenue By Product USD Billion Diagrams PDF
Presenting this set of slides with name action plan or hospitality industry non alcoholic market revenue by product usd billion diagrams pdf. The topics discussed in these slides are fruit beverages, bottled water, functional beverages, sports drinks, carbonated soft drinks. This is a completely editable PowerPoint presentation and is available for immediate download. Download now and impress your audience.
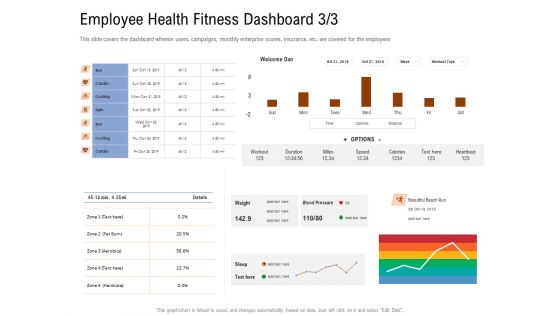
Employee Health And Fitness Program Employee Health Fitness Dashboard Diagrams PDF
Presenting this set of slides with name employee health and fitness program employee health fitness dashboard diagrams pdf. The topics discussed in these slide is employee health fitness dashboard. This is a completely editable PowerPoint presentation and is available for immediate download. Download now and impress your audience.
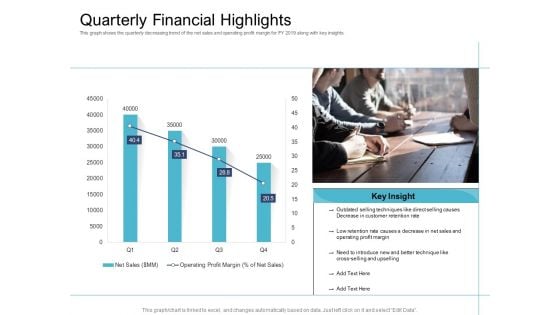
Cross Selling Initiatives For Online And Offline Store Quarterly Financial Highlights Diagrams PDF
Deliver and pitch your topic in the best possible manner with this cross selling initiatives for online and offline store quarterly financial highlights diagrams pdf. Use them to share invaluable insights on techniques, cross selling, sales, profit margin and impress your audience. This template can be altered and modified as per your expectations. So, grab it now.

 Home
Home