Daily Snapshot
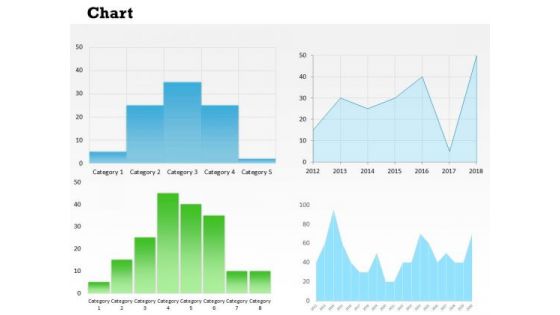
Business Diagram Multiple Charts Business Dashboard Marketing Diagram
Document The Process On Our Business Diagram Multiple Charts Business Dashboard Marketing Diagram Powerpoint Templates. Make A Record Of Every Detail.
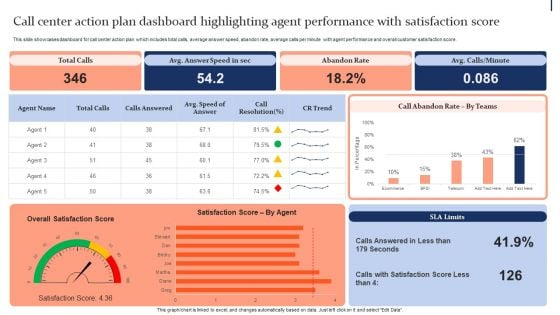
Quality Enhancement Strategic Call Center Action Plan Dashboard Highlighting Agent Designs PDF
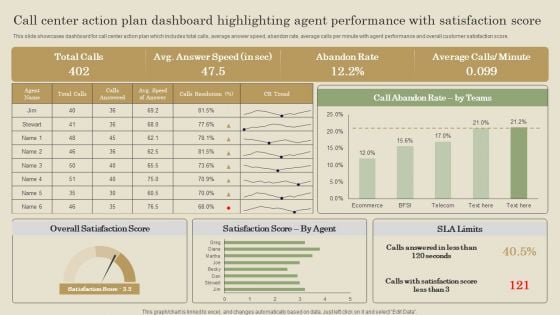
This slide showcases dashboard for call center action plan which includes total calls, average answer speed, abandon rate, average calls per minute with agent performance and overall customer satisfaction score. Get a simple yet stunning designed Quality Enhancement Strategic Call Center Action Plan Dashboard Highlighting Agent Designs PDF. It is the best one to establish the tone in your meetings. It is an excellent way to make your presentations highly effective. So, download this PPT today from Slidegeeks and see the positive impacts. Our easy-to-edit Quality Enhancement Strategic Call Center Action Plan Dashboard Highlighting Agent Designs PDF can be your go-to option for all upcoming conferences and meetings. So, what are you waiting for Grab this template today.
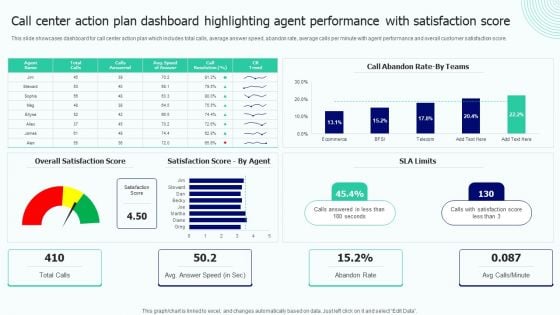
Call Center Action Plan Dashboard Highlighting Agent Performance With Satisfaction Score Slides PDF
This slide showcases dashboard for call center action plan which includes total calls, average answer speed, abandon rate, average calls per minute with agent performance and overall customer satisfaction score. Here you can discover an assortment of the finest PowerPoint and Google Slides templates. With these templates, you can create presentations for a variety of purposes while simultaneously providing your audience with an eye catching visual experience. Download Call Center Action Plan Dashboard Highlighting Agent Performance With Satisfaction Score Slides PDF to deliver an impeccable presentation. These templates will make your job of preparing presentations much quicker, yet still, maintain a high level of quality. Slidegeeks has experienced researchers who prepare these templates and write high quality content for you. Later on, you can personalize the content by editing the Call Center Action Plan Dashboard Highlighting Agent Performance With Satisfaction Score Slides PDF.
KPI Dashboard For Tracking Social Implementing Marketing Tactics To Drive Sample Pdf
This slide covers the dashboard for analyzing social media marketing campaigns. It includes metrics such as tweets, followers, followings, listed favorites, reach, views, Facebook engagement, clicks, likes, Instagram photos, etc. Take your projects to the next level with our ultimate collection of KPI Dashboard For Tracking Social Implementing Marketing Tactics To Drive Sample Pdf. Slidegeeks has designed a range of layouts that are perfect for representing task or activity duration, keeping track of all your deadlines at a glance. Tailor these designs to your exact needs and give them a truly corporate look with your own brand colors they well make your projects stand out from the rest. This slide covers the dashboard for analyzing social media marketing campaigns. It includes metrics such as tweets, followers, followings, listed favorites, reach, views, Facebook engagement, clicks, likes, Instagram photos, etc.
Kpi Dashboard For Tracking Social Media Campaign Results Powerful Marketing Techniques Strategy SS V
This slide covers the dashboard for analyzing social media marketing campaigns. It includes metrics such as tweets, followers, followings, listed favorites, reach, views, Facebook engagement, clicks, likes, Instagram photos, etc. This Kpi Dashboard For Tracking Social Media Campaign Results Powerful Marketing Techniques Strategy SS V from Slidegeeks makes it easy to present information on your topic with precision. It provides customization options, so you can make changes to the colors, design, graphics, or any other component to create a unique layout. It is also available for immediate download, so you can begin using it right away. Slidegeeks has done good research to ensure that you have everything you need to make your presentation stand out. Make a name out there for a brilliant performance. This slide covers the dashboard for analyzing social media marketing campaigns. It includes metrics such as tweets, followers, followings, listed favorites, reach, views, Facebook engagement, clicks, likes, Instagram photos, etc.
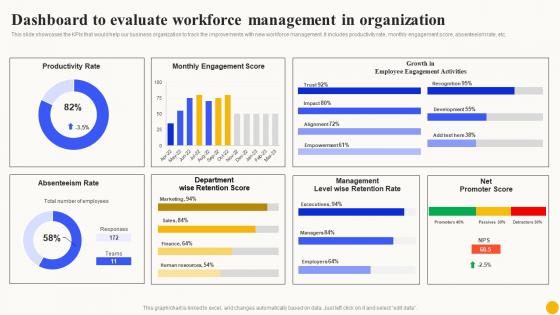
Dashboard To Evaluate Workforce Planned Workforce Enhancement Mockup Pdf
This slide showcases the KPIs that would help our business organization to track the improvements with new workforce management. It includes productivity rate, monthly engagement score, absenteeism rate, etc.Find highly impressive Dashboard To Evaluate Workforce Planned Workforce Enhancement Mockup Pdf on Slidegeeks to deliver a meaningful presentation. You can save an ample amount of time using these presentation templates. No need to worry to prepare everything from scratch because Slidegeeks experts have already done a huge research and work for you. You need to download Dashboard To Evaluate Workforce Planned Workforce Enhancement Mockup Pdf for your upcoming presentation. All the presentation templates are 100Precent editable and you can change the color and personalize the content accordingly. Download now. This slide showcases the KPIs that would help our business organization to track the improvements with new workforce management. It includes productivity rate, monthly engagement score, absenteeism rate, etc.
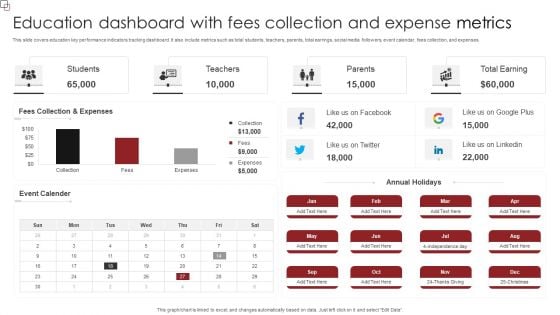
Education Dashboard With Fees Collection And Expense Metrics Demonstration PDF
This slide covers education key performance indicators tracking dashboard. It also include metrics such as total students, teachers, parents, total earrings, social media followers, event calendar, fees collection, and expenses. Showcasing this set of slides titled Education Dashboard With Fees Collection And Expense Metrics Demonstration PDF. The topics addressed in these templates are Event Calender, Annual Holidays, Fees Collection, Expenses. All the content presented in this PPT design is completely editable. Download it and make adjustments in color, background, font etc. as per your unique business setting.
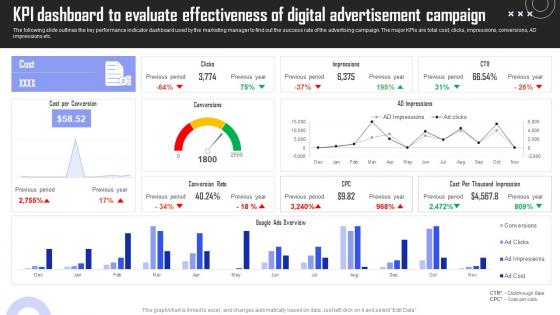
KPI Dashboard Evaluate Brand Building Techniques To Gain Competitive Edge Template Pdf
The following slide outlines the key performance indicator dashboard used by the marketing manager to find out the success rate of the advertising campaign. The major KPIs are total cost, clicks, impressions, conversions, AD impressions etc. Explore a selection of the finest KPI Dashboard Evaluate Brand Building Techniques To Gain Competitive Edge Template Pdf here. With a plethora of professionally designed and pre made slide templates, you can quickly and easily find the right one for your upcoming presentation. You can use our KPI Dashboard Evaluate Brand Building Techniques To Gain Competitive Edge Template Pdf to effectively convey your message to a wider audience. Slidegeeks has done a lot of research before preparing these presentation templates. The content can be personalized and the slides are highly editable. Grab templates today from Slidegeeks. The following slide outlines the key performance indicator dashboard used by the marketing manager to find out the success rate of the advertising campaign. The major KPIs are total cost, clicks, impressions, conversions, AD impressions etc.
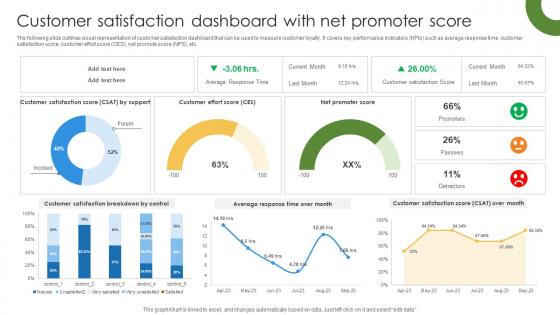
Marketing Growth Strategy Customer Satisfaction Dashboard With Net Promoter Strategy SS V
The following slide outlines visual representation of customer satisfaction dashboard that can be used to measure customer loyalty. It covers key performance indicators KPIs such as average response time, customer satisfaction score, customer effort score CES, net promote score NPS, etc. Get a simple yet stunning designed Marketing Growth Strategy Customer Satisfaction Dashboard With Net Promoter Strategy SS V. It is the best one to establish the tone in your meetings. It is an excellent way to make your presentations highly effective. So, download this PPT today from Slidegeeks and see the positive impacts. Our easy-to-edit Marketing Growth Strategy Customer Satisfaction Dashboard With Net Promoter Strategy SS V can be your go-to option for all upcoming conferences and meetings. So, what are you waiting for Grab this template today. The following slide outlines visual representation of customer satisfaction dashboard that can be used to measure customer loyalty. It covers key performance indicators KPIs such as average response time, customer satisfaction score, customer effort score CES, net promote score NPS, etc.
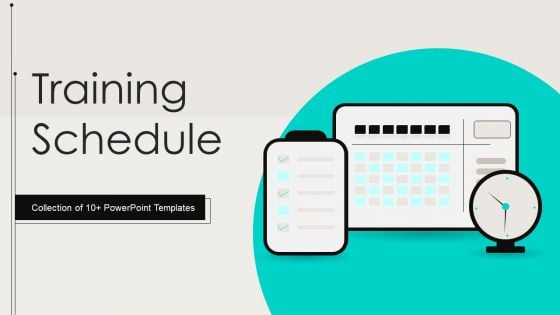
Training Schedule Ppt PowerPoint Presentation Complete Deck With Slides
Boost your confidence and team morale with this well-structured Training Schedule Ppt PowerPoint Presentation Complete Deck With Slides. This prefabricated set gives a voice to your presentation because of its well-researched content and graphics. Our experts have added all the components very carefully, thus helping you deliver great presentations with a single click. Not only that, it contains a set of twelve slides that are designed using the right visuals, graphics, etc. Various topics can be discussed, and effective brainstorming sessions can be conducted using the wide variety of slides added in this complete deck. Apart from this, our PPT design contains clear instructions to help you restructure your presentations and create multiple variations. The color, format, design anything can be modified as deemed fit by the user. Not only this, it is available for immediate download. So, grab it now.
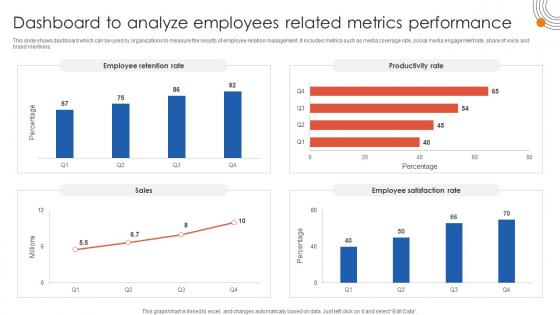
Human Resource Industrial Relationship Dashboard To Analyze Employees Related Metrics Performance
This slide shows dashboard which can be used by organizations to measure the results of employee relation management. It includes metrics such as media coverage rate, social media engagement rate, share of voice and brand mentions. Slidegeeks is here to make your presentations a breeze with Human Resource Industrial Relationship Dashboard To Analyze Employees Related Metrics Performance With our easy-to-use and customizable templates, you can focus on delivering your ideas rather than worrying about formatting. With a variety of designs to choose from, you are sure to find one that suits your needs. And with animations and unique photos, illustrations, and fonts, you can make your presentation pop. So whether you are giving a sales pitch or presenting to the board, make sure to check out Slidegeeks first This slide shows dashboard which can be used by organizations to measure the results of employee relation management. It includes metrics such as media coverage rate, social media engagement rate, share of voice and brand mentions.
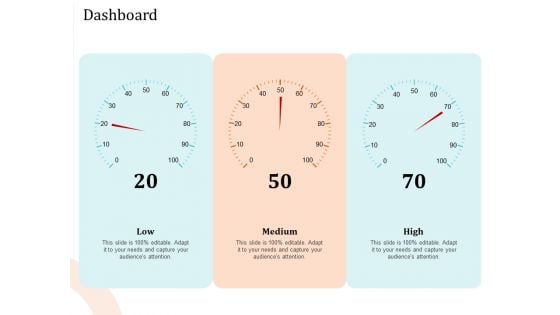
5 Pillars Business Long Term Plan Dashboard Ppt Model Format Ideas PDF
Deliver and pitch your topic in the best possible manner with this 5 pillars business long term plan dashboard ppt model format ideas pdf. Use them to share invaluable insights on dashboard, low, medium, high and impress your audience. This template can be altered and modified as per your expectations. So, grab it now.
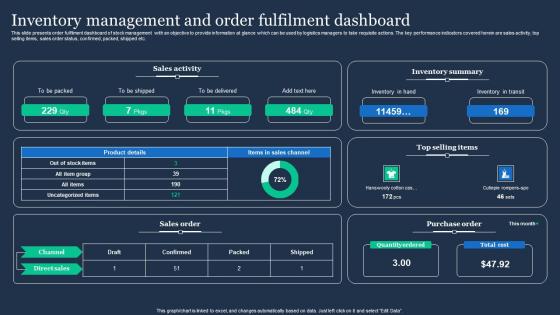
Inventory Management And Order Fulfilment Dashboard Slides Pdf
This slide presents order fulfilment dashboard of stock management with an objective to provide information at glance which can be used by logistics managers to take requisite actions. The key performance indicators covered herein are sales activity, top selling items, sales order status, confirmed, packed, shipped etc. Pitch your topic with ease and precision using this Inventory Management And Order Fulfilment Dashboard Slides Pdf. This layout presents information on Sales Activity, Inventory Summary, Sales Order. It is also available for immediate download and adjustment. So, changes can be made in the color, design, graphics or any other component to create a unique layout. This slide presents order fulfilment dashboard of stock management with an objective to provide information at glance which can be used by logistics managers to take requisite actions. The key performance indicators covered herein are sales activity, top selling items, sales order status, confirmed, packed, shipped etc.
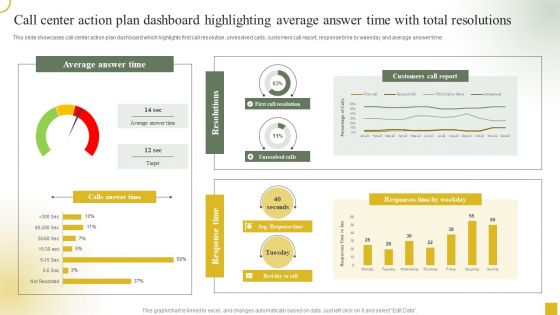
Call Center Action Plan Dashboard Highlighting Average Answer Time With Total Resolutions Template PDF
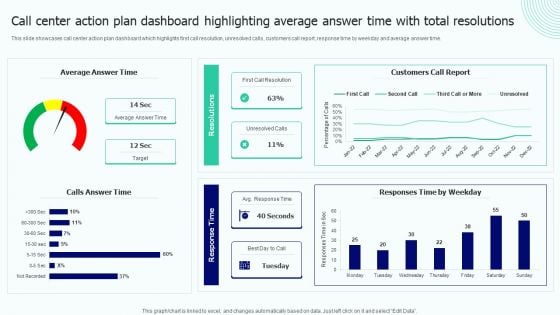
This slide showcases call center action plan dashboard which highlights first call resolution, unresolved calls, customers call report, response time by weekday and average answer time. Are you in need of a template that can accommodate all of your creative concepts This one is crafted professionally and can be altered to fit any style. Use it with Google Slides or PowerPoint. Include striking photographs, symbols, depictions, and other visuals. Fill, move around, or remove text boxes as desired. Test out color palettes and font mixtures. Edit and save your work, or work with colleagues. Download Call Center Action Plan Dashboard Highlighting Average Answer Time With Total Resolutions Template PDF and observe how to make your presentation outstanding. Give an impeccable presentation to your group and make your presentation unforgettable.
Call Center Action Plan Dashboard Highlighting Average Answer Time With Total Resolutions Designs PDF
This slide showcases call center action plan dashboard which highlights first call resolution, unresolved calls, customers call report, response time by weekday and average answer time. This Call Center Action Plan Dashboard Highlighting Average Answer Time With Total Resolutions Designs PDF from Slidegeeks makes it easy to present information on your topic with precision. It provides customization options, so you can make changes to the colors, design, graphics, or any other component to create a unique layout. It is also available for immediate download, so you can begin using it right away. Slidegeeks has done good research to ensure that you have everything you need to make your presentation stand out. Make a name out there for a brilliant performance.
Dashboard For Competitor Digital Presence Efficient Plan For Conducting Competitor Microsoft Pdf
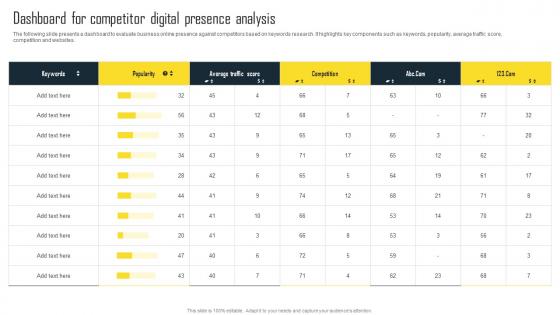
The following slide presents a dashboard to evaluate business online presence against competitors based on keywords research. It highlights key components such as keywords, popularity, average traffic score, competition and websites. The best PPT templates are a great way to save time, energy, and resources. Slidegeeks have 100 percent editable powerpoint slides making them incredibly versatile. With these quality presentation templates, you can create a captivating and memorable presentation by combining visually appealing slides and effectively communicating your message. Download Dashboard For Competitor Digital Presence Efficient Plan For Conducting Competitor Microsoft Pdf from Slidegeeks and deliver a wonderful presentation. The following slide presents a dashboard to evaluate business online presence against competitors based on keywords research. It highlights key components such as keywords, popularity, average traffic score, competition and websites.

Developing And Implementing Corporate Partner Action Plan Dashboard Brochure PDF
Deliver an awe inspiring pitch with this creative developing and implementing corporate partner action plan dashboard brochure pdf bundle. Topics like low, medium, high can be discussed with this completely editable template. It is available for immediate download depending on the needs and requirements of the user.

Key Performance Indicator Analytics Dashboard Ppt PowerPoint Presentation Model Example Topics
This is a key performance indicator analytics dashboard ppt powerpoint presentation model example topics. This is a five stage process. The stages in this process are kpi proposal, kpi plan, kpi scheme.
Call Center Action Plan Dashboard Highlighting Agent Performance With Satisfaction Score Diagrams PDF
This slide showcases dashboard for call center action plan which includes total calls, average answer speed, abandon rate, average calls per minute with agent performance and overall customer satisfaction score. Slidegeeks has constructed Call Center Action Plan Dashboard Highlighting Agent Performance With Satisfaction Score Diagrams PDF after conducting extensive research and examination. These presentation templates are constantly being generated and modified based on user preferences and critiques from editors. Here, you will find the most attractive templates for a range of purposes while taking into account ratings and remarks from users regarding the content. This is an excellent jumping off point to explore our content and will give new users an insight into our top notch PowerPoint Templates.
KPI Dashboard To Track Amazon Exploring Amazons Global Business Model Growth Themes Pdf
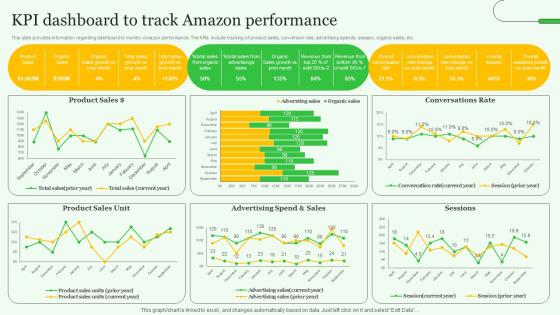
This slide provides information regarding dashboard to monitor Amazon performance. The KPIs include tracking of product sales, conversion rate, advertising spends, session, organic sales, etc. Are you searching for a KPI Dashboard To Track Amazon Exploring Amazons Global Business Model Growth Themes Pdf that is uncluttered, straightforward, and original Its easy to edit, and you can change the colors to suit your personal or business branding. For a presentation that expresses how much effort you have put in, this template is ideal With all of its features, including tables, diagrams, statistics, and lists, its perfect for a business plan presentation. Make your ideas more appealing with these professional slides. Download KPI Dashboard To Track Amazon Exploring Amazons Global Business Model Growth Themes Pdf from Slidegeeks today. This slide provides information regarding dashboard to monitor Amazon performance. The KPIs include tracking of product sales, conversion rate, advertising spends, session, organic sales, etc.
Cryptocurrency Portfolio Tracking Dashboard Summary Cryptocurrency Management With Blockchain
This slide represents the cryptocurrency performance indicators for the individual. The key components include invested money, profit and loss, rate of investment ROI, current valuation of money, etc.Formulating a presentation can take up a lot of effort and time, so the content and message should always be the primary focus. The visuals of the PowerPoint can enhance the presenters message, so our Cryptocurrency Portfolio Tracking Dashboard Summary Cryptocurrency Management With Blockchain was created to help save time. Instead of worrying about the design, the presenter can concentrate on the message while our designers work on creating the ideal templates for whatever situation is needed. Slidegeeks has experts for everything from amazing designs to valuable content, we have put everything into Cryptocurrency Portfolio Tracking Dashboard Summary Cryptocurrency Management With Blockchain. This slide represents the cryptocurrency performance indicators for the individual. The key components include invested money, profit and loss, rate of investment ROI, current valuation of money, etc.

Global Data Security Industry Report Comprehensive Swot Analysis For Cybersecurity Industry IR SS V
The slide covers the cybersecurity industrys strengths, weaknesses, opportunities, and threats. The slide aims to identify internal and external factors impacting the industrys functioning. It will help stakeholders to develop strategies to achieve their objectives and improve efficiency. Do you have to make sure that everyone on your team knows about any specific topic I yes, then you should give Global Data Security Industry Report Comprehensive Swot Analysis For Cybersecurity Industry IR SS V a try. Our experts have put a lot of knowledge and effort into creating this impeccable Global Data Security Industry Report Comprehensive Swot Analysis For Cybersecurity Industry IR SS V. You can use this template for your upcoming presentations, as the slides are perfect to represent even the tiniest detail. You can download these templates from the Slidegeeks website and these are easy to edit. So grab these today The slide covers the cybersecurity industrys strengths, weaknesses, opportunities, and threats. The slide aims to identify internal and external factors impacting the industrys functioning. It will help stakeholders to develop strategies to achieve their objectives and improve efficiency.
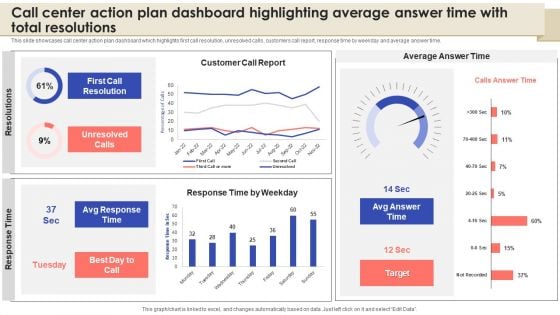
Call Center Action Plan Dashboard Highlighting Average Answer Time With Total Resolutions Themes PDF
Here you can discover an assortment of the finest PowerPoint and Google Slides templates. With these templates, you can create presentations for a variety of purposes while simultaneously providing your audience with an eye catching visual experience. Download Call Center Action Plan Dashboard Highlighting Average Answer Time With Total Resolutions Themes PDF to deliver an impeccable presentation. These templates will make your job of preparing presentations much quicker, yet still, maintain a high level of quality. Slidegeeks has experienced researchers who prepare these templates and write high quality content for you. Later on, you can personalize the content by editing the Call Center Action Plan Dashboard Highlighting Average Answer Time With Total Resolutions Themes PDF.

Facebook Marketing Plan Facebook Ads Dashboard With Campaign Performance Strategy SS V
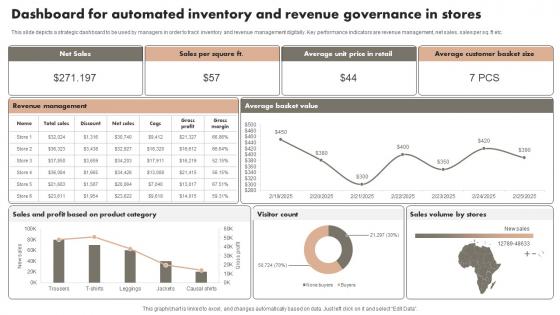
Dashboard For Automated Inventory And Revenue Governance In Stores Microsoft Pdf
This slide depicts a strategic dashboard to be used by managers in order to track inventory and revenue management digitally. Key performance indicators are revenue management, net sales, sales per sq. ft etc. Pitch your topic with ease and precision using this Dashboard For Automated Inventory And Revenue Governance In Stores Microsoft Pdf. This layout presents information on Net Sales, Stores, Category. It is also available for immediate download and adjustment. So, changes can be made in the color, design, graphics or any other component to create a unique layout. This slide depicts a strategic dashboard to be used by managers in order to track inventory and revenue management digitally. Key performance indicators are revenue management, net sales, sales per sq. ft etc.
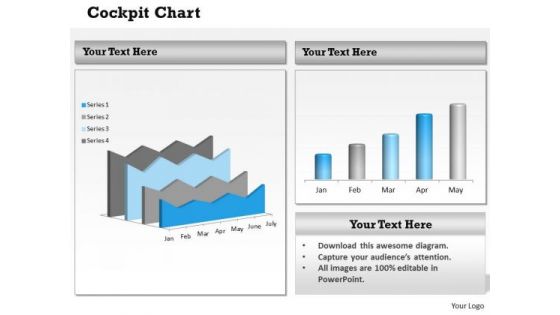
Consulting Diagram Business Dashboard Design Chart Sales Diagram
Document The Process On Our Consulting Diagram Business Dashboard Design Chart Sales Diagram Powerpoint Templates. Make A Record Of Every Detail.
Dashboard For Tracking Efficiency Of Job Position Reorganization Communication Plan Pictures Pdf
This slide displays the dashboard for tracking the efficiency of business communication plan for restructuring job positions. The purpose of this slide is to help the business manager effectively communicate all necessary information to relevant stakeholders for smooth transitioning.Showcasing this set of slides titled Dashboard For Tracking Efficiency Of Job Position Reorganization Communication Plan Pictures Pdf The topics addressed in these templates are Stakeholder Possesses, Overall Experience, Pending Scores All the content presented in this PPT design is completely editable. Download it and make adjustments in color, background, font etc. as per your unique business setting. This slide displays the dashboard for tracking the efficiency of business communication plan for restructuring job positions. The purpose of this slide is to help the business manager effectively communicate all necessary information to relevant stakeholders for smooth transitioning.

Global Data Security Industry Report Geographical Analysis For Cybersecurity Industry IR SS V
The slide highlights the geographical summary of current state of cybersecurity industry. The purpose of the slide is to provide insights on cybersecurity landscape, trends, development at regional levels. It helps stakeholders in understanding the market dynamics, regulatory environments and potential growth opportunities. If your project calls for a presentation, then Slidegeeks is your go-to partner because we have professionally designed, easy-to-edit templates that are perfect for any presentation. After downloading, you can easily edit Global Data Security Industry Report Geographical Analysis For Cybersecurity Industry IR SS V and make the changes accordingly. You can rearrange slides or fill them with different images. Check out all the handy templates The slide highlights the geographical summary of current state of cybersecurity industry. The purpose of the slide is to provide insights on cybersecurity landscape, trends, development at regional levels. It helps stakeholders in understanding the market dynamics, regulatory environments and potential growth opportunities.
Strategic Financial Planning And Administration KPI Dashboard Analyze Financial Improvements Icons PDF
This slide showcases the KPIs that would help our business organization to evaluate improvements with the new financial strategy implementation. It includes total income, total expenses, accounts receivable, etc. Retrieve professionally designed Strategic Financial Planning And Administration KPI Dashboard Analyze Financial Improvements Icons PDF to effectively convey your message and captivate your listeners. Save time by selecting pre-made slideshows that are appropriate for various topics, from business to educational purposes. These themes come in many different styles, from creative to corporate, and all of them are easily adjustable and can be edited quickly. Access them as PowerPoint templates or as Google Slides themes. You do not have to go on a hunt for the perfect presentation because Slidegeeks got you covered from everywhere. This slide showcases the KPIs that would help our business organization to evaluate improvements with the new financial strategy implementation. It includes total income, total expenses, accounts receivable, etc.
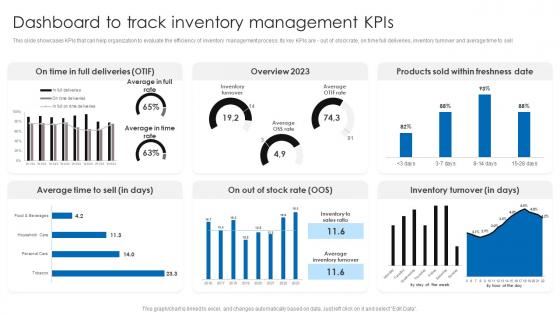
Dashboard To Track Inventory Management Kpis Retail Stock Administration Strategies Rules Pdf
This slide showcases KPIs that can help organization to evaluate the efficiency of inventory management process. Its key KPIs are - out of stock rate, on time full deliveries, inventory turnover and average time to sell.Coming up with a presentation necessitates that the majority of the effort goes into the content and the message you intend to convey. The visuals of a PowerPoint presentation can only be effective if it supplements and supports the story that is being told. Keeping this in mind our experts created Dashboard To Track Inventory Management Kpis Retail Stock Administration Strategies Rules Pdf to reduce the time that goes into designing the presentation. This way, you can concentrate on the message while our designers take care of providing you with the right template for the situation. This slide showcases KPIs that can help organization to evaluate the efficiency of inventory management process. Its key KPIs are out of stock rate, on time full deliveries, inventory turnover and average time to sell
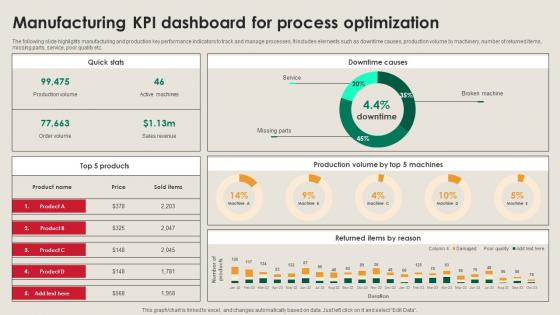
Manufacturing KPI Dashboard For Process Manufacturing Strategy Driving Industry 4 0
The following slide highlights manufacturing and production key performance indicators to track and manage processes. It includes elements such as downtime causes, production volume by machinery, number of returned items, missing parts, service, poor quality etc. Boost your pitch with our creative Manufacturing KPI Dashboard For Process Manufacturing Strategy Driving Industry 4 0. Deliver an awe-inspiring pitch that will mesmerize everyone. Using these presentation templates you will surely catch everyones attention. You can browse the ppts collection on our website. We have researchers who are experts at creating the right content for the templates. So you do not have to invest time in any additional work. Just grab the template now and use them. The following slide highlights manufacturing and production key performance indicators to track and manage processes. It includes elements such as downtime causes, production volume by machinery, number of returned items, missing parts, service, poor quality etc.

Actual And Planned Partner Executive Performance Dashboard Ppt Show Outline PDF
This slide covers the partner executive dashboard that focuses on revenues, pipeline, capability scoreboard, along with actual and planned values quarterly. Deliver an awe inspiring pitch with this creative actual and planned partner executive performance dashboard ppt show outline pdf bundle. Topics like actual and planned partner executive performance dashboard can be discussed with this completely editable template. It is available for immediate download depending on the needs and requirements of the user.
Corporate Branding Performance Tracking Dashboard Effective Brand Maintenance Pictures Pdf
This slide provides information regarding corporate branding performance tracking dashboard in terms of leads, conversion metrics, web traffic, etc. Find highly impressive Corporate Branding Performance Tracking Dashboard Effective Brand Maintenance Pictures Pdf on Slidegeeks to deliver a meaningful presentation. You can save an ample amount of time using these presentation templates. No need to worry to prepare everything from scratch because Slidegeeks experts have already done a huge research and work for you. You need to download Corporate Branding Performance Tracking Dashboard Effective Brand Maintenance Pictures Pdf for your upcoming presentation. All the presentation templates are 100 percent editable and you can change the color and personalize the content accordingly. Download now. This slide provides information regarding corporate branding performance tracking dashboard in terms of leads, conversion metrics, web traffic, etc.

Employee Relations In Human Resource Dashboard To Analyze Employees Related Metrics Performance
This slide shows dashboard which can be used by organizations to measure the results of employee relation management. It includes metrics such as media coverage rate, social media engagement rate, share of voice and brand mentions. Present like a pro with Employee Relations In Human Resource Dashboard To Analyze Employees Related Metrics Performance. Create beautiful presentations together with your team, using our easy-to-use presentation slides. Share your ideas in real-time and make changes on the fly by downloading our templates. So whether you are in the office, on the go, or in a remote location, you can stay in sync with your team and present your ideas with confidence. With Slidegeeks presentation got a whole lot easier. Grab these presentations today. This slide shows dashboard which can be used by organizations to measure the results of employee relation management. It includes metrics such as media coverage rate, social media engagement rate, share of voice and brand mentions.
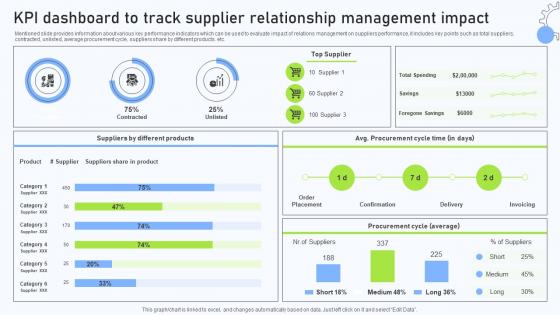
Relationship Management Automation KPI Dashboard To Track Supplier Relationship
Mentioned slide provides information about various key performance indicators which can be used to evaluate impact of relations management on suppliers performance, it includes key points such as total suppliers, contracted, unlisted, average procurement cycle, suppliers share by different products. etc. This Relationship Management Automation KPI Dashboard To Track Supplier Relationship is perfect for any presentation, be it in front of clients or colleagues. It is a versatile and stylish solution for organizing your meetings. The Relationship Management Automation KPI Dashboard To Track Supplier Relationship features a modern design for your presentation meetings. The adjustable and customizable slides provide unlimited possibilities for acing up your presentation. Slidegeeks has done all the homework before launching the product for you. So, do not wait, grab the presentation templates today Mentioned slide provides information about various key performance indicators which can be used to evaluate impact of relations management on suppliers performance, it includes key points such as total suppliers, contracted, unlisted, average procurement cycle, suppliers share by different products. etc.

Product Analytics Dashboard To Track Engagement Driving Business Success Integrating Product
This slide illustrates a dashboard to monitor customer engagement on company website by leveraging product analytics tools aimed at making necessary improvements. It covers insights regarding active monthly users, new users, total completed purchases, screen views, average duration of session, etc. There are so many reasons you need a Product Analytics Dashboard To Track Engagement Driving Business Success Integrating Product. The first reason is you can not spend time making everything from scratch, Thus, Slidegeeks has made presentation templates for you too. You can easily download these templates from our website easily. This slide illustrates a dashboard to monitor customer engagement on company website by leveraging product analytics tools aimed at making necessary improvements. It covers insights regarding active monthly users, new users, total completed purchases, screen views, average duration of session, etc.
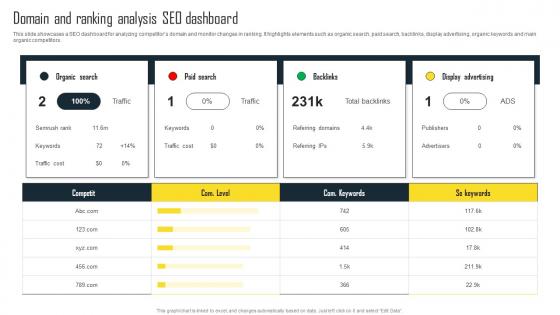
Domain And Ranking Analysis SEO Dashboard Efficient Plan For Conducting Competitor Clipart Pdf
This slide showcases a SEO dashboard for analyzing competitors domain and monitor changes in ranking. It highlights elements such as organic search, paid search, backlinks, display advertising, organic keywords and main organic competitors. Are you searching for a Domain And Ranking Analysis SEO Dashboard Efficient Plan For Conducting Competitor Clipart Pdf that is uncluttered, straightforward, and original It is easy to edit, and you can change the colors to suit your personal or business branding. For a presentation that expresses how much effort you have put in, this template is ideal With all of its features, including tables, diagrams, statistics, and lists, it is perfect for a business plan presentation. Make your ideas more appealing with these professional slides. Download Domain And Ranking Analysis SEO Dashboard Efficient Plan For Conducting Competitor Clipart Pdf from Slidegeeks today. This slide showcases a SEO dashboard for analyzing competitors domain and monitor changes in ranking. It highlights elements such as organic search, paid search, backlinks, display advertising, organic keywords and main organic competitors.

Global Data Security Industry Report Key Considerations Assumptions Of Cybersecurity Industry Report IR SS V
The slide represents key considerations and limitations while building the cybersecurity industry report. The purpose of this slide is to provide framework and context for analysis and projections in addition to acknowledging uncertainties and potential risks in the future. Make sure to capture your audiences attention in your business displays with our gratis customizable Global Data Security Industry Report Key Considerations Assumptions Of Cybersecurity Industry Report IR SS V. These are great for business strategies, office conferences, capital raising or task suggestions. If you desire to acquire more customers for your tech business and ensure they stay satisfied, create your own sales presentation with these plain slides. The slide represents key considerations and limitations while building the cybersecurity industry report. The purpose of this slide is to provide framework and context for analysis and projections in addition to acknowledging uncertainties and potential risks in the future.
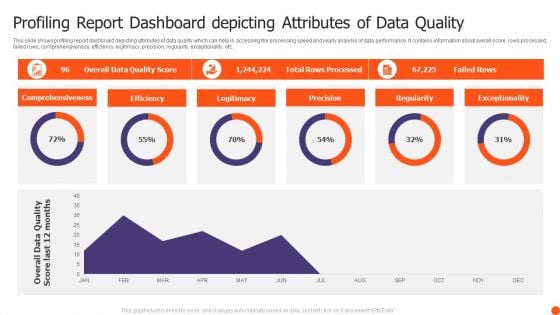
Profiling Report Dashboard Depicting Attributes Of Data Quality Themes PDF
This slide shows profiling report dashboard depicting attributes of data quality which can help in accessing the processing speed and yearly analysis of data performance. It contains information about overall score, rows processed, failed rows, comprehensiveness, efficiency, legitimacy, precision, regularity, exceptionality, etc. Pitch your topic with ease and precision using this Profiling Report Dashboard Depicting Attributes Of Data Quality Themes PDF. This layout presents information on Comprehensiveness, Efficiency, Legitimacy, Precision. It is also available for immediate download and adjustment. So, changes can be made in the color, design, graphics or any other component to create a unique layout.
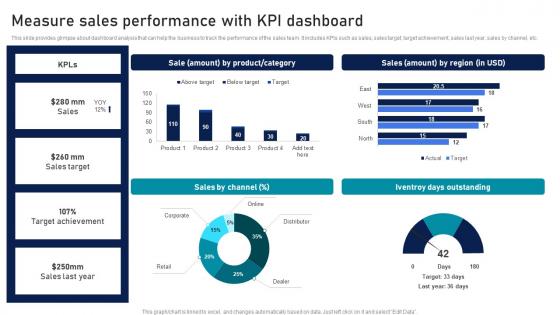
Measure Sales Performance With Kpi Dashboard Strategic Sales Plan To Enhance Summary Pdf
This slide provides glimpse about dashboard analysis that can help the business to track the performance of the sales team. It includes KPIs such as sales, sales target, target achievement, sales last year, sales by channel, etc. The best PPT templates are a great way to save time, energy, and resources. Slidegeeks have 100 percent editable powerpoint slides making them incredibly versatile. With these quality presentation templates, you can create a captivating and memorable presentation by combining visually appealing slides and effectively communicating your message. Download Measure Sales Performance With Kpi Dashboard Strategic Sales Plan To Enhance Summary Pdf from Slidegeeks and deliver a wonderful presentation. This slide provides glimpse about dashboard analysis that can help the business to track the performance of the sales team. It includes KPIs such as sales, sales target, target achievement, sales last year, sales by channel, etc.
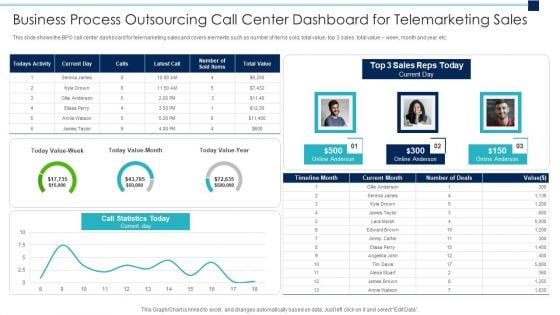
Business Process Outsourcing Call Center Dashboard For Telemarketing Sales Background PDF
Showcasing this set of slides titled business process outsourcing call center dashboard for telemarketing sales background pdf. The topics addressed in these templates are business process outsourcing call center dashboard for telemarketing sales. All the content presented in this PPT design is completely editable. Download it and make adjustments in color, background, font etc. as per your unique business setting.
Employee Key Performance Indicators Dashboard Icon Designs PDF
Showcasing this set of slides titled Employee Key Performance Indicators Dashboard Icon Designs PDF The topics addressed in these templates are Employee Key, Performance Indicators, Dashboard Icon All the content presented in this PPT design is completely editable. Download it and make adjustments in color, background, font etc. as per your unique business setting.
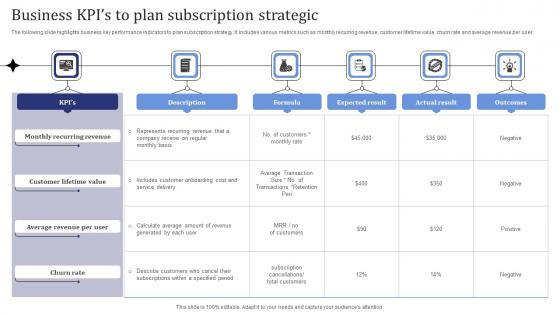
Business Kpis To Plan Subscription Strategic Pictures Pdf
The following slide highlights business key performance indicators to plan subscription strategy. It includes various metrics such as monthly recurring revenue, customer lifetime value, churn rate and average revenue per user. Showcasing this set of slides titled Business Kpis To Plan Subscription Strategic Pictures Pdf. The topics addressed in these templates are Monthly Recurring Revenue, Customer Lifetime Value, Churn Rate. All the content presented in this PPT design is completely editable. Download it and make adjustments in color, background, font etc. as per your unique business setting. The following slide highlights business key performance indicators to plan subscription strategy. It includes various metrics such as monthly recurring revenue, customer lifetime value, churn rate and average revenue per user.
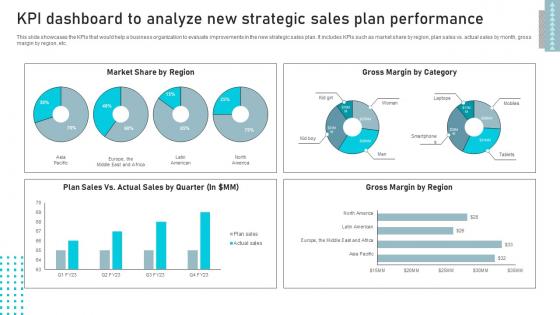
KPI Dashboard To Analyze New Business Sales Enhancement Campaign Portrait Pdf
This slide showcases the KPIs that would help a business organization to evaluate improvements in the new strategic sales plan. It includes KPIs such as market share by region, plan sales vs. actual sales by month, gross margin by region, etc. The best PPT templates are a great way to save time, energy, and resources. Slidegeeks have 100 percent editable powerpoint slides making them incredibly versatile. With these quality presentation templates, you can create a captivating and memorable presentation by combining visually appealing slides and effectively communicating your message. Download KPI Dashboard To Analyze New Business Sales Enhancement Campaign Portrait Pdf from Slidegeeks and deliver a wonderful presentation. This slide showcases the KPIs that would help a business organization to evaluate improvements in the new strategic sales plan. It includes KPIs such as market share by region, plan sales vs. actual sales by month, gross margin by region, etc.
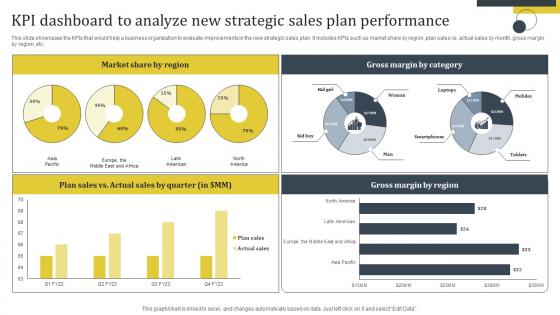
Enhance Customer Retention Kpi Dashboard To Analyze New Strategic Sales Plan Elements Pdf
This slide showcases the KPIs that would help a business organization to evaluate improvements in the new strategic sales plan. It includes KPIs such as market share by region, plan sales vs. actual sales by month, gross margin by region, etc. Welcome to our selection of the Enhance Customer Retention Kpi Dashboard To Analyze New Strategic Sales Plan Elements Pdf. These are designed to help you showcase your creativity and bring your sphere to life. Planning and Innovation are essential for any business that is just starting out. This collection contains the designs that you need for your everyday presentations. All of our PowerPoints are 100 percent editable, so you can customize them to suit your needs. This multi-purpose template can be used in various situations. Grab these presentation templates today. This slide showcases the KPIs that would help a business organization to evaluate improvements in the new strategic sales plan. It includes KPIs such as market share by region, plan sales vs. actual sales by month, gross margin by region, etc.
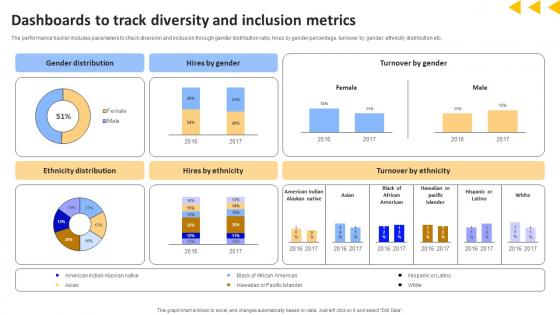
Workforce Productivity Improvement Dashboards To Track Diversity And Inclusion Metrics Structure Pdf
The performance tracker includes parameters to check diversion and inclusion through gender distribution ratio, hires by gender percentage, turnover by gender, ethnicity distribution etc. Coming up with a presentation necessitates that the majority of the effort goes into the content and the message you intend to convey. The visuals of a PowerPoint presentation can only be effective if it supplements and supports the story that is being told. Keeping this in mind our experts created Workforce Productivity Improvement Dashboards To Track Diversity And Inclusion Metrics Structure Pdf to reduce the time that goes into designing the presentation. This way, you can concentrate on the message while our designers take care of providing you with the right template for the situation. The performance tracker includes parameters to check diversion and inclusion through gender distribution ratio, hires by gender percentage, turnover by gender, ethnicity distribution etc.
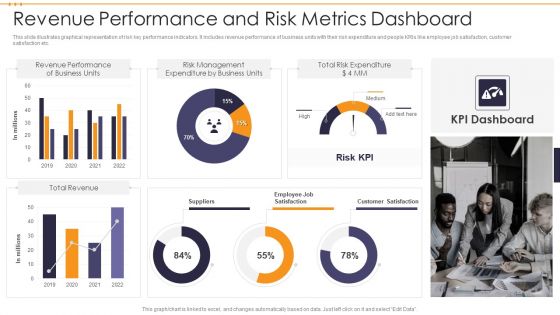
Revenue Performance And Risk Metrics Dashboard Demonstration PDF
This slide illustrates graphical representation of risk key performance indicators. It includes revenue performance of business units with their risk expenditure and people KRIs like employee job satisfaction, customer satisfaction etc. Showcasing this set of slides titled Revenue Performance And Risk Metrics Dashboard Demonstration PDF. The topics addressed in these templates are Total Risk Expenditure, Risk Management, Revenue Performance . All the content presented in this PPT design is completely editable. Download it and make adjustments in color, background, font etc. as per your unique business setting.
Facebook Marketing Plan Dashboard For Tracking Facebook Post Performance Strategy SS V
Dashboard For Employee Service Portal Icons Pdf
This slide showcases individual portal for empowering workforce and helps in creating transparent working environment. This template focuses on maintaining engagement with employee. It includes information related to leaves, earnings, etc. Showcasing this set of slides titled Dashboard For Employee Service Portal Icons Pdf. The topics addressed in these templates are Calendar, Earning, earning. All the content presented in this PPT design is completely editable. Download it and make adjustments in color, background, font etc. as per your unique business setting. This slide showcases individual portal for empowering workforce and helps in creating transparent working environment. This template focuses on maintaining engagement with employee. It includes information related to leaves, earnings, etc.
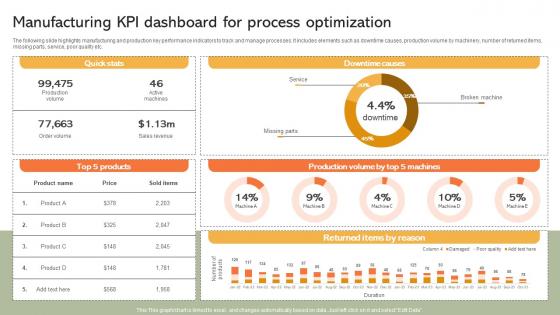
Manufacturing KPI Dashboard For Process Implementing Manufacturing Strategy SS V
The following slide highlights manufacturing and production key performance indicators to track and manage processes. It includes elements such as downtime causes, production volume by machinery, number of returned items, missing parts, service, poor quality etc. Formulating a presentation can take up a lot of effort and time, so the content and message should always be the primary focus. The visuals of the PowerPoint can enhance the presenters message, so our Manufacturing KPI Dashboard For Process Implementing Manufacturing Strategy SS V was created to help save time. Instead of worrying about the design, the presenter can concentrate on the message while our designers work on creating the ideal templates for whatever situation is needed. Slidegeeks has experts for everything from amazing designs to valuable content, we have put everything into Manufacturing KPI Dashboard For Process Implementing Manufacturing Strategy SS V The following slide highlights manufacturing and production key performance indicators to track and manage processes. It includes elements such as downtime causes, production volume by machinery, number of returned items, missing parts, service, poor quality etc.
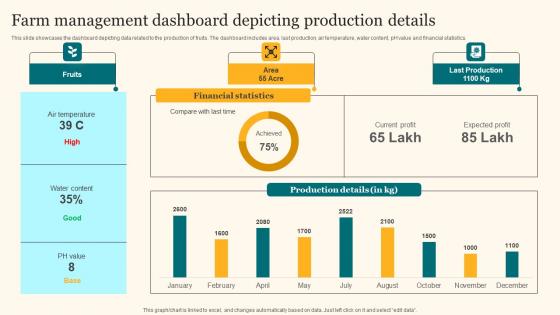
Farm Management Dashboard Depicting Agricultural Product Promotion Pictures Pdf
This slide showcases the dashboard depicting data related to the production of fruits. The dashboard includes area, last production, air temperature, water content, pH value and financial statistics. This modern and well-arranged Farm Management Dashboard Depicting Agricultural Product Promotion Pictures Pdf provides lots of creative possibilities. It is very simple to customize and edit with the Powerpoint Software. Just drag and drop your pictures into the shapes. All facets of this template can be edited with Powerpoint, no extra software is necessary. Add your own material, put your images in the places assigned for them, adjust the colors, and then you can show your slides to the world, with an animated slide included. This slide showcases the dashboard depicting data related to the production of fruits. The dashboard includes area, last production, air temperature, water content, pH value and financial statistics.
Application Performance Dashboard Mobile App Development Advertising Service Icons Pdf
This slide covers application performance in market KPIs and metrics such as impressions, clicks, searches for app, conversion rate etc. Find a pre designed and impeccable Application Performance Dashboard Mobile App Development Advertising Service Icons Pdf. The templates can ace your presentation without additional effort. You can download these easy to edit presentation templates to make your presentation stand out from others. So, what are you waiting for Download the template from Slidegeeks today and give a unique touch to your presentation. This slide covers application performance in market KPIs and metrics such as impressions, clicks, searches for app, conversion rate etc.
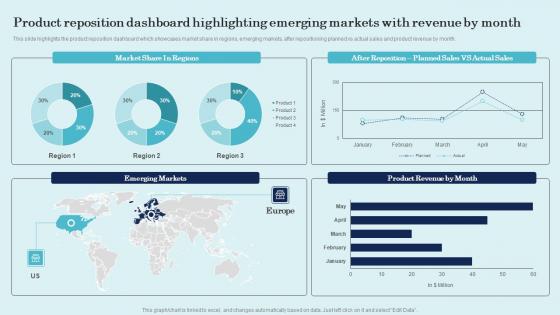
Product Reposition Dashboard Highlighting Emerging Product Repositioning Technique Pictures Pdf
This slide highlights the product reposition dashboard which showcases market share in regions, emerging markets, after repositioning planned vs actual sales and product revenue by month. Welcome to our selection of the Product Reposition Dashboard Highlighting Emerging Product Repositioning Technique Pictures Pdf. These are designed to help you showcase your creativity and bring your sphere to life. Planning and Innovation are essential for any business that is just starting out. This collection contains the designs that you need for your everyday presentations. All of our PowerPoints are 100 percent editable, so you can customize them to suit your needs. This multi-purpose template can be used in various situations. Grab these presentation templates today. This slide highlights the product reposition dashboard which showcases market share in regions, emerging markets, after repositioning planned vs actual sales and product revenue by month.
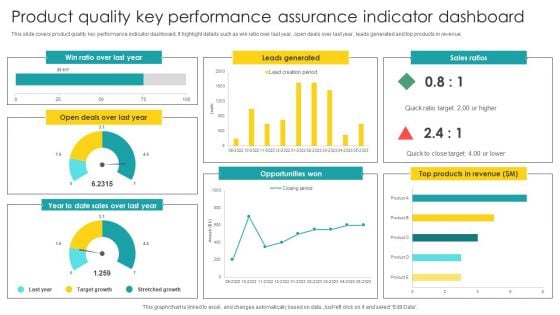
Product Quality Key Performance Assurance Indicator Dashboard Graphics PDF
Showcasing this set of slides titled Product Quality Key Performance Assurance Indicator Dashboard Graphics PDF. The topics addressed in these templates are Key Performance, Assurance Indicator, Dashboard. All the content presented in this PPT design is completely editable. Download it and make adjustments in color, background, font etc. as per your unique business setting.
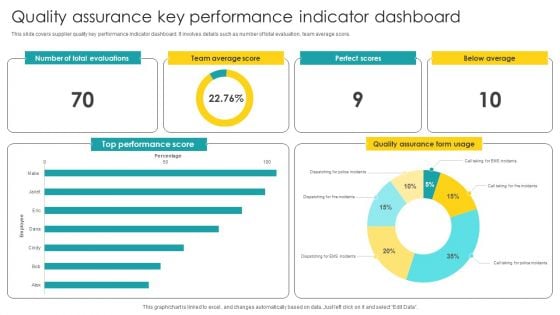
Quality Assurance Key Performance Indicator Dashboard Structure PDF
Showcasing this set of slides titled Quality Assurance Key Performance Indicator Dashboard Structure PDF. The topics addressed in these templates are Key Performance, Indicator Dashboard. All the content presented in this PPT design is completely editable. Download it and make adjustments in color, background, font etc. as per your unique business setting.
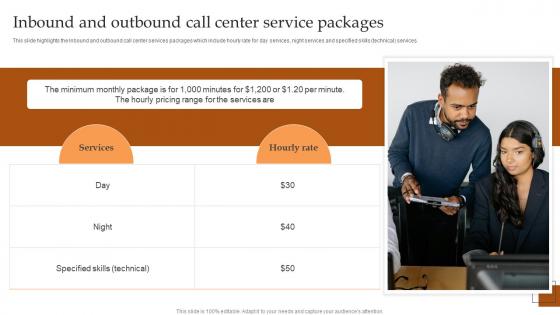
Inbound And Outbound Call Center Service Packages IT And Tech Support Business Background Pdf
This slide highlights the Inbound and outbound call center services packages which include hourly rate for day services, night services and specified skills technical services. Are you searching for a Inbound And Outbound Call Center Service Packages IT And Tech Support Business Background Pdf that is uncluttered, straightforward, and original It is easy to edit, and you can change the colors to suit your personal or business branding. For a presentation that expresses how much effort you have put in, this template is ideal With all of its features, including tables, diagrams, statistics, and lists, it is perfect for a business plan presentation. Make your ideas more appealing with these professional slides. Download Inbound And Outbound Call Center Service Packages IT And Tech Support Business Background Pdf from Slidegeeks today. This slide highlights the Inbound and outbound call center services packages which include hourly rate for day services, night services and specified skills technical services.
Sales Key Performance Indicators Dashboard Ppt PowerPoint Presentation Icon PDF
Presenting this set of slides with name sales key performance indicators dashboard ppt powerpoint presentation icon pdf. The topics discussed in these slides are current ticket volume, sales key performance, indicators dashboard. This is a completely editable PowerPoint presentation and is available for immediate download. Download now and impress your audience.
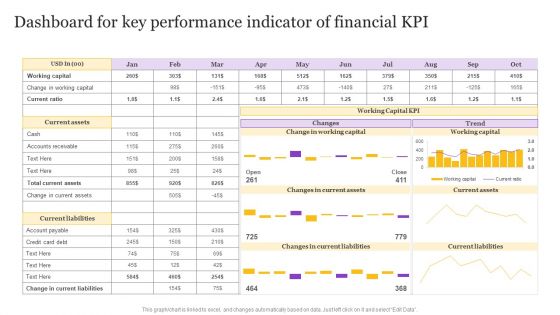
Dashboard For Key Performance Indicator Of Financial KPI Background PDF
Pitch your topic with ease and precision using this Dashboard For Key Performance Indicator Of Financial KPI Background PDF. This layout presents information on Dashboard For Key, Performance Indicator, Financial KPI. It is also available for immediate download and adjustment. So, changes can be made in the color, design, graphics or any other component to create a unique layout.
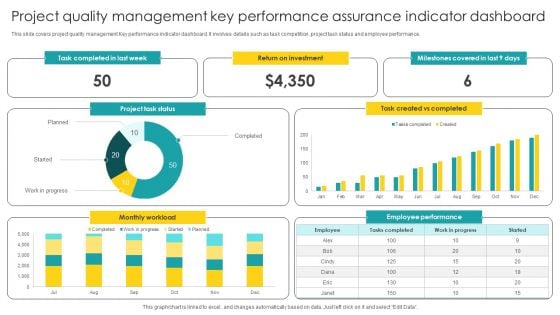
Project Quality Management Key Performance Assurance Indicator Dashboard Guidelines PDF
Pitch your topic with ease and precision using this Project Quality Management Key Performance Assurance Indicator Dashboard Guidelines PDF. This layout presents information on Management Key, Performance Assurance, Indicator Dashboard. It is also available for immediate download and adjustment. So, changes can be made in the color, design, graphics or any other component to create a unique layout.
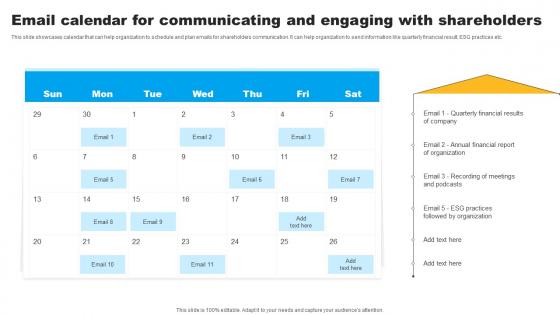
Strategies To Maintain Effective Relationships Email Calendar For Communicating Pictures Pdf
This slide showcases calendar that can help organization to schedule and plan emails for shareholders communication. It can help organization to send information like quarterly financial result, ESG practices etc. Present like a pro with Strategies To Maintain Effective Relationships Email Calendar For Communicating Pictures Pdf Create beautiful presentations together with your team, using our easy-to-use presentation slides. Share your ideas in real-time and make changes on the fly by downloading our templates. So whether you are in the office, on the go, or in a remote location, you can stay in sync with your team and present your ideas with confidence. With Slidegeeks presentation got a whole lot easier. Grab these presentations today. This slide showcases calendar that can help organization to schedule and plan emails for shareholders communication. It can help organization to send information like quarterly financial result, ESG practices etc.


 Continue with Email

 Home
Home


