Daily Snapshot
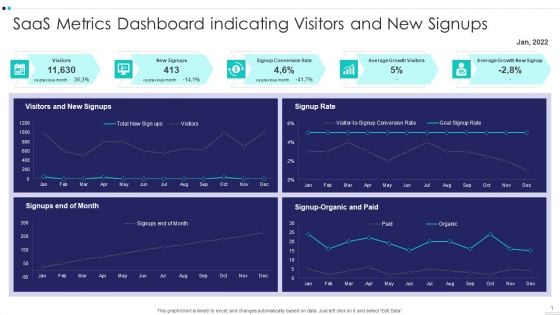
Saas Metrics Dashboard Indicating Visitors And New Signups Elements PDF
Pitch your topic with ease and precision using this Saas Metrics Dashboard Indicating Visitors And New Signups Elements PDF This layout presents information on Saas Metrics Dashboard Indicating Visitors And New Signups It is also available for immediate download and adjustment. So, changes can be made in the color, design, graphics or any other component to create a unique layout.
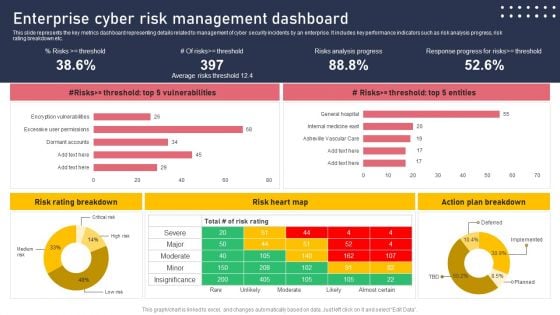
Enterprise Cyber Risk Management Dashboard Sample PDF
This slide represents the key metrics dashboard representing details related to management of cyber security incidents by an enterprise. It includes key performance indicators such as risk analysis progress, risk rating breakdown etc. There are so many reasons you need a Enterprise Cyber Risk Management Dashboard Sample PDF. The first reason is you cannot spend time making everything from scratch, Thus, Slidegeeks has made presentation templates for you too. You can easily download these templates from our website easily.
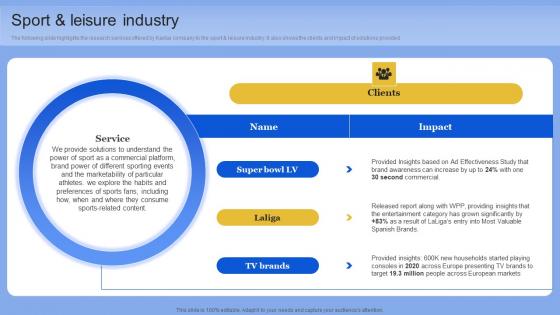
Sport And Leisure Industry Data Analytics Company Outline Pictures PDF
The following slide highlights the research services offered by Kantar company to the sport and leisure industry. It also shows the clients and impact of solutions provided. This Sport And Leisure Industry Data Analytics Company Outline Pictures PDF from Slidegeeks makes it easy to present information on your topic with precision. It provides customization options, so you can make changes to the colors, design, graphics, or any other component to create a unique layout. It is also available for immediate download, so you can begin using it right away. Slidegeeks has done good research to ensure that you have everything you need to make your presentation stand out. Make a name out there for a brilliant performance. The following slide highlights the research services offered by Kantar company to the sport and leisure industry. It also shows the clients and impact of solutions provided
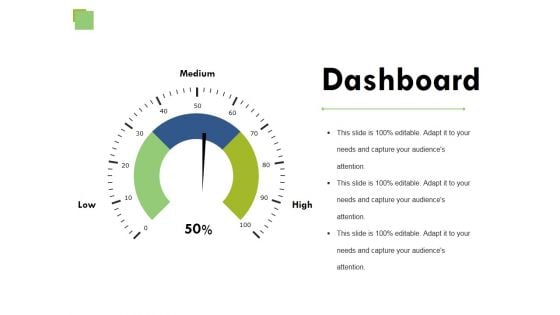
Dashboard Ppt PowerPoint Presentation Outline Aids
This is a dashboard ppt powerpoint presentation outline aids. This is a three stage process. The stages in this process are business, marketing, strategy, finance, planning.
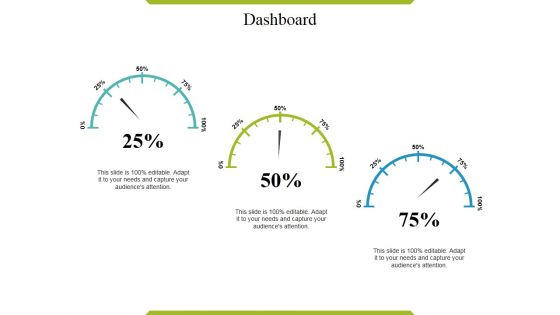
Dashboard Ppt PowerPoint Presentation Inspiration Graphics
This is a dashboard ppt powerpoint presentation inspiration graphics. This is a three stage process. The stages in this process are business, marketing, strategy, finance, planning.
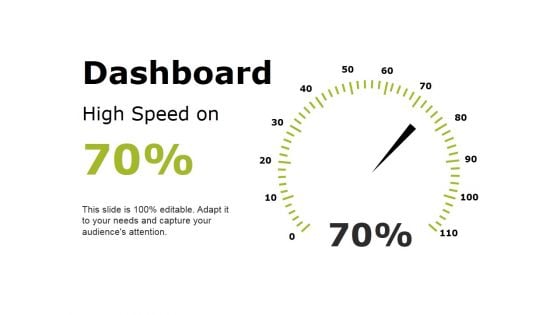
Dashboard Ppt PowerPoint Presentation Styles Visual Aids
This is a dashboard ppt powerpoint presentation styles visual aids. This is a one stage process. The stages in this process are business, marketing, finance, planning, strategy.
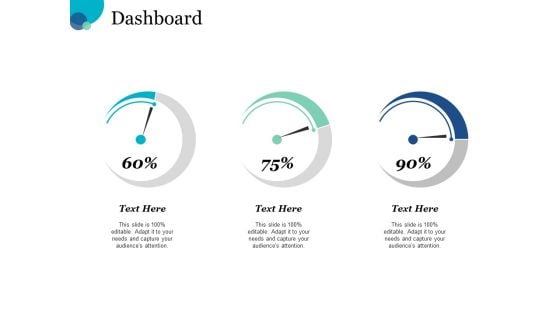
Dashboard Financial Ppt PowerPoint Presentation File Gridlines
This is a dashboard financial ppt powerpoint presentation file gridlines. This is a three stage process. The stages in this process are business, management, planning, strategy, marketing.
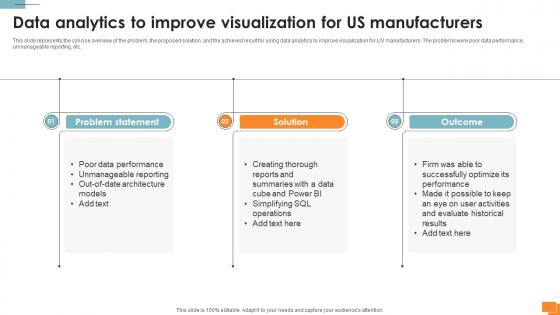
Statistical Tools For Evidence Data Analytics To Improve Visualization For Us Manufacturers
This slide represents the concise overview of the problem, the proposed solution, and the achieved result for using data analytics to improve visualization for US manufacturers. The problems were poor data performance, unmanageable reporting, etc. Crafting an eye-catching presentation has never been more straightforward. Let your presentation shine with this tasteful yet straightforward Statistical Tools For Evidence Data Analytics To Improve Visualization For Us Manufacturers template. It offers a minimalistic and classy look that is great for making a statement. The colors have been employed intelligently to add a bit of playfulness while still remaining professional. Construct the ideal Statistical Tools For Evidence Data Analytics To Improve Visualization For Us Manufacturers that effortlessly grabs the attention of your audience Begin now and be certain to wow your customers This slide represents the concise overview of the problem, the proposed solution, and the achieved result for using data analytics to improve visualization for US manufacturers. The problems were poor data performance, unmanageable reporting, etc.
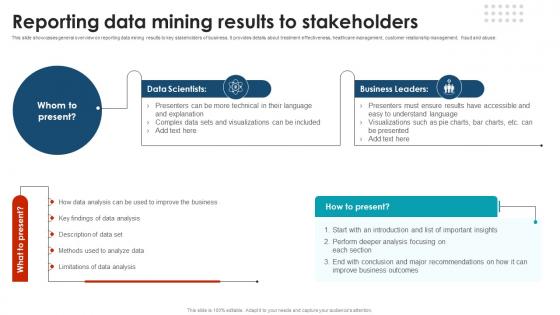
Reporting Data Mining Results To Stakeholders Using Data Mining Tools To Optimize Processes AI SS V
This slide showcases general overview on reporting data mining results to key stakeholders of business. It provides details about treatment effectiveness, healthcare management, customer relationship management, fraud and abuse. Here you can discover an assortment of the finest PowerPoint and Google Slides templates. With these templates, you can create presentations for a variety of purposes while simultaneously providing your audience with an eye-catching visual experience. Download Reporting Data Mining Results To Stakeholders Using Data Mining Tools To Optimize Processes AI SS V to deliver an impeccable presentation. These templates will make your job of preparing presentations much quicker, yet still, maintain a high level of quality. Slidegeeks has experienced researchers who prepare these templates and write high-quality content for you. Later on, you can personalize the content by editing the Reporting Data Mining Results To Stakeholders Using Data Mining Tools To Optimize Processes AI SS V. This slide showcases general overview on reporting data mining results to key stakeholders of business. It provides details about treatment effectiveness, healthcare management, customer relationship management, fraud and abuse.
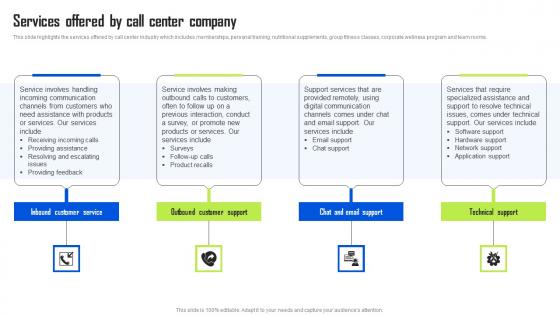
Services Offered By Call Center Company BPO Center Business Plan Clipart Pdf
This slide highlights the services offered by call center industry which includes memberships, personal training, nutritional supplements, group fitness classes, corporate wellness program and team rooms. This Services Offered By Call Center Company BPO Center Business Plan Clipart Pdf from Slidegeeks makes it easy to present information on your topic with precision. It provides customization options, so you can make changes to the colors, design, graphics, or any other component to create a unique layout. It is also available for immediate download, so you can begin using it right away. Slidegeeks has done good research to ensure that you have everything you need to make your presentation stand out. Make a name out there for a brilliant performance. This slide highlights the services offered by call center industry which includes memberships, personal training, nutritional supplements, group fitness classes, corporate wellness program and team rooms.
Clock With Calendar Task Scheduler Vector Icon Ppt PowerPoint Presentation Model Structure PDF
Presenting this set of slides with name clock with calendar task scheduler vector icon ppt powerpoint presentation model structure pdf. This is a three stage process. The stages in this process are clock with calendar task scheduler vector icon. This is a completely editable PowerPoint presentation and is available for immediate download. Download now and impress your audience.
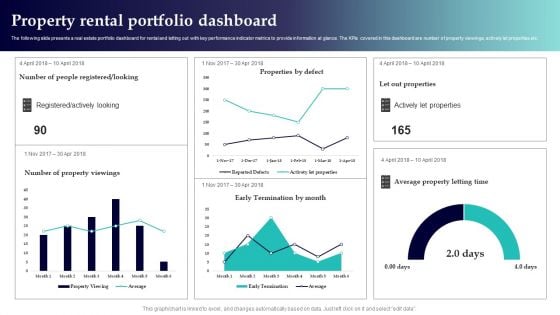
Property Rental Portfolio Dashboard Topics PDF
The following slide presents a real estate portfolio dashboard for rental and letting out with key performance indicator metrics to provide information at glance. The KPIs covered in this dashboard are number of property viewings, actively let properties etc. Showcasing this set of slides titled Property Rental Portfolio Dashboard Topics PDF. The topics addressed in these templates are People Registered Looking, Actively Let Properties, Average Property Letting Time. All the content presented in this PPT design is completely editable. Download it and make adjustments in color, background, font etc. as per your unique business setting.
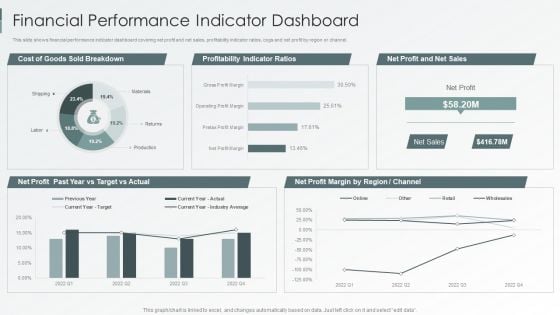
Enterprise Sustainability Performance Metrics Financial Performance Indicator Dashboard Themes PDF
This slide shows financial performance indicator dashboard covering net profit and net sales, profitability indicator ratios, cogs and net profit by region or channel.Deliver an awe inspiring pitch with this creative Enterprise Sustainability Performance Metrics Financial Performance Indicator Dashboard Themes PDF bundle. Topics like Profitability Indicator, Sold Breakdown, Target Actual can be discussed with this completely editable template. It is available for immediate download depending on the needs and requirements of the user.
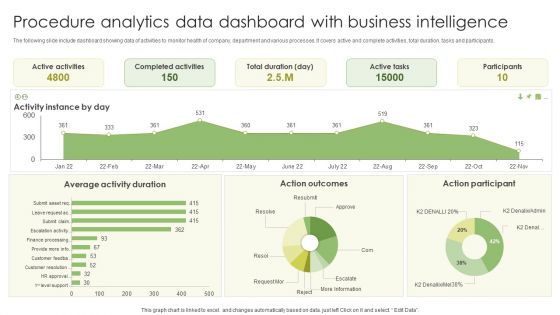
Procedure Analytics Data Dashboard With Business Intelligence Slides PDF
The following slide include dashboard showing data of activities to monitor health of company, department and various processes. It covers active and complete activities, total duration, tasks and participants. Pitch your topic with ease and precision using this Procedure Analytics Data Dashboard With Business Intelligence Slides PDF. This layout presents information on Active Activities, Completed Activities, Active Tasks . It is also available for immediate download and adjustment. So, changes can be made in the color, design, graphics or any other component to create a unique layout.
Sales L2RM System Tracking Key Metrics Dashboard Ppt Professional Format Ideas PDF
This slide represents the dashboard for tracking the key performance indicators of sales lead to revenue management. It includes key metrics such as leads by campaign, ratings, lead generation rate, top accounts by revenue and top owners by number of accounts. Showcasing this set of slides titled Sales L2RM System Tracking Key Metrics Dashboard Ppt Professional Format Ideas PDF. The topics addressed in these templates are Leads By Campaign, Leads By Rating, Leads Generation Rate. All the content presented in this PPT design is completely editable. Download it and make adjustments in color, background, font etc. as per your unique business setting.
Inclusive Workplace Training Program Dei Tracking And Reporting Analysis Dashboard DTE SS V
The purpose of this slide is to highlight real-time metrics for effective evaluation and optimization of diversity, equity, and inclusion initiatives. Get a simple yet stunning designed Inclusive Workplace Training Program Dei Tracking And Reporting Analysis Dashboard DTE SS V. It is the best one to establish the tone in your meetings. It is an excellent way to make your presentations highly effective. So, download this PPT today from Slidegeeks and see the positive impacts. Our easy-to-edit Inclusive Workplace Training Program Dei Tracking And Reporting Analysis Dashboard DTE SS V can be your go-to option for all upcoming conferences and meetings. So, what are you waiting for Grab this template today. The purpose of this slide is to highlight real-time metrics for effective evaluation and optimization of diversity, equity, and inclusion initiatives.

Current IT Infrastructure Assessment Report Data Migration From On Premises
This slide showcases assessment of existing IT infrastructure which includes hardware, software, network and storage hubs, web servers, routers, database servers etc. If your project calls for a presentation, then Slidegeeks is your go-to partner because we have professionally designed, easy-to-edit templates that are perfect for any presentation. After downloading, you can easily edit Current IT Infrastructure Assessment Report Data Migration From On Premises and make the changes accordingly. You can rearrange slides or fill them with different images. Check out all the handy templates This slide showcases assessment of existing IT infrastructure which includes hardware, software, network and storage hubs, web servers, routers, database servers etc.
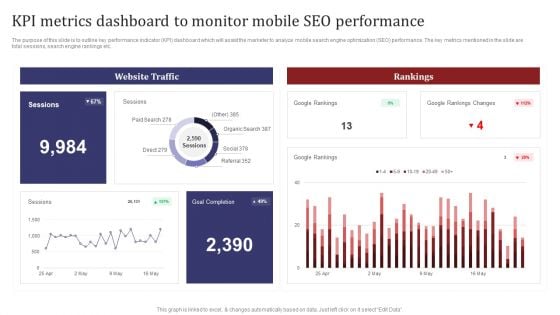
Mobile Search Engine Optimization Plan KPI Metrics Dashboard To Monitor Mobile SEO Performance Inspiration PDF
The purpose of this slide is to outline key performance indicator KPI dashboard which will assist the marketer to analyze mobile search engine optimization SEO performance. The key metrics mentioned in the slide are total sessions, search engine rankings etc. This Mobile Search Engine Optimization Plan KPI Metrics Dashboard To Monitor Mobile SEO Performance Inspiration PDF from Slidegeeks makes it easy to present information on your topic with precision. It provides customization options, so you can make changes to the colors, design, graphics, or any other component to create a unique layout. It is also available for immediate download, so you can begin using it right away. Slidegeeks has done good research to ensure that you have everything you need to make your presentation stand out. Make a name out there for a brilliant performance.
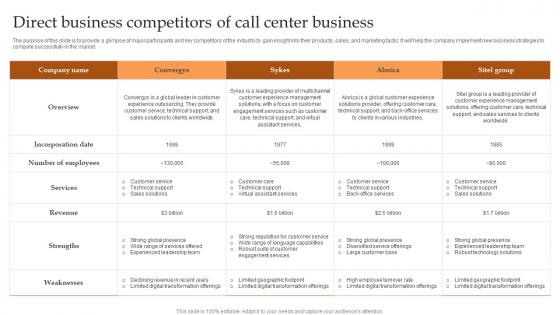
Direct Business Competitors Of Call Center Business IT And Tech Support Business Designs Pdf
The purpose of this slide is to provide a glimpse of major participants and key competitors of the industry to gain insight into their products, sales, and marketing tactic. It will help the company implement new business strategies to compete successfully in the market. Welcome to our selection of the Direct Business Competitors Of Call Center Business IT And Tech Support Business Designs Pdf These are designed to help you showcase your creativity and bring your sphere to life. Planning and Innovation are essential for any business that is just starting out. This collection contains the designs that you need for your everyday presentations. All of our PowerPoints are 100 percent editable, so you can customize them to suit your needs. This multi-purpose template can be used in various situations. Grab these presentation templates today. The purpose of this slide is to provide a glimpse of major participants and key competitors of the industry to gain insight into their products, sales, and marketing tactic. It will help the company implement new business strategies to compete successfully in the market.
Icons Slide For Global Data Security Industry Report IR SS V
Introducing our well designed Icons Slide For Global Data Security Industry Report IR SS V set of slides. The slide displays editable icons to enhance your visual presentation. The icons can be edited easily. So customize according to your business to achieve a creative edge. Download and share it with your audience. Our Icons Slide For Global Data Security Industry Report IR SS V are topically designed to provide an attractive backdrop to any subject. Use them to look like a presentation pro.
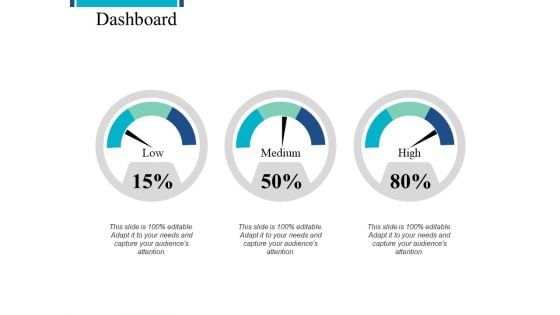
Dashboard Low Medium Ppt PowerPoint Presentation Inspiration Ideas
This is a dashboard low medium ppt powerpoint presentation inspiration ideas. This is a three stage process. The stages in this process are low, medium, high, business, planning.
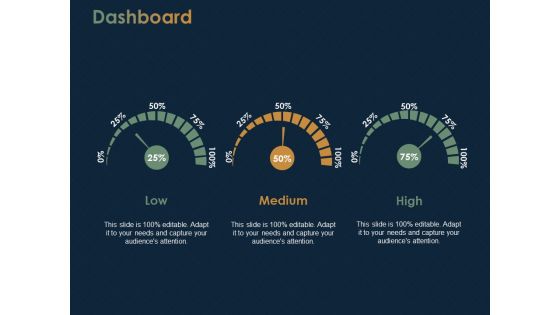
Dashboard Low Medium Ppt PowerPoint Presentation Portfolio Outfit
This is a dashboard low medium ppt powerpoint presentation portfolio outfit. This is a three stage process. The stages in this process are low, medium, high, business, planning.
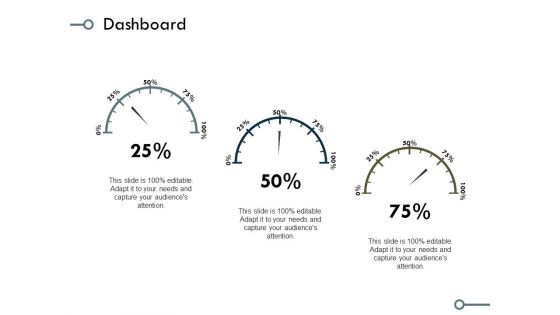
Dashboard Marketing Ppt PowerPoint Presentation Portfolio Graphics Template
This is a dashboard marketing ppt powerpoint presentation portfolio graphics template. This is a three stage process. The stages in this process are business, planning, strategy, marketing, management.

Bar Chart With Magnifying Glass For Financial Analysis Ppt Powerpoint Presentation Infographics Designs Download
This is a bar chart with magnifying glass for financial analysis ppt powerpoint presentation infographics designs download. This is a three stage process. The stages in this process are business metrics, business kpi, business dashboard.
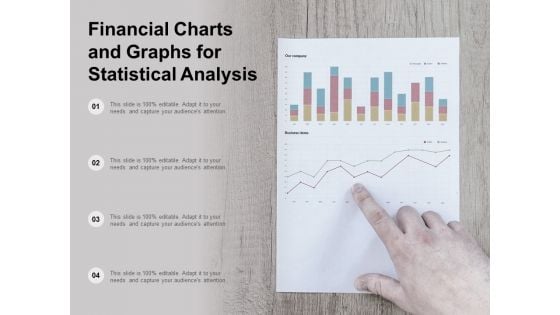
Financial Charts And Graphs For Statistical Analysis Ppt Powerpoint Presentation Show Layout
This is a financial charts and graphs for statistical analysis ppt powerpoint presentation show layout. This is a four stage process. The stages in this process are business metrics, business kpi, business dashboard.
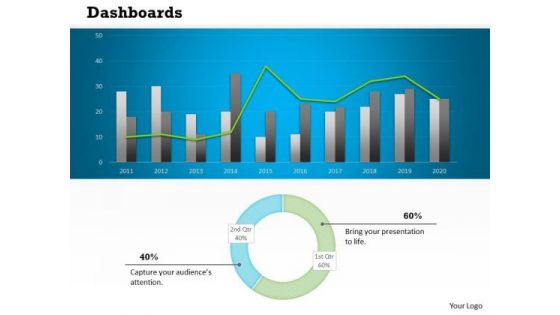
Sales Diagram Business Charts Dashboard Design Strategic Management
Put In A Dollop Of Our Sales Diagram Business Charts Dashboard Design Strategic Management Powerpoint Templates. Give Your Thoughts A Distinctive Flavor.
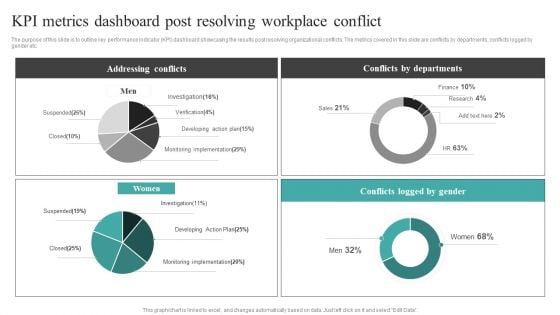
Common Conflict Situations Kpi Metrics Dashboard Post Resolving Workplace Information PDF
The purpose of this slide is to outline key performance indicator KPI dashboard showcasing the results post resolving organizational conflicts. The metrics covered in this slide are conflicts by departments, conflicts logged by gender etc. The Common Conflict Situations Kpi Metrics Dashboard Post Resolving Workplace Information PDF is a compilation of the most recent design trends as a series of slides. It is suitable for any subject or industry presentation, containing attractive visuals and photo spots for businesses to clearly express their messages. This template contains a variety of slides for the user to input data, such as structures to contrast two elements, bullet points, and slides for written information. Slidegeeks is prepared to create an impression.
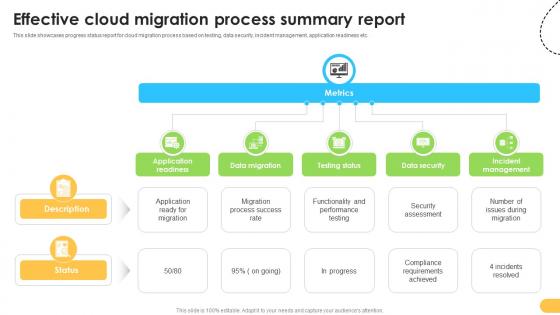
Effective Cloud Migration Process Summary Report Data Migration From On Premises
This slide showcases progress status report for cloud migration process based on testing, data security, incident management, application readiness etc. Are you in need of a template that can accommodate all of your creative concepts This one is crafted professionally and can be altered to fit any style. Use it with Google Slides or PowerPoint. Include striking photographs, symbols, depictions, and other visuals. Fill, move around, or remove text boxes as desired. Test out color palettes and font mixtures. Edit and save your work, or work with colleagues. Download Effective Cloud Migration Process Summary Report Data Migration From On Premises and observe how to make your presentation outstanding. Give an impeccable presentation to your group and make your presentation unforgettable. This slide showcases progress status report for cloud migration process based on testing, data security, incident management, application readiness etc.
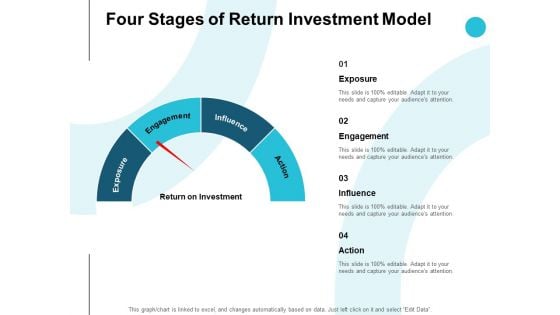
Four Stages Of Return Investment Model Ppt PowerPoint Presentation Pictures Background Image
Presenting this set of slides with name four stages of return investment model ppt powerpoint presentation pictures background image. This is a four stage process. The stages in this process are dashboard, marketing, process, management, planning. This is a completely editable PowerPoint presentation and is available for immediate download. Download now and impress your audience.
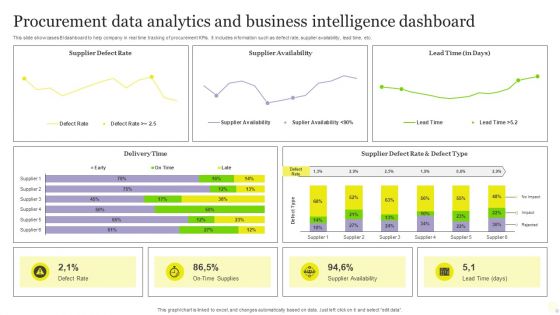
Procurement Data Analytics And Business Intelligence Dashboard Pictures PDF
This slide showcases BI dashboard to help company in real time tracking of procurement KPIs. It includes information such as defect rate, supplier availability, lead time, etc. Pitch your topic with ease and precision using this Procurement Data Analytics And Business Intelligence Dashboard Pictures PDF. This layout presents information on Procurement Data Analytics, Business Intelligence Dashboard. It is also available for immediate download and adjustment. So, changes can be made in the color, design, graphics or any other component to create a unique layout.
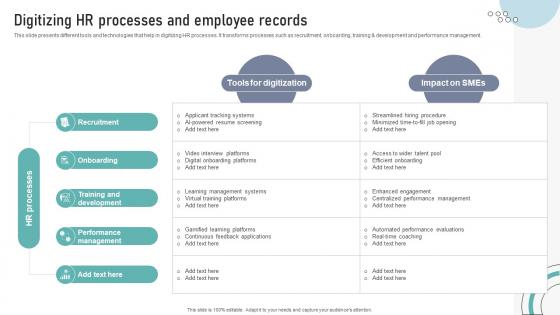
Digitizing HR Processes And Employee Records DT SS V
This slide presents different tools and technologies that help in digitizing HR processes. It transforms processes such as recruitment, onboarding, training and development and performance management.The Digitizing HR Processes And Employee Records DT SS V is a compilation of the most recent design trends as a series of slides. It is suitable for any subject or industry presentation, containing attractive visuals and photo spots for businesses to clearly express their messages. This template contains a variety of slides for the user to input data, such as structures to contrast two elements, bullet points, and slides for written information. Slidegeeks is prepared to create an impression. This slide presents different tools and technologies that help in digitizing HR processes. It transforms processes such as recruitment, onboarding, training and development and performance management.
Employee Training And Development Plan Performance Tracking Dashboard Portrait PDF
Mentioned slide outlines key performance indicator KPI dashboard which can be used by organization to monitor training and development strategies. The major metrics covered in the template are cost per participant, per hour, number of trainees , etc. Showcasing this set of slides titled Employee Training And Development Plan Performance Tracking Dashboard Portrait PDF. The topics addressed in these templates are Employee Training, Development Plan Performance, Tracking Dashboard. All the content presented in this PPT design is completely editable. Download it and make adjustments in color, background, font etc. as per your unique business setting.
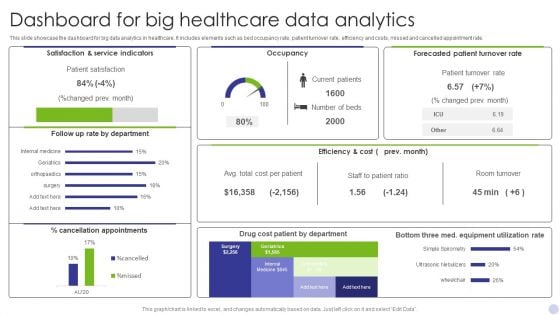
Dashboard For Big Healthcare Data Analytics Graphics PDF
This slide showcase the dashboard for big data analytics in healthcare. It includes elements such as bed occupancy rate, patient turnover rate, efficiency and costs, missed and cancelled appointment rate. Showcasing this set of slides titled Dashboard For Big Healthcare Data Analytics Graphics PDF. The topics addressed in these templates are Satisfaction Service Indicators, Occupancy, Forecasted Patient Turnover. All the content presented in this PPT design is completely editable. Download it and make adjustments in color, background, font etc. as per your unique business setting.
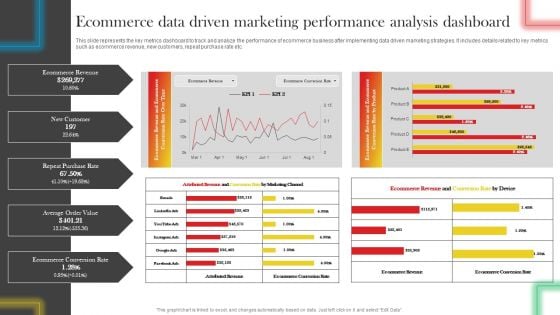
Ecommerce Data Driven Marketing Performance Analysis Dashboard Professional PDF
This slide represents the key metrics dashboard to track and analyze the performance of ecommerce business after implementing data driven marketing strategies. It includes details related to key metrics such as ecommerce revenue, new customers, repeat purchase rate etc. Get a simple yet stunning designed Ecommerce Data Driven Marketing Performance Analysis Dashboard Professional PDF. It is the best one to establish the tone in your meetings. It is an excellent way to make your presentations highly effective. So, download this PPT today from Slidegeeks and see the positive impacts. Our easy-to-edit Ecommerce Data Driven Marketing Performance Analysis Dashboard Professional PDF can be your go-to option for all upcoming conferences and meetings. So, what are you waiting for Grab this template today.
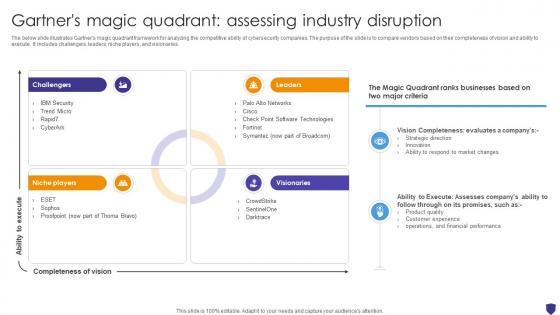
Global Data Security Industry Report Gartners Magic Quadrant Assessing Industry Disruption IR SS V
The below slide illustrates Gartners magic quadrant framework for analyzing the competitive ability of cybersecurity companies. The purpose of the slide is to compare vendors based on their completeness of vision and ability to execute. It includes challengers, leaders, niche players, and visionaries. Find highly impressive Global Data Security Industry Report Gartners Magic Quadrant Assessing Industry Disruption IR SS V on Slidegeeks to deliver a meaningful presentation. You can save an ample amount of time using these presentation templates. No need to worry to prepare everything from scratch because Slidegeeks experts have already done a huge research and work for you. You need to download Global Data Security Industry Report Gartners Magic Quadrant Assessing Industry Disruption IR SS V for your upcoming presentation. All the presentation templates are 100 percent editable and you can change the color and personalize the content accordingly. Download now The below slide illustrates Gartners magic quadrant framework for analyzing the competitive ability of cybersecurity companies. The purpose of the slide is to compare vendors based on their completeness of vision and ability to execute. It includes challengers, leaders, niche players, and visionaries.
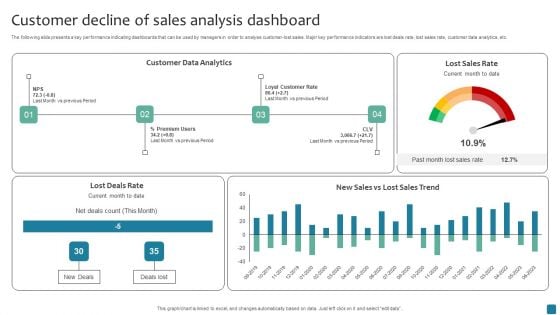
Customer Decline Of Sales Analysis Dashboard Rules PDF
The following slide presents a key performance indicating dashboards that can be used by managers in order to analyse customer-lost sales. Major key performance indicators are lost deals rate, lost sales rate, customer data analytics, etc. Pitch your topic with ease and precision using this Customer Decline Of Sales Analysis Dashboard Rules PDF. This layout presents information on Customer Data Analytics. It is also available for immediate download and adjustment. So, changes can be made in the color, design, graphics or any other component to create a unique layout.
Important Kpis For Tracking Cloud Data Intelligence Sample Pdf
This slide covers the top key performance indicators KPIs for tracking data analytics. The purpose of this template is to provide an overview of the KPIs that can help assess the effectiveness, adoption, accuracy, and efficiency of data analytics initiatives. It includes stat driven targets and actionable steps. Pitch your topic with ease and precision using this Important Kpis For Tracking Cloud Data Intelligence Sample Pdf. This layout presents information on Analytics Regularly, Generate Insights, Optimize Workflows. It is also available for immediate download and adjustment. So, changes can be made in the color, design, graphics or any other component to create a unique layout. This slide covers the top key performance indicators KPIs for tracking data analytics. The purpose of this template is to provide an overview of the KPIs that can help assess the effectiveness, adoption, accuracy, and efficiency of data analytics initiatives. It includes stat driven targets and actionable steps.

Global Data Security Industry Report Csr Initiatives Taken By Companies In Cybersecurity Industry IR SS V
The slide outlines CSR initiatives undertaken by the cybersecurity industry. The purpose of the slide is to encourage ethical practices, social responsibility, and sustainable development. The key components include cybersecurity education and training, community engagement. From laying roadmaps to briefing everything in detail, our templates are perfect for you. You can set the stage with your presentation slides. All you have to do is download these easy-to-edit and customizable templates. Global Data Security Industry Report Csr Initiatives Taken By Companies In Cybersecurity Industry IR SS V will help you deliver an outstanding performance that everyone would remember and praise you for. Do download this presentation today. The slide outlines CSR initiatives undertaken by the cybersecurity industry. The purpose of the slide is to encourage ethical practices, social responsibility, and sustainable development. The key components include cybersecurity education and training, community engagement.
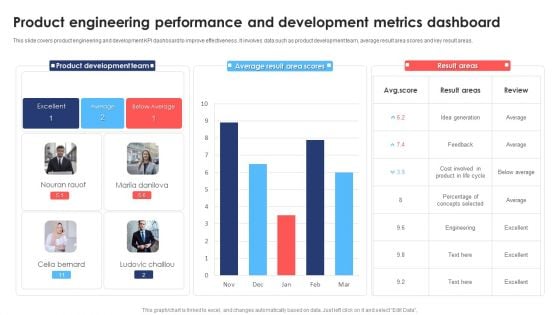
Product Engineering Performance And Development Metrics Dashboard Topics PDF
This slide covers product engineering and development KPI dashboard to improve effectiveness. It involves data such as product development team, average result area scores and key result areas. Showcasing this set of slides titled Product Engineering Performance And Development Metrics Dashboard Topics PDF. The topics addressed in these templates are Product Development Team, Average, Cost. All the content presented in this PPT design is completely editable. Download it and make adjustments in color, background, font etc. as per your unique business setting.
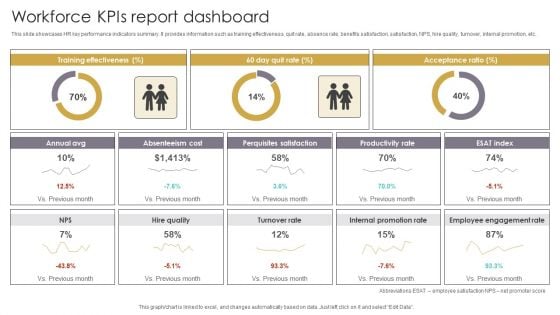
Workforce Kpis Report Dashboard Slides PDF
This slide showcases HR key performance indicators summary. It provides information such as training effectiveness, quit rate, absence rate, benefits satisfaction, satisfaction, NPS, hire quality, turnover, internal promotion, etc. Pitch your topic with ease and precision using this Workforce Kpis Report Dashboard Slides PDF. This layout presents information on Acceptance Ratio, Absenteeism Cost, Perquisites Satisfaction. It is also available for immediate download and adjustment. So, changes can be made in the color, design, graphics or any other component to create a unique layout.

Global Data Security Industry Report Growth And Future Prospects In The Cybersecurity Industry IR SS V
The slide highlights the future outlook and potential for the cybersecurity industry. The purpose of the slide is to inform stakeholders regarding growth opportunities, creating a compelling case for investment and collaboration. It covers drivers, trends, and the revolutionary impact of the industry. Are you in need of a template that can accommodate all of your creative concepts This one is crafted professionally and can be altered to fit any style. Use it with Google Slides or PowerPoint. Include striking photographs, symbols, depictions, and other visuals. Fill, move around, or remove text boxes as desired. Test out color palettes and font mixtures. Edit and save your work, or work with colleagues. Download Global Data Security Industry Report Growth And Future Prospects In The Cybersecurity Industry IR SS V and observe how to make your presentation outstanding. Give an impeccable presentation to your group and make your presentation unforgettable. The slide highlights the future outlook and potential for the cybersecurity industry. The purpose of the slide is to inform stakeholders regarding growth opportunities, creating a compelling case for investment and collaboration. It covers drivers, trends, and the revolutionary impact of the industry.
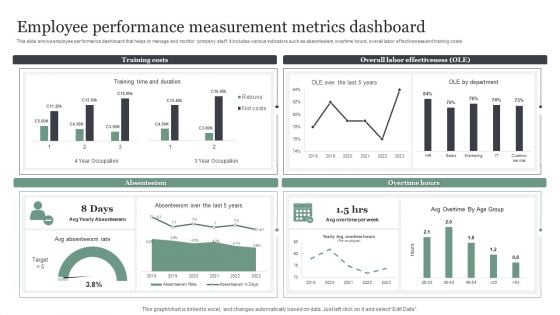
Employee Performance Measurement Metrics Dashboard Brochure PDF
This slide shows employee performance dashboard that helps to manage and monitor company staff. It includes various indicators such as absenteeism, overtime hours, overall labor effectiveness and training costs. Showcasing this set of slides titled Employee Performance Measurement Metrics Dashboard Brochure PDF. The topics addressed in these templates are Training Costs, Overall Labor Effectiveness. All the content presented in this PPT design is completely editable. Download it and make adjustments in color, background, font etc. as per your unique business setting.
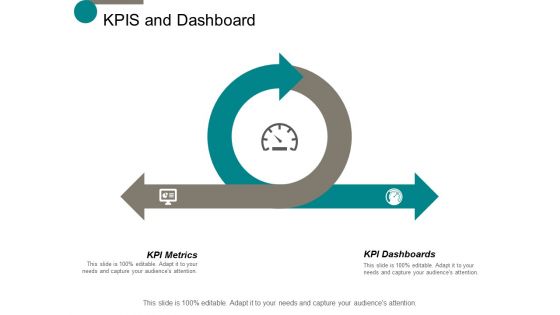
Kpis And Dashboard Ppt Powerpoint Presentation Infographic Template Portfolio
This is a kpis and dashboard ppt powerpoint presentation infographic template portfolio. This is a two stage process. The stages in this process are business, management, planning, strategy, marketing.
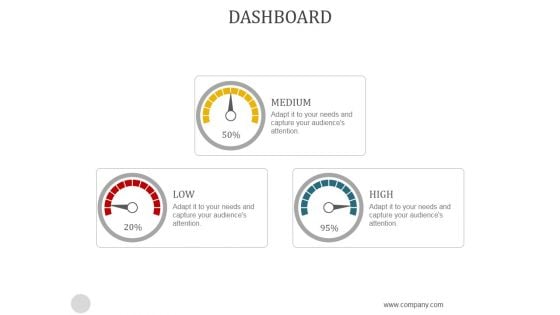
Dashboard Ppt PowerPoint Presentation Samples
This is a dashboard ppt powerpoint presentation samples. This is a three stage process. The stages in this process are medium, low, high.
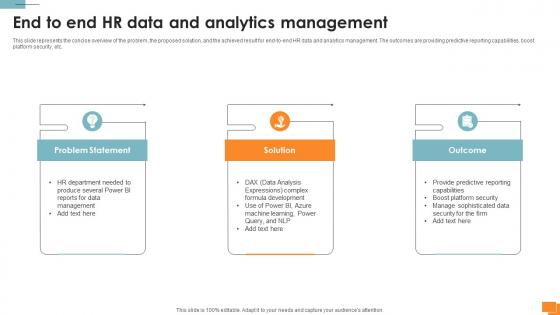
Statistical Tools For Evidence End To End HR Data And Analytics Management
This slide represents the concise overview of the problem, the proposed solution, and the achieved result for end-to-end HR data and analytics management. The outcomes are providing predictive reporting capabilities, boost platform security, etc. Coming up with a presentation necessitates that the majority of the effort goes into the content and the message you intend to convey. The visuals of a PowerPoint presentation can only be effective if it supplements and supports the story that is being told. Keeping this in mind our experts created Statistical Tools For Evidence End To End HR Data And Analytics Management to reduce the time that goes into designing the presentation. This way, you can concentrate on the message while our designers take care of providing you with the right template for the situation. This slide represents the concise overview of the problem, the proposed solution, and the achieved result for end-to-end HR data and analytics management. The outcomes are providing predictive reporting capabilities, boost platform security, etc.

HR Analytics Metrics For Data Driven Decision Summary Pdf
This slide illustrates human resource key performance indicators that help organization to analyze actionable insights for taking effective and date driven decision. It includes KPIs such as recruitment, employee engagement, retention and diversity and inclusion.Pitch your topic with ease and precision using this HR Analytics Metrics For Data Driven Decision Summary Pdf This layout presents information on Estimate Accumulated, Involved Recruitment, Provide Actionable Insight It is also available for immediate download and adjustment. So, changes can be made in the color, design, graphics or any other component to create a unique layout. This slide illustrates human resource key performance indicators that help organization to analyze actionable insights for taking effective and date driven decision. It includes KPIs such as recruitment, employee engagement, retention and diversity and inclusion.
Customer Satisfaction Levels High Medium Low Indicator Dashboard Ppt PowerPoint Presentation Icon Show
This is a customer satisfaction levels high medium low indicator dashboard ppt powerpoint presentation icon show. This is a six stage process. The stages in this process are performance dashboard, performance meter, performance kpi.

Low High Performance Measurement Indicator Dashboard Ppt PowerPoint Presentation Summary Images
This is a low high performance measurement indicator dashboard ppt powerpoint presentation summary images. This is a five stage process. The stages in this process are performance dashboard, performance meter, performance kpi.
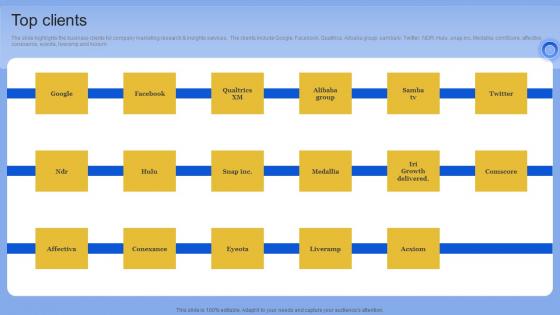
Top Clients Data Analytics Company Outline Pictures PDF
The slide highlights the business clients for company marketing research and insights services. The clients include Google, Facebook, Qualtrics, Alibaba group, samba tv, Twitter, NDR, Hulu, snap.inc, Medallia, comScore, affective, conexance, eyeota, liveramp and Acxiom Find a pre-designed and impeccable Top Clients Data Analytics Company Outline Pictures PDF The templates can ace your presentation without additional effort. You can download these easy-to-edit presentation templates to make your presentation stand out from others. So, what are you waiting for Download the template from Slidegeeks today and give a unique touch to your presentation. The slide highlights the business clients for company marketing research and insights services. The clients include Google, Facebook, Qualtrics, Alibaba group, samba tv, Twitter, NDR, Hulu, snap.inc, Medallia, comScore, affective, conexance, eyeota, liveramp and Acxiom
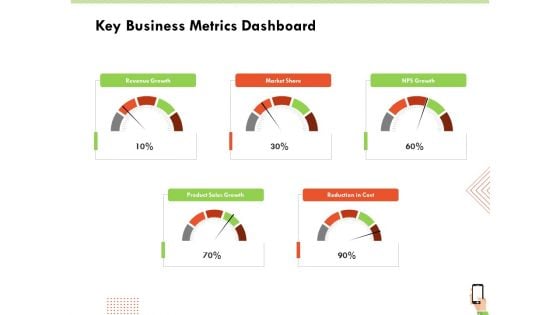
Multi Channel Online Commerce Key Business Metrics Dashboard Background PDF
Deliver and pitch your topic in the best possible manner with this multi channel online commerce key business metrics dashboard background pdf. Use them to share invaluable insights on revenue, market, sales, growth, cost and impress your audience. This template can be altered and modified as per your expectations. So, grab it now.
Icon For Project Transition Plan Timeline Guidelines PDF
Persuade your audience using this icon for project transition plan timeline guidelines pdf. This PPT design covers three stages, thus making it a great tool to use. It also caters to a variety of topics including icon for project transition plan timeline. Download this PPT design now to present a convincing pitch that not only emphasizes the topic but also showcases your presentation skills.
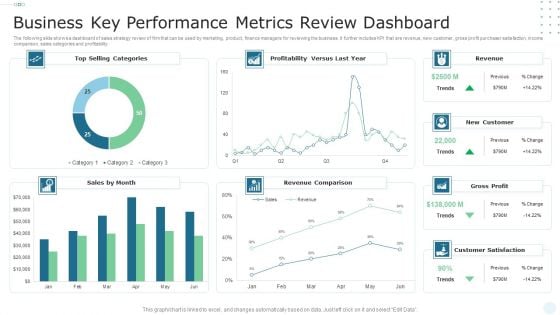
Business Key Performance Metrics Review Dashboard Portrait PDF
The following slide shows a dashboard of sales strategy review of firm that can be used by marketing, product, finance managers for reviewing the business. It further includes KPI that are revenue, new customer, gross profit purchaser satisfaction, income comparison, sales categories and profitability. Showcasing this set of slides titled Business Key Performance Metrics Review Dashboard Portrait PDF. The topics addressed in these templates are Sales, Revenue Comparison, Profitability. All the content presented in this PPT design is completely editable. Download it and make adjustments in color, background, font etc. as per your unique business setting.
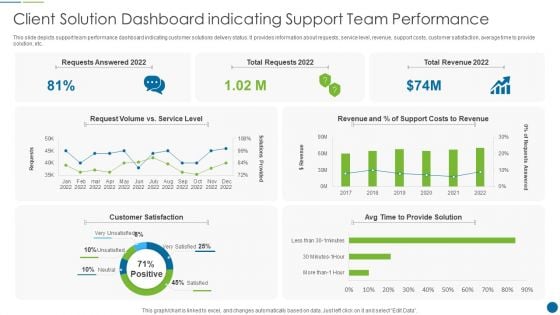
Client Solution Dashboard Indicating Support Team Performance Graphics PDF
This slide depicts support team performance dashboard indicating customer solutions delivery status. It provides information about requests, service level, revenue, support costs, customer satisfaction, average time to provide solution, etc. Showcasing this set of slides titled Client Solution Dashboard Indicating Support Team Performance Graphics PDF. The topics addressed in these templates are Costs, Revenue, Customer. All the content presented in this PPT design is completely editable. Download it and make adjustments in color, background, font etc. as per your unique business setting.
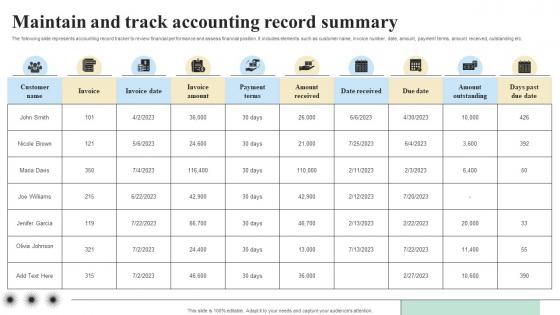
Maintain And Track Accounting Record Objectives And Key Result Methodology For Business
The following slide represents accounting record tracker to review financial performance and assess financial position. It includes elements such as customer name, invoice number, date, amount, payment terms, amount received, outstanding etc. This modern and well-arranged Maintain And Track Accounting Record Objectives And Key Result Methodology For Business provides lots of creative possibilities. It is very simple to customize and edit with the Powerpoint Software. Just drag and drop your pictures into the shapes. All facets of this template can be edited with Powerpoint, no extra software is necessary. Add your own material, put your images in the places assigned for them, adjust the colors, and then you can show your slides to the world, with an animated slide included. The following slide represents accounting record tracker to review financial performance and assess financial position. It includes elements such as customer name, invoice number, date, amount, payment terms, amount received, outstanding etc.
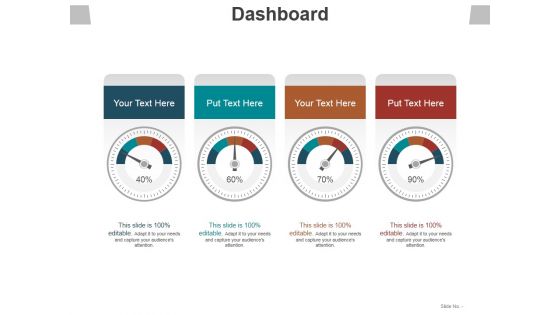
Dashboard Ppt PowerPoint Presentation Pictures Graphic Images
This is a dashboard ppt powerpoint presentation pictures graphic images. This is a four stage process. The stages in this process are dashboard, communication, technology, business, marketing.
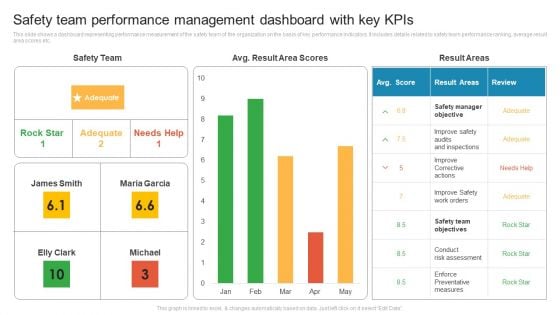
Safety Team Performance Management Dashboard With Key Kpis Rules PDF
This slide shows a dashboard representing performance measurement of the safety team of the organization on the basis of key performance indicators. It includes details related to safety team performance ranking, average result area scores etc. Pitch your topic with ease and precision using this Safety Team Performance Management Dashboard With Key Kpis Rules PDF. This layout presents information on Improve Corrective Actions, Safety Manager Objective, Conduct Risk Assessment. It is also available for immediate download and adjustment. So, changes can be made in the color, design, graphics or any other component to create a unique layout.
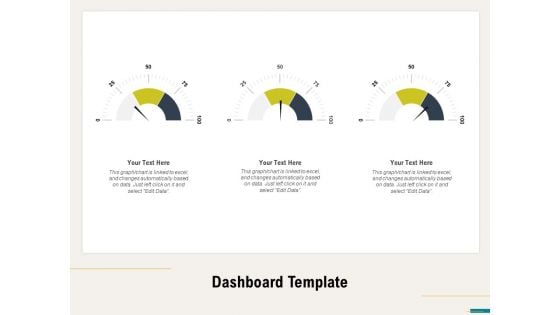
Agile Sprint Marketing Dashboard Template Ppt File Layout Ideas PDF
Presenting this set of slides with name agile sprint marketing dashboard template ppt file layout ideas pdf. This is a three stage process. The stages in this process are sprint planning, sprint review, sprint retrospective, the scrum process. This is a completely editable PowerPoint presentation and is available for immediate download. Download now and impress your audience.
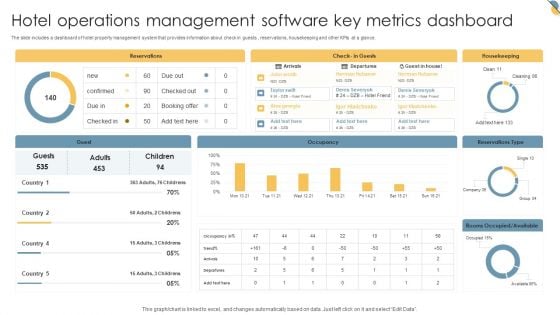
Hotel Operations Management Software Key Metrics Dashboard Inspiration PDF
The slide includes a dashboard of hotel property management system that provides information about check in guests , reservations, housekeeping and other KPIs at a glance. Pitch your topic with ease and precision using this Hotel Operations Management Software Key Metrics Dashboard Inspiration PDF. This layout presents information on Reservations, Housekeeping, Occupancy. It is also available for immediate download and adjustment. So, changes can be made in the color, design, graphics or any other component to create a unique layout.
Workforce Security Realization Coaching Plan Security Awareness Tracking Kpis Inspiration PDF
This slide covers the key performance for security awareness training including compliance, security culture and incident reduction. This is a workforce security realization coaching plan security awareness tracking kpis inspiration pdf template with various stages. Focus and dispense information on three stages using this creative set, that comes with editable features. It contains large content boxes to add your information on topics like compliance, security culture, incident reduction. You can also showcase facts, figures, and other relevant content using this PPT layout. Grab it now.
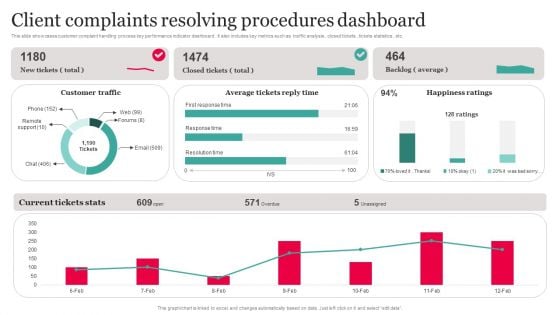
Client Complaints Resolving Procedures Dashboard Download PDF
This slide showcases customer complaint handling process key performance indicator dashboard. It also includes key metrics such as traffic analysis , closed tickets , tickets statistics , etc. Showcasing this set of slides titled Client Complaints Resolving Procedures Dashboard Download PDF The topics addressed in these templates are Customer Traffic, Average Tickets Reply Time, Resolving Procedures Dashboard. All the content presented in this PPT design is completely editable. Download it and make adjustments in color, background, font etc. as per your unique business setting.


 Continue with Email

 Home
Home


