Daily Snapshot
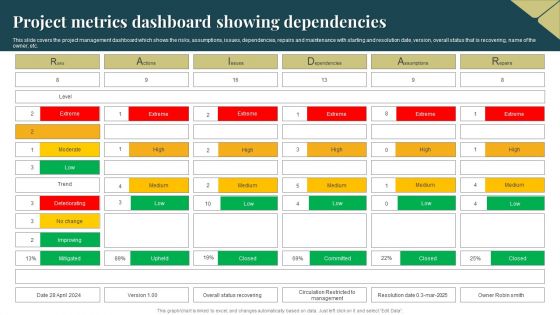
Project Metrics Dashboard Showing Dependencies Brochure PDF
This slide covers the project management dashboard which shows the risks, assumptions, issues, dependencies, repairs and maintenance with starting and resolution date, version, overall status that is recovering, name of the owner, etc. Showcasing this set of slides titled Project Metrics Dashboard Showing Dependencies Brochure PDF. The topics addressed in these templates are Project Metrics, Dashboard Showing Dependencies. All the content presented in this PPT design is completely editable. Download it and make adjustments in color, background, font etc. as per your unique business setting.
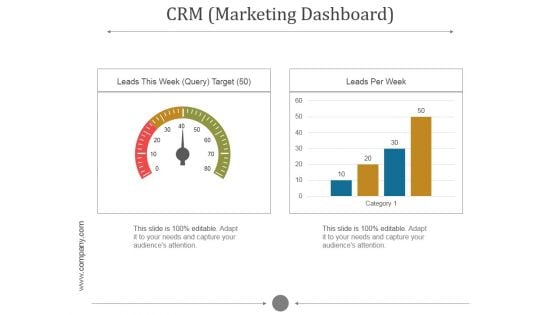
Crm Marketing Dashboard Ppt PowerPoint Presentation Templates
This is a crm marketing dashboard ppt powerpoint presentation templates. This is a two stage process. The stages in this process are leads this week query target, leads per week.
Project Tracking Dashboard With Multiple Metrics Pictures PDF
The following slide highlights the KPI of project management to avoid deviations. It includes elements such as schedule, tasks, issue assessment, budget and risk analysis etc. Pitch your topic with ease and precision using this Project Tracking Dashboard With Multiple Metrics Pictures PDF. This layout presents information on Projected Budget Analysis, Risk Analysis, Quality Affirmation. It is also available for immediate download and adjustment. So, changes can be made in the color, design, graphics or any other component to create a unique layout.

Dashboard Ppt PowerPoint Presentation Infographic Template Example 2015
This is a dashboard ppt powerpoint presentation infographic template example 2015. This is a two stage process. The stages in this process are dashboard, business, marketing, technology, process.

Web Access Control Solution Secure Web Gateway Training Program
This slide represents the training program for the Secure Web Gateway. The main components of training program are agenda, system requirements, mode such as online, offline or recorded videos, and cost. Slidegeeks is here to make your presentations a breeze with Web Access Control Solution Secure Web Gateway Training Program With our easy-to-use and customizable templates, you can focus on delivering your ideas rather than worrying about formatting. With a variety of designs to choose from, you are sure to find one that suits your needs. And with animations and unique photos, illustrations, and fonts, you can make your presentation pop. So whether you are giving a sales pitch or presenting to the board, make sure to check out Slidegeeks first This slide represents the training program for the Secure Web Gateway. The main components of training program are agenda, system requirements, mode such as online, offline or recorded videos, and cost.
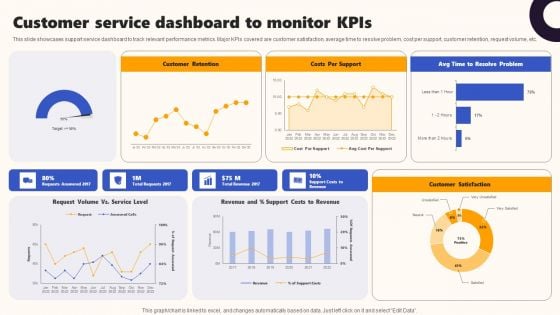
Techniques To Optimize UX Customer Service Dashboard To Monitor Kpis Template PDF
This slide showcases support service dashboard to track relevant performance metrics. Major KPIs covered are customer satisfaction, average time to resolve problem, cost per support, customer retention, request volume, etc. Present like a pro with Techniques To Optimize UX Customer Service Dashboard To Monitor Kpis Template PDF Create beautiful presentations together with your team, using our easy-to-use presentation slides. Share your ideas in real-time and make changes on the fly by downloading our templates. So whether youre in the office, on the go, or in a remote location, you can stay in sync with your team and present your ideas with confidence. With Slidegeeks presentation got a whole lot easier. Grab these presentations today.
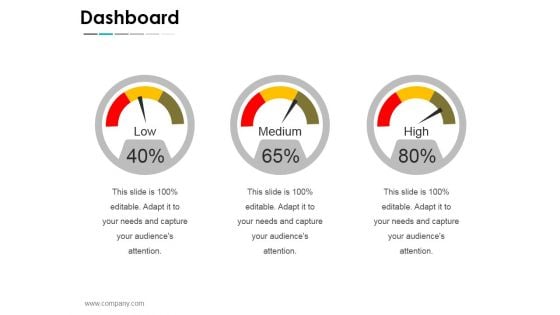
Dashboard Ppt PowerPoint Presentation Layouts Graphics Pictures
This is a dashboard ppt powerpoint presentation layouts graphics pictures. This is a three stage process. The stages in this process are business, strategy, analysis, planning, dashboard.
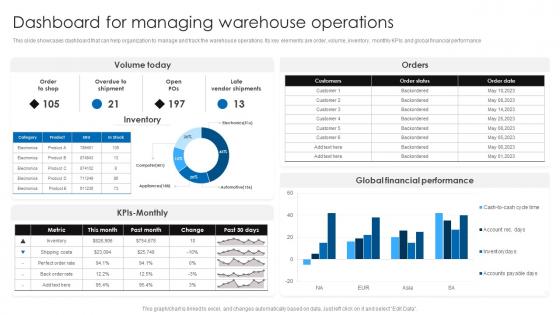
Dashboard For Managing Warehouse Operations Retail Stock Administration Strategies Formats Pdf
This slide showcases dashboard that can help organization to manage and track the warehouse operations. Its key elements are order, volume, inventory, monthly KPIs and global financial performance.Formulating a presentation can take up a lot of effort and time, so the content and message should always be the primary focus. The visuals of the PowerPoint can enhance the presenters message, so our Dashboard For Managing Warehouse Operations Retail Stock Administration Strategies Formats Pdf was created to help save time. Instead of worrying about the design, the presenter can concentrate on the message while our designers work on creating the ideal templates for whatever situation is needed. Slidegeeks has experts for everything from amazing designs to valuable content, we have put everything into Dashboard For Managing Warehouse Operations Retail Stock Administration Strategies Formats Pdf This slide showcases dashboard that can help organization to manage and track the warehouse operations. Its key elements are order, volume, inventory, monthly KPIs and global financial performance
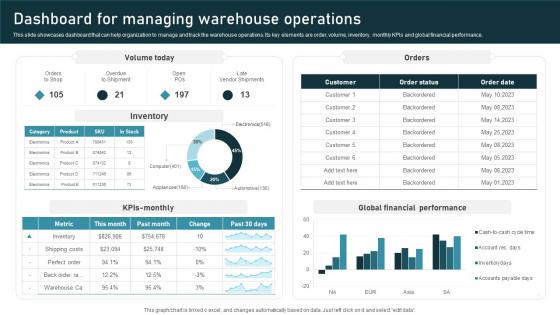
Dashboard Managing Inventory Administration Techniques For Enhanced Stock Accuracy Mockup Pdf
This slide showcases dashboard that can help organization to manage and track the warehouse operations. Its key elements are order, volume, inventory, monthly KPIs and global financial performance. Do you have an important presentation coming up Are you looking for something that will make your presentation stand out from the rest Look no further than Dashboard Managing Inventory Administration Techniques For Enhanced Stock Accuracy Mockup Pdf. With our professional designs, you can trust that your presentation will pop and make delivering it a smooth process. And with Slidegeeks, you can trust that your presentation will be unique and memorable. So why wait Grab Dashboard Managing Inventory Administration Techniques For Enhanced Stock Accuracy Mockup Pdf today and make your presentation stand out from the rest This slide showcases dashboard that can help organization to manage and track the warehouse operations. Its key elements are order, volume, inventory, monthly KPIs and global financial performance.
Dashboard For Tracking Impact Of Implementing Sales Techniques For Achieving Rules Pdf
This slide covers the KPI dashboard for tracking KPIs such as new customer YTD, sales revenue, profit, average weekly sales, above sales target, average revenue per unit, customer lifetime value, etc. Do you have an important presentation coming up Are you looking for something that will make your presentation stand out from the rest Look no further than Dashboard For Tracking Impact Of Implementing Sales Techniques For Achieving Rules Pdf. With our professional designs, you can trust that your presentation will pop and make delivering it a smooth process. And with Slidegeeks, you can trust that your presentation will be unique and memorable. So why wait Grab Dashboard For Tracking Impact Of Implementing Sales Techniques For Achieving Rules Pdf today and make your presentation stand out from the rest This slide covers the KPI dashboard for tracking KPIs such as new customer YTD, sales revenue, profit, average weekly sales, above sales target, average revenue per unit, customer lifetime value, etc.
Dashboard For Tracking Impact Of Warehouse Leveraging Logistics Automation Information Pdf
This slide covers the dashboard with after automation warehouse overview. It include KPIs such as autonomous robots status, robotic arms status, battery level, performance, time to return, etc.Get a simple yet stunning designed Dashboard For Tracking Impact Of Warehouse Leveraging Logistics Automation Information Pdf. It is the best one to establish the tone in your meetings. It is an excellent way to make your presentations highly effective. So, download this PPT today from Slidegeeks and see the positive impacts. Our easy-to-edit Dashboard For Tracking Impact Of Warehouse Leveraging Logistics Automation Information Pdf can be your go-to option for all upcoming conferences and meetings. So, what are you waiting for Grab this template today. This slide covers the dashboard with after automation warehouse overview. It include KPIs such as autonomous robots status, robotic arms status, battery level, performance, time to return, etc.
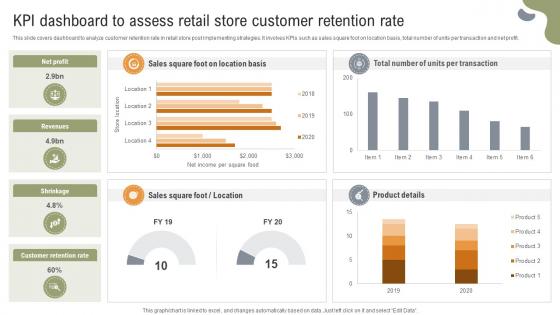
Implementing Strategies To Enhance Grocery KPI Dashboard To Assess Retail Store Customer
This slide covers dashboard to analyze customer retention rate in retail store post implementing strategies. It involves KPIs such as sales square foot on location basis, total number of units per transaction and net profit. Crafting an eye-catching presentation has never been more straightforward. Let your presentation shine with this tasteful yet straightforward Implementing Strategies To Enhance Grocery KPI Dashboard To Assess Retail Store Customer template. It offers a minimalistic and classy look that is great for making a statement. The colors have been employed intelligently to add a bit of playfulness while still remaining professional. Construct the ideal Implementing Strategies To Enhance Grocery KPI Dashboard To Assess Retail Store Customer that effortlessly grabs the attention of your audience Begin now and be certain to wow your customers This slide covers dashboard to analyze customer retention rate in retail store post implementing strategies. It involves KPIs such as sales square foot on location basis, total number of units per transaction and net profit.
Analytics Dashboard Tracking Effective Digital Transformation Journey PPT Presentation DT SS V
This slide represents an analytics dashboard for effective energy monitoring and management. It tracks KPIs such as energy production, solar energy production, savings, energy produced, carbon savings, and financial savings. Get a simple yet stunning designed Analytics Dashboard Tracking Effective Digital Transformation Journey PPT Presentation DT SS V. It is the best one to establish the tone in your meetings. It is an excellent way to make your presentations highly effective. So, download this PPT today from Slidegeeks and see the positive impacts. Our easy-to-edit Analytics Dashboard Tracking Effective Digital Transformation Journey PPT Presentation DT SS V can be your go-to option for all upcoming conferences and meetings. So, what are you waiting for Grab this template today. This slide represents an analytics dashboard for effective energy monitoring and management. It tracks KPIs such as energy production, solar energy production, savings, energy produced, carbon savings, and financial savings.

Agenda Agriculture Business Plan Go To Market Strategy Pictures Pdf
Find a pre designed and impeccable Agenda Agriculture Business Plan Go To Market Strategy Pictures Pdf. The templates can ace your presentation without additional effort. You can download these easy to edit presentation templates to make your presentation stand out from others. So, what are you waiting for Download the template from Slidegeeks today and give a unique touch to your presentation. Our Agenda Agriculture Business Plan Go To Market Strategy Pictures Pdf are topically designed to provide an attractive backdrop to any subject. Use them to look like a presentation pro.
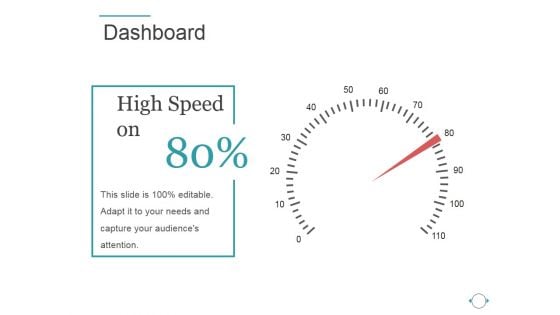
Dashboard Ppt PowerPoint Presentation File Tips
This is a dashboard ppt powerpoint presentation file tips. This is a one stage process. The stages in this process are high speed on, process, success, business, marketing.
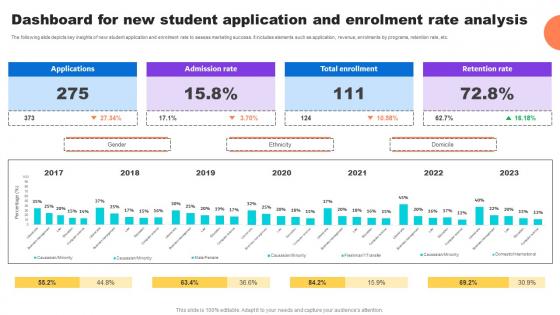
Dashboard For New Student Application And Enrolment Key Step To Implementation University Strategy SS V
The following slide depicts key insights of new student application and enrolment rate to assess marketing success. It includes elements such as application, revenue, enrolments by programs, retention rate, etc.Crafting an eye-catching presentation has never been more straightforward. Let your presentation shine with this tasteful yet straightforward Dashboard For New Student Application And Enrolment Key Step To Implementation University Strategy SS V template. It offers a minimalistic and classy look that is great for making a statement. The colors have been employed intelligently to add a bit of playfulness while still remaining professional. Construct the ideal Dashboard For New Student Application And Enrolment Key Step To Implementation University Strategy SS V that effortlessly grabs the attention of your audience Begin now and be certain to wow your customers The following slide depicts key insights of new student application and enrolment rate to assess marketing success. It includes elements such as application, revenue, enrolments by programs, retention rate, etc.
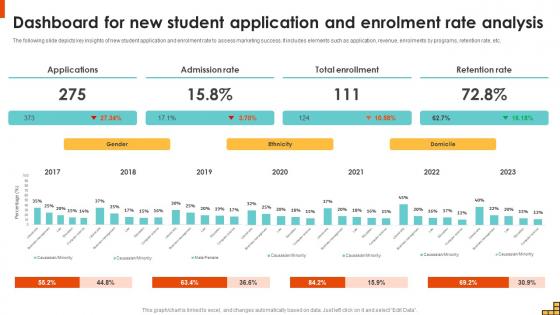
Dashboard For New Student Application And Enrolment Running Marketing Campaigns Strategy SS V
The following slide depicts key insights of new student application and enrolment rate to assess marketing success. It includes elements such as application, revenue, enrolments by programs, retention rate, etc. Crafting an eye-catching presentation has never been more straightforward. Let your presentation shine with this tasteful yet straightforward Dashboard For New Student Application And Enrolment Running Marketing Campaigns Strategy SS V template. It offers a minimalistic and classy look that is great for making a statement. The colors have been employed intelligently to add a bit of playfulness while still remaining professional. Construct the ideal Dashboard For New Student Application And Enrolment Running Marketing Campaigns Strategy SS V that effortlessly grabs the attention of your audience Begin now and be certain to wow your customers The following slide depicts key insights of new student application and enrolment rate to assess marketing success. It includes elements such as application, revenue, enrolments by programs, retention rate, etc.
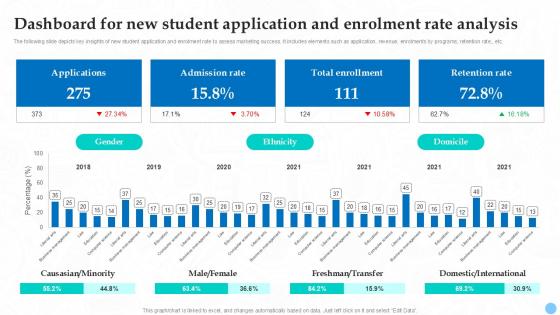
Dashboard For New Student Application Higher Education Ppt Sample Strategy SS V
The following slide depicts key insights of new student application and enrolment rate to assess marketing success. It includes elements such as application, revenue, enrolments by programs, retention rate, etc. Crafting an eye-catching presentation has never been more straightforward. Let your presentation shine with this tasteful yet straightforward Dashboard For New Student Application Higher Education Ppt Sample Strategy SS V template. It offers a minimalistic and classy look that is great for making a statement. The colors have been employed intelligently to add a bit of playfulness while still remaining professional. Construct the ideal Dashboard For New Student Application Higher Education Ppt Sample Strategy SS V that effortlessly grabs the attention of your audience Begin now and be certain to wow your customers The following slide depicts key insights of new student application and enrolment rate to assess marketing success. It includes elements such as application, revenue, enrolments by programs, retention rate, etc.
Pie Chart With Icons For Business Analysis Powerpoint Slides
This dashboard template contains graphics of pie chart with icons. This dashboard PowerPoint template helps to display business analysis in a visual manner. Download this template to make impressive presentations.
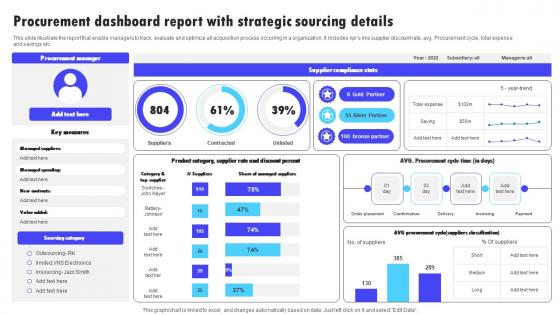
Procurement Dashboard Report With Strategic Sourcing Details Information Pdf
This slide illustrate the report that enable managers to track, evaluate and optimize all acquisition process occurring in a organization. It includes kpis like supplier discount rate, avg. Procurement cycle, total expense and savings etc. Pitch your topic with ease and precision using this Procurement Dashboard Report With Strategic Sourcing Details Information Pdf. This layout presents information on Supplier Compliance Stats, Procurement Manager, Sourcing Category. It is also available for immediate download and adjustment. So, changes can be made in the color, design, graphics or any other component to create a unique layout. This slide illustrate the report that enable managers to track, evaluate and optimize all acquisition process occurring in a organization. It includes kpis like supplier discount rate, avg. Procurement cycle, total expense and savings etc.
Dashboard Analysis For Tracking Agricultural Tasks Adopting Sustainable Farming Techniques
This slide showcases the KPIs that would help to track the improvements with adoption of new sustainable agriculture practices. It includes current tasks, crops, harvest, todays weather, summary, etc. Take your projects to the next level with our ultimate collection of Dashboard Analysis For Tracking Agricultural Tasks Adopting Sustainable Farming Techniques. Slidegeeks has designed a range of layouts that are perfect for representing task or activity duration, keeping track of all your deadlines at a glance. Tailor these designs to your exact needs and give them a truly corporate look with your own brand colors they will make your projects stand out from the rest This slide showcases the KPIs that would help to track the improvements with adoption of new sustainable agriculture practices. It includes current tasks, crops, harvest, todays weather, summary, etc.
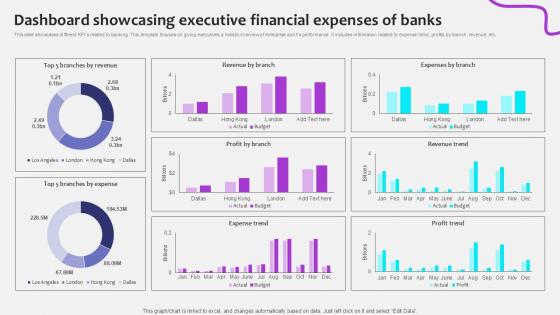
Dashboard Showcasing Executive Initiating Globalization Of Banking Ppt Template
This slide showcases different KPIs related to banking. This template focuses on giving executives a holistic overview of enterprise and ts performance. It includes information related to expense trend, profits by branch, revenue, etc. Present like a pro with Dashboard Showcasing Executive Initiating Globalization Of Banking Ppt Template. Create beautiful presentations together with your team, using our easy-to-use presentation slides. Share your ideas in real-time and make changes on the fly by downloading our templates. So whether you are in the office, on the go, or in a remote location, you can stay in sync with your team and present your ideas with confidence. With Slidegeeks presentation got a whole lot easier. Grab these presentations today. This slide showcases different KPIs related to banking. This template focuses on giving executives a holistic overview of enterprise and ts performance. It includes information related to expense trend, profits by branch, revenue, etc.
Dashboard Analysis For Tracking Enhancing Productivity With Adoption PPT Presentation
This slide showcases the KPIs that would help to track the improvements with adoption of new sustainable agriculture practices. It includes current tasks, crops, harvest, todays weather, summary, etc. This Dashboard Analysis For Tracking Enhancing Productivity With Adoption PPT Presentation from Slidegeeks makes it easy to present information on your topic with precision. It provides customization options, so you can make changes to the colors, design, graphics, or any other component to create a unique layout. It is also available for immediate download, so you can begin using it right away. Slidegeeks has done good research to ensure that you have everything you need to make your presentation stand out. Make a name out there for a brilliant performance. This slide showcases the KPIs that would help to track the improvements with adoption of new sustainable agriculture practices. It includes current tasks, crops, harvest, todays weather, summary, etc.
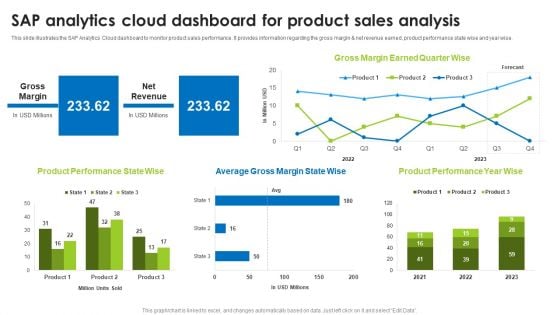
BI Technique For Data Informed Decisions Sap Analytics Cloud Dashboard For Product Sales Analysis Sample PDF
This slide illustrates the SAP Analytics Cloud dashboard to monitor product sales performance. It provides information regarding the gross margin and net revenue earned, product performance state wise and year wise. Welcome to our selection of the Budget Plan For BI Technique For Data Informed Decisions Clipart PDF. These are designed to help you showcase your creativity and bring your sphere to life. Planning and Innovation are essential for any business that is just starting out. This collection contains the designs that you need for your everyday presentations. All of our PowerPoints are 100 percent editable, so you can customize them to suit your needs. This multi purpose template can be used in various situations. Grab these presentation templates today.
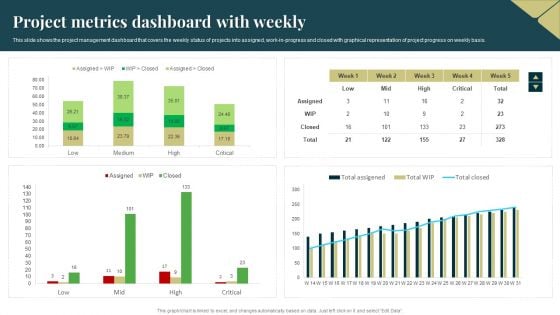
Project Metrics Dashboard With Weekly Formats PDF
This slide shows the project management dashboard that covers the weekly status of projects into assigned, work in progress and closed with graphical representation of project progress on weekly basis. Showcasing this set of slides titled Project Metrics Dashboard With Weekly Formats PDF. The topics addressed in these templates are Project Metrics, Dashboard With Weekly. All the content presented in this PPT design is completely editable. Download it and make adjustments in color, background, font etc. as per your unique business setting.
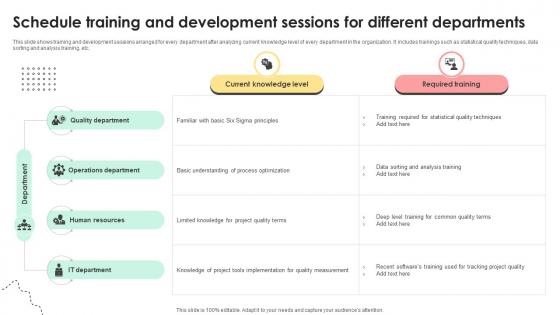
Administering Quality Assurance Schedule Training And Development Sessions For Different PM SS V
This slide shows training and development sessions arranged for every department after analyzing current knowledge level of every department in the organization. It includes trainings such as statistical quality techniques, data sorting and analysis training, etc. Do you have an important presentation coming up Are you looking for something that will make your presentation stand out from the rest Look no further than Administering Quality Assurance Schedule Training And Development Sessions For Different PM SS V. With our professional designs, you can trust that your presentation will pop and make delivering it a smooth process. And with Slidegeeks, you can trust that your presentation will be unique and memorable. So why wait Grab Administering Quality Assurance Schedule Training And Development Sessions For Different PM SS V today and make your presentation stand out from the rest This slide shows training and development sessions arranged for every department after analyzing current knowledge level of every department in the organization. It includes trainings such as statistical quality techniques, data sorting and analysis training, etc.
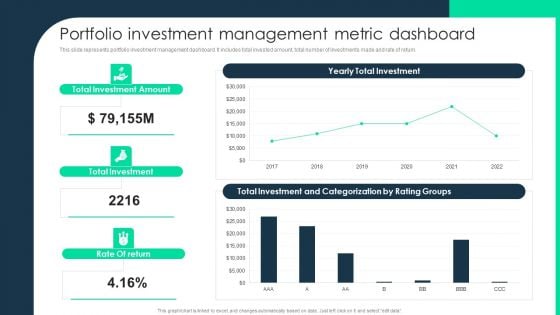
Portfolio Investment Management Metric Dashboard Brochure PDF
This slide represents portfolio investment management dashboard. It includes total invested amount, total number of investments made and rate of return. Deliver an awe inspiring pitch with this creative Portfolio Investment Management Metric Dashboard Brochure PDF bundle. Topics like Portfolio Investment Management, Metric Dashboard can be discussed with this completely editable template. It is available for immediate download depending on the needs and requirements of the user.
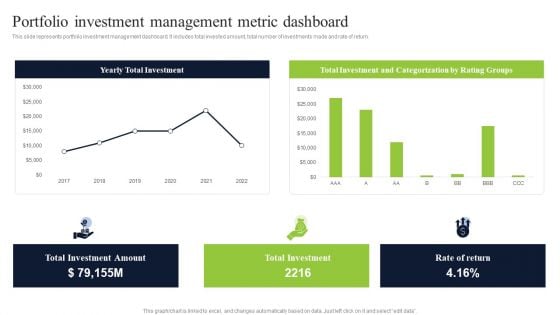
Portfolio Investment Management Metric Dashboard Slides PDF
This slide represents portfolio investment management dashboard. It includes total invested amount, total number of investments made and rate of return. Deliver an awe inspiring pitch with this creative Portfolio Investment Management Metric Dashboard Slides PDF bundle. Topics like Portfolio Investment Management, Metric Dashboard can be discussed with this completely editable template. It is available for immediate download depending on the needs and requirements of the user.
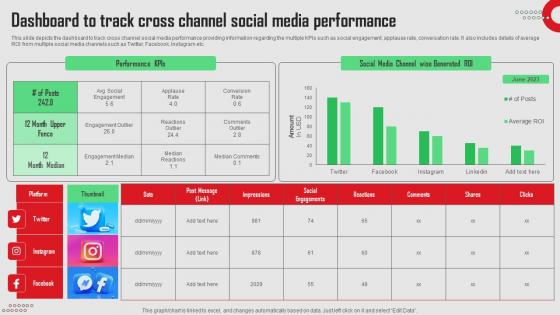
Dashboard To Track Cross Channel Social Media Platforms Performance Inspiration Pdf
This slide depicts the dashboard to track cross channel social media performance providing information regarding the multiple KPIs such as social engagement, applause rate, conversation rate. It also includes details of average ROI from multiple social media channels such as Twitter, Facebook, Instagram etc.There are so many reasons you need a Dashboard To Track Cross Channel Social Media Platforms Performance Inspiration Pdf. The first reason is you can not spend time making everything from scratch, Thus, Slidegeeks has made presentation templates for you too. You can easily download these templates from our website easily. This slide depicts the dashboard to track cross channel social media performance providing information regarding the multiple KPIs such as social engagement, applause rate, conversation rate. It also includes details of average ROI from multiple social media channels such as Twitter, Facebook, Instagram etc.
Kpi Dashboard To Track Amazon Performance Amazons Journey For Becoming Icons PDF
This slide provides information regarding dashboard to monitor Amazon performance. The KPIs include tracking of product sales, conversion rate, advertising spends, session, organic sales, etc. The best PPT templates are a great way to save time, energy, and resources. Slidegeeks have 100 percent editable powerpoint slides making them incredibly versatile. With these quality presentation templates, you can create a captivating and memorable presentation by combining visually appealing slides and effectively communicating your message. Download Kpi Dashboard To Track Amazon Performance Amazons Journey For Becoming Icons PDF from Slidegeeks and deliver a wonderful presentation. This slide provides information regarding dashboard to monitor Amazon performance. The KPIs include tracking of product sales, conversion rate, advertising spends, session, organic sales, etc.
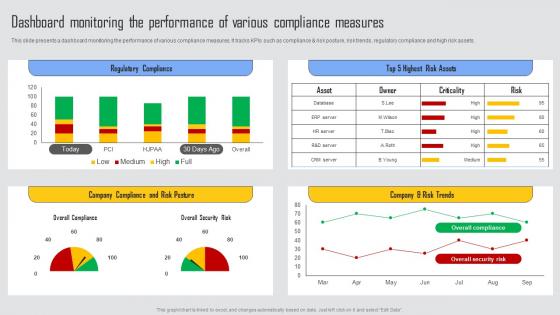
Dashboard Monitoring Performance Managing Risks And Establishing Trust Through Efficient Graphics Pdf
This slide presents a dashboard monitoring the performance of various compliance measures. It tracks KPIs such as compliance and risk posture, risk trends, regulatory compliance and high risk assets. Slidegeeks has constructed Dashboard Monitoring Performance Managing Risks And Establishing Trust Through Efficient Graphics Pdf after conducting extensive research and examination. These presentation templates are constantly being generated and modified based on user preferences and critiques from editors. Here, you will find the most attractive templates for a range of purposes while taking into account ratings and remarks from users regarding the content. This is an excellent jumping off point to explore our content and will give new users an insight into our top notch PowerPoint Templates. This slide presents a dashboard monitoring the performance of various compliance measures. It tracks KPIs such as compliance and risk posture, risk trends, regulatory compliance and high risk assets.
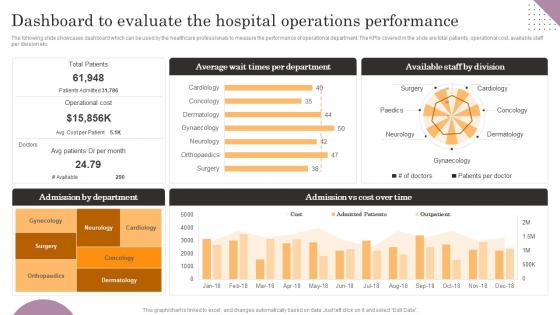
Dashboard To Evaluate The Hospital Operations Performance General Management Rules Pdf
The following slide showcases dashboard which can be used by the healthcare professionals to measure the performance of operational department. The KPIs covered in the slide are total patients, operational cost, available staff per division etc. Present like a pro with Dashboard To Evaluate The Hospital Operations Performance General Management Rules Pdf Create beautiful presentations together with your team, using our easy-to-use presentation slides. Share your ideas in real-time and make changes on the fly by downloading our templates. So whether you are in the office, on the go, or in a remote location, you can stay in sync with your team and present your ideas with confidence. With Slidegeeks presentation got a whole lot easier. Grab these presentations today. The following slide showcases dashboard which can be used by the healthcare professionals to measure the performance of operational department. The KPIs covered in the slide are total patients, operational cost, available staff per division etc.
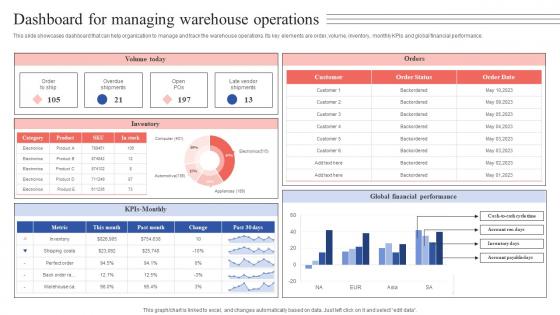
Dashboard For Managing Warehouse Operations Tactical Guide Stock Administration Diagrams Pdf
This slide showcases dashboard that can help organization to manage and track the warehouse operations. Its key elements are order, volume, inventory, monthly KPIs and global financial performance. From laying roadmaps to briefing everything in detail, our templates are perfect for you. You can set the stage with your presentation slides. All you have to do is download these easy-to-edit and customizable templates. Dashboard For Managing Warehouse Operations Tactical Guide Stock Administration Diagrams Pdf will help you deliver an outstanding performance that everyone would remember and praise you for. Do download this presentation today. This slide showcases dashboard that can help organization to manage and track the warehouse operations. Its key elements are order, volume, inventory, monthly KPIs and global financial performance.

How To Create Cost Effective Facebook Ads Dashboard With Campaign Strategy SS V
The following slide outlines comprehensive dashboard through which advertisers can monitor Facebook ads performance. The KPIs outlined in slide are ad spend, conversions, cost per conversion, cost per action, brand impressions, clicks, etc. If your project calls for a presentation, then Slidegeeks is your go-to partner because we have professionally designed, easy-to-edit templates that are perfect for any presentation. After downloading, you can easily edit How To Create Cost Effective Facebook Ads Dashboard With Campaign Strategy SS V and make the changes accordingly. You can rearrange slides or fill them with different images. Check out all the handy templates The following slide outlines comprehensive dashboard through which advertisers can monitor Facebook ads performance. The KPIs outlined in slide are ad spend, conversions, cost per conversion, cost per action, brand impressions, clicks, etc.
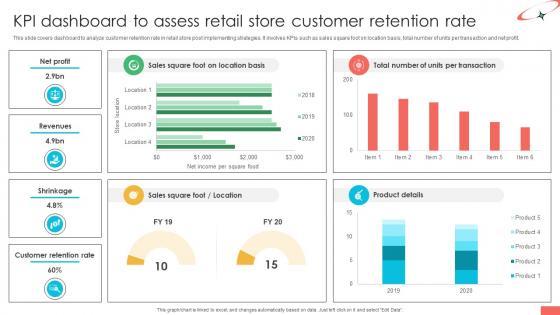
Marketing Strategies For Effective Retail KPI Dashboard To Assess Retail Store Customer
This slide covers dashboard to analyze customer retention rate in retail store post implementing strategies. It involves KPIs such as sales square foot on location basis, total number of units per transaction and net profit. Slidegeeks is one of the best resources for PowerPoint templates. You can download easily and regulate Marketing Strategies For Effective Retail KPI Dashboard To Assess Retail Store Customer for your personal presentations from our wonderful collection. A few clicks is all it takes to discover and get the most relevant and appropriate templates. Use our Templates to add a unique zing and appeal to your presentation and meetings. All the slides are easy to edit and you can use them even for advertisement purposes. This slide covers dashboard to analyze customer retention rate in retail store post implementing strategies. It involves KPIs such as sales square foot on location basis, total number of units per transaction and net profit.
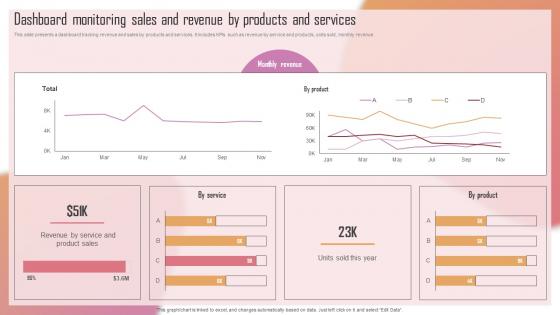
Customizing The Salon Experience Dashboard Monitoring Sales And Revenue By Products Strategy SS V
This slide presents a dashboard tracking revenue and sales by products and services. It includes KPIs such as revenue by service and products, units sold, monthly revenue. If your project calls for a presentation, then Slidegeeks is your go-to partner because we have professionally designed, easy-to-edit templates that are perfect for any presentation. After downloading, you can easily edit Customizing The Salon Experience Dashboard Monitoring Sales And Revenue By Products Strategy SS V and make the changes accordingly. You can rearrange slides or fill them with different images. Check out all the handy templates This slide presents a dashboard tracking revenue and sales by products and services. It includes KPIs such as revenue by service and products, units sold, monthly revenue.
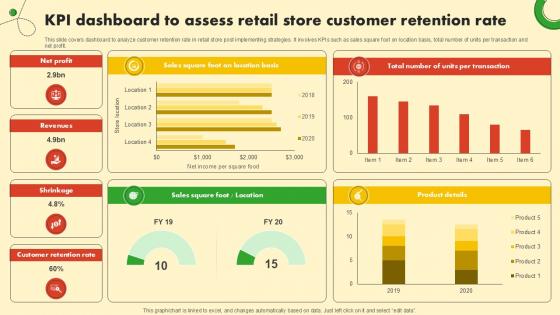
KPI Dashboard To Assess Retail Store Food And Grocery Retail Ppt Presentation
This slide covers dashboard to analyze customer retention rate in retail store post implementing strategies. It involves KPIs such as sales square foot on location basis, total number of units per transaction and net profit. Present like a pro with KPI Dashboard To Assess Retail Store Food And Grocery Retail Ppt Presentation. Create beautiful presentations together with your team, using our easy-to-use presentation slides. Share your ideas in real-time and make changes on the fly by downloading our templates. So whether you are in the office, on the go, or in a remote location, you can stay in sync with your team and present your ideas with confidence. With Slidegeeks presentation got a whole lot easier. Grab these presentations today. This slide covers dashboard to analyze customer retention rate in retail store post implementing strategies. It involves KPIs such as sales square foot on location basis, total number of units per transaction and net profit.
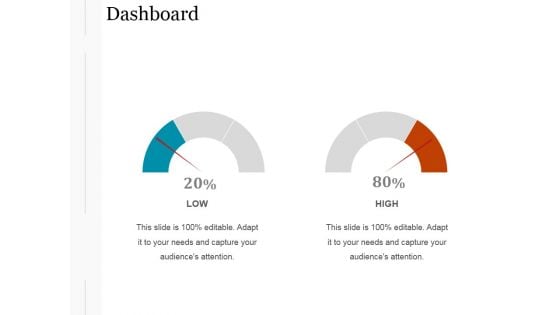
Dashboard Ppt PowerPoint Presentation Model Designs Download
This is a dashboard ppt powerpoint presentation model designs download. This is a two stage process. The stages in this process are dashboard, strategy, planning, business, management.
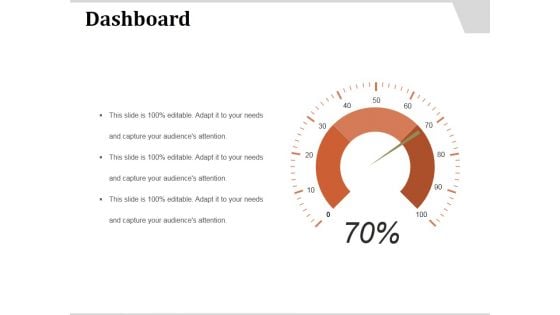
Dashboard Ppt PowerPoint Presentation Infographics Templates
This is a dashboard ppt powerpoint presentation infographics templates. This is a three stage process. The stages in this process are dashboard, planning, business, management, strategy.
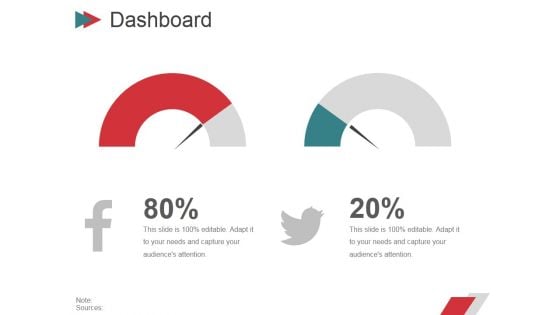
Dashboard Ppt PowerPoint Presentation Portfolio Example
This is a dashboard ppt powerpoint presentation portfolio example. This is a two stage process. The stages in this process are business, strategy, marketing, planning, finance, dashboard.
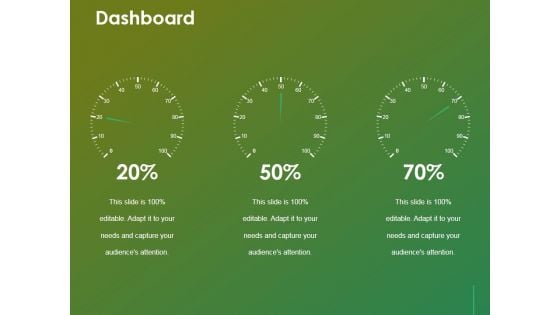
Dashboard Ppt Powerpoint Presentation Summary Professional
This is a dashboard ppt powerpoint presentation summary professional. This is a three stage process. The stages in this process are dashboard, business, planning, marketing, management.
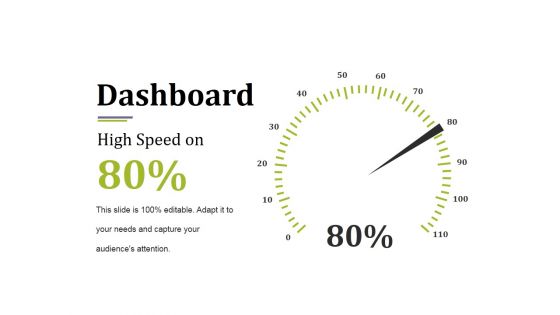
Dashboard Ppt PowerPoint Presentation Show Model
This is a dashboard ppt powerpoint presentation show model. This is a one stage process. The stages in this process are dashboard, business, marketing, strategy, planning.
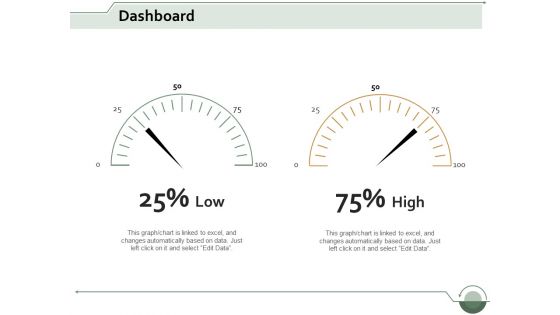
Dashboard Measure Ppt Powerpoint Presentation File Inspiration
This is a dashboard measure ppt powerpoint presentation file inspiration. This is a two stage process. The stages in this process are dashboard, business, marketing, management, planning.
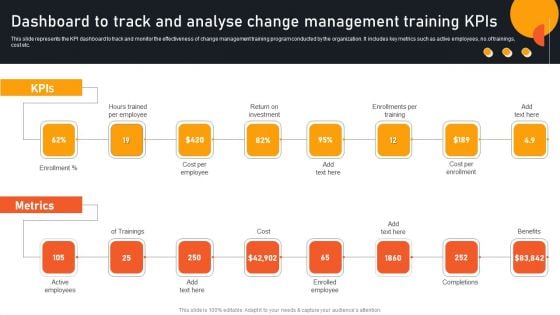
Transform Management Instruction Schedule Dashboard To Track And Analyse Change Mockup PDF
This slide represents the KPI dashboard to track and monitor the effectiveness of change management training program conducted by the organization. It includes key metrics such as active employees, no.of trainings, cost etc. Slidegeeks is one of the best resources for PowerPoint templates. You can download easily and regulate Transform Management Instruction Schedule Dashboard To Track And Analyse Change Mockup PDF for your personal presentations from our wonderful collection. A few clicks is all it takes to discover and get the most relevant and appropriate templates. Use our Templates to add a unique zing and appeal to your presentation and meetings. All the slides are easy to edit and you can use them even for advertisement purposes.

One On One Advertising Radio Advertising Schedule To Increase Customer Reach Strategy SS V
This slide showcases radio ad schedule which can be used by enterprises to increase engagement. It further includes advantages that are tracking results, cost, effective, reaching a huge audience and creating brand awareness. Slidegeeks is here to make your presentations a breeze with One On One Advertising Radio Advertising Schedule To Increase Customer Reach Strategy SS V With our easy-to-use and customizable templates, you can focus on delivering your ideas rather than worrying about formatting. With a variety of designs to choose from, you are sure to find one that suits your needs. And with animations and unique photos, illustrations, and fonts, you can make your presentation pop. So whether you are giving a sales pitch or presenting to the board, make sure to check out Slidegeeks first This slide showcases radio ad schedule which can be used by enterprises to increase engagement. It further includes advantages that are tracking results, cost, effective, reaching a huge audience and creating brand awareness.
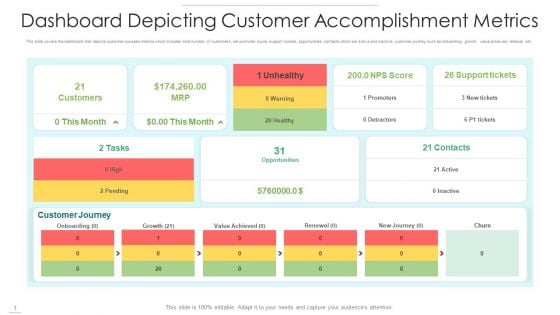
Dashboard Depicting Customer Accomplishment Metrics Slides PDF
This slide covers the dashboard that depicts customer success metrics which includes total number of customers, net promoter score, support tickets, opportunities, contacts which are active and inactive, customer journey such as onboarding, growth, value achieved, renewal, etc. Showcasing this set of slides titled dashboard depicting customer accomplishment metrics slides pdf. The topics addressed in these templates are customers, unhealthy, support tickets. All the content presented in this PPT design is completely editable. Download it and make adjustments in color, background, font etc. as per your unique business setting.
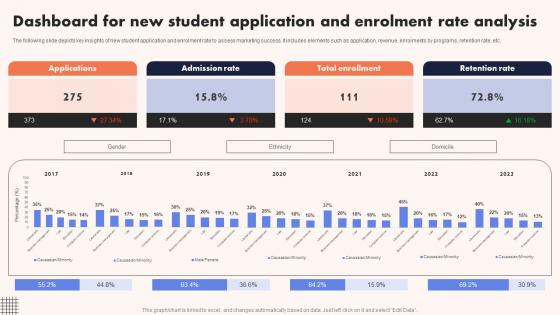
University Marketing Guide Dashboard For New Student Application And Enrolment Strategy SS V
The following slide depicts key insights of new student application and enrolment rate to assess marketing success. It includes elements such as application, revenue, enrolments by programs, retention rate, etc. Coming up with a presentation necessitates that the majority of the effort goes into the content and the message you intend to convey. The visuals of a PowerPoint presentation can only be effective if it supplements and supports the story that is being told. Keeping this in mind our experts created University Marketing Guide Dashboard For New Student Application And Enrolment Strategy SS V to reduce the time that goes into designing the presentation. This way, you can concentrate on the message while our designers take care of providing you with the right template for the situation. The following slide depicts key insights of new student application and enrolment rate to assess marketing success. It includes elements such as application, revenue, enrolments by programs, retention rate, etc.
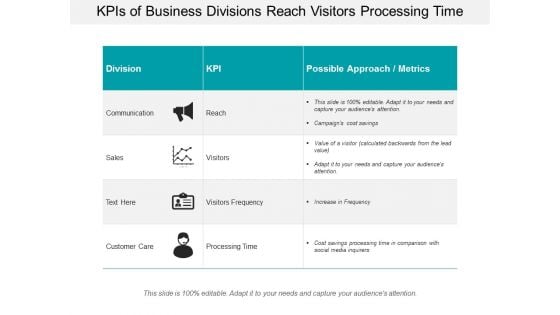
Kpis Of Business Divisions Reach Visitors Processing Time Ppt PowerPoint Presentation Slides Outfit
This is a kpis of business divisions reach visitors processing time ppt powerpoint presentation slides outfit. This is a three stage process. The stages in this process are kpi proposal, kpi plan, kpi scheme.
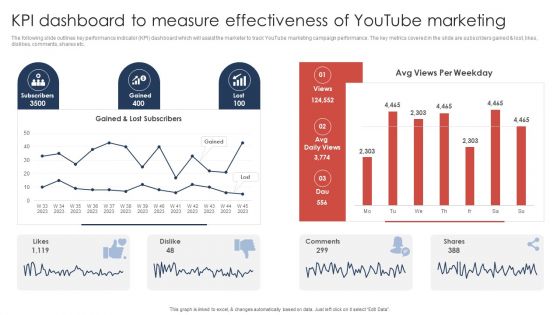
Kpi Dashboard To Measure Effectiveness Of Youtube Marketing Slides PDF
The following slide outlines key performance indicator KPI dashboard which will assist the marketer to track YouTube marketing campaign performance. The key metrics covered in the slide are subscribers gained and lost, likes, dislikes, comments, shares etc. Do you have an important presentation coming up Are you looking for something that will make your presentation stand out from the rest Look no further than Kpi Dashboard To Measure Effectiveness Of Youtube Marketing Slides PDF. With our professional designs, you can trust that your presentation will pop and make delivering it a smooth process. And with Slidegeeks, you can trust that your presentation will be unique and memorable. So why wait Grab Kpi Dashboard To Measure Effectiveness Of Youtube Marketing Slides PDF today and make your presentation stand out from the rest.
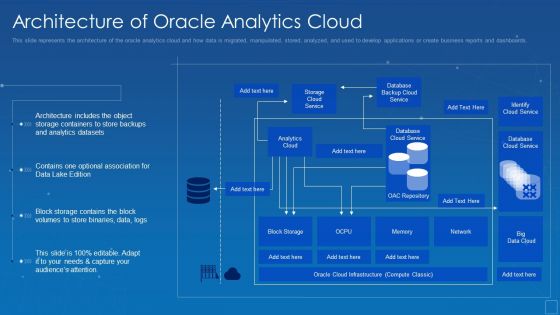
Oracle Cloud Data Analytics Administration IT Architecture Of Oracle Analytics Cloud Microsoft PDF
This slide represents the architecture of the oracle analytics cloud and how data is migrated, manipulated, stored, analyzed, and used to develop applications or create business reports and dashboards. Deliver an awe inspiring pitch with this creative oracle cloud data analytics administration it architecture of oracle analytics cloud microsoft pdf bundle. Topics like datasets, analytics, architecture, containers, association, optional can be discussed with this completely editable template. It is available for immediate download depending on the needs and requirements of the user.

Dashboard Ppt PowerPoint Presentation File Layout
This is a dashboard ppt powerpoint presentation file layout. This is a three stage process. The stages in this process are low, medium, high.
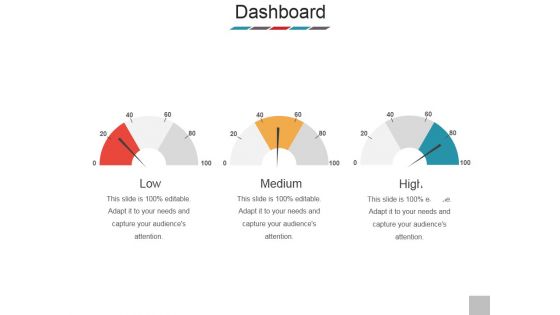
Dashboard Ppt PowerPoint Presentation Layouts Summary
This is a dashboard ppt powerpoint presentation layouts summary. This is a three stage process. The stages in this process are low, medium, high.
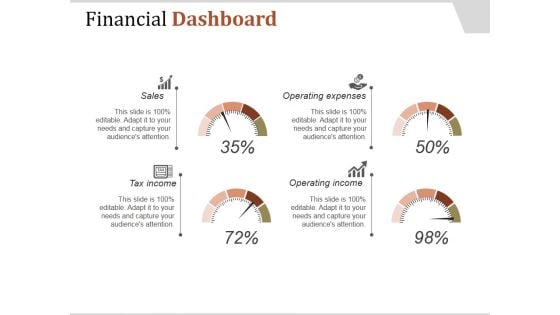
Financial Dashboard Ppt PowerPoint Presentation Influencers
This is a financial dashboard ppt powerpoint presentation influencers. This is a four stage process. The stages in this process are sales, tax income, operating income, operating expenses.
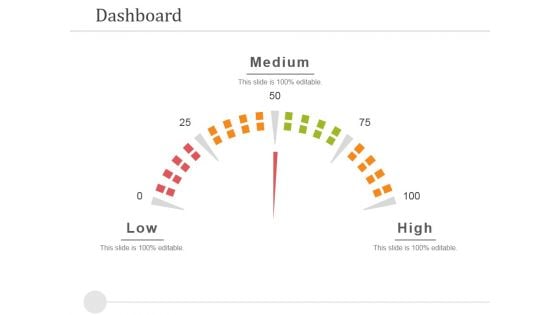
Dashboard Ppt PowerPoint Presentation Slides Good
This is a dashboard ppt powerpoint presentation slides good. This is a three stage process. The stages in this process are low, medium, high.
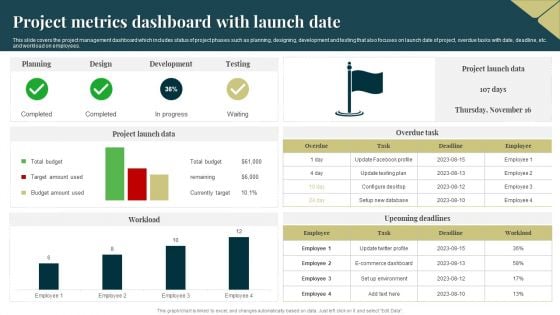
Project Metrics Dashboard With Launch Date Formats PDF
This slide covers the project management dashboard which includes status of project phases such as planning, designing, development and testing that also focuses on launch date of project, overdue tasks with date, deadline, etc. and workload on employees. Showcasing this set of slides titled Project Metrics Dashboard With Launch Date Formats PDF. The topics addressed in these templates are Budget, Project Launch Data, Development. All the content presented in this PPT design is completely editable. Download it and make adjustments in color, background, font etc. as per your unique business setting.
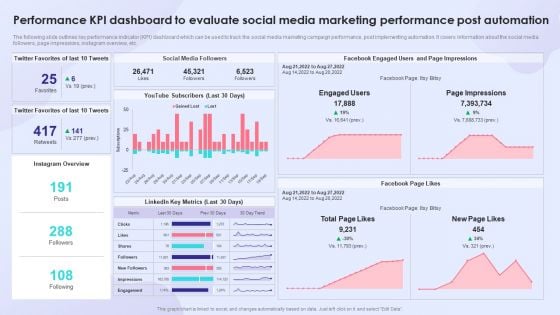
Performance KPI Dashboard To Evaluate Social Media Marketing Performance Post Automation Themes PDF
The following slide outlines key performance indicator KPI dashboard which can be used to track the social media marketing campaign performance, post implementing automation. It covers information about the social media followers, page impressions, instagram overview, etc. Deliver and pitch your topic in the best possible manner with this Performance KPI Dashboard To Evaluate Social Media Marketing Performance Post Automation Themes PDF. Use them to share invaluable insights on Social Media Followers, Linkedin Key Metrics, Performance KPI Dashboard and impress your audience. This template can be altered and modified as per your expectations. So, grab it now.
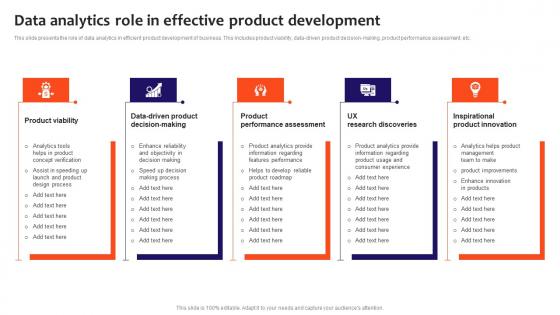
Data Analytics Role In Effective Product Development Slides Pdf
This slide presents the role of data analytics in efficient product development of business. This includes product viability, data driven product decision making, product performance assessment, etc. Pitch your topic with ease and precision using this Data Analytics Role In Effective Product Development Slides Pdf. This layout presents information on Product Viability, Product Performance, Inspirational Product Innovation. It is also available for immediate download and adjustment. So, changes can be made in the color, design, graphics or any other component to create a unique layout. This slide presents the role of data analytics in efficient product development of business. This includes product viability, data driven product decision making, product performance assessment, etc.
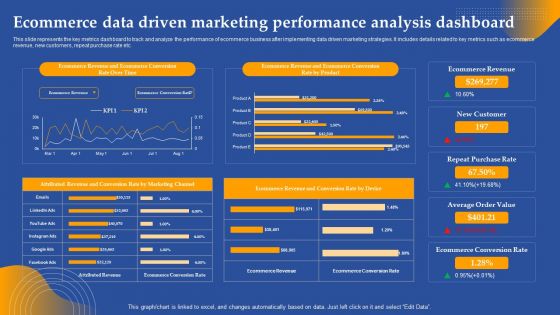
Ecommerce Data Driven Marketing Performance Analysis Dashboard Ppt Visual Aids Styles PDF
This slide represents the key metrics dashboard to track and analyze the performance of ecommerce business after implementing data driven marketing strategies. It includes details related to key metrics such as ecommerce revenue, new customers, repeat purchase rate etc. Slidegeeks has constructed Ecommerce Data Driven Marketing Performance Analysis Dashboard Ppt Visual Aids Styles PDF after conducting extensive research and examination. These presentation templates are constantly being generated and modified based on user preferences and critiques from editors. Here, you will find the most attractive templates for a range of purposes while taking into account ratings and remarks from users regarding the content. This is an excellent jumping off point to explore our content and will give new users an insight into our top notch PowerPoint Templates.
Dashboard Ppt PowerPoint Presentation Portfolio Graphic Tips
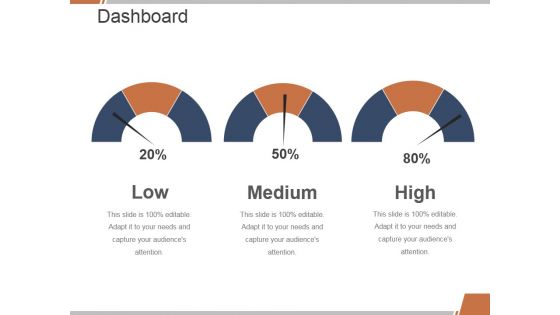
This is a dashboard ppt powerpoint presentation portfolio graphic tips. This is a three stage process. The stages in this process are dashboard, management, planning, strategy, marketing.
Dashboard Showing Construction Project Metrics Sample PDF
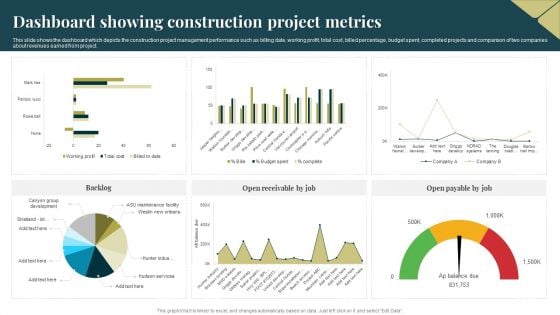
This slide shows the dashboard which depicts the construction project management performance such as billing date, working profit, total cost, billed percentage, budget spent, completed projects and comparison of two companies about revenues earned from project. Showcasing this set of slides titled Dashboard Showing Construction Project Metrics Sample PDF. The topics addressed in these templates are Dashboard, Construction Project Metrics. All the content presented in this PPT design is completely editable. Download it and make adjustments in color, background, font etc. as per your unique business setting.


 Continue with Email

 Home
Home


