Daily Snapshot
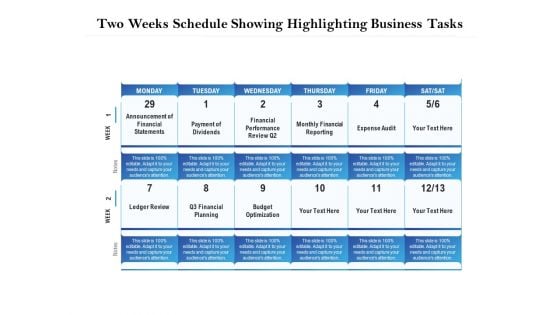
Two Weeks Schedule Showing Highlighting Business Tasks Ppt PowerPoint Presentation Pictures Background Designs PDF
Presenting this set of slides with name two weeks schedule showing highlighting business tasks ppt powerpoint presentation pictures background designs pdf. This is a two stage process. The stages in this process are announcement of financial statements, payment of dividends, financial performance review, monthly financial reporting, expense audit, ledger review, financial planning, budget optimization. This is a completely editable PowerPoint presentation and is available for immediate download. Download now and impress your audience.
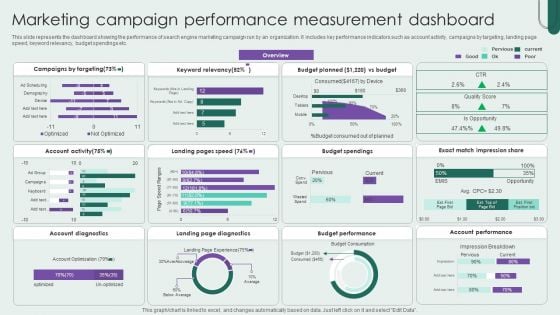
Marketing Campaign Performance Measurement Dashboard Download PDF
This slide represents the dashboard showing the performance of search engine marketing campaign run by an organization. It includes key performance indicators such as account activity, campaigns by targeting, landing page speed, keyword relevancy, budget spendings etc. Showcasing this set of slides titled Marketing Campaign Performance Measurement Dashboard Download PDF. The topics addressed in these templates are Keyword Relevancy, Campaigns By Targeting, Budget. All the content presented in this PPT design is completely editable. Download it and make adjustments in color, background, font etc. as per your unique business setting.
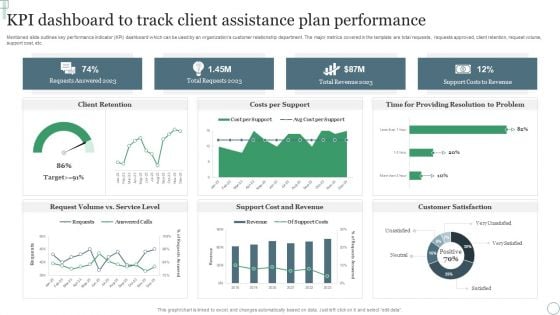
KPI Dashboard To Track Client Assistance Plan Performance Ppt Professional Outfit PDF
Mentioned slide outlines key performance indicator KPI dashboard which can be used by an organizations customer relationship department. The major metrics covered in the template are total requests, requests approved, client retention, request volume, support cost, etc. Pitch your topic with ease and precision using this KPI Dashboard To Track Client Assistance Plan Performance Ppt Professional Outfit PDF. This layout presents information on Requests Answered 2023, Total Requests 2023, Total Revenue 2023. It is also available for immediate download and adjustment. So, changes can be made in the color, design, graphics or any other component to create a unique layout.
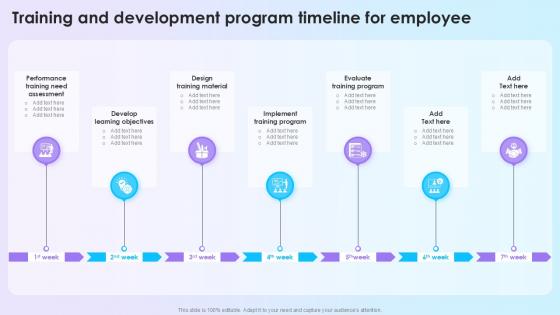
Training And Development Program Timeline For Employee
The Training And Development Program Timeline For Employee is a compilation of the most recent design trends as a series of slides. It is suitable for any subject or industry presentation, containing attractive visuals and photo spots for businesses to clearly express their messages. This template contains a variety of slides for the user to input data, such as structures to contrast two elements, bullet points, and slides for written information. Slidegeeks is prepared to create an impression. The training and development program timeline for employees offers visually appealing backdrop for any topic. The template presents ideas professionally and effectively, ensuring impactful presentation.
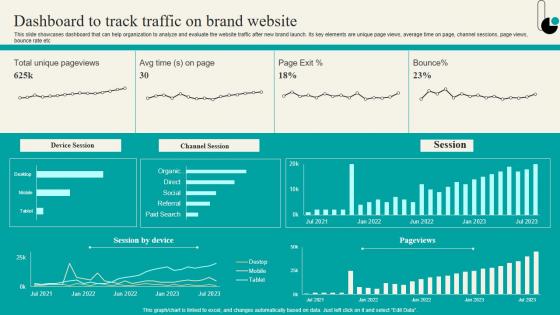
Dashboard To Track Traffic On Brand Website Strategic Marketing Plan Structure PDF
This slide showcases dashboard that can help organization to analyze and evaluate the website traffic after new brand launch. Its key elements are unique page views, average time on page, channel sessions, page views, bounce rate etc. Are you in need of a template that can accommodate all of your creative concepts This one is crafted professionally and can be altered to fit any style. Use it with Google Slides or PowerPoint. Include striking photographs, symbols, depictions, and other visuals. Fill, move around, or remove text boxes as desired. Test out color palettes and font mixtures. Edit and save your work, or work with colleagues. Download Dashboard To Track Traffic On Brand Website Strategic Marketing Plan Structure PDF and observe how to make your presentation outstanding. Give an impeccable presentation to your group and make your presentation unforgettable. This slide showcases dashboard that can help organization to analyze and evaluate the website traffic after new brand launch. Its key elements are unique page views, average time on page, channel sessions, page views, bounce rate etc.
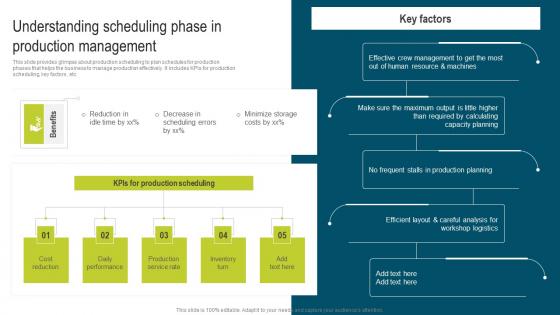
Understanding Scheduling Phase Developing Extensive Plan For Operational Ideas Pdf
This slide provides glimpse about production scheduling to plan schedules for production phases that helps the business to manage production effectively. It includes KPIs for production scheduling, key factors, etc. Find highly impressive Understanding Scheduling Phase Developing Extensive Plan For Operational Ideas Pdf on Slidegeeks to deliver a meaningful presentation. You can save an ample amount of time using these presentation templates. No need to worry to prepare everything from scratch because Slidegeeks experts have already done a huge research and work for you. You need to download Understanding Scheduling Phase Developing Extensive Plan For Operational Ideas Pdf for your upcoming presentation. All the presentation templates are 100 percent editable and you can change the color and personalize the content accordingly. Download now. This slide provides glimpse about production scheduling to plan schedules for production phases that helps the business to manage production effectively. It includes KPIs for production scheduling, key factors, etc.
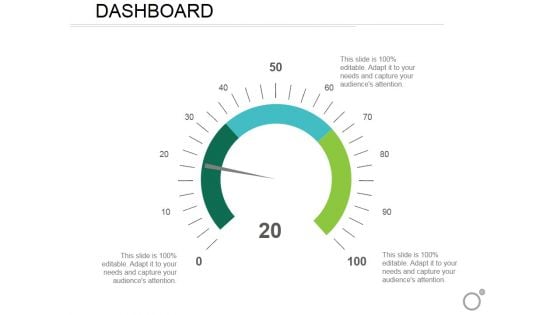
Dashboard Ppt PowerPoint Presentation Layouts Graphic Tips
This is a dashboard ppt powerpoint presentation layouts graphic tips. This is a one stage process. The stages in this process are dashboard, strategy, marketing, business, management.
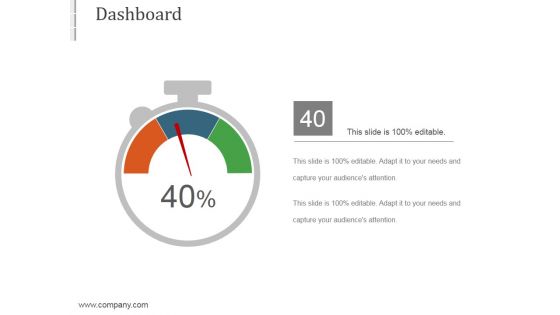
Dashboard Ppt PowerPoint Presentation Example File
This is a dashboard ppt powerpoint presentation example file. This is a one stage process. The stages in this process are business, marketing, strategy, success, dashboard.

Dashboard Template 1 Ppt PowerPoint Presentation Outline
This is a dashboard template 1 ppt powerpoint presentation outline. This is a one stage process. The stages in this process are dashboard, business, marketing, success, management.
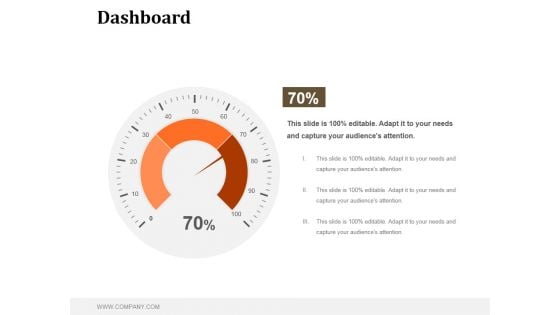
Dashboard Ppt PowerPoint Presentation Infographic Template
This is a dashboard ppt powerpoint presentation infographic template. This is a one stage process. The stages in this process are dashboard, business, technology, process, success.
Dashboard Ppt PowerPoint Presentation Infographic Template Slide
This is a dashboard ppt powerpoint presentation infographic template slide. This is a one stage process. The stages in this process are dashboard, technology, business, marketing, management.
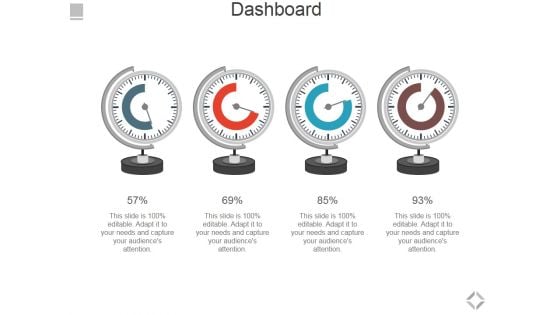
Dashboard Ppt PowerPoint Presentation Ideas Show
This is a dashboard ppt powerpoint presentation ideas show. This is a four stage process. The stages in this process are dashboard, business, technology, marketing, success.

Dashboard Ppt PowerPoint Presentation Summary Graphics
This is a dashboard ppt powerpoint presentation summary graphics. This is a one stage process. The stages in this process are dashboard, business, marketing, technology, process.
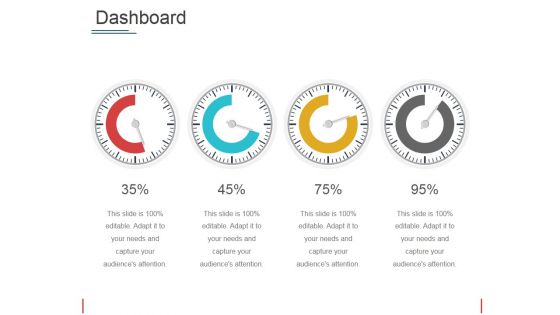
Dashboard Ppt PowerPoint Presentation Professional Inspiration
This is a dashboard ppt powerpoint presentation professional inspiration. This is a four stage process. The stages in this process are business, marketing, success, management, dashboard.
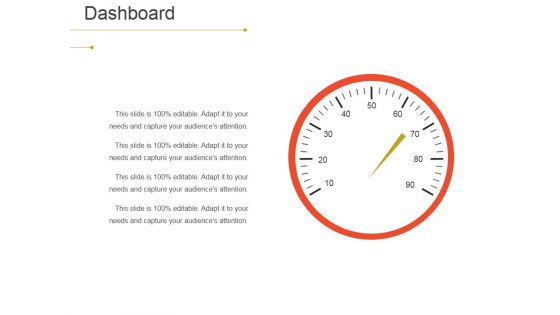
Dashboard Ppt PowerPoint Presentation Slides Show
This is a dashboard ppt powerpoint presentation slides show. This is a one stage process. The stages in this process are business, marketing, dashboard, management, technology.
Dashboard Ppt PowerPoint Presentation Icon Layout
This is a dashboard ppt powerpoint presentation icon layout. This is a two stage process. The stages in this process are we are dashboard, business, marketing, success, technology.
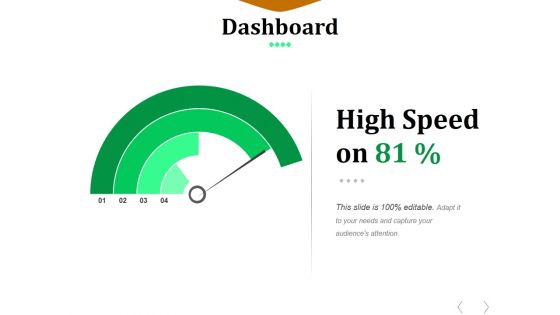
Dashboard Ppt PowerPoint Presentation Show Mockup
This is a dashboard ppt powerpoint presentation show mockup. This is a one stage process. The stages in this process are business, marketing, dashboard, finance, management.
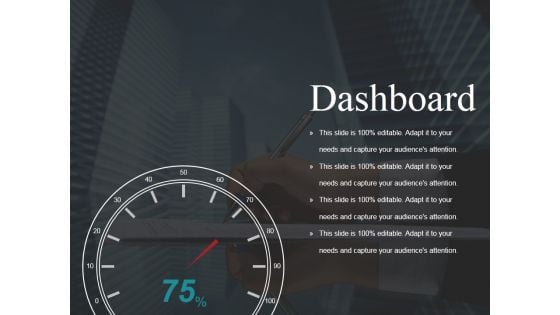
Dashboard Ppt PowerPoint Presentation File Objects
This is a dashboard ppt powerpoint presentation file objects. This is a one stage process. The stages in this process are dashboard, technology, marketing, business, process.
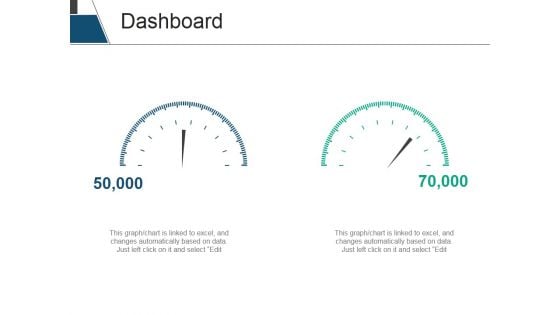
Dashboard Ppt PowerPoint Presentation Styles Diagrams
This is a dashboard ppt powerpoint presentation styles diagrams. This is a two stage process. The stages in this process are dashboard, business, process, technology, marketing.
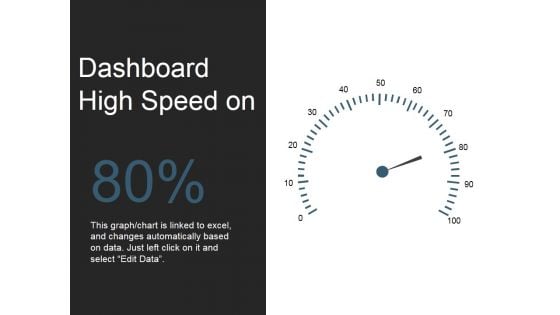
Dashboard Ppt PowerPoint Presentation File Ideas
This is a dashboard ppt powerpoint presentation file ideas. This is a one stage process. The stages in this process are dashboard, technology, business, marketing, process.
Dashboard Ppt PowerPoint Presentation Gallery Show
This is a dashboard ppt powerpoint presentation gallery show. This is a two stage process. The stages in this process are dashboard, management, business, marketing, process.
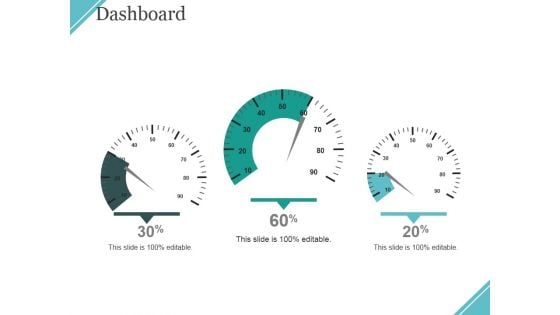
Dashboard Ppt PowerPoint Presentation Inspiration Styles
This is a dashboard ppt powerpoint presentation inspiration styles. This is a three stage process. The stages in this process are dashboard, process, marketing, business, management.
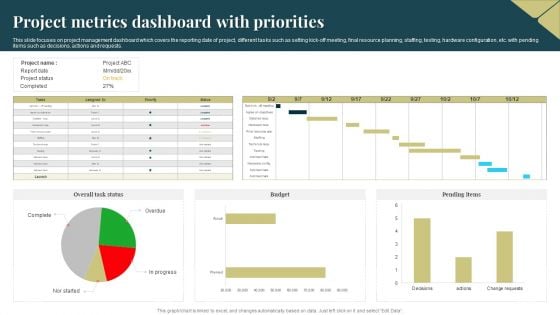
Project Metrics Dashboard With Priorities Formats PDF
This slide focuses on project management dashboard which covers the reporting date of project, different tasks such as setting kick-off meeting, final resource planning, staffing, testing, hardware configuration, etc. with pending items such as decisions, actions and requests. Showcasing this set of slides titled Project Metrics Dashboard With Priorities Formats PDF. The topics addressed in these templates are Budget, Project Metrics Dashboard. All the content presented in this PPT design is completely editable. Download it and make adjustments in color, background, font etc. as per your unique business setting.
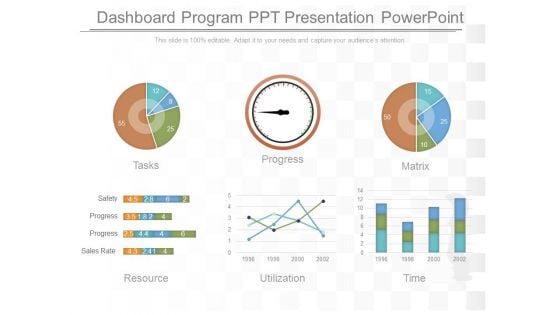
Dashboard Program Ppt Presentation Powerpoint
This is a dashboard program ppt presentation powerpoint. This is a six stage process. The stages in this process are tasks, progress, matrix, resource, utilization, time, safety, progress, sales rate.
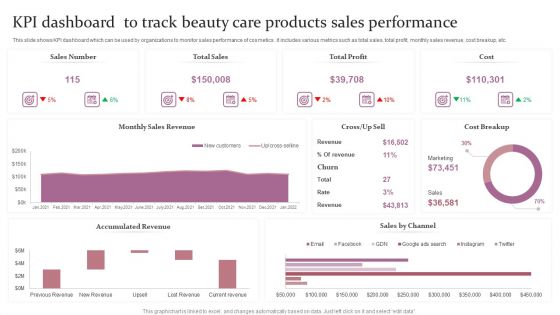
KPI Dashboard To Track Beauty Care Products Sales Performance Ppt Outline Pictures PDF
This slide shows the key performance indicators dashboard which can be used to analyze current financial position of cosmetic business. It includes metrics such as sales, expenses, profit, cash in hand, etc. Showcasing this set of slides titled KPI Dashboard To Track Beauty Care Products Sales Performance Ppt Outline Pictures PDF. The topics addressed in these templates are Sales Number, Total Sales, Total Profit, Cost. All the content presented in this PPT design is completely editable. Download it and make adjustments in color, background, font etc. as per your unique business setting.
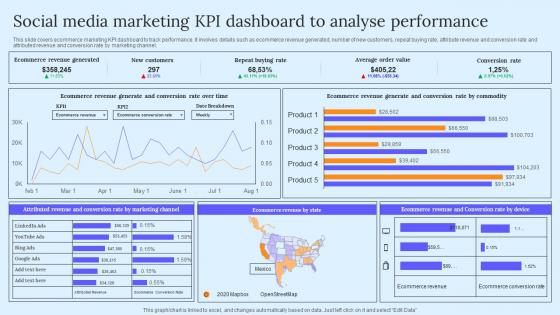
Social Media Marketing KPI Dashboard B2B Marketing Techniques To Attract Potential Pictures Pdf
This slide covers ecommerce marketing KPI dashboard to track performance. It involves details such as ecommerce revenue generated, number of new customers, repeat buying rate, attribute revenue and conversion rate and attributed revenue and conversion rate by marketing channel. Do you have an important presentation coming up Are you looking for something that will make your presentation stand out from the rest Look no further than Social Media Marketing KPI Dashboard B2B Marketing Techniques To Attract Potential Pictures Pdf. With our professional designs, you can trust that your presentation will pop and make delivering it a smooth process. And with Slidegeeks, you can trust that your presentation will be unique and memorable. So why wait Grab Social Media Marketing KPI Dashboard B2B Marketing Techniques To Attract Potential Pictures Pdf today and make your presentation stand out from the rest This slide covers ecommerce marketing KPI dashboard to track performance. It involves details such as ecommerce revenue generated, number of new customers, repeat buying rate, attribute revenue and conversion rate and attributed revenue and conversion rate by marketing channel.
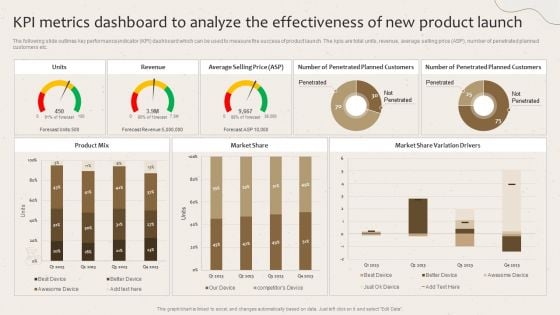
Kpi Metrics Dashboard To Analyze The Effectiveness Of New Product Launch Launching New Beverage Product Diagrams PDF
The following slide outlines key performance indicator KPI dashboard which can be used to measure the success of product launch. The kpis are total units, revenue, average selling price ASP, number of penetrated planned customers etc. Create an editable Kpi Metrics Dashboard To Analyze The Effectiveness Of New Product Launch Launching New Beverage Product Diagrams PDF that communicates your idea and engages your audience. Whether you are presenting a business or an educational presentation, pre-designed presentation templates help save time. Kpi Metrics Dashboard To Analyze The Effectiveness Of New Product Launch Launching New Beverage Product Diagrams PDF is highly customizable and very easy to edit, covering many different styles from creative to business presentations. Slidegeeks has creative team members who have crafted amazing templates. So, go and get them without any delay.

Infrastructure Monitoring Dashboard Structure PDF
This slide covers the dashboard which can be used to monitor the server count, geo activity, processor, memory space, network security, etc. Formulating a presentation can take up a lot of effort and time, so the content and message should always be the primary focus. The visuals of the PowerPoint can enhance the presenters message, so our Infrastructure Monitoring Dashboard Structure PDF was created to help save time. Instead of worrying about the design, the presenter can concentrate on the message while our designers work on creating the ideal templates for whatever situation is needed. Slidegeeks has experts for everything from amazing designs to valuable content, we have put everything into Infrastructure Monitoring Dashboard Structure PDF.
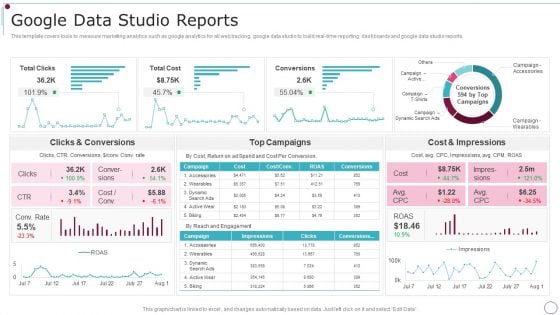
Playbook For Content Advertising Google Data Studio Reports Graphics PDF
This template covers tools to measure marketing analytics such as google analytics for all web tracking, google data studio to build real-time reporting dashboards and google data studio reports. Deliver an awe inspiring pitch with this creative Playbook For Content Advertising Google Data Studio Reports Graphics PDF bundle. Topics like Conversions, Campaigns, Impressions can be discussed with this completely editable template. It is available for immediate download depending on the needs and requirements of the user.
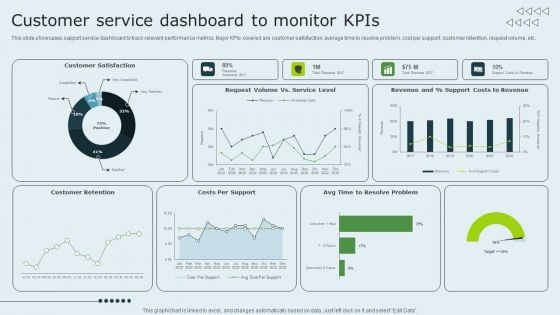
Enhancing Client Experience Customer Service Dashboard To Monitor Kpis Summary PDF
This slide showcases support service dashboard to track relevant performance metrics. Major KPIs covered are customer satisfaction, average time to resolve problem, cost per support, customer retention, request volume, etc. Formulating a presentation can take up a lot of effort and time, so the content and message should always be the primary focus. The visuals of the PowerPoint can enhance the presentes message, so our Enhancing Client Experience Customer Service Dashboard To Monitor Kpis Summary PDF was created to help save time. Instead of worrying about the design, the presenter can concentrate on the message while our designers work on creating the ideal templates for whatever situation is needed. Slidegeeks has experts for everything from amazing designs to valuable content, we have put everything into Enhancing Client Experience Customer Service Dashboard To Monitor Kpis Summary PDF.
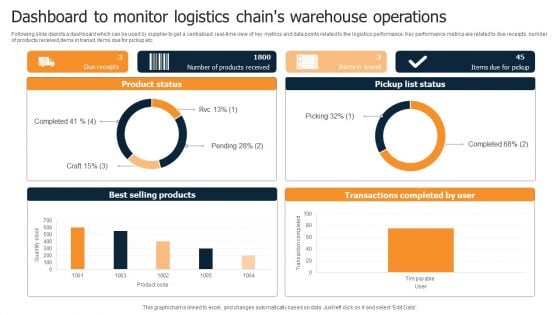
Dashboard To Monitor Logistics Chains Warehouse Operations Diagrams PDF
Following slide depicts a dashboard which can be used by supplier to get a centralized, real-time view of key metrics and data points related to the logistics performance. Key performance metrics are related to due receipts, number of products received,items in transit, items due for pickup etc. Pitch your topic with ease and precision using this Dashboard To Monitor Logistics Chains Warehouse Operations Diagrams PDF. This layout presents information on Product Status, Pickup List Status, Best Selling Products. It is also available for immediate download and adjustment. So, changes can be made in the color, design, graphics or any other component to create a unique layout.
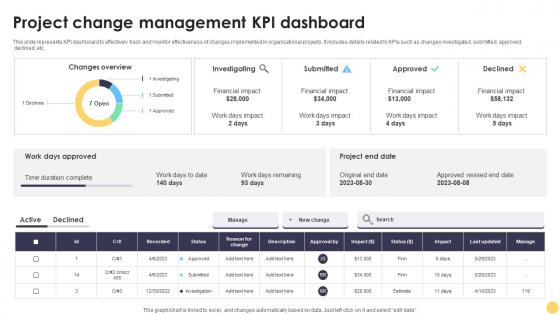
Project Change Management Kpi Dashboard Digital Project Management Strategies
This slide represents KPI dashboard to effectively track and monitor effectiveness of changes implemented in organizational projects. It includes details related to KPIs such as changes investigated, submitted, approved, declined, etc. Do you have to make sure that everyone on your team knows about any specific topic I yes, then you should give Project Change Management Kpi Dashboard Digital Project Management Strategies a try. Our experts have put a lot of knowledge and effort into creating this impeccable Project Change Management Kpi Dashboard Digital Project Management Strategies. You can use this template for your upcoming presentations, as the slides are perfect to represent even the tiniest detail. You can download these templates from the Slidegeeks website and these are easy to edit. So grab these today This slide represents KPI dashboard to effectively track and monitor effectiveness of changes implemented in organizational projects. It includes details related to KPIs such as changes investigated, submitted, approved, declined, etc.
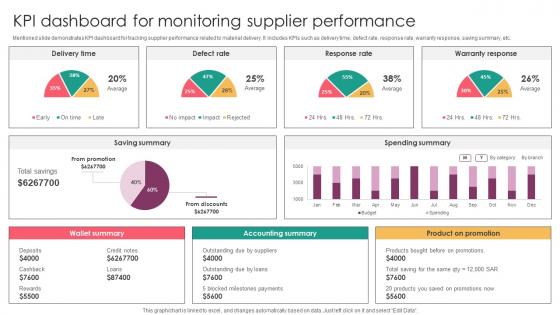
Strategic Supplier Evaluation KPI Dashboard For Monitoring Supplier Performance
Mentioned slide demonstrates KPI dashboard for tracking supplier performance related to material delivery. It includes KPIs such as delivery time, defect rate, response rate, warranty response, saving summary, etc. Formulating a presentation can take up a lot of effort and time, so the content and message should always be the primary focus. The visuals of the PowerPoint can enhance the presenters message, so our Strategic Supplier Evaluation KPI Dashboard For Monitoring Supplier Performance was created to help save time. Instead of worrying about the design, the presenter can concentrate on the message while our designers work on creating the ideal templates for whatever situation is needed. Slidegeeks has experts for everything from amazing designs to valuable content, we have put everything into Strategic Supplier Evaluation KPI Dashboard For Monitoring Supplier Performance. Mentioned slide demonstrates KPI dashboard for tracking supplier performance related to material delivery. It includes KPIs such as delivery time, defect rate, response rate, warranty response, saving summary, etc.
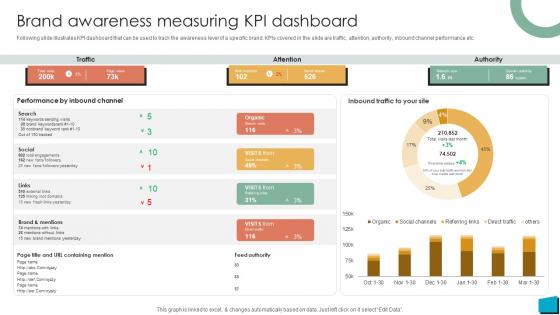
Brand Authority Brand Awareness Measuring KPI Dashboard Strategy SS V
Following slide illustrates KPI dashboard that can be used to track the awareness level of a specific brand. KPIs covered in the slide are traffic, attention, authority, inbound channel performance etc. Do you have to make sure that everyone on your team knows about any specific topic I yes, then you should give Brand Authority Brand Awareness Measuring KPI Dashboard Strategy SS V a try. Our experts have put a lot of knowledge and effort into creating this impeccable Brand Authority Brand Awareness Measuring KPI Dashboard Strategy SS V. You can use this template for your upcoming presentations, as the slides are perfect to represent even the tiniest detail. You can download these templates from the Slidegeeks website and these are easy to edit. So grab these today Following slide illustrates KPI dashboard that can be used to track the awareness level of a specific brand. KPIs covered in the slide are traffic, attention, authority, inbound channel performance etc.
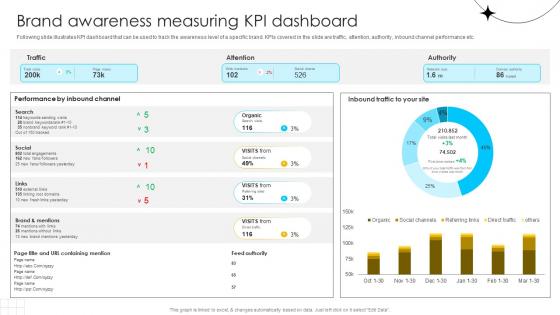
Brand Influence Brand Awareness Measuring KPI Dashboard Strategy SS V
Following slide illustrates KPI dashboard that can be used to track the awareness level of a specific brand. KPIs covered in the slide are traffic, attention, authority, inbound channel performance etc. Do you have to make sure that everyone on your team knows about any specific topic I yes, then you should give Brand Influence Brand Awareness Measuring KPI Dashboard Strategy SS V a try. Our experts have put a lot of knowledge and effort into creating this impeccable Brand Influence Brand Awareness Measuring KPI Dashboard Strategy SS V. You can use this template for your upcoming presentations, as the slides are perfect to represent even the tiniest detail. You can download these templates from the Slidegeeks website and these are easy to edit. So grab these today Following slide illustrates KPI dashboard that can be used to track the awareness level of a specific brand. KPIs covered in the slide are traffic, attention, authority, inbound channel performance etc.
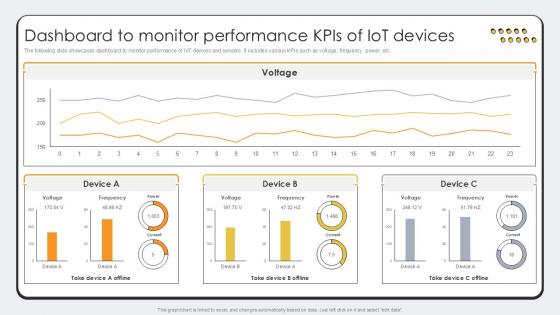
Dashboard To Monitor Performance Revolutionizing Production IoT Ppt Template
The following slide showcases dashboard to monitor performance of IoT devices and sensors. It includes various KPIs such as voltage, frequency, power, etc. Find highly impressive Dashboard To Monitor Performance Revolutionizing Production IoT Ppt Template on Slidegeeks to deliver a meaningful presentation. You can save an ample amount of time using these presentation templates. No need to worry to prepare everything from scratch because Slidegeeks experts have already done a huge research and work for you. You need to download Dashboard To Monitor Performance Revolutionizing Production IoT Ppt Template for your upcoming presentation. All the presentation templates are 100 percent editable and you can change the color and personalize the content accordingly. Download now The following slide showcases dashboard to monitor performance of IoT devices and sensors. It includes various KPIs such as voltage, frequency, power, etc.
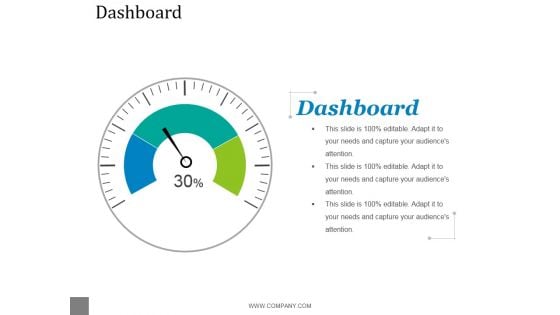
Dashboard Ppt PowerPoint Presentation Template
This is a dashboard ppt powerpoint presentation template. This is a one stage process. The stages in this process are dashboard, planning, marketing, business, management, strategy.
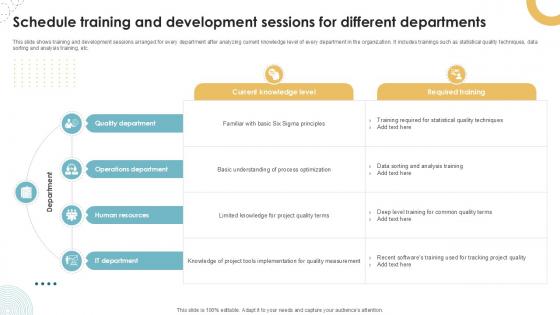
Schedule Training And Development Sessions Executing Quality Ppt Presentation PM SS V
This slide shows training and development sessions arranged for every department after analyzing current knowledge level of every department in the organization. It includes trainings such as statistical quality techniques, data sorting and analysis training, etc. If your project calls for a presentation, then Slidegeeks is your go-to partner because we have professionally designed, easy-to-edit templates that are perfect for any presentation. After downloading, you can easily edit Schedule Training And Development Sessions Executing Quality Ppt Presentation PM SS V and make the changes accordingly. You can rearrange slides or fill them with different images. Check out all the handy templates This slide shows training and development sessions arranged for every department after analyzing current knowledge level of every department in the organization. It includes trainings such as statistical quality techniques, data sorting and analysis training, etc.
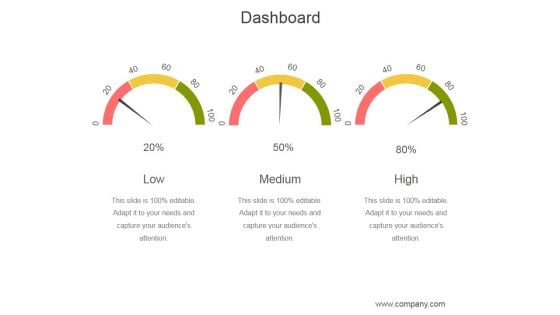
Dashboard Ppt PowerPoint Presentation Examples
This is a dashboard ppt powerpoint presentation examples. This is a three stage process. The stages in this process are low, medium, high.
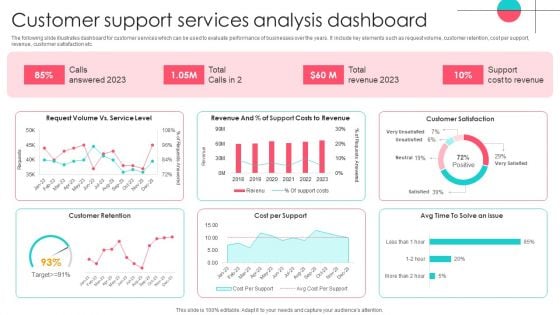
Customer Support Services Analysis Dashboard Template PDF
The following slide illustrates dashboard for customer services which can be used to evaluate performance of businesses over the years. It include key elements such as request volume, customer retention, cost per support, revenue, customer satisfaction etc. Showcasing this set of slides titled Customer Support Services Analysis Dashboard Template PDF. The topics addressed in these templates are Customer Support Services, Analysis Dashboard. All the content presented in this PPT design is completely editable. Download it and make adjustments in color, background, font etc. as per your unique business setting.
Dashboard Ppt PowerPoint Presentation Diagram Ppt
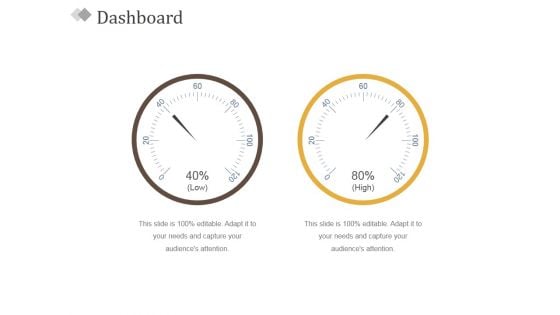
This is a dashboard ppt powerpoint presentation diagram ppt. This is a two stage process. The stages in this process are low, high, dashboard, technology, process.

Iot And Digital Twin To Reduce Costs Post Covid Healthcare Dashboard Showing Analytical Data Elements PDF
This slide shows the healthcare dashboard that presents analytical data such as occupancy, patient turnover, efficiency and costs, satisfaction and service indicators. Deliver and pitch your topic in the best possible manner with this iot and digital twin to reduce costs post covid healthcare dashboard showing analytical data elements pdf. Use them to share invaluable insights on occupancy, patient turnover, efficiency and costs, satisfaction and service indicators and impress your audience. This template can be altered and modified as per your expectations. So, grab it now.
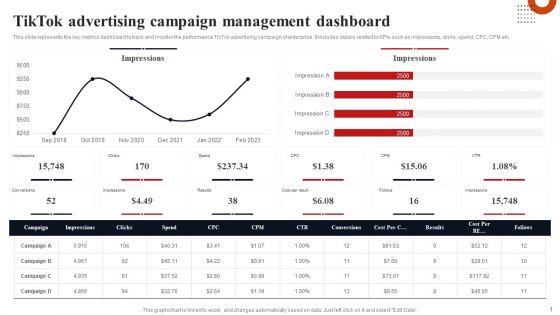
Tiktok Advertising Campaign Management Dashboard Pictures PDF
This slide represents the key metrics dashboard to track and monitor the performance TikTok advertising campaign of enterprise. It includes details related to KPIs such as impressions, clicks, spend, CPC, CPM etc. Crafting an eye catching presentation has never been more straightforward. Let your presentation shine with this tasteful yet straightforward Tiktok Advertising Campaign Management Dashboard Pictures PDF template. It offers a minimalistic and classy look that is great for making a statement. The colors have been employed intelligently to add a bit of playfulness while still remaining professional. Construct the ideal Tiktok Advertising Campaign Management Dashboard Pictures PDF that effortlessly grabs the attention of your audience Begin now and be certain to wow your customers.
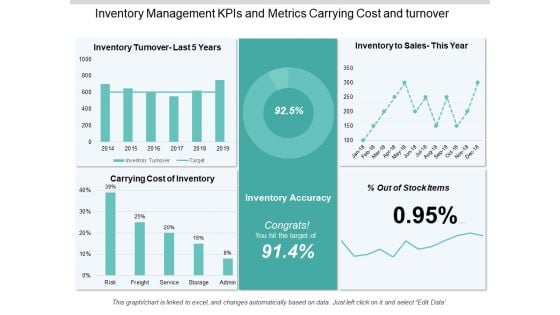
Inventory Management Kpis And Metrics Carrying Cost And Turnover Ppt PowerPoint Presentation Information
This is a inventory management kpis and metrics carrying cost and turnover ppt powerpoint presentation information. This is a five stage process. The stages in this process are logistics performance, logistics dashboard, logistics kpis.
Logistics Kpis And Metrics Percentage Of Orders Delivered Ppt PowerPoint Presentation Icon
This is a logistics kpis and metrics percentage of orders delivered ppt powerpoint presentation icon. This is a five stage process. The stages in this process are logistics performance, logistics dashboard, logistics kpis.
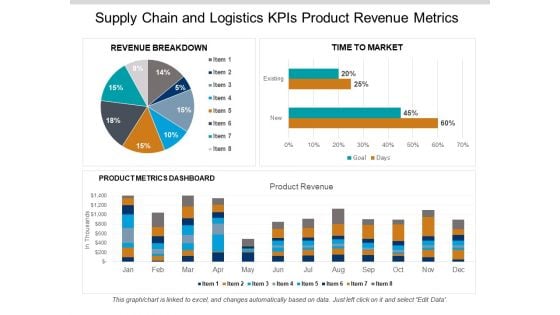
Supply Chain And Logistics Kpis Product Revenue Metrics Ppt PowerPoint Presentation Gallery Aids
This is a supply chain and logistics kpis product revenue metrics ppt powerpoint presentation gallery aids. This is a three stage process. The stages in this process are logistics performance, logistics dashboard, logistics kpis.
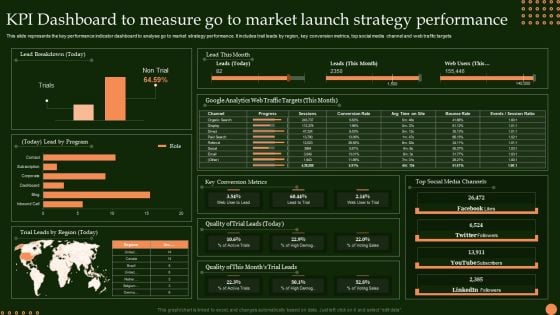
KPI Dashboard To Measure Go To Market Launch Strategy Performance Sample PDF
This slide represents the key performance indicator dashboard to analyse go to market strategy performance. It includes trail leads by region, key conversion metrics, top social media channel and web traffic targets Pitch your topic with ease and precision using this KPI Dashboard To Measure Go To Market Launch Strategy Performance Sample PDF. This layout presents information on Lead Breakdown, Lead By Program, Trial Leads Region. It is also available for immediate download and adjustment. So, changes can be made in the color, design, graphics or any other component to create a unique layout.
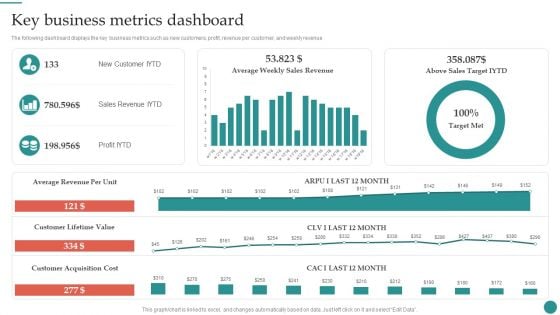
Key Business Metrics Dashboard Company Process Administration And Optimization Playbook Infographics PDF
The following dashboard displays the key business metrics such as new customers, profit, revenue per customer, and weekly revenue. Slidegeeks is here to make your presentations a breeze with Key Business Metrics Dashboard Company Process Administration And Optimization Playbook Infographics PDF With our easy-to-use and customizable templates, you can focus on delivering your ideas rather than worrying about formatting. With a variety of designs to choose from, you are sure to find one that suits your needs. And with animations and unique photos, illustrations, and fonts, you can make your presentation pop. So whether you are giving a sales pitch or presenting to the board, make sure to check out Slidegeeks first.
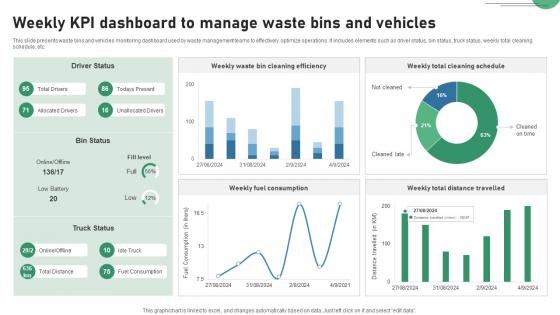
Weekly KPI Dashboard To Manage Waste Bins And Vehicles IOT Applications In Smart Waste IoT SS V
This slide presents waste bins and vehicles monitoring dashboard used by waste management teams to effectively optimize operations. It includes elements such as driver status, bin status, truck status, weekly total cleaning schedule, etc. Find highly impressive Weekly KPI Dashboard To Manage Waste Bins And Vehicles IOT Applications In Smart Waste IoT SS V on Slidegeeks to deliver a meaningful presentation. You can save an ample amount of time using these presentation templates. No need to worry to prepare everything from scratch because Slidegeeks experts have already done a huge research and work for you. You need to download Weekly KPI Dashboard To Manage Waste Bins And Vehicles IOT Applications In Smart Waste IoT SS V for your upcoming presentation. All the presentation templates are 100 percent editable and you can change the color and personalize the content accordingly. Download now. This slide presents waste bins and vehicles monitoring dashboard used by waste management teams to effectively optimize operations. It includes elements such as driver status, bin status, truck status, weekly total cleaning schedule, etc.

Project Change Management Kpi Dashboard Strategies For Success In Digital
This slide represents KPI dashboard to effectively track and monitor effectiveness of changes implemented in organizational projects. It includes details related to KPIs such as changes investigated, submitted, approved, declined, etc. Slidegeeks has constructed Project Change Management Kpi Dashboard Strategies For Success In Digital after conducting extensive research and examination. These presentation templates are constantly being generated and modified based on user preferences and critiques from editors. Here, you will find the most attractive templates for a range of purposes while taking into account ratings and remarks from users regarding the content. This is an excellent jumping-off point to explore our content and will give new users an insight into our top-notch PowerPoint Templates. This slide represents KPI dashboard to effectively track and monitor effectiveness of changes implemented in organizational projects. It includes details related to KPIs such as changes investigated, submitted, approved, declined, etc.
Dashboard For Tracking Mobile Commercial Banking Marketing Campaign Performance Slides PDF
This slide depicts a dashboard for tracking performance of marketing campaigns of mobile banking across paid media channels. The key performing indicators are client acquisition metrics, client conversion metrics, expense metrics among many others. Showcasing this set of slides titled Dashboard For Tracking Mobile Commercial Banking Marketing Campaign Performance Slides PDF. The topics addressed in these templates are Dashboard For Tracking Mobile, Commercial Banking, Marketing Campaign Performance. All the content presented in this PPT design is completely editable. Download it and make adjustments in color, background, font etc. as per your unique business setting.
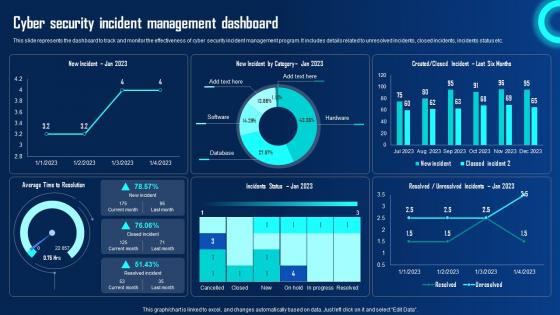
Cyber Security Incident Management Dashboard Ppt Powerpoint Presentation File Ideas Pdf
This slide represents the dashboard to track and monitor the effectiveness of cyber security incident management program. It includes details related to unresolved incidents, closed incidents, incidents status etc. Crafting an eye catching presentation has never been more straightforward. Let your presentation shine with this tasteful yet straightforward Cyber Security Incident Management Dashboard Ppt Powerpoint Presentation File Ideas Pdf template. It offers a minimalistic and classy look that is great for making a statement. The colors have been employed intelligently to add a bit of playfulness while still remaining professional. Construct the ideal Cyber Security Incident Management Dashboard Ppt Powerpoint Presentation File Ideas Pdf that effortlessly grabs the attention of your audience Begin now and be certain to wow your customers This slide represents the dashboard to track and monitor the effectiveness of cyber security incident management program. It includes details related to unresolved incidents, closed incidents, incidents status etc.
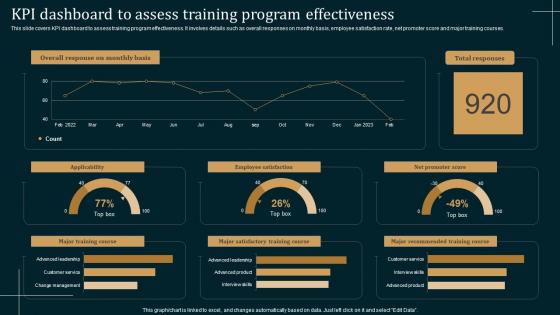
KPI Dashboard To Assess Training Employee Performance Improvement Strategies Structure Pdf
This slide covers KPI dashboard to assess training program effectiveness. It involves details such as overall responses on monthly basis, employee satisfaction rate, net promoter score and major training courses. Explore a selection of the finest KPI Dashboard To Assess Training Employee Performance Improvement Strategies Structure Pdf here. With a plethora of professionally designed and pre made slide templates, you can quickly and easily find the right one for your upcoming presentation. You can use our KPI Dashboard To Assess Training Employee Performance Improvement Strategies Structure Pdf to effectively convey your message to a wider audience. Slidegeeks has done a lot of research before preparing these presentation templates. The content can be personalized and the slides are highly editable. Grab templates today from Slidegeeks. This slide covers KPI dashboard to assess training program effectiveness. It involves details such as overall responses on monthly basis, employee satisfaction rate, net promoter score and major training courses.
Project Metrics Dashboard With Revenues And Expenses Icons PDF
This slide shows the project management dashboard which covers the name, priorities, indicators and status which includes strategic priorities, research and development, administration, performance management, etc. With purchases in last 30 days and tasks. Showcasing this set of slides titled Project Metrics Dashboard With Revenues And Expenses Icons PDF. The topics addressed in these templates are Performance Management, Research And Development, Strategic Priorities. All the content presented in this PPT design is completely editable. Download it and make adjustments in color, background, font etc. as per your unique business setting.
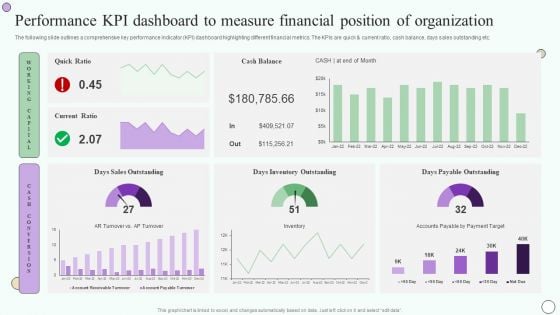
Estimating Business Overall Performance Kpi Dashboard To Measure Financial Position Inspiration PDF
The following slide outlines a comprehensive key performance indicator KPI dashboard highlighting different financial metrics. The KPIs are quick and current ratio, cash balance, days sales outstanding etc. Welcome to our selection of the Estimating Business Overall Performance Kpi Dashboard To Measure Financial Position Inspiration PDF. These are designed to help you showcase your creativity and bring your sphere to life. Planning and Innovation are essential for any business that is just starting out. This collection contains the designs that you need for your everyday presentations. All of our PowerPoints are 100 percent editable, so you can customize them to suit your needs. This multi-purpose template can be used in various situations. Grab these presentation templates today.
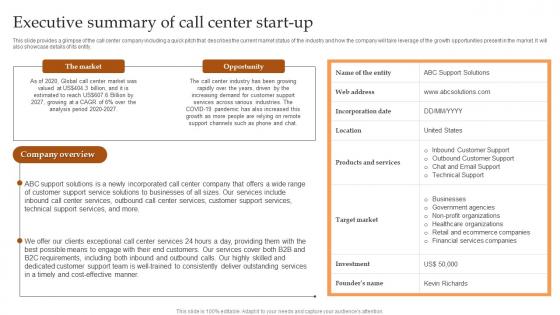
Executive Summary Of Call Center Start Up IT And Tech Support Business Background Pdf
This slide provides a glimpse of the call center company including a quick pitch that describes the current market status of the industry and how the company will take leverage of the growth opportunities present in the market. It will also showcase details of its entity. The best PPT templates are a great way to save time, energy, and resources. Slidegeeks have 100 percent editable powerpoint slides making them incredibly versatile. With these quality presentation templates, you can create a captivating and memorable presentation by combining visually appealing slides and effectively communicating your message. Download Executive Summary Of Call Center Start Up IT And Tech Support Business Background Pdf from Slidegeeks and deliver a wonderful presentation. This slide provides a glimpse of the call center company including a quick pitch that describes the current market status of the industry and how the company will take leverage of the growth opportunities present in the market. It will also showcase details of its entity.

Dashboard To Evaluate Top Performing Comprehensive Guide To Wholesale Ppt Presentation
This slide showcases dashboard which helps track sales representatives performance by assessing cold calling KPIs. it provides information regarding KPIs such as conversion rates, no. of items sold. No. of deals converted, value generated etc. Coming up with a presentation necessitates that the majority of the effort goes into the content and the message you intend to convey. The visuals of a PowerPoint presentation can only be effective if it supplements and supports the story that is being told. Keeping this in mind our experts created Dashboard To Evaluate Top Performing Comprehensive Guide To Wholesale Ppt Presentation to reduce the time that goes into designing the presentation. This way, you can concentrate on the message while our designers take care of providing you with the right template for the situation. This slide showcases dashboard which helps track sales representatives performance by assessing cold calling KPIs. it provides information regarding KPIs such as conversion rates, no. of items sold. No. of deals converted, value generated etc.
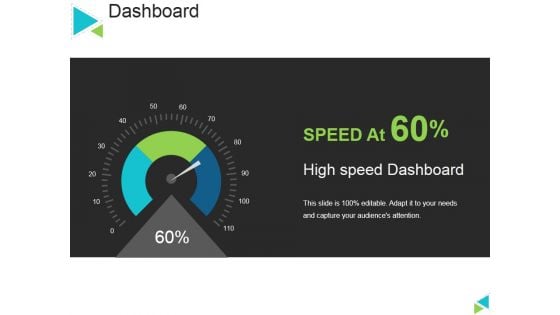
Dashboard Ppt PowerPoint Presentation Model Graphics Template
This is a dashboard ppt powerpoint presentation model graphics template. This is a one stage process. The stages in this process are high speed dashboard, speed, technology, business, marketing.
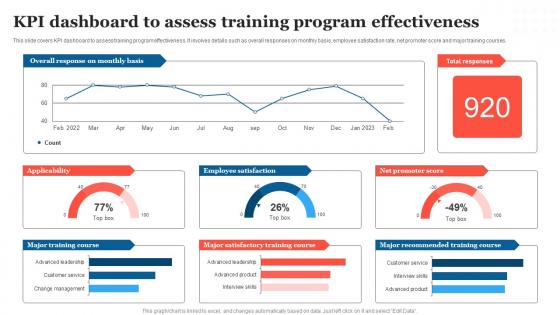
KPI Dashboard To Assess Training Strategic Measures To Boost Employee Efficienc Elements Pdf
This slide covers KPI dashboard to assess training program effectiveness. It involves details such as overall responses on monthly basis, employee satisfaction rate, net promoter score and major training courses. Present like a pro with KPI Dashboard To Assess Training Strategic Measures To Boost Employee Efficienc Elements Pdf Create beautiful presentations together with your team, using our easy to use presentation slides. Share your ideas in real time and make changes on the fly by downloading our templates. So whether you are in the office, on the go, or in a remote location, you can stay in sync with your team and present your ideas with confidence. With Slidegeeks presentation got a whole lot easier. Grab these presentations today. This slide covers KPI dashboard to assess training program effectiveness. It involves details such as overall responses on monthly basis, employee satisfaction rate, net promoter score and major training courses.
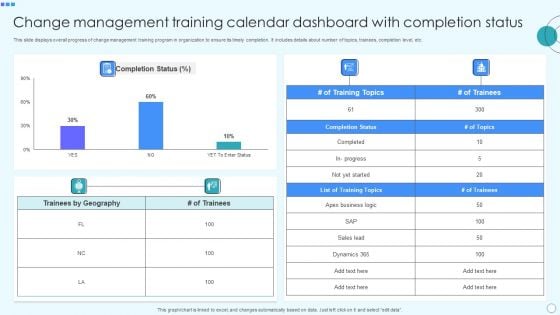
Change Management Training Calendar Dashboard With Completion Status Portrait PDF
This slide displays overall progress of change management training program in organization to ensure its timely completion. It includes details about number of topics, trainees, completion level, etc. Pitch your topic with ease and precision using this Change Management Training Calendar Dashboard With Completion Status Portrait PDF. This layout presents information on Business Logic, Geography, Completion Status, Sales Lead, Dynamics. It is also available for immediate download and adjustment. So, changes can be made in the color, design, graphics or any other component to create a unique layout.


 Continue with Email

 Home
Home


