Daily Snapshot

Engineering Performance Metrics Dashboard To Track Pull Requests Background PDF
This slide covers engineering KPI dashboard to track pull request. It involves KPIs such as open time of average pull requests, average comment received, revision rounds, frequency of posting pull requests. Pitch your topic with ease and precision using this Engineering Performance Metrics Dashboard To Track Pull Requests Background PDF. This layout presents information on Dashboard Track Pull Requests, Engineering Performance Metrics. It is also available for immediate download and adjustment. So, changes can be made in the color, design, graphics or any other component to create a unique layout.
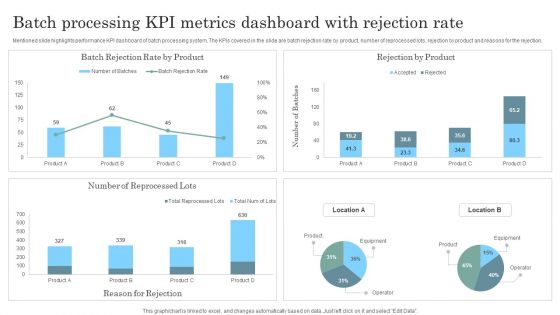
Batch Processing KPI Metrics Dashboard With Rejection Rate Topics PDF
Mentioned slide highlights performance KPI dashboard of batch processing system. The KPIs covered in the slide are batch rejection rate by product, number of reprocessed lots, rejection by product and reasons for the rejection. Pitch your topic with ease and precision using this Batch Processing KPI Metrics Dashboard With Rejection Rate Topics PDF. This layout presents information on Batch Processing KPI Metrics, Dashboard Rejection Rate. It is also available for immediate download and adjustment. So, changes can be made in the color, design, graphics or any other component to create a unique layout.
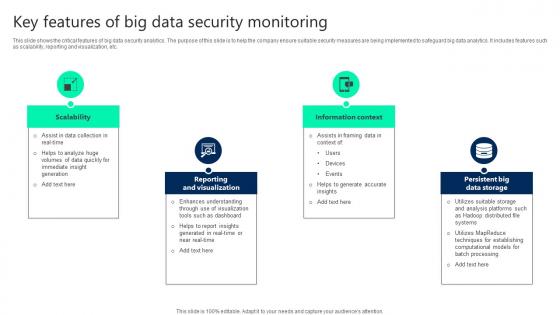
Key Features Of Big Data Security Monitoring Ideas pdf
This slide shows the critical features of big data security analytics. The purpose of this slide is to help the company ensure suitable security measures are being implemented to safeguard big data analytics. It includes features such as scalability, reporting and visualization, etc. Pitch your topic with ease and precision using this Key Features Of Big Data Security Monitoring Ideas pdf. This layout presents information on Scalability, Reporting And Visualization, Information Context. It is also available for immediate download and adjustment. So, changes can be made in the color, design, graphics or any other component to create a unique layout. This slide shows the critical features of big data security analytics. The purpose of this slide is to help the company ensure suitable security measures are being implemented to safeguard big data analytics. It includes features such as scalability, reporting and visualization, etc.
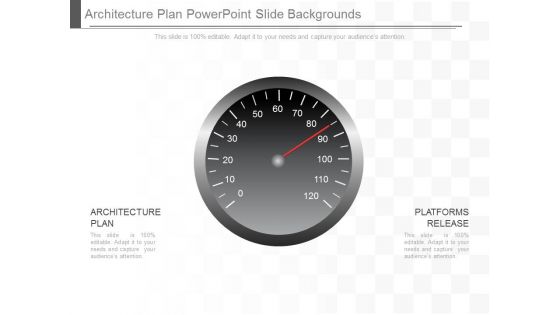
Architecture Plan Powerpoint Slide Backgrounds
This is a architecture plan powerpoint slide backgrounds. This is a two stage process. The stages in this process are architecture plan, platforms release.
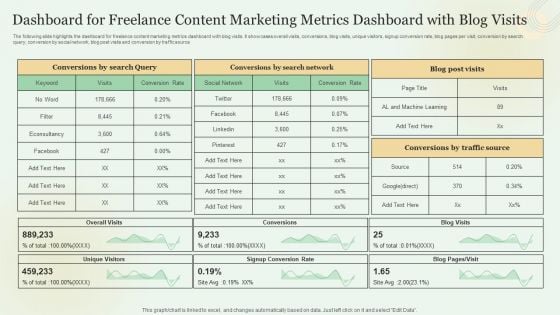
Dashboard For Freelance Content Marketing Metrics Dashboard With Blog Visits Guidelines PDF
Showcasing this set of slides titled Dashboard For Freelance Content Marketing Metrics Dashboard With Blog Visits Guidelines PDF. The topics addressed in these templates are Traffic Source, Signup Conversion Rate, Search Network. All the content presented in this PPT design is completely editable. Download it and make adjustments in color, background, font etc. as per your unique business setting. The following slide highlights the dashboard for freelance content marketing metrics dashboard with blog visits. It showcases overall visits, conversions, blog visits, unique visitors, signup conversion rate, blog pages per visit, conversion by search query, conversion by social network, blog post visits and conversion by traffic source
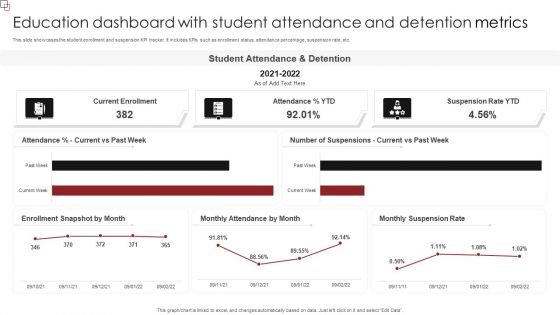
Education Dashboard With Student Attendance And Detention Metrics Inspiration PDF
This slide showcases the student enrollment and suspension KPI tracker. It includes KPIs such as enrollment status, attendance percentage, suspension rate, etc. Pitch your topic with ease and precision using this Education Dashboard With Student Attendance And Detention Metrics Inspiration PDF. This layout presents information on Student Attendance, Suspension Rate YTD, Current Enrollment. It is also available for immediate download and adjustment. So, changes can be made in the color, design, graphics or any other component to create a unique layout.

Timeline To Conduct Statistical Data Analytics For Informed Decision Ppt Presentation
This slide shows the timeline for performing statistical data analysis. The key steps include writing hypothesis and plan research design, collect data from a sample, summarize data with descriptive statistics, test hypotheses, result interpretation, etc. Slidegeeks is here to make your presentations a breeze with Timeline To Conduct Statistical Data Analytics For Informed Decision Ppt Presentation With our easy-to-use and customizable templates, you can focus on delivering your ideas rather than worrying about formatting. With a variety of designs to choose from, you are sure to find one that suits your needs. And with animations and unique photos, illustrations, and fonts, you can make your presentation pop. So whether you are giving a sales pitch or presenting to the board, make sure to check out Slidegeeks first This slide shows the timeline for performing statistical data analysis. The key steps include writing hypothesis and plan research design, collect data from a sample, summarize data with descriptive statistics, test hypotheses, result interpretation, etc.
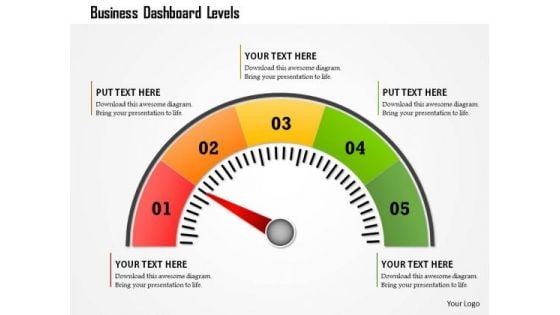
Business Framework Business Dashboard Levels PowerPoint Presentation
This business diagram displays colored meter with multiple levels. Use this diagram to display business process. This diagram can be used to indicate performance measures. This is an excellent diagram to impress your audiences.
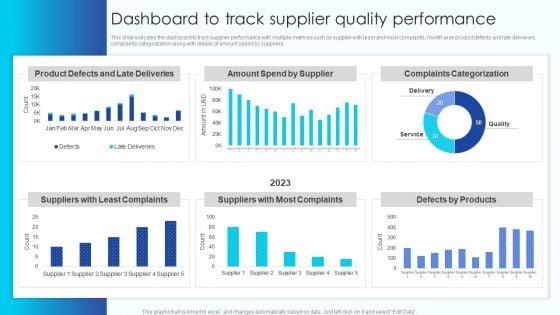
Dashboard To Track Supplier Quality Performance Vendor Management Program For Supplier Infographics PDF
This slide indicates the dashboard to track supplier performance with multiple metrices such as supplier with least and most complaints, month wise product defects and late deliveries, complaints categorization along with details of amount spend by suppliers.Boost your pitch with our creative Dashboard To Track Supplier Quality Performance Vendor Management Program For Supplier Infographics PDF. Deliver an awe-inspiring pitch that will mesmerize everyone. Using these presentation templates you will surely catch everyones attention. You can browse the ppts collection on our website. We have researchers who are experts at creating the right content for the templates. So you do not have to invest time in any additional work. Just grab the template now and use them.
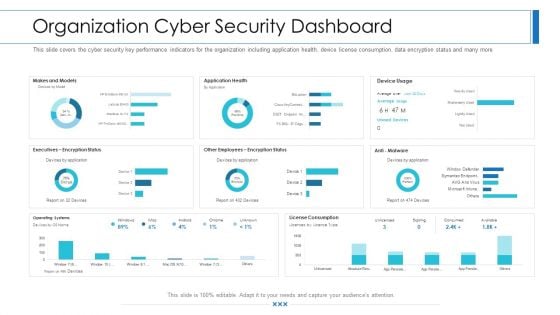
Workforce Security Realization Coaching Plan Organization Cyber Security Dashboard Template PDF
This slide covers the cyber security key performance indicators for the organization including application health, device license consumption, data encryption status and many more. Deliver an awe-inspiring pitch with this creative workforce security realization coaching plan organization cyber security dashboard template pdf bundle. Topics like makes and models, operating systems, encryption status, application health, license consumption can be discussed with this completely editable template. It is available for immediate download depending on the needs and requirements of the user.
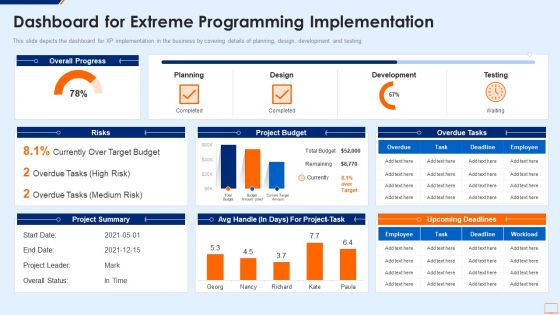
Extreme Programming Methodology IT Dashboard For Extreme Programming Demonstration PDF
This slide depicts the dashboard for XP implementation in the business by covering details of planning, design, development and testing.Deliver and pitch your topic in the best possible manner with this extreme programming methodology it dashboard for extreme programming demonstration pdf. Use them to share invaluable insights on dashboard for extreme programming implementation and impress your audience. This template can be altered and modified as per your expectations. So, grab it now.
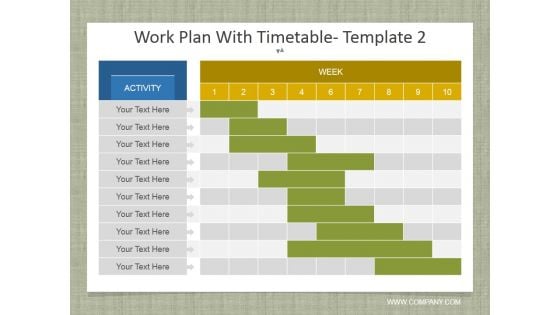
Work Plan With Timetable Template 2 Ppt PowerPoint Presentation File Ideas
This is a work plan with timetable template 2 ppt powerpoint presentation file ideas. This is a ten stage process. The stages in this process are table, activity, business, marketing, plan.
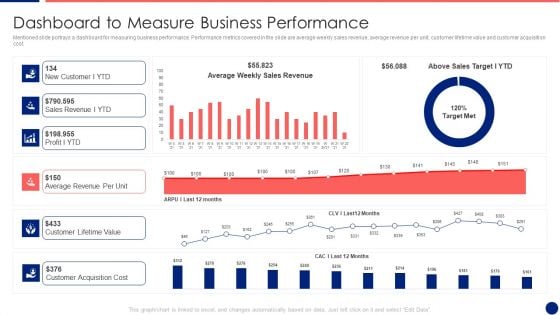
Information Technology Service Integration Post Acquisition Merger Dashboard To Measure Business Pictures PDF
Mentioned slide portrays a dashboard for measuring business performance. Performance metrics covered in the slide are average weekly sales revenue, average revenue per unit, customer lifetime value and customer acquisition cost. Deliver and pitch your topic in the best possible manner with this information technology service integration post acquisition merger dashboard to measure business pictures pdf. Use them to share invaluable insights on sales revenue, average, cost and impress your audience. This template can be altered and modified as per your expectations. So, grab it now.
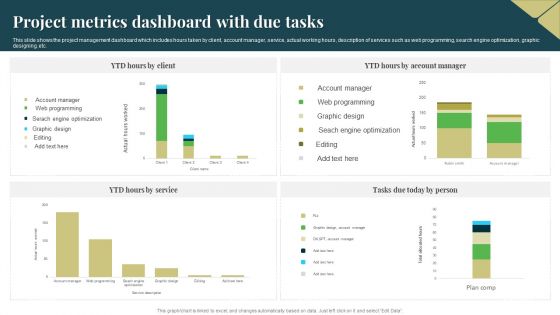
Project Metrics Dashboard With Due Tasks Microsoft PDF
This slide shows the project management dashboard which includes hours taken by client, account manager, service, actual working hours, description of services such as web programming, search engine optimization, graphic designing, etc. Pitch your topic with ease and precision using this Project Metrics Dashboard With Due Tasks Microsoft PDF. This layout presents information on Service, Optimization, Graphic Design. It is also available for immediate download and adjustment. So, changes can be made in the color, design, graphics or any other component to create a unique layout.
Insurance Agency Activities Tracking Dashboard Themes PDF
This slide provides glimpse about insurance agency activities tracking dashboard which help management in monitoring activities. This modern and well-arranged Insurance Agency Activities Tracking Dashboard Themes PDF provides lots of creative possibilities. It is very simple to customize and edit with the Powerpoint Software. Just drag and drop your pictures into the shapes. All facets of this template can be edited with Powerpoint, no extra software is necessary. Add your own material, put your images in the places assigned for them, adjust the colors, and then you can show your slides to the world, with an animated slide included.
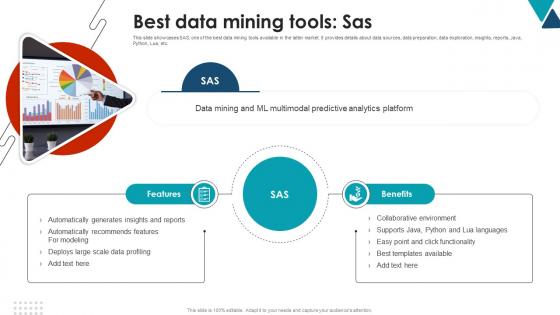
Best Data Mining Tools SaS Using Data Mining Tools To Optimize Processes AI SS V
This slide showcases SAS, one of the best data mining tools available in the latter market. It provides details about data sources, data preparation, data exploration, insights, reports, Java, Python, Lua, etc. There are so many reasons you need a Best Data Mining Tools SaS Using Data Mining Tools To Optimize Processes AI SS V. The first reason is you can not spend time making everything from scratch, Thus, Slidegeeks has made presentation templates for you too. You can easily download these templates from our website easily. This slide showcases SAS, one of the best data mining tools available in the latter market. It provides details about data sources, data preparation, data exploration, insights, reports, Java, Python, Lua, etc.
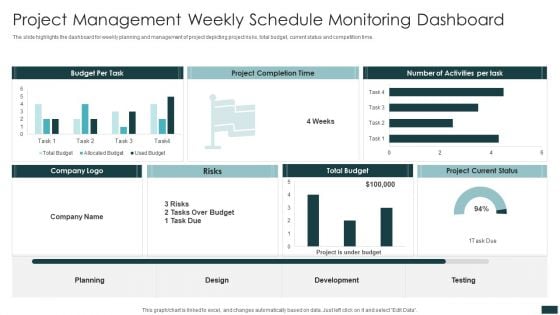
Project Management Weekly Schedule Monitoring Dashboard Summary PDF
The slide highlights the dashboard for weekly planning and management of project depicting project risks, total budget, current status and competition time. Showcasing this set of slides titled Project Management Weekly Schedule Monitoring Dashboard Summary PDF. The topics addressed in these templates are Budget Per Task, Project Completion Time, Total Budget. All the content presented in this PPT design is completely editable. Download it and make adjustments in color, background, font etc. as per your unique business setting.
Four Steps For Business Plans Outline Powerpoint Slides
Visually support your presentation with our above template containing four circles with icons. This diagram slide helps to display business plan outline. Etch your views in the brains of your audience with this diagram slide.
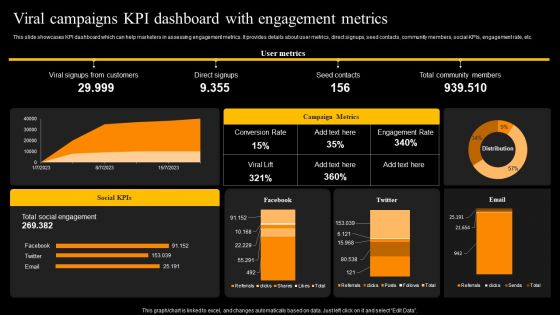
Viral Campaigns Kpi Dashboard With Engagement Metrics Template PDF
This slide showcases KPI dashboard which can help marketers in assessing engagement metrics. It provides details about user metrics, direct signups, seed contacts, community members, social KPIs, engagement rate, etc. Want to ace your presentation in front of a live audience Our Viral Campaigns Kpi Dashboard With Engagement Metrics Template PDF can help you do that by engaging all the users towards you. Slidegeeks experts have put their efforts and expertise into creating these impeccable powerpoint presentations so that you can communicate your ideas clearly. Moreover, all the templates are customizable, and easy to edit and downloadable. Use these for both personal and commercial use.
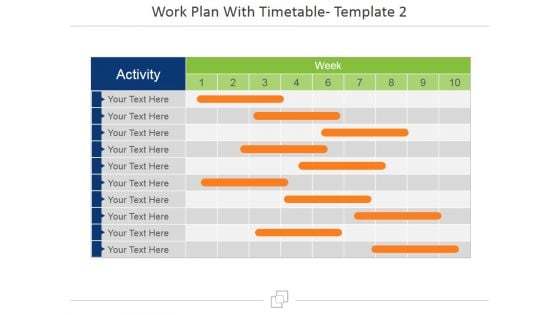
Work Plan With Timetable Template 2 Ppt PowerPoint Presentation Inspiration Graphics
This is a work plan with timetable template 2 ppt powerpoint presentation inspiration graphics. This is a ten stage process. The stages in this process are week, activity, business, marketing, table.
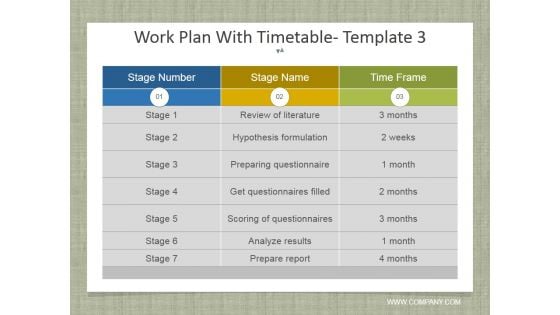
Work Plan With Timetable Template 3 Ppt PowerPoint Presentation Inspiration Styles
This is a work plan with timetable template 3 ppt powerpoint presentation inspiration styles. This is a seven stage process. The stages in this process are review of literature, hypothesis formulation, preparing questionnaire, get questionnaires filled, scoring of questionnaires.
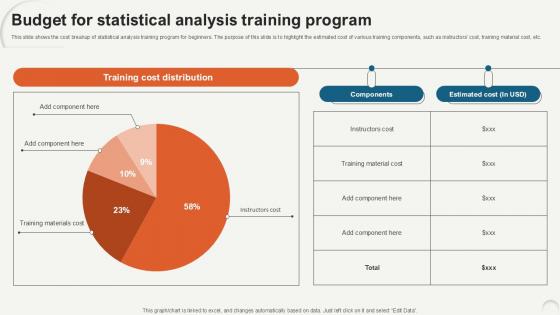
Budget For Statistical Data Analytics For Informed Decision Ppt Slide
This slide shows the cost breakup of statistical analysis training program for beginners. The purpose of this slide is to highlight the estimated cost of various training components, such as instructors cost, training material cost, etc. Do you have to make sure that everyone on your team knows about any specific topic I yes, then you should give Budget For Statistical Data Analytics For Informed Decision Ppt Slide a try. Our experts have put a lot of knowledge and effort into creating this impeccable Budget For Statistical Data Analytics For Informed Decision Ppt Slide. You can use this template for your upcoming presentations, as the slides are perfect to represent even the tiniest detail. You can download these templates from the Slidegeeks website and these are easy to edit. So grab these today This slide shows the cost breakup of statistical analysis training program for beginners. The purpose of this slide is to highlight the estimated cost of various training components, such as instructors cost, training material cost, etc.
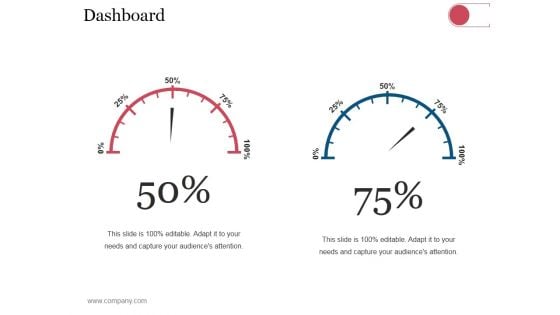
Dashboard Ppt PowerPoint Presentation Outline Grid
This is a dashboard ppt powerpoint presentation outline grid. This is a two stage process. The stages in this process are business, strategy, analysis, planning, dashboard, finance.
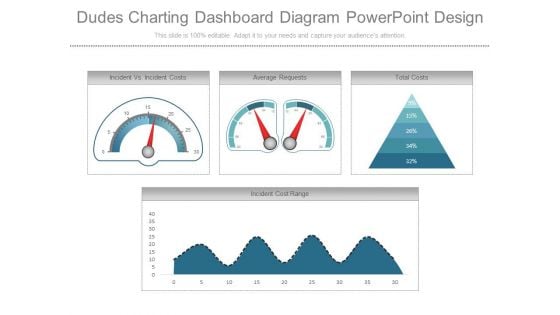
Dudes Charting Dashboard Diagram Powerpoint Design
This is a dudes charting dashboard diagram powerpoint design. This is a four stage process. The stages in this process are incident vs incident costs, average requests, total costs, incident cost range.
Marketing Success Metrics Dashboard For Tracking Business Blog Kpis Brochure PDF
This slide covers the dashboard for analyzing blogging KPIs such as performance, published posts, views, new blog subscribers, top blog posts by pageviews, top blog posts by CTR, etc. Retrieve professionally designed Marketing Success Metrics Dashboard For Tracking Business Blog Kpis Brochure PDF to effectively convey your message and captivate your listeners. Save time by selecting pre-made slideshows that are appropriate for various topics, from business to educational purposes. These themes come in many different styles, from creative to corporate, and all of them are easily adjustable and can be edited quickly. Access them as PowerPoint templates or as Google Slides themes. You dont have to go on a hunt for the perfect presentation because Slidegeeks got you covered from everywhere.
Integrating Social Media Tactics Dashboard For Tracking Social Media Kpis Introduction PDF
This slide shows dashboard for tracking social media key performance indicators KPIs. It provides details about average social engagement, reactions, comments, shares, clicks, thumbnail, platform, post message, etc. Deliver an awe inspiring pitch with this creative Integrating Social Media Tactics Dashboard For Tracking Social Media Kpis Introduction PDF bundle. Topics like Month Upper Fence, Social KPIs, Conversion Rate can be discussed with this completely editable template. It is available for immediate download depending on the needs and requirements of the user.
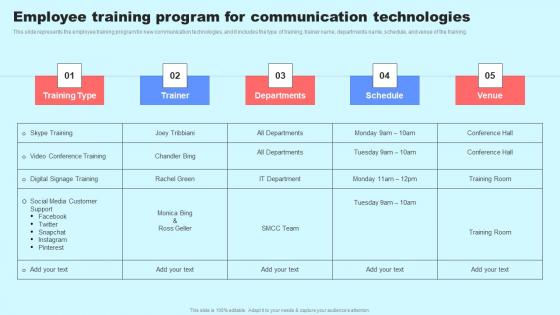
Social Media In Customer Support Employee Training Program For Communication Background Pdf
This slide represents the employee training program for new communication technologies, and it includes the type of training, trainer name, departments name, schedule, and venue of the training. Slidegeeks is here to make your presentations a breeze with Social Media In Customer Support Employee Training Program For Communication Background Pdf With our easy to use and customizable templates, you can focus on delivering your ideas rather than worrying about formatting. With a variety of designs to choose from, you are sure to find one that suits your needs. And with animations and unique photos, illustrations, and fonts, you can make your presentation pop. So whether you are giving a sales pitch or presenting to the board, make sure to check out Slidegeeks first This slide represents the employee training program for new communication technologies, and it includes the type of training, trainer name, departments name, schedule, and venue of the training.
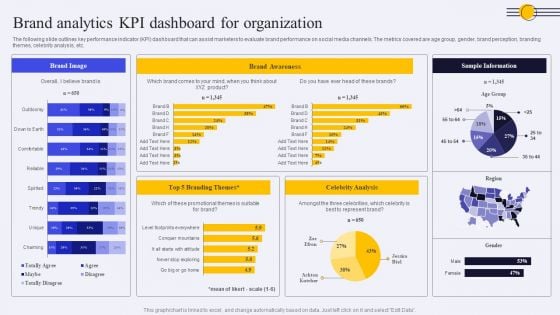
Brand Analytics KPI Dashboard For Organization Ppt PowerPoint Presentation Diagram PDF
The following slide outlines key performance indicator KPI dashboard that can assist marketers to evaluate brand performance on social media channels. The metrics covered are age group, gender, brand perception, branding themes, celebrity analysis, etc. Take your projects to the next level with our ultimate collection of Brand Analytics KPI Dashboard For Organization Ppt PowerPoint Presentation Diagram PDF. Slidegeeks has designed a range of layouts that are perfect for representing task or activity duration, keeping track of all your deadlines at a glance. Tailor these designs to your exact needs and give them a truly corporate look with your own brand colors they will make your projects stand out from the rest.
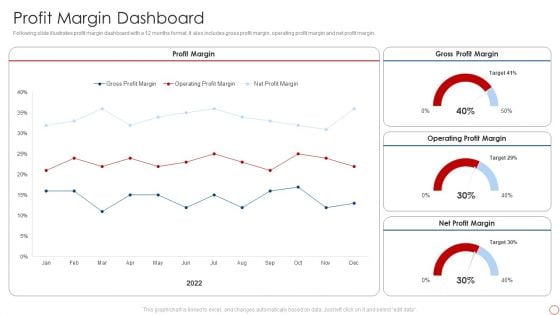
Kpis For Evaluating Business Sustainability Profit Margin Dashboard Pictures PDF
Following slide illustrates profit margin dashboard with a 12 months format. It also includes gross profit margin, operating profit margin and net profit margin. Deliver and pitch your topic in the best possible manner with this Kpis For Evaluating Business Sustainability Profit Margin Dashboard Pictures PDF. Use them to share invaluable insights on Profit Margin, Gross Profit Margin, Operating Profit Margin and impress your audience. This template can be altered and modified as per your expectations. So, grab it now.
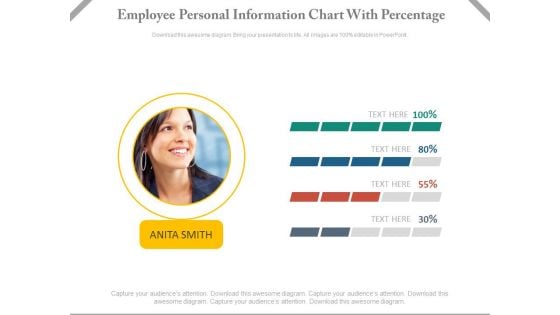
Employee Performance Information Chart Powerpoint Slides
This dashboard template contains employee picture with percentage slides. This dashboard PowerPoint template conveys employees performance in a visual manner. Download this PPT slide for quick decision-making.
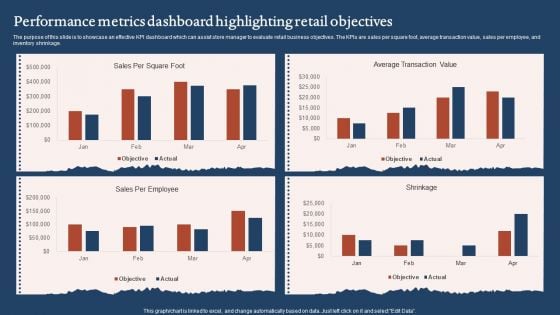
Performance Metrics Dashboard Highlighting Retail Objectives Sample PDF
The purpose of this slide is to showcase an effective KPI dashboard which can assist store manager to evaluate retail business objectives. The KPIs are sales per square foot, average transaction value, sales per employee, and inventory shrinkage. Pitch your topic with ease and precision using this Performance Metrics Dashboard Highlighting Retail Objectives Sample PDF. This layout presents information on Average Transaction Value, Sales Per Employee. It is also available for immediate download and adjustment. So, changes can be made in the color, design, graphics or any other component to create a unique layout.
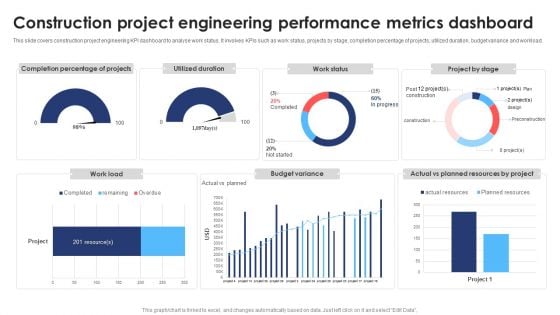
Construction Project Engineering Performance Metrics Dashboard Ideas PDF
This slide covers construction project engineering KPI dashboard to analyse work status. It involves KPIs such as work status, projects by stage, completion percentage of projects, utilized duration, budget variance and workload. Showcasing this set of slides titled Construction Project Engineering Performance Metrics Dashboard Ideas PDF. The topics addressed in these templates are Budget Variance, Resource, Project. All the content presented in this PPT design is completely editable. Download it and make adjustments in color, background, font etc. as per your unique business setting.

KPI Analytics Dashboard With Sourcing Raw Material Cycle Time Inspiration PDF
Following slide shows the key performance indicator KPI dashboard which will assist corporates to effectively monitor procurement process. The metrics are number of suppliers, contract compliance, average procurement cycle time, etc. Showcasing this set of slides titled KPI Analytics Dashboard With Sourcing Raw Material Cycle Time Inspiration PDF. The topics addressed in these templates are Kpi Analytics Dashboard, Sourcing Raw Material, Cycle Time. All the content presented in this PPT design is completely editable. Download it and make adjustments in color, background, font etc. as per your unique business setting.
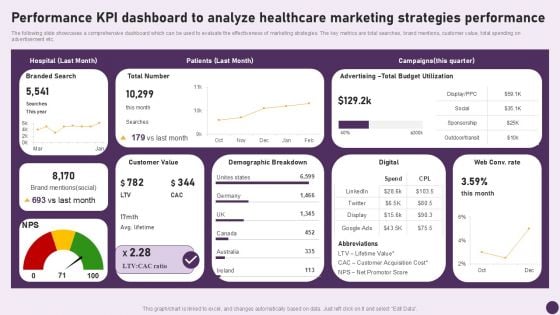
Guide To Healthcare Services Administration Performance KPI Dashboard To Analyze Healthcare Marketing Clipart PDF
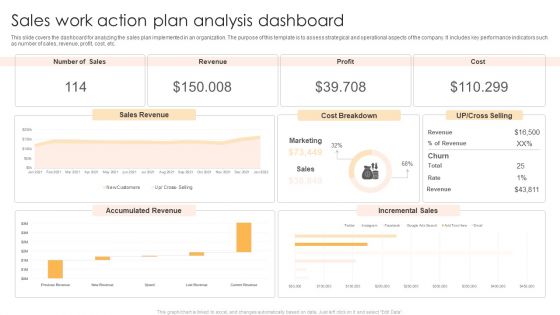
Sales Work Action Plan Analysis Dashboard Brochure PDF
This slide covers the dashboard for analyzing the sales plan implemented in an organization. The purpose of this template is to assess strategical and operational aspects of the company. It includes key performance indicators such as number of sales, revenue, profit, cost, etc. Showcasing this set of slides titled Sales Work Action Plan Analysis Dashboard Brochure PDF. The topics addressed in these templates are Sales Revenue, Cost Breakdown, Accumulated Revenue. All the content presented in this PPT design is completely editable. Download it and make adjustments in color, background, font etc. as per your unique business setting.
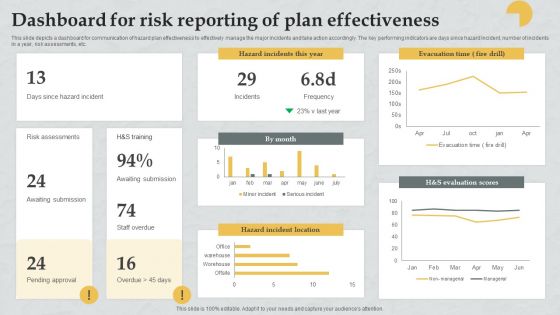
Dashboard For Risk Reporting Of Plan Effectiveness Download PDF
This slide depicts a dashboard for communication of hazard plan effectiveness to effectively manage the major incidents and take action accordingly. The key performing indicators are days since hazard incident, number of incidents in a year, risk assessments, etc. Showcasing this set of slides titled Dashboard For Risk Reporting Of Plan Effectiveness Download PDF. The topics addressed in these templates are Risk Assessments, Awaiting Submission, Awaiting Submission. All the content presented in this PPT design is completely editable. Download it and make adjustments in color, background, font etc. as per your unique business setting.
Shipping Delivery Tracking Metrics Analysis Dashboard Structure PDF
This template illustrates the KPI dashboard for tracking shipment orders. It also includes shipment analysis based on different KPIs such as ongoing delivery, completed delivery, on-time delivery, actual delivery duration, and variance between expected and actual delivery time. Pitch your topic with ease and precision using this Shipping Delivery Tracking Metrics Analysis Dashboard Structure PDF. This layout presents information on Recipient Country, Completed Deliveries, Delivery Duration. It is also available for immediate download and adjustment. So, changes can be made in the color, design, graphics or any other component to create a unique layout.
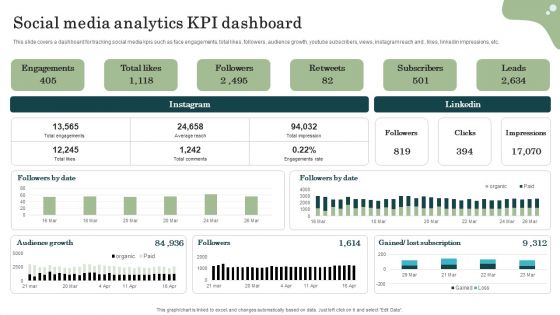
Marketing Success Metrics Social Media Analytics KPI Dashboard Elements PDF
This slide covers a dashboard for tracking social media kpis such as face engagements, total likes, followers, audience growth, youtube subscribers, views, instagram reach and , likes, linkedin impressions, etc. Find a pre-designed and impeccable Marketing Success Metrics Social Media Analytics KPI Dashboard Elements PDF. The templates can ace your presentation without additional effort. You can download these easy-to-edit presentation templates to make your presentation stand out from others. So, what are you waiting for Download the template from Slidegeeks today and give a unique touch to your presentation.
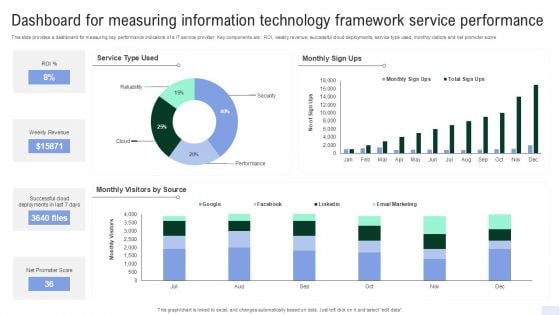
Dashboard For Measuring Information Technology Framework Service Performance Ideas PDF
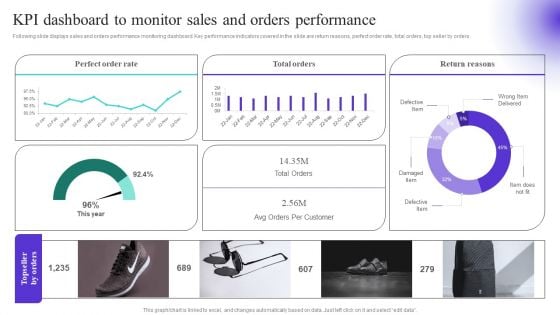
KPI Dashboard To Monitor Sales And Orders Performance Diagrams PDF
Following slide displays sales and orders performance monitoring dashboard. Key performance indicators covered in the slide are return reasons, perfect order rate, total orders, top seller by orders. Create an editable KPI Dashboard To Monitor Sales And Orders Performance Diagrams PDF that communicates your idea and engages your audience. Whether you are presenting a business or an educational presentation, pre designed presentation templates help save time. KPI Dashboard To Monitor Sales And Orders Performance Diagrams PDF is highly customizable and very easy to edit, covering many different styles from creative to business presentations. Slidegeeks has creative team members who have crafted amazing templates. So, go and get them without any delay.
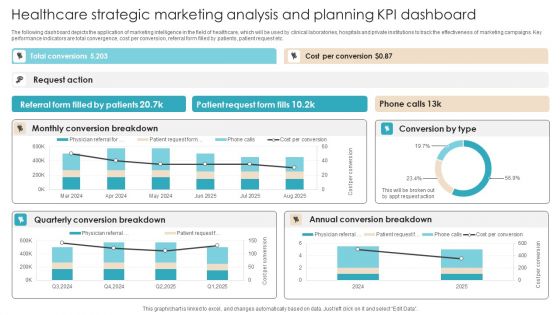
Healthcare Strategic Marketing Analysis And Planning Kpi Dashboard Elements PDF
The following dashboard depicts the application of marketing intelligence in the field of healthcare, which will be used by clinical laboratories, hospitals and private institutions to track the effectiveness of marketing campaigns. Key performance indicators are total convergence, cost per conversion, referral form filled by patients, patient request etc. Showcasing this set of slides titled Healthcare Strategic Marketing Analysis And Planning Kpi Dashboard Elements PDF. The topics addressed in these templates are Quarterly Conversion Breakdown, Annual Conversion Breakdown, Patient Request. All the content presented in this PPT design is completely editable. Download it and make adjustments in color, background, font etc. as per your unique business setting.
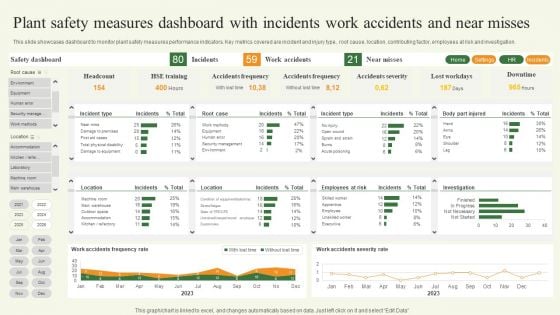
Plant Safety Measures Dashboard With Incidents Work Accidents And Near Misses Template PDF
This slide showcases dashboard to monitor plant safety measures performance indicators. Key metrics covered are incident and injury type, root cause, location, contributing factor, employees at risk and investigation. Pitch your topic with ease and precision using this Plant Safety Measures Dashboard With Incidents Work Accidents And Near Misses Template PDF. This layout presents information on Plant Safety Measures Dashboard, Incidents Work Accidents. It is also available for immediate download and adjustment. So, changes can be made in the color, design, graphics or any other component to create a unique layout.
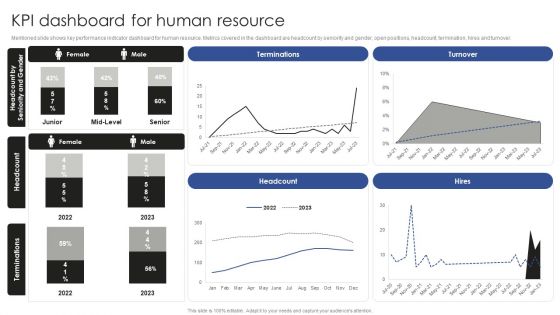
Talent Administration And Succession KPI Dashboard For Human Resource Rules PDF
Mentioned slide shows key performance indicator dashboard for human resource. Metrics covered in the dashboard are headcount by seniority and gender, open positions, headcount, termination, hires and turnover. If your project calls for a presentation, then Slidegeeks is your go-to partner because we have professionally designed, easy-to-edit templates that are perfect for any presentation. After downloading, you can easily edit Talent Administration And Succession KPI Dashboard For Human Resource Rules PDF and make the changes accordingly. You can rearrange slides or fill them with different images. Check out all the handy templates
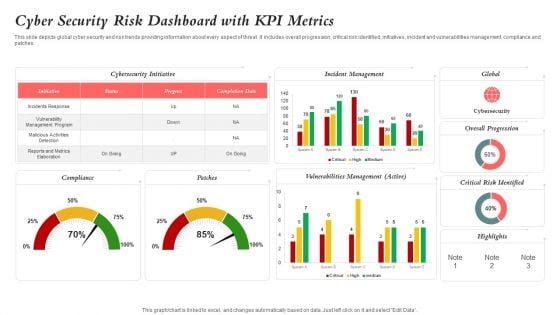
Cyber Security Risk Dashboard With KPI Metrics Elements PDF
This slide depicts global cyber security and risk trends providing information about every aspect of threat. It includes overall progression, critical risk identified, initiatives, incident and vulnerabilities management, compliance and patches. Showcasing this set of slides titled Cyber Security Risk Dashboard With KPI Metrics Elements PDF. The topics addressed in these templates are Vulnerability Management Program, Reports And Metrics Elaboration, Critical Risk Identified. All the content presented in this PPT design is completely editable. Download it and make adjustments in color, background, font etc. as per your unique business setting.
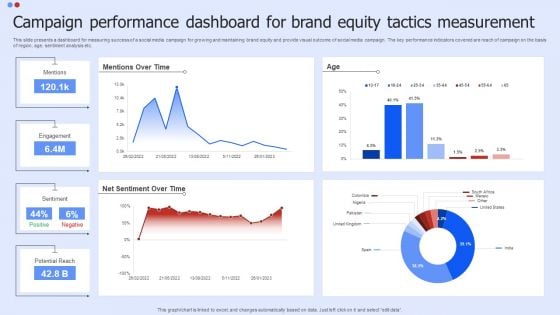
Campaign Performance Dashboard For Brand Equity Tactics Measurement Slides PDF
This slide presents a dashboard for measuring success of a social media campaign for growing and maintaining brand equity and provide visual outcome of social media campaign. The key performance indicators covered are reach of campaign on the basis of region, age, sentiment analysis etc. Showcasing this set of slides titled Campaign Performance Dashboard For Brand Equity Tactics Measurement Slides PDF. The topics addressed in these templates are Campaign Performance Dashboard For Brand Equity Tactics Measurement Slides PDF. All the content presented in this PPT design is completely editable. Download it and make adjustments in color, background, font etc. as per your unique business setting.

Impact Of Incentive Program On Team Performance Tactics For Improving Field Sales Team SA SS V
This slide showcases the impact of the sales team incentive programs on sales representatives such as sales team quota attainment, higher customer renewal rate and higher win rate.This modern and well-arranged Impact Of Incentive Program On Team Performance Tactics For Improving Field Sales Team SA SS V provides lots of creative possibilities. It is very simple to customize and edit with the Powerpoint Software. Just drag and drop your pictures into the shapes. All facets of this template can be edited with Powerpoint, no extra software is necessary. Add your own material, put your images in the places assigned for them, adjust the colors, and then you can show your slides to the world, with an animated slide included. This slide showcases the impact of the sales team incentive programs on sales representatives such as sales team quota attainment, higher customer renewal rate and higher win rate.
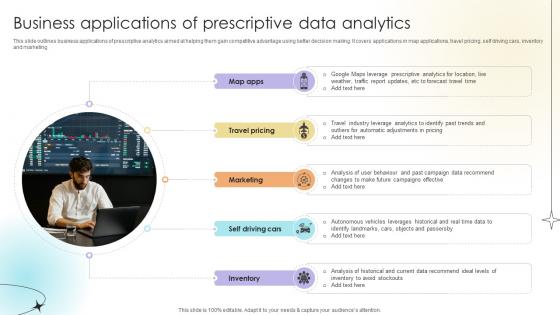
Business Applications Of Prescriptive Data Analytics Data Analytics SS V
This slide outlines business applications of prescriptive analytics aimed at helping them gain competitive advantage using better decision making. It covers applications in map applications, travel pricing, self driving cars, inventory and marketing.The best PPT templates are a great way to save time, energy, and resources. Slidegeeks have 100 percent editable powerpoint slides making them incredibly versatile. With these quality presentation templates, you can create a captivating and memorable presentation by combining visually appealing slides and effectively communicating your message. Download Business Applications Of Prescriptive Data Analytics Data Analytics SS V from Slidegeeks and deliver a wonderful presentation. This slide outlines business applications of prescriptive analytics aimed at helping them gain competitive advantage using better decision making. It covers applications in map applications, travel pricing, self driving cars, inventory and marketing.
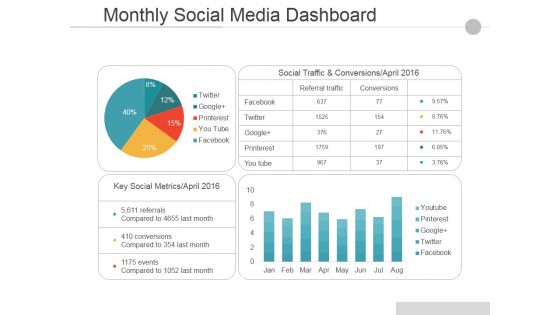
Monthly Social Media Dashboard Ppt PowerPoint Presentation Pictures Guide
This is a monthly social media dashboard ppt powerpoint presentation pictures guide. This is a two stage process. The stages in this process are social traffic and conversions april, key social metrics april, facebook, twitter, google.
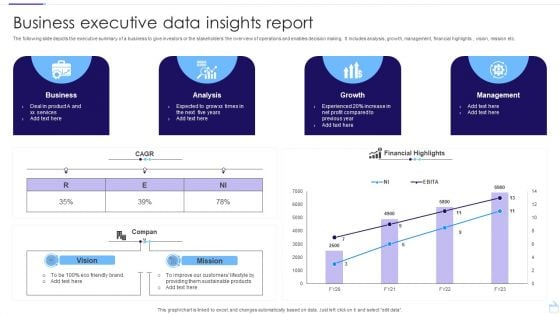
Business Executive Data Insights Report Pictures PDF
The following slide depicts the executive summary of a business to give investors or the stakeholders the overview of operations and enables decision making. It includes analysis, growth, management, financial highlights , vision, mission etc. Pitch your topic with ease and precision using this Business Executive Data Insights Report Pictures PDF. This layout presents information on Business, Analysis, Growth. It is also available for immediate download and adjustment. So, changes can be made in the color, design, graphics or any other component to create a unique layout.
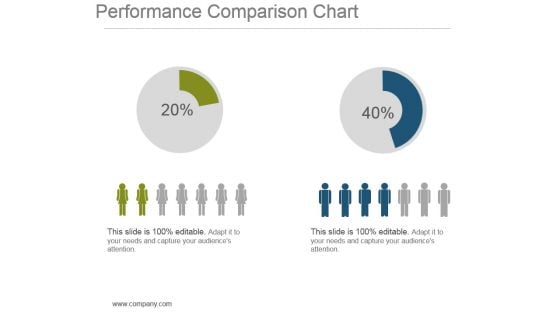
Performance Comparison Chart Powerpoint Show
This is a performance comparison chart powerpoint show. This is a two stage process. The stages in this process are finance, compare, strategy, management, planning.
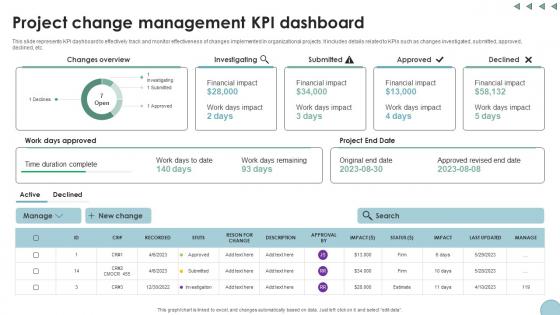
Project Change Management KPI Dashboard Digital Transformation In Project Management
This slide represents KPI dashboard to effectively track and monitor effectiveness of changes implemented in organizational projects. It includes details related to KPIs such as changes investigated, submitted, approved, declined, etc. Slidegeeks has constructed Project Change Management KPI Dashboard Digital Transformation In Project Management after conducting extensive research and examination. These presentation templates are constantly being generated and modified based on user preferences and critiques from editors. Here, you will find the most attractive templates for a range of purposes while taking into account ratings and remarks from users regarding the content. This is an excellent jumping-off point to explore our content and will give new users an insight into our top-notch PowerPoint Templates. This slide represents KPI dashboard to effectively track and monitor effectiveness of changes implemented in organizational projects. It includes details related to KPIs such as changes investigated, submitted, approved, declined, etc.
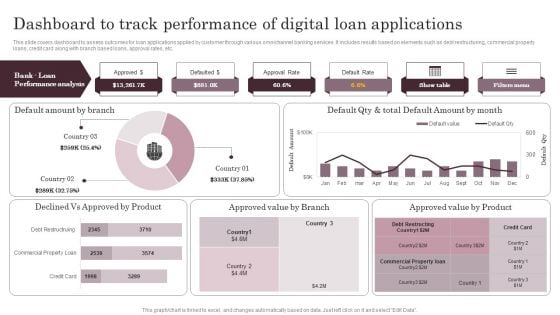
Dashboard To Track Performance Of Digital Loan Applications Pictures PDF
This slide covers dashboard to assess outcomes for loan applications applied by customer through various omnichannel banking services. It includes results based on elements such as debt restructuring, commercial property loans, credit card along with branch based loans, approval rates, etc. Find a pre designed and impeccable Dashboard To Track Performance Of Digital Loan Applications Pictures PDF. The templates can ace your presentation without additional effort. You can download these easy to edit presentation templates to make your presentation stand out from others. So, what are you waiting for Download the template from Slidegeeks today and give a unique touch to your presentation.
Work Plan With Timetable Template 1 Ppt PowerPoint Presentation Icon Show
This is a work plan with timetable template 1 ppt powerpoint presentation icon show. This is a two stage process. The stages in this process are acceptance of the research proposal, talks with local representatives in study area, development of research tools, sample selection and talks with community, training of enumerators.
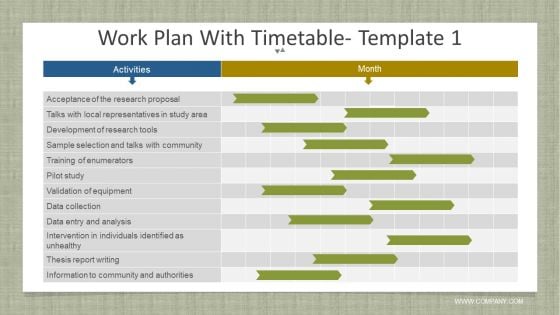
Work Plan With Timetable Template 1 Ppt PowerPoint Presentation Infographics Graphics
This is a work plan with timetable template 1 ppt powerpoint presentation infographics graphics. This is a twelve stage process. The stages in this process are acceptance of the research proposal, talks with local representatives in study area, development of research tools, sample selection and talks with community, training of enumerators.
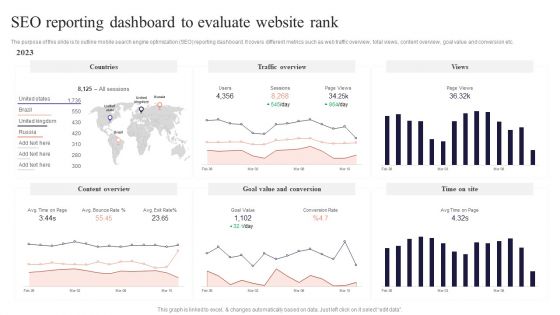
SEO Reporting Dashboard To Evaluate Website Rank Performing Mobile SEO Audit To Analyze Web Traffic Inspiration PDF
The purpose of this slide is to outline mobile search engine optimization SEO reporting dashboard. It covers different metrics such as web traffic overview, total views, content overview, goal value and conversion etc. The SEO Reporting Dashboard To Evaluate Website Rank Performing Mobile SEO Audit To Analyze Web Traffic Inspiration PDF is a compilation of the most recent design trends as a series of slides. It is suitable for any subject or industry presentation, containing attractive visuals and photo spots for businesses to clearly express their messages. This template contains a variety of slides for the user to input data, such as structures to contrast two elements, bullet points, and slides for written information. Slidegeeks is prepared to create an impression.
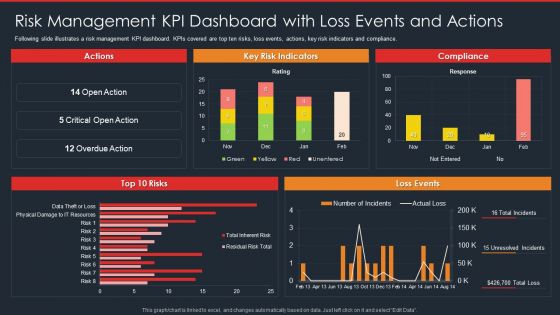
Data Safety Initiatives Risk Management KPI Dashboard With Loss Events And Actions Rules PDF
Following slide illustrates a risk management KPI dashboard. KPIs covered are top ten risks, loss events, actions, key risk indicators and compliance. Deliver an awe inspiring pitch with this creativedata safety initiatives overview of new it policy framework pictures pdf bundle. Topics like actions, key risk indicators, compliance, top 10 risks, loss events can be discussed with this completely editable template. It is available for immediate download depending on the needs and requirements of the user.
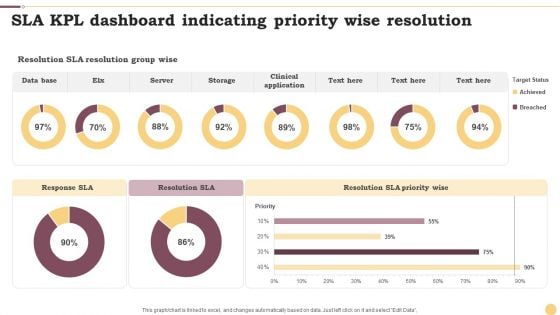
SLA KPL Dashboard Indicating Priority Wise Resolution Ppt Infographics Example File PDF
This graph or chart is linked to excel, and changes automatically based on data. Just left click on it and select Edit Data. Pitch your topic with ease and precision using this SLA KPL Dashboard Indicating Priority Wise Resolution Ppt Infographics Example File PDF. This layout presents information on Data Base, Server, Storage. It is also available for immediate download and adjustment. So, changes can be made in the color, design, graphics or any other component to create a unique layout.
Team Work Analysis Dashboard Ppt Icon
This is a team work analysis dashboard ppt icon. This is a four stage process. The stages in this process are reward, completion, overdue plans, problems.
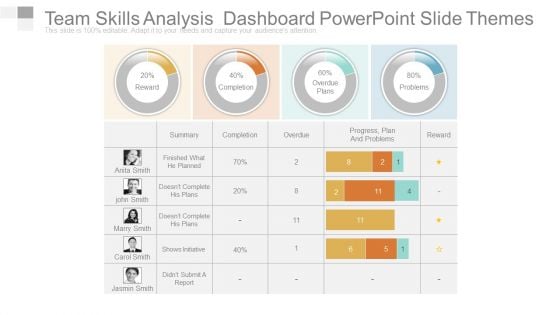
Team Skills Analysis Dashboard Powerpoint Slide Themes
This is a team skills analysis dashboard powerpoint slide themes. This is a four stage process. The stages in this process are reward, completion, overdue, overdue plans, problems.
Dashboard Tracking Warehouse Capacity And Utilization Metrics Icons PDF
This slide represents a dashboard providing an enterprise-level view of warehouse capacity and utilization to enable process improvements. It monitors KPIs such as shelf capacity used by inventory type, storage device, honeycomb percentage, days on hand by inventory type, and by items. Create an editable Dashboard Tracking Warehouse Capacity And Utilization Metrics Icons PDF that communicates your idea and engages your audience. Whether you are presenting a business or an educational presentation, pre-designed presentation templates help save time. Dashboard Tracking Warehouse Capacity And Utilization Metrics Icons PDF is highly customizable and very easy to edit, covering many different styles from creative to business presentations. Slidegeeks has creative team members who have crafted amazing templates. So, go and get them without any delay.


 Continue with Email

 Home
Home


