Daily Snapshot
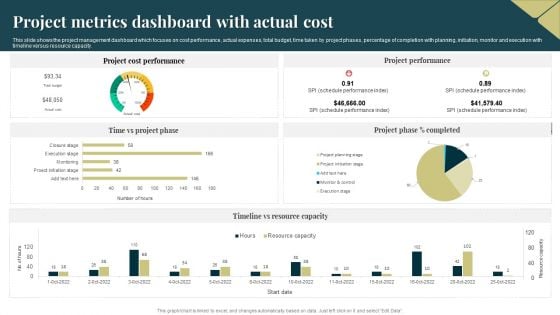
Project Metrics Dashboard With Actual Cost Background PDF
This slide shows the project management dashboard which focuses on cost performance, actual expenses, total budget, time taken by project phases, percentage of completion with planning, initiation, monitor and execution with timeline versus resource capacity. Showcasing this set of slides titled Project Metrics Dashboard With Actual Cost Background PDF. The topics addressed in these templates are Project Cost Performance, Project Performance, Resource Capacity. All the content presented in this PPT design is completely editable. Download it and make adjustments in color, background, font etc. as per your unique business setting.
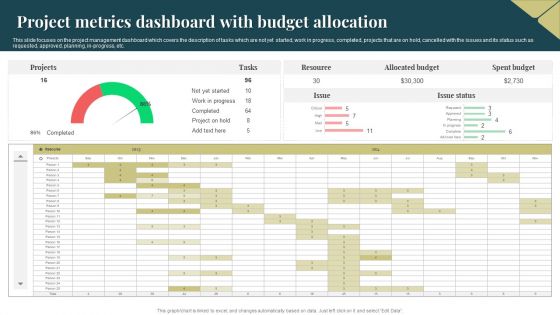
Project Metrics Dashboard With Budget Allocation Portrait PDF
This slide focuses on the project management dashboard which covers the description of tasks which are not yet started, work in progress, completed, projects that are on hold, cancelled with the issues and its status such as requested, approved, planning, in progress, etc. Showcasing this set of slides titled Project Metrics Dashboard With Budget Allocation Portrait PDF. The topics addressed in these templates are Projects, Resource, Allocated Budget. All the content presented in this PPT design is completely editable. Download it and make adjustments in color, background, font etc. as per your unique business setting.
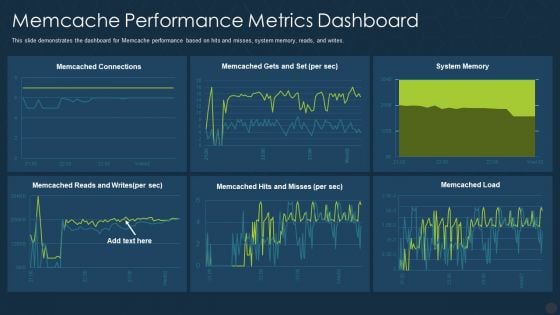
Memcache Performance Metrics Dashboard Ppt Portfolio Aids PDF
This slide demonstrates the dashboard for Memcache performance based on hits and misses, system memory, reads, and writes. Deliver an awe inspiring pitch with this creative memcache performance metrics dashboard ppt portfolio aids pdf bundle. Topics like memcache performance metrics dashboard can be discussed with this completely editable template. It is available for immediate download depending on the needs and requirements of the user.
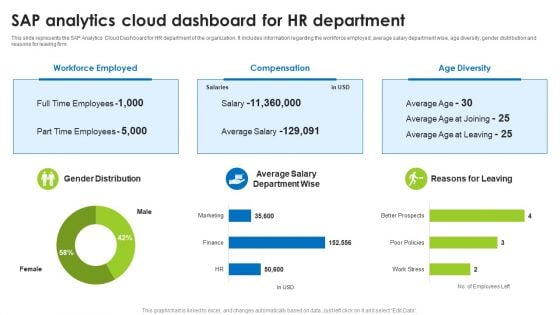
BI Technique For Data Informed Decisions Sap Analytics Cloud Dashboard For HR Department Background PDF
This slide represents the SAP Analytics Cloud Dashboard for HR department of the organization. It includes information regarding the workforce employed, average salary department wise, age diversity, gender distribution and reasons for leaving firm. This modern and well-arranged BI Technique For Data Informed Decisions Sap Analytics Cloud Dashboard For HR Department Background PDF provides lots of creative possibilities. It is very simple to customize and edit with the Powerpoint Software. Just drag and drop your pictures into the shapes. All facets of this template can be edited with Powerpoint no extra software is necessary. Add your own material, put your images in the places assigned for them, adjust the colors, and then you can show your slides to the world, with an animated slide included.
4 Steps Agenda To Achieve Company Goals Ppt PowerPoint Presentation Inspiration
This is a 4 steps agenda to achieve company goals ppt powerpoint presentation inspiration. This is a four stage process. The stages in this process are business, agenda, strategy, analysis, success.
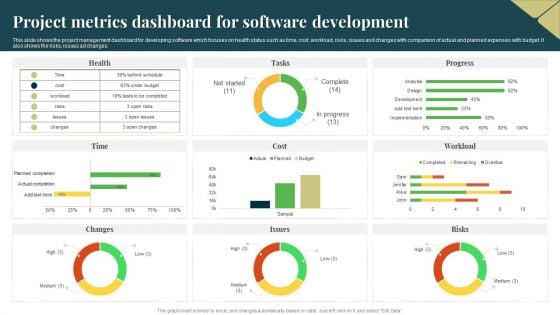
Project Metrics Dashboard For Software Development Designs PDF
This slide shows the project management dashboard for developing software which focuses on health status such as time, cost, workload, risks, issues and changes with comparison of actual and planned expenses with budget. It also shows the risks, issues ad changes. Pitch your topic with ease and precision using this Project Metrics Dashboard For Software Development Designs PDF. This layout presents information on Risks, Budget, Cost. It is also available for immediate download and adjustment. So, changes can be made in the color, design, graphics or any other component to create a unique layout.

Project Metrics Dashboard With Average Margin Sample PDF
This slide focuses on project management dashboard which covers number of active projects, average margin, revenues, costs, tasks status, resources with planned and actual efforts, available hours, tasks assignments with project deadlines, client, etc. Pitch your topic with ease and precision using this Project Metrics Dashboard With Average Margin Sample PDF. This layout presents information on Average Margin, Revenue, Cost. It is also available for immediate download and adjustment. So, changes can be made in the color, design, graphics or any other component to create a unique layout.
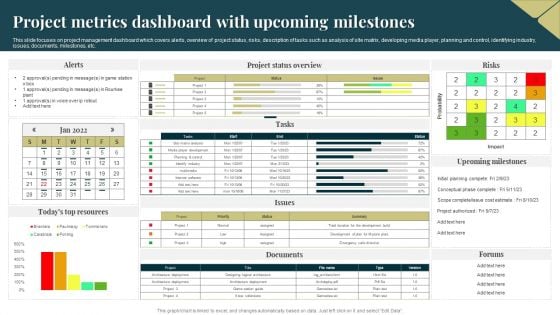
Project Metrics Dashboard With Upcoming Milestones Demonstration PDF
This slide focuses on project management dashboard which covers alerts, overview of project status, risks, description of tasks such as analysis of site matrix, developing media player, planning and control, identifying industry, issues, documents, milestones, etc. Pitch your topic with ease and precision using this Project Metrics Dashboard With Upcoming Milestones Demonstration PDF. This layout presents information on Probability, Project, Risks. It is also available for immediate download and adjustment. So, changes can be made in the color, design, graphics or any other component to create a unique layout.
Cyber Security Team Analytics Dashboard With KPI Metrics Icons PDF
The following slide shows cyber analytics dashboard to monitor and inspect threats and accordingly plan preventive actions. It includes open and resolved incidents and tickets. Pitch your topic with ease and precision using this Cyber Security Team Analytics Dashboard With KPI Metrics Icons PDF. This layout presents information on Energy Security Team, Digital Security Center, Security Operations Center. It is also available for immediate download and adjustment. So, changes can be made in the color, design, graphics or any other component to create a unique layout.

Segmentation Of Global Prescriptive Analytics Market Data Analytics SS V
This slide provides an overview of market segmentation of prescriptive analytics at a global level. It covers segmentation analysis based on region, data type, component and deployment with key takeaways.Take your projects to the next level with our ultimate collection of Segmentation Of Global Prescriptive Analytics Market Data Analytics SS V. Slidegeeks has designed a range of layouts that are perfect for representing task or activity duration, keeping track of all your deadlines at a glance. Tailor these designs to your exact needs and give them a truly corporate look with your own brand colors they will make your projects stand out from the rest This slide provides an overview of market segmentation of prescriptive analytics at a global level. It covers segmentation analysis based on region, data type, component and deployment with key takeaways.
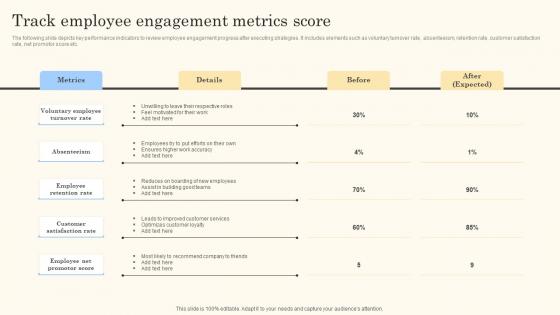
Track Employee Engagement Metrics Score Action Steps For Employee Engagement Slides Pdf
The following slide depicts key performance indicators to review employee engagement progress after executing strategies. It includes elements such as voluntary turnover rate, absenteeism, retention rate, customer satisfaction rate, net promotor score etc.Make sure to capture your audiences attention in your business displays with our gratis customizable Track Employee Engagement Metrics Score Action Steps For Employee Engagement Slides Pdf. These are great for business strategies, office conferences, capital raising or task suggestions. If you desire to acquire more customers for your tech business and ensure they stay satisfied, create your own sales presentation with these plain slides. The following slide depicts key performance indicators to review employee engagement progress after executing strategies. It includes elements such as voluntary turnover rate, absenteeism, retention rate, customer satisfaction rate, net promotor score etc.
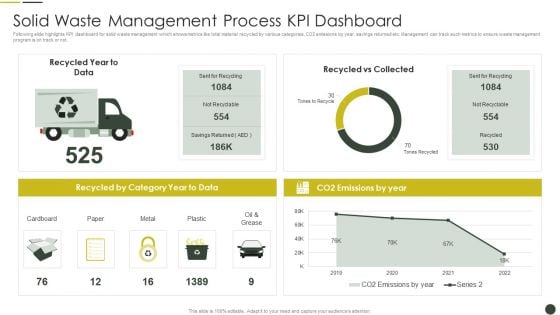
Solid Waste Management Process KPI Dashboard Pictures PDF
Following slide highlights KPI dashboard for solid waste management which shows metrics like total material recycled by various categories, CO2 emissions by year, savings returned etc. Management can track such metrics to ensure waste management program is on track or not.Showcasing this set of slides titled Solid Waste Management Process KPI Dashboard Pictures PDF The topics addressed in these templates are Recycled Category, Sent Recycling, Tones Recycle All the content presented in this PPT design is completely editable. Download it and make adjustments in color, background, font etc. as per your unique business setting.
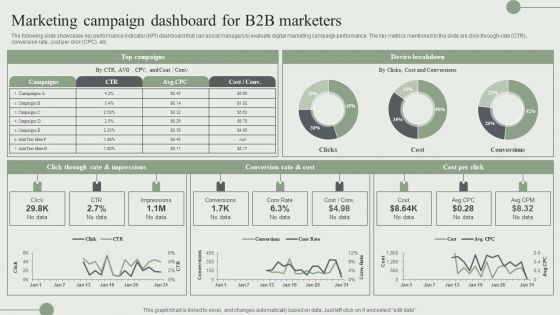
Marketing Campaign Dashboard For B2B Marketers Ppt PowerPoint Presentation File Diagrams PDF
The following slide showcases key performance indicator KPI dashboard that can assist managers to evaluate digital marketing campaign performance. The key metrics mentioned in the slide are click-through-rate CTR, conversion rate, cost per click CPC, etc. Present like a pro with Marketing Campaign Dashboard For B2B Marketers Ppt PowerPoint Presentation File Diagrams PDF Create beautiful presentations together with your team, using our easy to use presentation slides. Share your ideas in real time and make changes on the fly by downloading our templates. So whether you are in the office, on the go, or in a remote location, you can stay in sync with your team and present your ideas with confidence. With Slidegeeks presentation got a whole lot easier. Grab these presentations today.
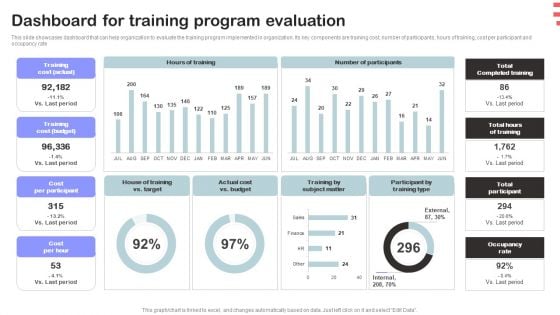
Corporate Training Program Dashboard For Training Program Evaluation Summary PDF
This slide showcases dashboard that can help organization to evaluate the training program implemented in organization. Its key components are training cost, number of participants, hours of training, cost per participant and occupancy rate Are you in need of a template that can accommodate all of your creative concepts This one is crafted professionally and can be altered to fit any style. Use it with Google Slides or PowerPoint. Include striking photographs, symbols, depictions, and other visuals. Fill, move around, or remove text boxes as desired. Test out color palettes and font mixtures. Edit and save your work, or work with colleagues. Download Corporate Training Program Dashboard For Training Program Evaluation Summary PDF and observe how to make your presentation outstanding. Give an impeccable presentation to your group and make your presentation unforgettable.
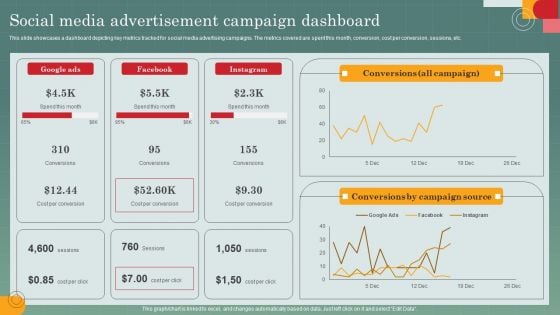
Advertising Programs Management Techniques Social Media Advertisement Campaign Dashboard Diagrams PDF
This slide showcases a dashboard depicting key metrics tracked for social media advertising campaigns. The metrics covered are spent this month, conversion, cost per conversion, sessions, etc. This modern and well arranged Advertising Programs Management Techniques Social Media Advertisement Campaign Dashboard Diagrams PDF provides lots of creative possibilities. It is very simple to customize and edit with the Powerpoint Software. Just drag and drop your pictures into the shapes. All facets of this template can be edited with Powerpoint no extra software is necessary. Add your own material, put your images in the places assigned for them, adjust the colors, and then you can show your slides to the world, with an animated slide included.
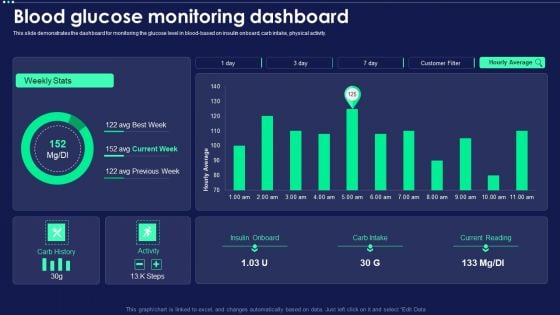
Micro Chip Blood Glucose Monitoring Dashboard Pictures PDF
This slide demonstrates the dashboard for monitoring the glucose level in blood-based on insulin onboard, carb intake, physical activity. Deliver an awe inspiring pitch with this creative Micro Chip Blood Glucose Monitoring Dashboard Pictures PDF bundle. Topics like Insulin Onboard, Carb Intake, Current Reading, Carb History can be discussed with this completely editable template. It is available for immediate download depending on the needs and requirements of the user.
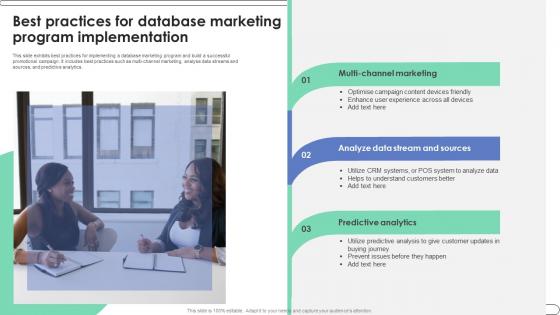
Best Practices For Database Marketing Program Implementation Ppt Gallery Maker Pdf
This slide exhibits best practices for implementing a database marketing program and build a successful promotional campaign. It includes best practices such as multi-channel marketing, analyse data streams and sources, and predictive analytics. Showcasing this set of slides titled Best Practices For Database Marketing Program Implementation Ppt Gallery Maker Pdf. The topics addressed in these templates are Multi Channel Marketing, Analyze Data, Stream And Sources, Predictive Analytics. All the content presented in this PPT design is completely editable. Download it and make adjustments in color, background, font etc. as per your unique business setting. This slide exhibits best practices for implementing a database marketing program and build a successful promotional campaign. It includes best practices such as multi-channel marketing, analyse data streams and sources, and predictive analytics.
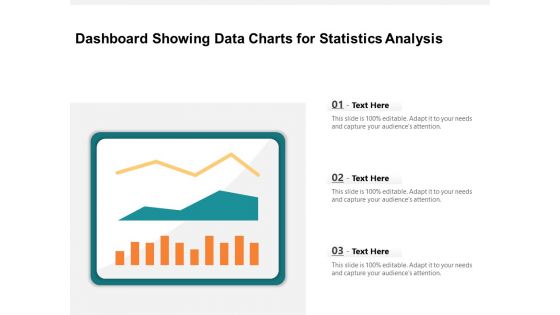
Dashboard Showing Data Charts For Statistics Analysis Ppt PowerPoint Presentation Infographic Template Grid PDF
Pitch your topic with ease and precision using this dashboard showing data charts for statistics analysis ppt powerpoint presentation infographic template grid pdf. This layout presents information on dashboard showing data charts for statistics analysis. It is also available for immediate download and adjustment. So, changes can be made in the color, design, graphics or any other component to create a unique layout.
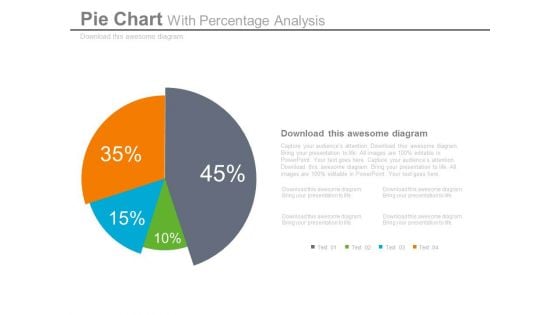
Pie Chart Dashboard Style For Percentage Analysis Powerpoint Slides
This dashboard PPT template contains graphics of pie chart. This dashboard PowerPoint template helps to display percentage analysis in a visual manner. Download this PPT slide for quick decision-making.
Business Event Schedule Planning With Calendar Sign Ppt PowerPoint Presentation Summary Picture PDF
Presenting business event schedule planning with calendar sign ppt powerpoint presentation summary picture pdf to dispense important information. This template comprises two stages. It also presents valuable insights into the topics including business event schedule planning with calendar sign. This is a completely customizable PowerPoint theme that can be put to use immediately. So, download it and address the topic impactfully.
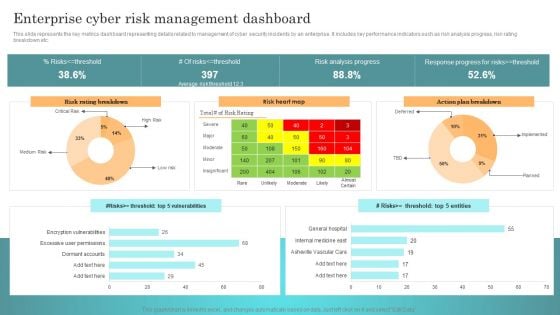
Incident Response Techniques Deployement Enterprise Cyber Risk Management Dashboard Rules PDF
This slide represents the key metrics dashboard representing details related to management of cyber security incidents by an enterprise. It includes key performance indicators such as risk analysis progress, risk rating breakdown etc. Find highly impressive Incident Response Techniques Deployement Enterprise Cyber Risk Management Dashboard Rules PDF on Slidegeeks to deliver a meaningful presentation. You can save an ample amount of time using these presentation templates. No need to worry to prepare everything from scratch because Slidegeeks experts have already done a huge research and work for you. You need to download Incident Response Techniques Deployement Enterprise Cyber Risk Management Dashboard Rules PDF for your upcoming presentation. All the presentation templates are 100 percent editable and you can change the color and personalize the content accordingly. Download now.
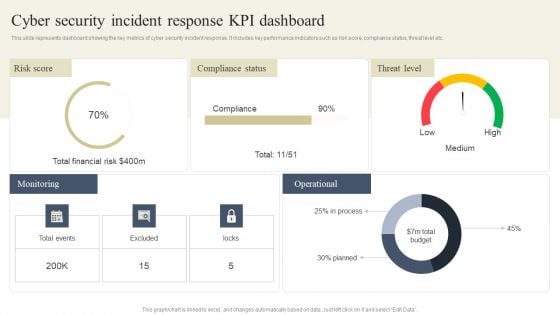
CYBER Security Breache Response Strategy Cyber Security Incident Response Kpi Dashboard Rules PDF
This slide represents dashboard showing the key metrics of cyber security incident response. It includes key performance indicators such as risk score, compliance status, threat level etc. Crafting an eye catching presentation has never been more straightforward. Let your presentation shine with this tasteful yet straightforward CYBER Security Breache Response Strategy Cyber Security Incident Response Kpi Dashboard Rules PDF template. It offers a minimalistic and classy look that is great for making a statement. The colors have been employed intelligently to add a bit of playfulness while still remaining professional. Construct the ideal CYBER Security Breache Response Strategy Cyber Security Incident Response Kpi Dashboard Rules PDF that effortlessly grabs the attention of your audience. Begin now and be certain to wow your customers.
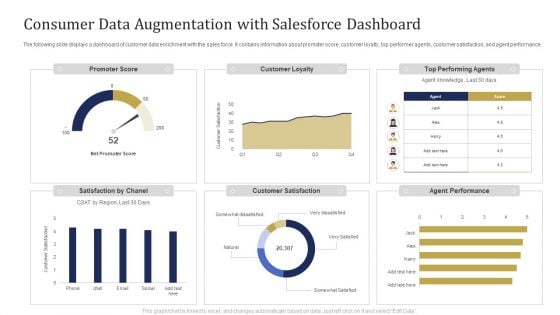
Consumer Data Augmentation With Salesforce Dashboard Ppt Pictures Portrait PDF
The following slide displays a dashboard of customer data enrichment with the sales force. It contains information about promoter score, customer loyalty, top performer agents, customer satisfaction, and agent performance. Showcasing this set of slides titled Consumer Data Augmentation With Salesforce Dashboard Ppt Pictures Portrait PDF. The topics addressed in these templates are Promoter Score, Customer Loyalty, Top Performing Agents. All the content presented in this PPT design is completely editable. Download it and make adjustments in color, background, font etc. as per your unique business setting.
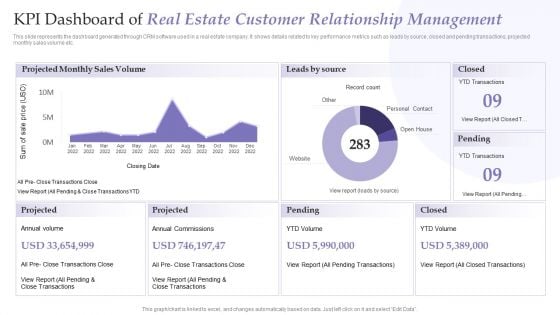
KPI Dashboard Of Real Estate Customer Relationship Management Pictures PDF
This slide represents the dashboard generated through CRM software used in a real estate company. It shows details related to key performance metrics such as leads by source, closed and pending transactions, projected monthly sales volume etc. Showcasing this set of slides titled KPI Dashboard Of Real Estate Customer Relationship Management Pictures PDF. The topics addressed in these templates are Projected Monthly Sales Volume, Leads By Source, Annual Commissions. All the content presented in this PPT design is completely editable. Download it and make adjustments in color, background, font etc. as per your unique business setting.
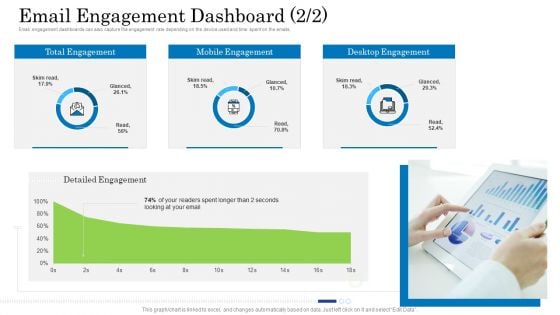
Customer Behavioral Data And Analytics Email Engagement Dashboard Email Structure PDF
Email engagement dashboards can also capture the engagement rate depending on the device used and time spent on the emails. Deliver and pitch your topic in the best possible manner with this customer behavioral data and analytics email engagement dashboard email structure pdf. Use them to share invaluable insights on email engagement dashboard and impress your audience. This template can be altered and modified as per your expectations. So, grab it now.
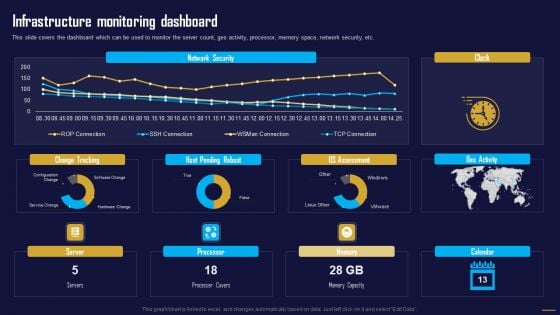
Infrastructure Monitoring Dashboard Information Tech System Maintenance Pictures PDF
This slide covers the dashboard which can be used to monitor the server count, geo activity, processor, memory space, network security, etc.Crafting an eye-catching presentation has never been more straightforward. Let your presentation shine with this tasteful yet straightforward Infrastructure Monitoring Dashboard Information Tech System Maintenance Pictures PDF template. It offers a minimalistic and classy look that is great for making a statement. The colors have been employed intelligently to add a bit of playfulness while still remaining professional. Construct the ideal Infrastructure Monitoring Dashboard Information Tech System Maintenance Pictures PDF that effortlessly grabs the attention of your audience Begin now and be certain to wow your customers.
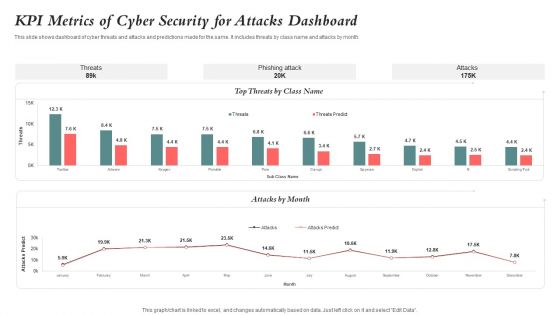
KPI Metrics Of Cyber Security For Attacks Dashboard Guidelines PDF
This slide shows dashboard of cyber threats and attacks and predictions made for the same. It includes threats by class name and attacks by month. Showcasing this set of slides titled KPI Metrics Of Cyber Security For Attacks Dashboard Guidelines PDF. The topics addressed in these templates are Kpi Metrics, Cyber Security, Attacks Dashboard. All the content presented in this PPT design is completely editable. Download it and make adjustments in color, background, font etc. as per your unique business setting.
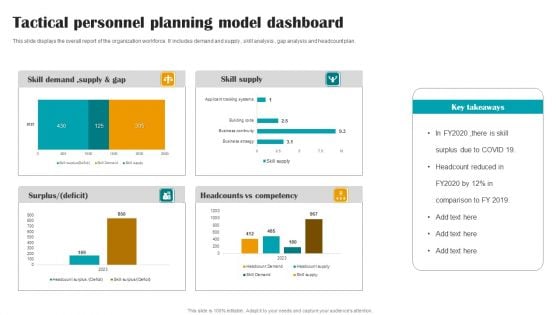
Tactical Personnel Planning Model Dashboard Pictures PDF
This slide displays the overall report of the organization workforce. It includes demand and supply , skill analysis , gap analysis and headcount plan. Showcasing this set of slides titled Tactical Personnel Planning Model Dashboard Pictures PDF. The topics addressed in these templates are Tactical Personnel Planning, Model Dashboard. All the content presented in this PPT design is completely editable. Download it and make adjustments in color, background, font etc. as per your unique business setting.
Content Marketing Dashboard For Effective Tracking Structure PDF
Purpose of the following slide is to show key metrics that can help the organization to track their content marketing efforts, these metrics are ad cost, visits, cost per click etc. Deliver an awe inspiring pitch with this creative Content Marketing Dashboard For Effective Tracking Structure PDF bundle. Topics like Metrics, Content Marketing Dashboard can be discussed with this completely editable template. It is available for immediate download depending on the needs and requirements of the user.
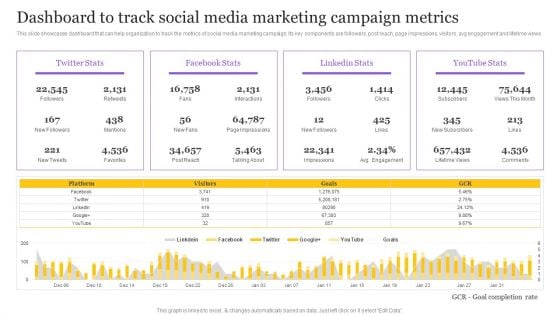
Digital Marketing Strategy Dashboard To Track Social Media Marketing Campaign Metrics Diagrams PDF
This slide showcases dashboard that can help organization to track the metrics of social media marketing campaign. Its key components are followers, post reach, page impressions, visitors, avg engagement and lifetime views. Retrieve professionally designed Digital Marketing Strategy Dashboard To Track Social Media Marketing Campaign Metrics Diagrams PDF to effectively convey your message and captivate your listeners. Save time by selecting pre-made slideshows that are appropriate for various topics, from business to educational purposes. These themes come in many different styles, from creative to corporate, and all of them are easily adjustable and can be edited quickly. Access them as PowerPoint templates or as Google Slides themes. You dont have to go on a hunt for the perfect presentation because Slidegeeks got you covered from everywhere.
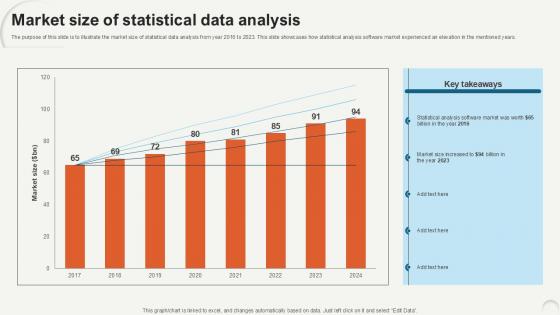
Market Size Of Statistical Data Analytics For Informed Decision Ppt Template
The purpose of this slide is to illustrate the market size of statistical data analysis from year 2016 to 2023. This slide showcases how statistical analysis software market experienced an elevation in the mentioned years. Explore a selection of the finest Market Size Of Statistical Data Analytics For Informed Decision Ppt Template here. With a plethora of professionally designed and pre-made slide templates, you can quickly and easily find the right one for your upcoming presentation. You can use our Market Size Of Statistical Data Analytics For Informed Decision Ppt Template to effectively convey your message to a wider audience. Slidegeeks has done a lot of research before preparing these presentation templates. The content can be personalized and the slides are highly editable. Grab templates today from Slidegeeks. The purpose of this slide is to illustrate the market size of statistical data analysis from year 2016 to 2023. This slide showcases how statistical analysis software market experienced an elevation in the mentioned years.
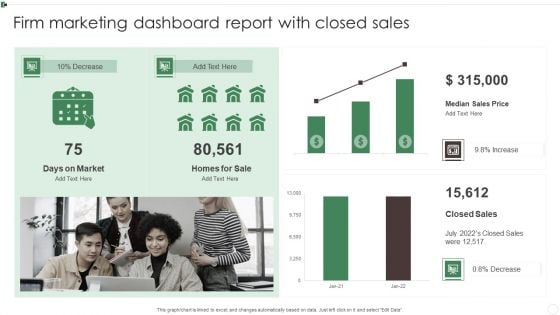
Firm Marketing Dashboard Report With Closed Sales Ppt Slides Graphics Example PDF
This graph or chart is linked to excel, and changes automatically based on data. Just left click on it and select Edit Data. Showcasing this set of slides titled Firm Marketing Dashboard Report With Closed Sales Ppt Slides Graphics Example PDF. The topics addressed in these templates are Days On Market, Homes For Sale, Median Sales Price, Closed Sales. All the content presented in this PPT design is completely editable. Download it and make adjustments in color, background, font etc. as per your unique business setting.
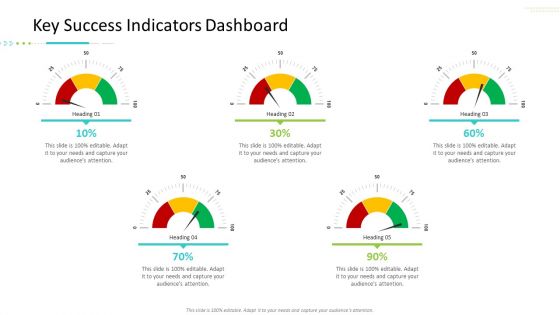
Strategic Action Plan For Business Organization Key Success Indicators Dashboard Ideas PDF
Deliver and pitch your topic in the best possible manner with this strategic action plan for business organization key success indicators dashboard ideas pdf. Use them to share invaluable insights on key success indicators dashboard and impress your audience. This template can be altered and modified as per your expectations. So, grab it now.
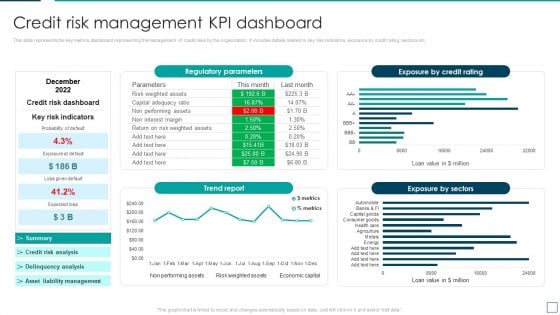
Strategic Risk Management And Mitigation Plan Credit Risk Management Kpi Dashboard Formats PDF
This slide represents the key metrics dashboard representing the management of credit risks by the organization. It includes details related to key risk indicators, exposure by credit rating, sectors etc. Get a simple yet stunning designed Strategic Risk Management And Mitigation Plan Credit Risk Management Kpi Dashboard Formats PDF. It is the best one to establish the tone in your meetings. It is an excellent way to make your presentations highly effective. So, download this PPT today from Slidegeeks and see the positive impacts. Our easy to edit Strategic Risk Management And Mitigation Plan Credit Risk Management Kpi Dashboard Formats PDF can be your go to option for all upcoming conferences and meetings. So, what are you waiting for Grab this template today.
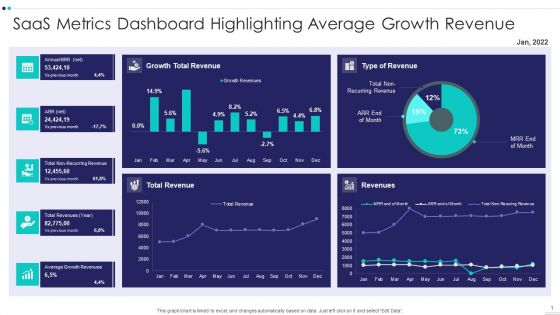
Saas Metrics Dashboard Highlighting Average Growth Revenue Diagrams PDF
Showcasing this set of slides titled Saas Metrics Dashboard Highlighting Average Growth Revenue Diagrams PDF The topics addressed in these templates are Saas Metrics Dashboard Highlighting Average Growth Revenue All the content presented in this PPT design is completely editable. Download it and make adjustments in color, background, font etc. as per your unique business setting.
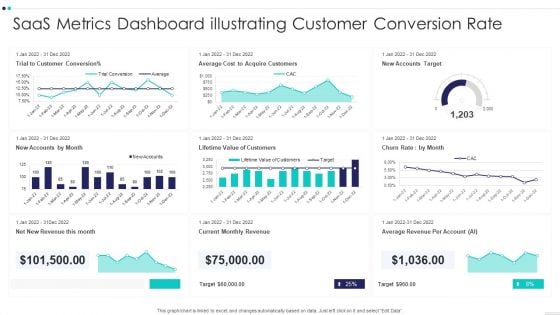
Saas Metrics Dashboard Illustrating Customer Conversion Rate Brochure PDF
Showcasing this set of slides titled Saas Metrics Dashboard Illustrating Customer Conversion Rate Brochure PDF The topics addressed in these templates are Saas Metrics Dashboard Illustrating Customer Conversion Rate All the content presented in this PPT design is completely editable. Download it and make adjustments in color, background, font etc. as per your unique business setting.

Saas Metrics Dashboard Illustrating Revenue Growth Rate Demonstration PDF
Showcasing this set of slides titled Saas Metrics Dashboard Illustrating Revenue Growth Rate Demonstration PDF The topics addressed in these templates are Saas Metrics Dashboard Illustrating Revenue Growth Rate All the content presented in this PPT design is completely editable. Download it and make adjustments in color, background, font etc. as per your unique business setting.
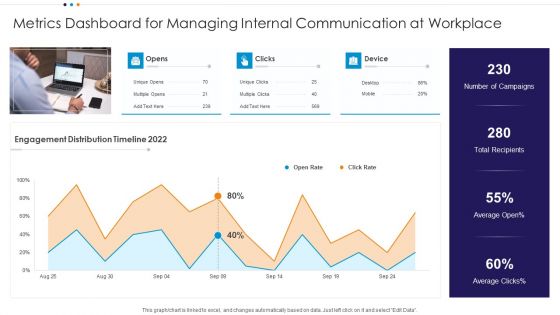
Metrics Dashboard For Managing Internal Communication At Workplace Clipart PDF
Showcasing this set of slides titled Metrics Dashboard For Managing Internal Communication At Workplace Clipart PDF The topics addressed in these templates are Metrics Dashboard, Managing Internal, Communication Workplace All the content presented in this PPT design is completely editable. Download it and make adjustments in color, background, font etc. as per your unique business setting.
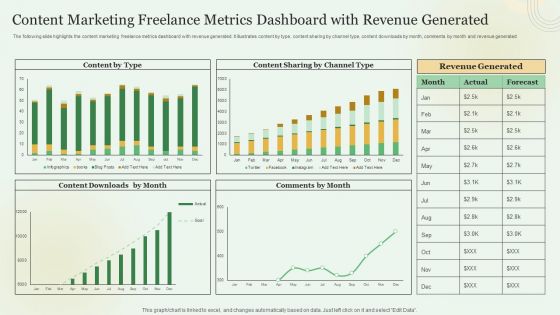
Content Marketing Freelance Metrics Dashboard With Revenue Generated Demonstration PDF
Showcasing this set of slides titled Content Marketing Freelance Metrics Dashboard With Revenue Generated Demonstration PDF. The topics addressed in these templates are Content Marketing, Freelance Metrics Dashboard, Revenue Generated. All the content presented in this PPT design is completely editable. Download it and make adjustments in color, background, font etc. as per your unique business setting.

HR Attrition Management Software Performance Metrics Dashboard Sample PDF
Showcasing this set of slides titled Attrition Management, Software Performance, Metrics Dashboard. The topics addressed in these templates are Attrition Management, Software Performance, Metrics Dashboard. All the content presented in this PPT design is completely editable. Download it and make adjustments in color, background, font etc. as per your unique business setting.
Shipping Performance Analysis Tracking Metrics Dashboard Rules PDF
Showcasing this set of slides titled Shipping Performance Analysis Tracking Metrics Dashboard Rules PDF. The topics addressed in these templates are Analysis Tracking Metrics Dashboard. All the content presented in this PPT design is completely editable. Download it and make adjustments in color, background, font etc. as per your unique business setting.
Shipping Tracking Metrics Dashboard With Vessel Tracking Designs PDF
Showcasing this set of slides titled Shipping Tracking Metrics Dashboard With Vessel Tracking Designs PDF. The topics addressed in these templates are Tracking Metrics, Dashboard With Vessel. All the content presented in this PPT design is completely editable. Download it and make adjustments in color, background, font etc. as per your unique business setting.
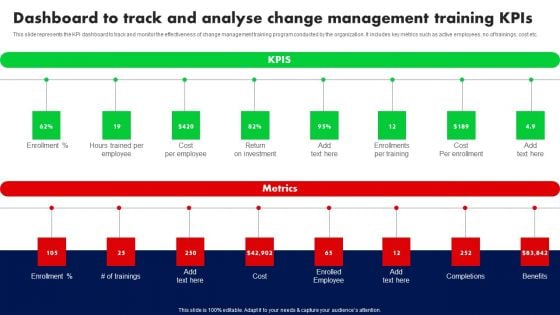
Dashboard To Track And Analyse Change Management Training Kpis Ppt PowerPoint Presentation File Gallery PDF
This slide represents the KPI dashboard to track and monitor the effectiveness of change management training program conducted by the organization. It includes key metrics such as active employees, no.of trainings, cost etc. From laying roadmaps to briefing everything in detail, our templates are perfect for you. You can set the stage with your presentation slides. All you have to do is download these easy to edit and customizable templates. Dashboard To Track And Analyse Change Management Training Kpis Ppt PowerPoint Presentation File Gallery PDF will help you deliver an outstanding performance that everyone would remember and praise you for. Do download this presentation today.
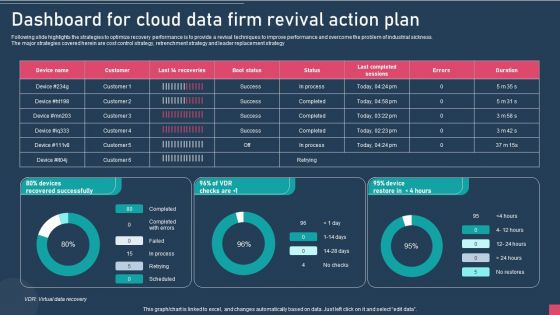
Dashboard For Cloud Data Firm Revival Action Plan Summary PDF
Following slide highlights the strategies to optimize recovery performance is to provide a revival techniques to improve performance and overcome the problem of industrial sickness. The major strategies covered herein are cost control strategy, retrenchment strategy and leader replacement strategy. Pitch your topic with ease and precision using this Dashboard For Cloud Data Firm Revival Action Plan Summary PDF. This layout presents information on Device, Success, Process. It is also available for immediate download and adjustment. So, changes can be made in the color, design, graphics or any other component to create a unique layout.
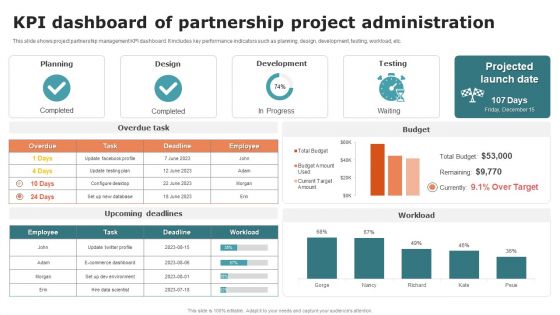
KPI Dashboard Of Partnership Project Administration Ideas PDF
This slide shows project partnership management KPI dashboard. It includes key performance indicators such as planning, design, development, testing, workload, etc. Showcasing this set of slides titled KPI Dashboard Of Partnership Project Administration Ideas PDF. The topics addressed in these templates are Planning, Design, Development. All the content presented in this PPT design is completely editable. Download it and make adjustments in color, background, font etc. as per your unique business setting.

Saas Metrics Dashboard Depicting Customer Acquisition Cost Download PDF
Pitch your topic with ease and precision using this Saas Metrics Dashboard Depicting Customer Acquisition Cost Download PDF This layout presents information on Saas Metrics Dashboard Depicting Customer Acquisition Cost It is also available for immediate download and adjustment. So, changes can be made in the color, design, graphics or any other component to create a unique layout.
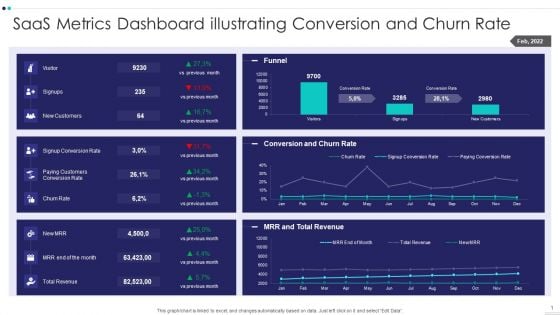
Saas Metrics Dashboard Illustrating Conversion And Churn Rate Slides PDF
Pitch your topic with ease and precision using this Saas Metrics Dashboard Illustrating Conversion And Churn Rate Slides PDF This layout presents information on Saas Metrics Dashboard Illustrating Conversion And Churn Rate It is also available for immediate download and adjustment. So, changes can be made in the color, design, graphics or any other component to create a unique layout.
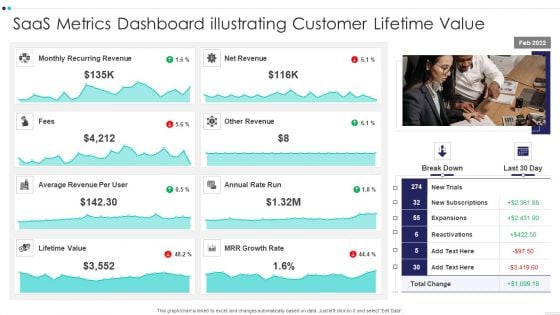
Saas Metrics Dashboard Illustrating Customer Lifetime Value Slides PDF
Pitch your topic with ease and precision using this Saas Metrics Dashboard Illustrating Customer Lifetime Value Slides PDF This layout presents information on Saas Metrics Dashboard Illustrating Customer Lifetime Value It is also available for immediate download and adjustment. So, changes can be made in the color, design, graphics or any other component to create a unique layout.
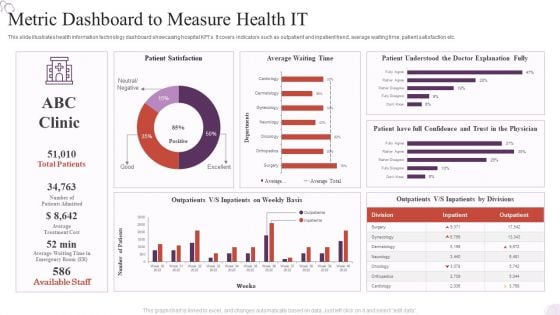
Metric Dashboard To Measure Health IT Background PDF
Pitch your topic with ease and precision using this Metric Dashboard To Measure Health IT Background PDF. This layout presents information on Metric Dashboard, Patient Satisfaction, Average Waiting Time. It is also available for immediate download and adjustment. So, changes can be made in the color, design, graphics or any other component to create a unique layout.
Shipping Order Management Tracking Metrics Dashboard Clipart PDF
Pitch your topic with ease and precision using this Shipping Order Management Tracking Metrics Dashboard Clipart PDF. This layout presents information on Management Tracking, Metrics Dashboard. It is also available for immediate download and adjustment. So, changes can be made in the color, design, graphics or any other component to create a unique layout.
Shipping Tracking Metrics Dashboard For Tracking Shipment Delays Summary PDF
Pitch your topic with ease and precision using this Shipping Tracking Metrics Dashboard For Tracking Shipment Delays Summary PDF. This layout presents information on Metrics Dashboard, Tracking Shipment. It is also available for immediate download and adjustment. So, changes can be made in the color, design, graphics or any other component to create a unique layout.
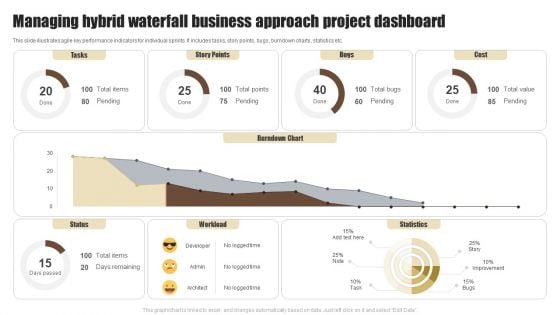
Managing Hybrid Waterfall Business Approach Project Dashboard Summary PDF
This slide illustrates agile key performance indicators for individual sprints. It includes tasks, story points, bugs, burndown charts, statistics etc. Showcasing this set of slides titled Managing Hybrid Waterfall Business Approach Project Dashboard Summary PDF. The topics addressed in these templates are Tasks, Story Points, Bugs. All the content presented in this PPT design is completely editable. Download it and make adjustments in color, background, font etc. as per your unique business setting.

Firm KPI Dashboard With Schedule Performance Index Ppt Visual Aids PDF
This graph or chart is linked to excel, and changes automatically based on data. Just left click on it and select Edit Data. Pitch your topic with ease and precision using this Firm KPI Dashboard With Schedule Performance Index Ppt Visual Aids PDF. This layout presents information on Project Cost Performance, Project Planning Stage, Monitor And Control. It is also available for immediate download and adjustment. So, changes can be made in the color, design, graphics or any other component to create a unique layout.
Big Data Real Time Analytics Lifecycle Ppt Icon Clipart Pdf
The following slide depicts big data real time analytics life cycle. It includes various phases such as data definition, acquisition, munging, analysis, visualization and utilization of analysis results. Pitch your topic with ease and precision using this Big Data Real Time Analytics Lifecycle Ppt Icon Clipart Pdf. This layout presents information on Acquisition, Munging, Analysis. It is also available for immediate download and adjustment. So, changes can be made in the color, design, graphics or any other component to create a unique layout. The following slide depicts big data real time analytics life cycle. It includes various phases such as data definition, acquisition, munging, analysis, visualization and utilization of analysis results.
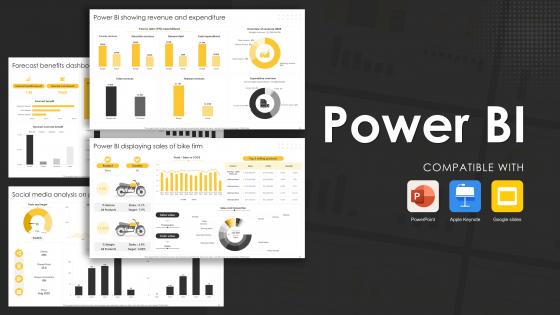
Power BI Powerpoint PPT Template Bundles
This Power BI Powerpoint PPT Template Bundles is a primer on how to capitalize on business opportunities through planning, innovation, and market intelligence. The content-ready format of the complete deck will make your job as a decision-maker a lot easier. Use this ready-made PowerPoint Template to help you outline an extensive and legible plan to capture markets and grow your company on the right path, at an exponential pace. What is even more amazing is that this presentation is completely editable and 100 percent customizable. This Data Visualization,Project Report,Business Intelligence,Data Model,Technology Project-slide complete deck helps you impress a roomful of people with your expertise in business and even presentation. Craft such a professional and appealing presentation for that amazing recall value. Download now. Our Power BI PowerPoint PPT Template Bundles are carefully crafted to provide a visually appealing and professional backdrop for any subject. These templates allow you to convey data insights and statistics with clarity and impact, making you appear professional and confident.
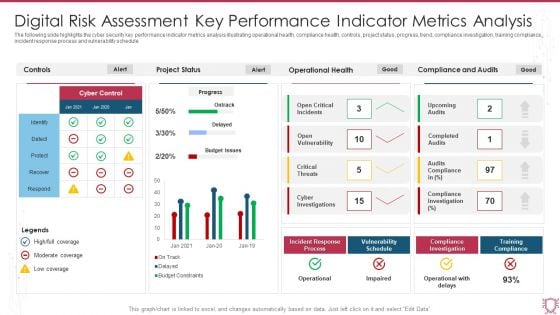
Digital Risk Assessment Key Performance Indicator Metrics Analysis Infographics PDF
The following slide highlights the cyber security key performance indicator metrics analysis illustrating operational health, compliance health, controls, project status, progress, trend, compliance investigation, training compliance, incident response process and vulnerability schedule. Showcasing this set of slides titled Digital Risk Assessment Key Performance Indicator Metrics Analysis Infographics PDF. The topics addressed in these templates are Project Status, Operational Health, Compliance And Audits. All the content presented in this PPT design is completely editable. Download it and make adjustments in color, background, font etc. as per your unique business setting.
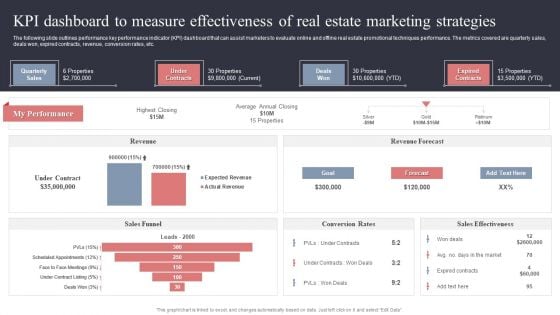
KPI Dashboard To Measure Effectiveness Of Real Estate Marketing Strategies Inspiration PDF
The following slide outlines performance key performance indicator KPI dashboard that can assist marketers to evaluate online and offline real estate promotional techniques performance. The metrics covered are quarterly sales, deals won, expired contracts, revenue, conversion rates, etc. Coming up with a presentation necessitates that the majority of the effort goes into the content and the message you intend to convey. The visuals of a PowerPoint presentation can only be effective if it supplements and supports the story that is being told. Keeping this in mind our experts created KPI Dashboard To Measure Effectiveness Of Real Estate Marketing Strategies Inspiration PDF to reduce the time that goes into designing the presentation. This way, you can concentrate on the message while our designers take care of providing you with the right template for the situation.
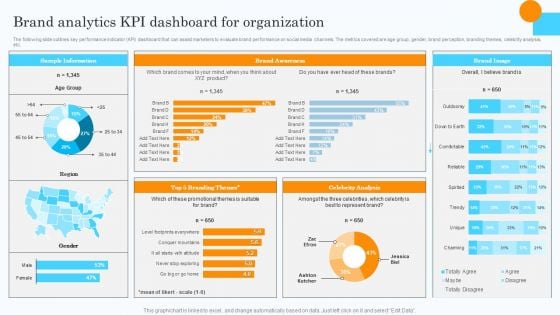
Market Research Assessment Of Target Market Requirements Brand Analytics Kpi Dashboard For Organization Clipart PDF
The following slide outlines key performance indicator KPI dashboard that can assist marketers to evaluate brand performance on social media channels. The metrics covered are age group, gender, brand perception, branding themes, celebrity analysis, etc. Do you have an important presentation coming up Are you looking for something that will make your presentation stand out from the rest Look no further than Market Research Assessment Of Target Market Requirements Brand Analytics Kpi Dashboard For Organization Clipart PDF. With our professional designs, you can trust that your presentation will pop and make delivering it a smooth process. And with Slidegeeks, you can trust that your presentation will be unique and memorable. So why wait Grab Market Research Assessment Of Target Market Requirements Brand Analytics Kpi Dashboard For Organization Clipart PDF today and make your presentation stand out from the rest.
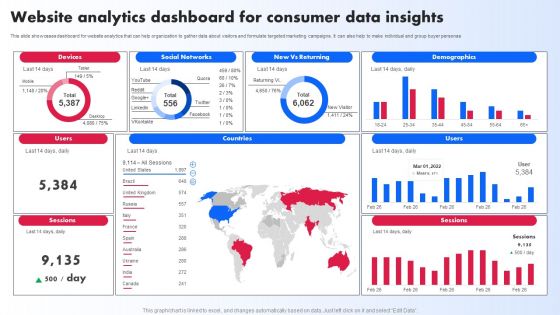
Website Analytics Dashboard For Consumer Data Insights Ppt PowerPoint Presentation File Slides PDF
This slide showcases dashboard for website analytics that can help organization to gather data about visitors and formulate targeted marketing campaigns. It can also help to make individual and group buyer personas. If you are looking for a format to display your unique thoughts, then the professionally designed Website Analytics Dashboard For Consumer Data Insights Ppt PowerPoint Presentation File Slides PDF is the one for you. You can use it as a Google Slides template or a PowerPoint template. Incorporate impressive visuals, symbols, images, and other charts. Modify or reorganize the text boxes as you desire. Experiment with shade schemes and font pairings. Alter, share or cooperate with other people on your work. Download Website Analytics Dashboard For Consumer Data Insights Ppt PowerPoint Presentation File Slides PDF and find out how to give a successful presentation. Present a perfect display to your team and make your presentation unforgettable.
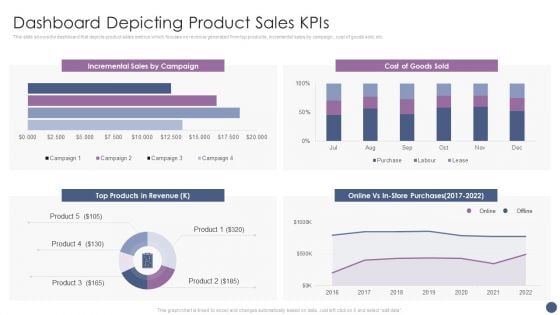
Competitive Sales Strategy Development Plan For Revenue Growth Dashboard Depicting Product Sales Kpis Elements PDF
This slide shows the dashboard that depicts product sales metrics which focuses on revenue generated from top products, incremental sales by campaign, cost of goods sold, etc. Deliver an awe inspiring pitch with this creative Competitive Sales Strategy Development Plan For Revenue Growth Dashboard Depicting Product Sales Kpis Elements PDF bundle. Topics like Incremental Sales, Cost, Store Purchases can be discussed with this completely editable template. It is available for immediate download depending on the needs and requirements of the user.


 Continue with Email

 Home
Home


