Daily Snapshot
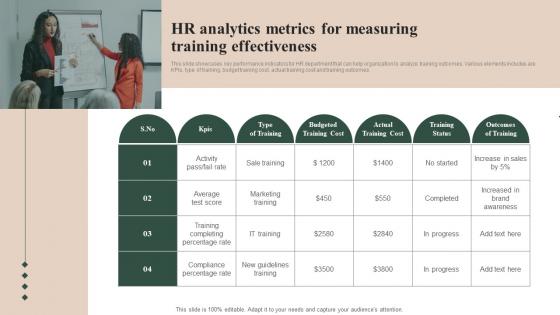
HR Analytics Metrics For Measuring Training Effectiveness Infographics Pdf
This slide showcases key performance indicators for HR department that can help organization to analyze training outcomes. Various elements includes are KPIs, type of training, budget training cost, actual training cost and training outcomes Showcasing this set of slides titled HR Analytics Metrics For Measuring Training Effectiveness Infographics Pdf The topics addressed in these templates are Percentage Rate, Training Completing, Marketing Training All the content presented in this PPT design is completely editable. Download it and make adjustments in color, background, font etc. as per your unique business setting. This slide showcases key performance indicators for HR department that can help organization to analyze training outcomes. Various elements includes are KPIs, type of training, budget training cost, actual training cost and training outcomes.
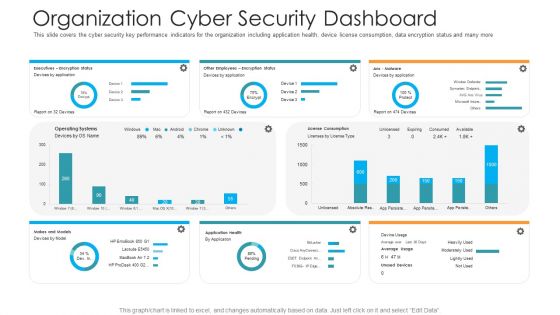
Organization Cyber Security Dashboard Hacking Prevention Awareness Training For IT Security Professional PDF
This slide covers the cyber security key performance indicators for the organization including application health, device license consumption, data encryption status and many more. Deliver and pitch your topic in the best possible manner with this organization cyber security dashboard hacking prevention awareness training for it security professional pdf. Use them to share invaluable insights on executives, license consumption, operating systems and impress your audience. This template can be altered and modified as per your expectations. So, grab it now.
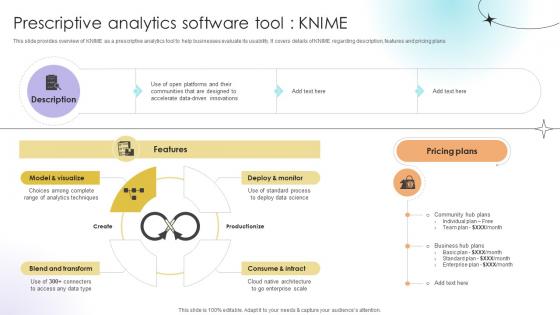
Prescriptive Analytics Software Tool Knime Data Analytics SS V
This slide provides overview of KNIME as a prescriptive analytics tool to help businesses evaluate its usability. It covers details of KNIME regarding description, features and pricing plans.The Prescriptive Analytics Software Tool Knime Data Analytics SS V is a compilation of the most recent design trends as a series of slides. It is suitable for any subject or industry presentation, containing attractive visuals and photo spots for businesses to clearly express their messages. This template contains a variety of slides for the user to input data, such as structures to contrast two elements, bullet points, and slides for written information. Slidegeeks is prepared to create an impression. This slide provides overview of KNIME as a prescriptive analytics tool to help businesses evaluate its usability. It covers details of KNIME regarding description, features and pricing plans.
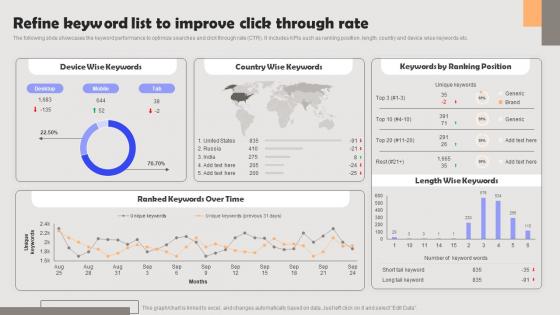
Improving PPC Campaign Results Refine Keyword List To Improve Click Through Rate Pictures Pdf
The following slide showcases the keyword performance to optimize searches and click through rate CTR. It includes KPIs such as ranking position, length, country and device wise keywords etc. Here you can discover an assortment of the finest PowerPoint and Google Slides templates. With these templates, you can create presentations for a variety of purposes while simultaneously providing your audience with an eye-catching visual experience. Download Improving PPC Campaign Results Refine Keyword List To Improve Click Through Rate Pictures Pdf to deliver an impeccable presentation. These templates will make your job of preparing presentations much quicker, yet still, maintain a high level of quality. Slidegeeks has experienced researchers who prepare these templates and write high-quality content for you. Later on, you can personalize the content by editing the Improving PPC Campaign Results Refine Keyword List To Improve Click Through Rate Pictures Pdf. The following slide showcases the keyword performance to optimize searches and click through rate CTR. It includes KPIs such as ranking position, length, country and device wise keywords etc.
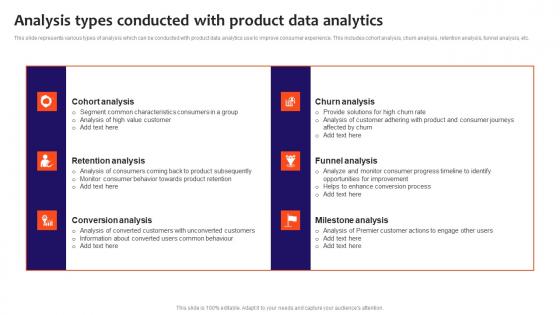
Analysis Types Conducted With Product Data Analytics Download Pdf
This slide represents various types of analysis which can be conducted with product data analytics use to improve consumer experience. This includes cohort analysis, churn analysis, retention analysis, funnel analysis, etc. Showcasing this set of slides titled Analysis Types Conducted With Product Data Analytics Download Pdf. The topics addressed in these templates are Retention Analysis, Cohort Analysis, Conversion Analysis. All the content presented in this PPT design is completely editable. Download it and make adjustments in color, background, font etc. as per your unique business setting. This slide represents various types of analysis which can be conducted with product data analytics use to improve consumer experience. This includes cohort analysis, churn analysis, retention analysis, funnel analysis, etc.
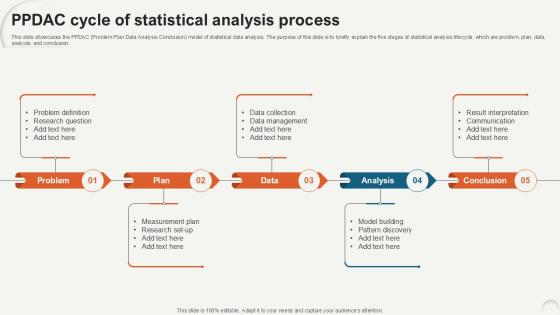
PPDAC Cycle Of Statistical Data Analytics For Informed Decision Ppt Template
This slide showcases the PPDAC Problem Plan Data Analysis Conclusion model of statistical data analysis. The purpose of this slide is to briefly explain the five stages of statistical analysis lifecycle, which are problem, plan, data, analysis, and conclusion. Are you searching for a PPDAC Cycle Of Statistical Data Analytics For Informed Decision Ppt Template that is uncluttered, straightforward, and original Its easy to edit, and you can change the colors to suit your personal or business branding. For a presentation that expresses how much effort you have put in, this template is ideal With all of its features, including tables, diagrams, statistics, and lists, its perfect for a business plan presentation. Make your ideas more appealing with these professional slides. Download PPDAC Cycle Of Statistical Data Analytics For Informed Decision Ppt Template from Slidegeeks today. This slide showcases the PPDAC Problem Plan Data Analysis Conclusion model of statistical data analysis. The purpose of this slide is to briefly explain the five stages of statistical analysis lifecycle, which are problem, plan, data, analysis, and conclusion.
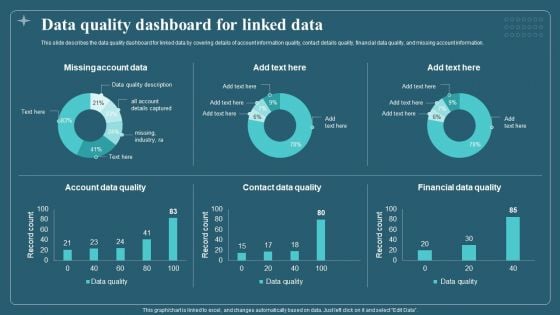
Data Quality Dashboard For Linked Data Download PDF
This slide describes the data quality dashboard for linked data by covering details of account information quality, contact details quality, financial data quality, and missing account information. Deliver an awe inspiring pitch with this creative Data Quality Dashboard For Linked Data Download PDF bundle. Topics like Account Data Quality, Contact Data Quality, Financial Data Quality can be discussed with this completely editable template. It is available for immediate download depending on the needs and requirements of the user.
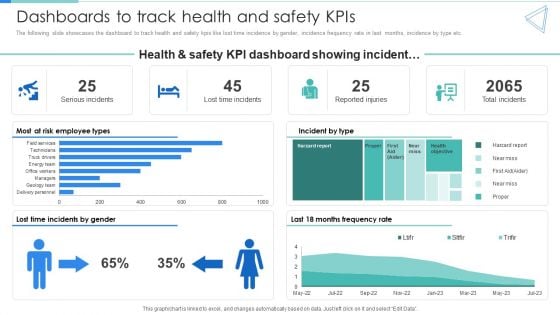
Deployment Of Workplace Safety Management Program Dashboards To Track Health And Safety Kpis Professional PDF
The following slide showcases the dashboard to track health and safety kpis like lost time incidence by gender, incidence frequency rate in last months, incidence by type etc. Presenting this PowerPoint presentation, titled Deployment Of Workplace Safety Management Program Dashboards To Track Health And Safety Kpis Professional PDF, with topics curated by our researchers after extensive research. This editable presentation is available for immediate download and provides attractive features when used. Download now and captivate your audience. Presenting this Deployment Of Workplace Safety Management Program Dashboards To Track Health And Safety Kpis Professional PDF. Our researchers have carefully researched and created these slides with all aspects taken into consideration. This is a completely customizable Deployment Of Workplace Safety Management Program Dashboards To Track Health And Safety Kpis Professional PDF that is available for immediate downloading. Download now and make an impact on your audience. Highlight the attractive features available with our PPTs.
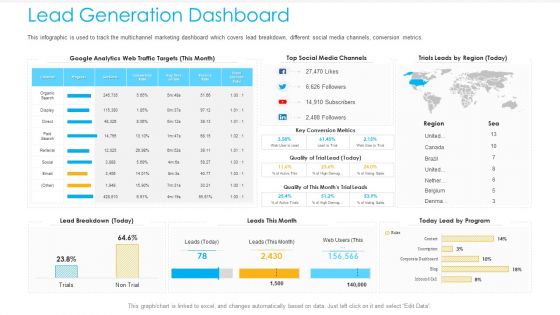
Unified Business To Consumer Marketing Strategy Lead Generation Dashboard Template PDF
This infographic is used to track the multichannel marketing dashboard which covers lead breakdown, different social media channels, conversion metrics.Deliver and pitch your topic in the best possible manner with this unified business to consumer marketing strategy lead generation dashboard template pdf. Use them to share invaluable insights on key conversion metrics, today lead by program, leads this month and impress your audience. This template can be altered and modified as per your expectations. So, grab it now.
Data Model Performance Tracking Data Modeling Approaches For Modern Analytics Formats Pdf
This slide shows the data model performance tracking dashboard. The purpose of this slide is to represent the Information related to the change brought by data models graphically. Present like a pro with Data Model Performance Tracking Data Modeling Approaches For Modern Analytics Formats Pdf Create beautiful presentations together with your team, using our easy to use presentation slides. Share your ideas in real time and make changes on the fly by downloading our templates. So whether you are in the office, on the go, or in a remote location, you can stay in sync with your team and present your ideas with confidence. With Slidegeeks presentation got a whole lot easier. Grab these presentations today. This slide shows the data model performance tracking dashboard. The purpose of this slide is to represent the Information related to the change brought by data models graphically.
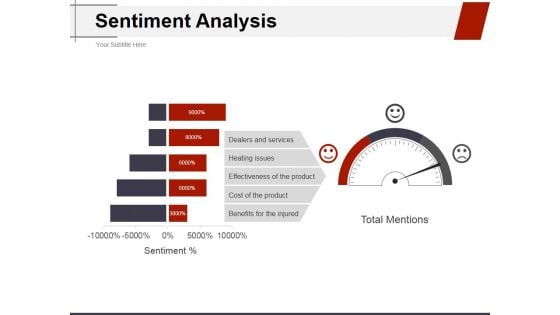
Sentiment Analysis Ppt PowerPoint Presentation Ideas Structure
This is a sentiment analysis ppt powerpoint presentation ideas structure. This is a three stage process. The stages in this process are dealers and services, heating issues, effectiveness of the product, cost of the product, benefits for the injured.

Agenda Strategic Plan For Call Center Employees Elements PDF
Find a pre designed and impeccable Agenda Strategic Plan For Call Center Employees Elements PDF. The templates can ace your presentation without additional effort. You can download these easy to edit presentation templates to make your presentation stand out from others. So, what are you waiting for Download the template from Slidegeeks today and give a unique touch to your presentation.
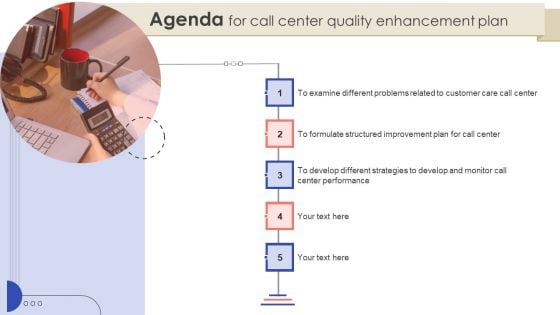
Agenda For Call Center Quality Enhancement Plan Portrait PDF
Find a pre designed and impeccable Agenda For Call Center Quality Enhancement Plan Portrait PDF. The templates can ace your presentation without additional effort. You can download these easy to edit presentation templates to make your presentation stand out from others. So, what are you waiting for Download the template from Slidegeeks today and give a unique touch to your presentation.
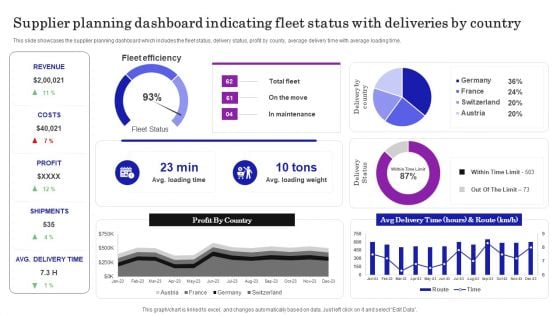
Supplier Planning Dashboard Indicating Fleet Status With Deliveries By Country Ideas PDF
This slide showcases the supplier planning dashboard which includes the fleet status, delivery status, profit by county, average delivery time with average loading time. Here you can discover an assortment of the finest PowerPoint and Google Slides templates. With these templates, you can create presentations for a variety of purposes while simultaneously providing your audience with an eye catching visual experience. Download Supplier Planning Dashboard Indicating Fleet Status With Deliveries By Country Ideas PDF to deliver an impeccable presentation. These templates will make your job of preparing presentations much quicker, yet still, maintain a high level of quality. Slidegeeks has experienced researchers who prepare these templates and write high quality content for you. Later on, you can personalize the content by editing the Supplier Planning Dashboard Indicating Fleet Status With Deliveries By Country Ideas PDF.
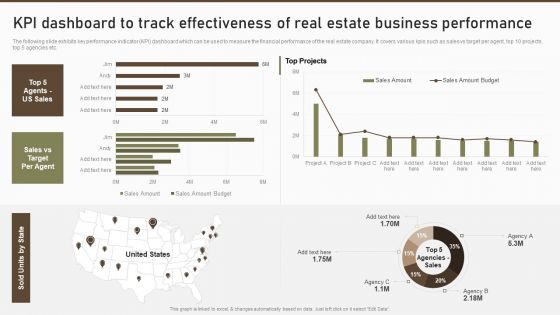
KPI Dashboard To Track Effectiveness Of Real Estate Business Performance Guidelines PDF
The following slide exhibits key performance indicator KPI dashboard which can be used to measure the financial performance of the real estate company. It covers various kpis such as sales vs target per agent, top 10 projects, top 5 agencies etc.Deliver an awe inspiring pitch with this creative KPI Dashboard To Track Effectiveness Of Real Estate Business Performance Guidelines PDF bundle. Topics like Top Projects, Sales Amount, Sales Amount can be discussed with this completely editable template. It is available for immediate download depending on the needs and requirements of the user.
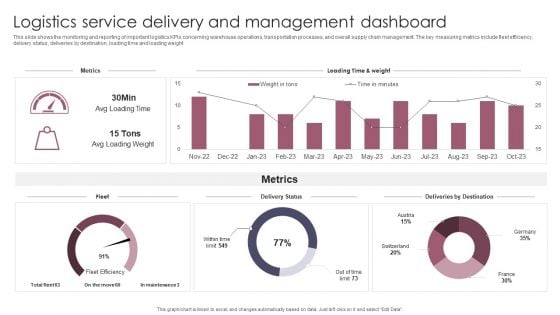
Logistics Service Delivery And Management Dashboard Introduction PDF
This slide shows the monitoring and reporting of important logistics KPIs concerning warehouse operations, transportation processes, and overall supply chain management. The key measuring metrics include fleet efficiency, delivery status, deliveries by destination, loading time and loading weight. Showcasing this set of slides titled Logistics Service Delivery And Management Dashboard Introduction PDF. The topics addressed in these templates are Logistics Service Delivery, Management Dashboard. All the content presented in this PPT design is completely editable. Download it and make adjustments in color, background, font etc. as per your unique business setting.
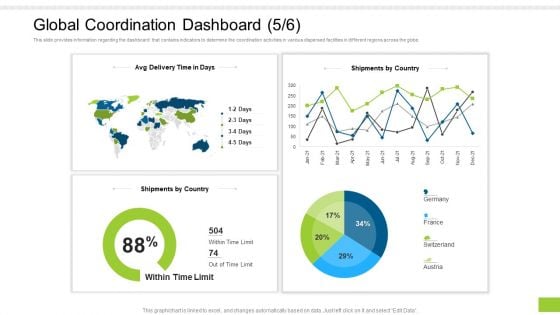
Enterprise Collaboration Global Scale Global Coordination Dashboard Limit Pictures PDF
This slide provides information regarding the dashboard that contains indicators to determine the coordination activities in various dispersed facilities in different regions across the globe. Deliver an awe-inspiring pitch with this creative enterprise collaboration global scale global coordination dashboard limit pictures pdf bundle. Topics like global coordination dashboard can be discussed with this completely editable template. It is available for immediate download depending on the needs and requirements of the user.

KPI Dashboard For Network Asset Monitoring Clipart PDF
This slide covers KPI dashboard of network asset tracking report. It involves details such as audit summary, computers data, software summary, warranty summary and software compliance summary.Showcasing this set of slides titled KPI Dashboard For Network Asset Monitoring Clipart PDF The topics addressed in these templates are Commercial Software, Software Compliance, Warranty Summary All the content presented in this PPT design is completely editable. Download it and make adjustments in color, background, font etc. as per your unique business setting.
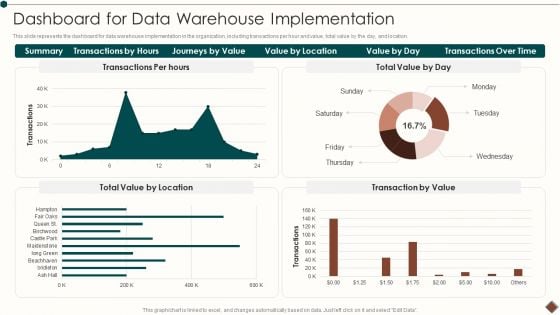
Data Warehouse Implementation Dashboard For Data Warehouse Implementation Microsoft PDF
This slide represents the dashboard for data warehouse implementation in the organization, including transactions per hour and value, total value by the day, and location.Deliver an awe inspiring pitch with this creative Data Warehouse Implementation Dashboard For Data Warehouse Implementation Microsoft PDF bundle. Topics like Transactions Time, Journeys Value, Transactions can be discussed with this completely editable template. It is available for immediate download depending on the needs and requirements of the user.
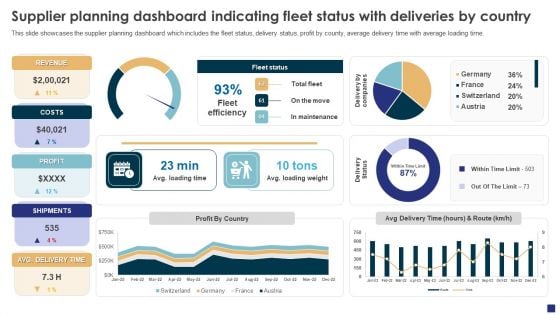
Comprehensive Guide To Ecommerce Supplier Planning Dashboard Indicating Fleet Status Mockup PDF
This slide showcases the supplier planning dashboard which includes the fleet status, delivery status, profit by county, average delivery time with average loading time. Want to ace your presentation in front of a live audience Our Comprehensive Guide To Ecommerce Supplier Planning Dashboard Indicating Fleet Status Mockup PDF can help you do that by engaging all the users towards you.. Slidegeeks experts have put their efforts and expertise into creating these impeccable powerpoint presentations so that you can communicate your ideas clearly. Moreover, all the templates are customizable, and easy-to-edit and downloadable. Use these for both personal and commercial use.
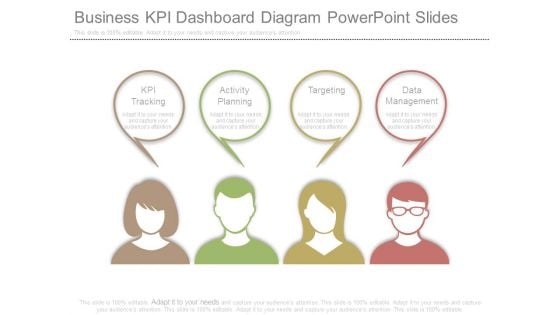
Business Kpi Dashboard Diagram Powerpoint Slides
This is a business kpi dashboard diagram powerpoint slides. This is a four stage process. The stages in this process are kpi tracking, activity planning, targeting, data management.
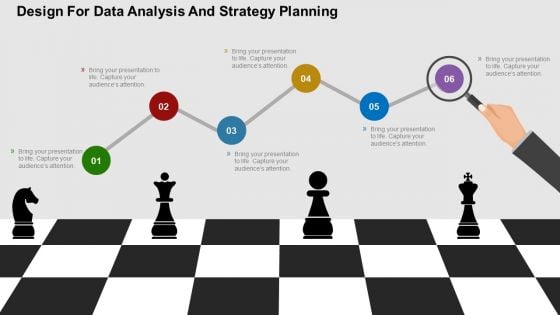
Design For Data Analysis And Strategy Planning Powerpoint Templates
This business slide has backdrop of chess game with six zigzag steps. You may download this slide for data analysis and strategy planning related topics. Illustrate your plans to your listeners with using this slide.

Email Program Dashboard Ppt Powerpoint Slides
This is a email program dashboard ppt powerpoint slides. This is a four stage process. The stages in this process are send test, clicks, clicks to open, summary, admin, administrator, chris, hssadmin.
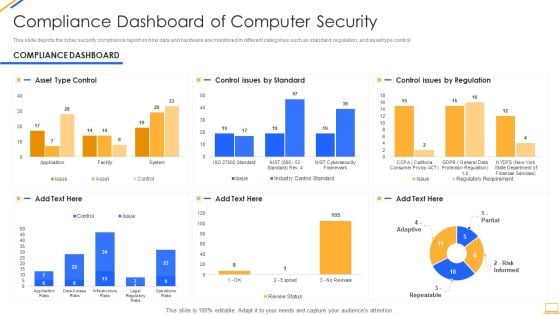
Desktop Security Management Compliance Dashboard Of Computer Security Graphics PDF
This slide depicts the cyber security compliance report on how data and hardware are monitored in different categories such as standard, regulation, and asset type control. Deliver an awe inspiring pitch with this creative desktop security management compliance dashboard of computer security graphics pdf bundle. Topics like compliance dashboard of computer security can be discussed with this completely editable template. It is available for immediate download depending on the needs and requirements of the user.
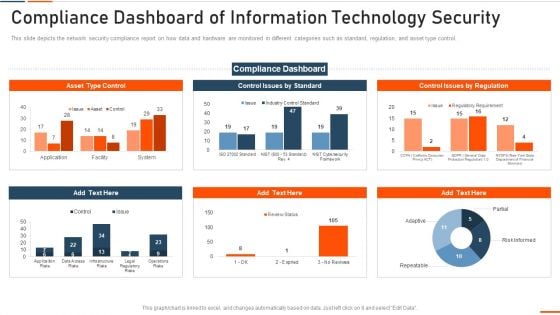
Compliance Dashboard Of Information Technology Security Ppt Inspiration Microsoft PDF
This slide depicts the network security compliance report on how data and hardware are monitored in different categories such as standard, regulation, and asset type control. Deliver an awe inspiring pitch with this creative compliance dashboard of information technology security ppt inspiration microsoft pdf bundle. Topics like compliance dashboard of information technology security can be discussed with this completely editable template. It is available for immediate download depending on the needs and requirements of the user.
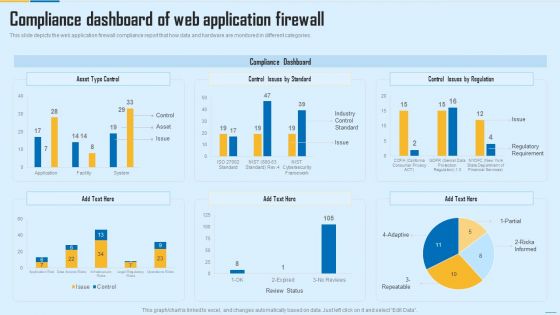
Compliance Dashboard Of Web Application Firewall WAF Platform Topics PDF
This slide depicts the web application firewall compliance report that how data and hardware are monitored in different categories. Deliver and pitch your topic in the best possible manner with this Compliance Dashboard Of Web Application Firewall WAF Platform Topics PDF. Use them to share invaluable insights on Compliance Dashboard, Web Application Firewall and impress your audience. This template can be altered and modified as per your expectations. So, grab it now.

Departmental Operations Training Department Program Status Dashboard Mockup PDF
This slide covers employees training status dashboard for HR manager. It includes KPIs such as training cost, cost per participant, training type, number of participants, training hours, occupancy rates, etc. Showcasing this set of slides titled Departmental Operations Training Department Program Status Dashboard Mockup PDF. The topics addressed in these templates are Number Of Participants, Hours Of Training, Total Completed Training. All the content presented in this PPT design is completely editable. Download it and make adjustments in color, background, font etc. as per your unique business setting.
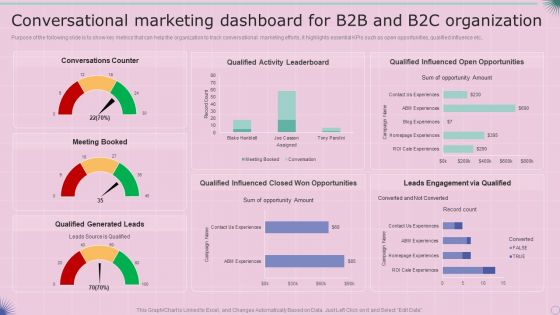
Conversational Marketing Dashboard For B2B And B2C Organization Sample PDF
Purpose of the following slide is to show key metrics that can help the organization to track conversational marketing efforts, it highlights essential KPIs such as open opportunities, qualified influence etc. Deliver and pitch your topic in the best possible manner with this Conversational Marketing Dashboard For B2B And B2C Organization Sample PDF. Use them to share invaluable insights on Conversational Marketing Dashboard, B2c Organization and impress your audience. This template can be altered and modified as per your expectations. So, grab it now.
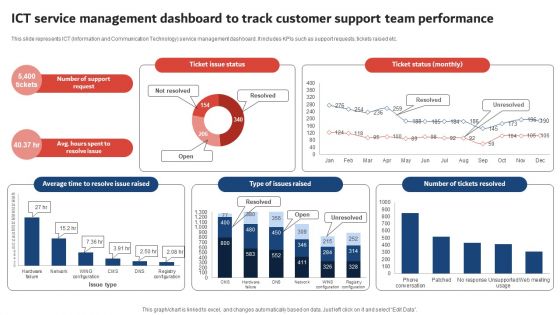
ICT Service Management Dashboard To Track Customer Support Team Performance Summary PDF
This slide represents ICT Information and Communication Technology service management dashboard. It includes KPIs such as support requests, tickets raised etc. Want to ace your presentation in front of a live audience Our ICT Service Management Dashboard To Track Customer Support Team Performance Summary PDF can help you do that by engaging all the users towards you. Slidegeeks experts have put their efforts and expertise into creating these impeccable powerpoint presentations so that you can communicate your ideas clearly. Moreover, all the templates are customizable, and easy to edit and downloadable. Use these for both personal and commercial use.
Construction Management Services And Action Plan KPI Metrics And Dashboard Download PDF
Presenting construction management services and action plan kpi metrics and dashboard download pdf to provide visual cues and insights. Share and navigate important information on two stages that need your due attention. This template can be used to pitch topics like kpi metrics and dashboard. In addtion, this PPT design contains high resolution images, graphics, etc, that are easily editable and available for immediate download.
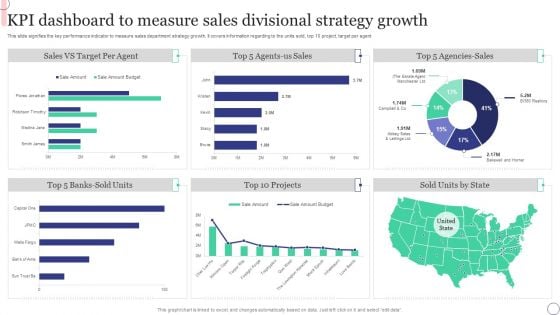
KPI Dashboard To Measure Sales Divisional Strategy Growth Formats PDF
This slide signifies the key performance indicator to measure sales department strategy growth. It covers information regarding to the units sold, top 10 project, target per agent. Showcasing this set of slides titled KPI Dashboard To Measure Sales Divisional Strategy Growth Formats PDF. The topics addressed in these templates are Sales, Target. All the content presented in this PPT design is completely editable. Download it and make adjustments in color, background, font etc. as per your unique business setting.
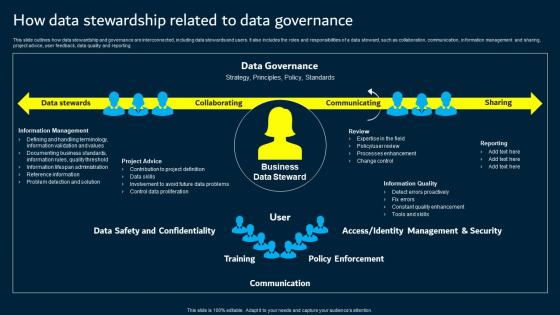
How Data Stewardship Related To Data Governance Data Custodianship Portrait Pdf
This slide outlines how data stewardship and governance are interconnected, including data stewards and users. It also includes the roles and responsibilities of a data steward, such as collaboration, communication, information management and sharing, project advice, user feedback, data quality and reporting. If your project calls for a presentation, then Slidegeeks is your go to partner because we have professionally designed, easy to edit templates that are perfect for any presentation. After downloading, you can easily edit How Data Stewardship Related To Data Governance Data Custodianship Portrait Pdf and make the changes accordingly. You can rearrange slides or fill them with different images. Check out all the handy templates This slide outlines how data stewardship and governance are interconnected, including data stewards and users. It also includes the roles and responsibilities of a data steward, such as collaboration, communication, information management and sharing, project advice, user feedback, data quality and reporting.
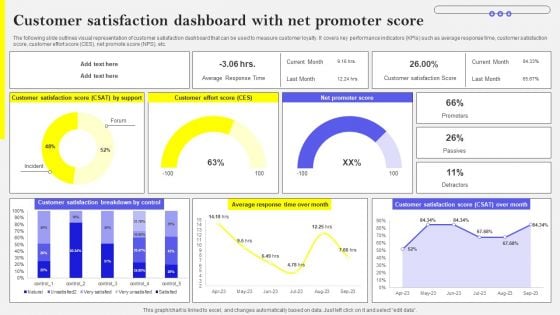
Customer Satisfaction Dashboard With Net Promoter Score Introduction PDF
The following slide outlines visual representation of customer satisfaction dashboard that can be used to measure customer loyalty. It covers key performance indicators KPIs such as average response time, customer satisfaction score, customer effort score CES, net promote score NPS, etc. Do you have to make sure that everyone on your team knows about any specific topic I yes, then you should give Customer Satisfaction Dashboard With Net Promoter Score Introduction PDF a try. Our experts have put a lot of knowledge and effort into creating this impeccable Customer Satisfaction Dashboard With Net Promoter Score Introduction PDF. You can use this template for your upcoming presentations, as the slides are perfect to represent even the tiniest detail. You can download these templates from the Slidegeeks website and these are easy to edit. So grab these today
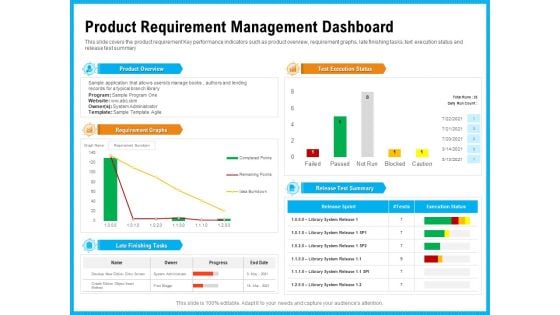
Requirement Gathering Techniques Product Requirement Management Dashboard Sample PDF
This slide covers the product requirement Key performance indicators such as product overview, requirement graphs, late finishing tasks, text execution status and release test summary. Deliver an awe inspiring pitch with this creative requirement gathering techniques product requirement management dashboard sample pdf bundle. Topics like product overview, requirement graphs, late finishing tasks, test execution status, release test summary can be discussed with this completely editable template. It is available for immediate download depending on the needs and requirements of the user.
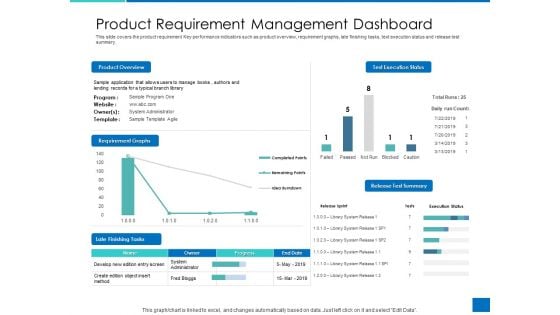
Analyzing Requirement Management Process Product Requirement Management Dashboard Download PDF
This slide covers the product requirement Key performance indicators such as product overview, requirement graphs, late finishing tasks, text execution status and release test summary. Deliver an awe inspiring pitch with this creative analyzing requirement management process product requirement management dashboard download pdf bundle. Topics like product overview, requirement graphs, late finishing tasks, test execution status, release test summary can be discussed with this completely editable template. It is available for immediate download depending on the needs and requirements of the user.
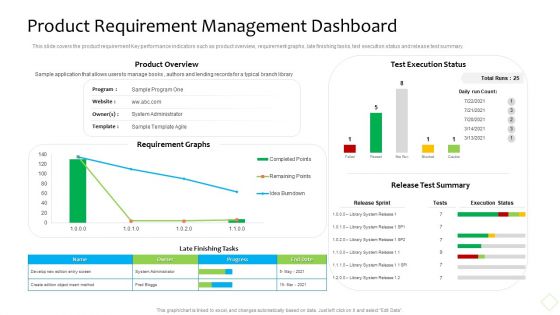
Product Demand Administration Product Requirement Management Dashboard Themes PDF
This slide covers the product requirement Key performance indicators such as product overview, requirement graphs, late finishing tasks, text execution status and release test summary. Deliver and pitch your topic in the best possible manner with this product demand administration product requirement management dashboard themes pdf. Use them to share invaluable insights on develop, progress, system and impress your audience. This template can be altered and modified as per your expectations. So, grab it now.
MSW Management Waste Management Tracking Dashboard Rules PDF
This slide covers the key performance indicators for waste management including waste trucks tracker, green house gasses emissions, energy used and many more. Deliver an awe inspiring pitch with this creative MSW Management Waste Management Tracking Dashboard Rules Pdf bundle. Topics like waste management manpower budget can be discussed with this completely editable template. It is available for immediate download depending on the needs and requirements of the user.
Project Management Tracking Dashboard To Review Decision Download PDF
The below slide depicts the key performing indicators in project decision making. It includes elements such as overall status, progress, progress, time, cost and work volume. Pitch your topic with ease and precision using this Project Management Tracking Dashboard To Review Decision Download PDF. This layout presents information on Progress, Activity Status, Overall Status. It is also available for immediate download and adjustment. So, changes can be made in the color, design, graphics or any other component to create a unique layout.
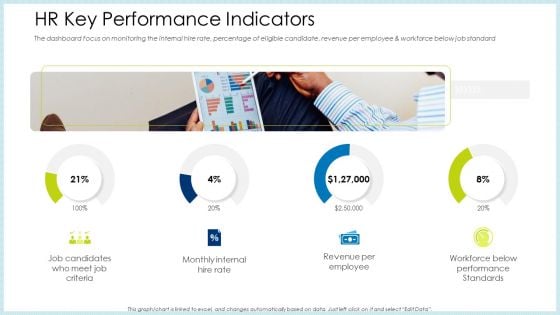
Technology Innovation Human Resource System HR Key Performance Indicators Ppt Styles Designs Download PDF
The dashboard focus on monitoring the internal hire rate, percentage of eligible candidate, revenue per employee and workforce below job standard. Presenting technology innovation human resource system hr key performance indicators ppt styles designs download pdf to provide visual cues and insights. Share and navigate important information on four stages that need your due attention. This template can be used to pitch topics like revenue per employee, performance standards, internal rate. In addition, this PPT design contains high-resolution images, graphics, etc, that are easily editable and available for immediate download.
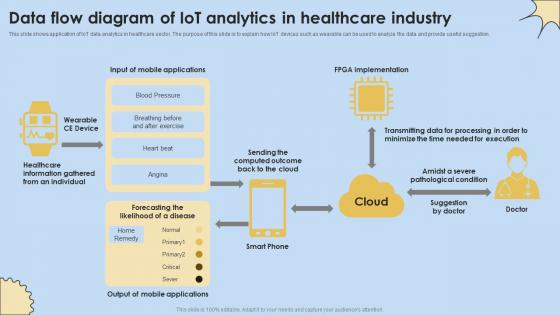
Data Flow Diagram Of IoT Analytics In Healthcare Industry Internet Of Things Analysis Clipart Pdf
This slide shows application of IoT data analytics in healthcare sector. The purpose of this slide is to explain how IoT devices such as wearable can be used to analyze the data and provide useful suggestion. If you are looking for a format to display your unique thoughts, then the professionally designed Data Flow Diagram Of IoT Analytics In Healthcare Industry Internet Of Things Analysis Clipart Pdf is the one for you. You can use it as a Google Slides template or a PowerPoint template. Incorporate impressive visuals, symbols, images, and other charts. Modify or reorganize the text boxes as you desire. Experiment with shade schemes and font pairings. Alter, share or cooperate with other people on your work. Download Data Flow Diagram Of IoT Analytics In Healthcare Industry Internet Of Things Analysis Clipart Pdf and find out how to give a successful presentation. Present a perfect display to your team and make your presentation unforgettable. This slide shows application of IoT data analytics in healthcare sector. The purpose of this slide is to explain how IoT devices such as wearable can be used to analyze the data and provide useful suggestion.
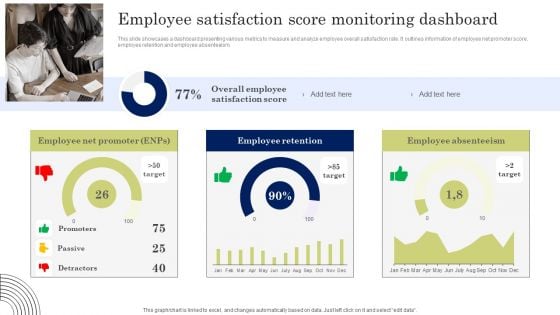
Employee Satisfaction Score Monitoring Dashboard Structure PDF
This slide showcases a dashboard presenting various metrics to measure and analyze employee overall satisfaction rate. It outlines information of employee net promoter score, employee retention and employee absenteeism. Find highly impressive Employee Satisfaction Score Monitoring Dashboard Structure PDF on Slidegeeks to deliver a meaningful presentation. You can save an ample amount of time using these presentation templates. No need to worry to prepare everything from scratch because Slidegeeks experts have already done a huge research and work for you. You need to download Employee Satisfaction Score Monitoring Dashboard Structure PDF for your upcoming presentation. All the presentation templates are 100 percent editable and you can change the color and personalize the content accordingly. Download now.
Monthly Retail Stock Performance Dashboard Icons PDF
This slide shows monthly inventory performance of retail products for analyzing monthly in stock an out-stock with their values. It include metrics like current inventory available, current inventory value and closing monthly stock etc. Showcasing this set of slides titled Monthly Retail Stock Performance Dashboard Icons PDF. The topics addressed in these templates are Current Inventory Available, Current Inventory Value. All the content presented in this PPT design is completely editable. Download it and make adjustments in color, background, font etc. as per your unique business setting.
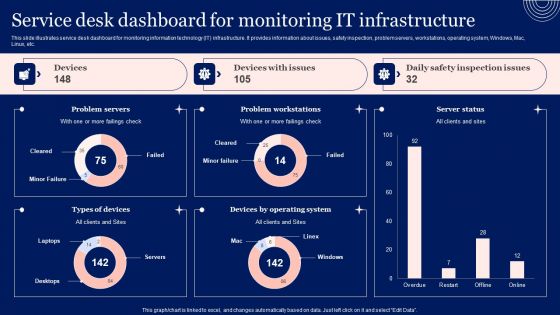
Implementing Advanced Service Help Desk Administration Program Service Desk Dashboard For Monitoring It Infrastructure Summary PDF
This slide illustrates service desk dashboard for monitoring information technology IT infrastructure. It provides information about issues, safety inspection, problem servers, workstations, operating system, Windows, Mac, Linux, etc. Take your projects to the next level with our ultimate collection of Implementing Advanced Service Help Desk Administration Program Service Desk Dashboard For Monitoring It Infrastructure Summary PDF. Slidegeeks has designed a range of layouts that are perfect for representing task or activity duration, keeping track of all your deadlines at a glance. Tailor these designs to your exact needs and give them a truly corporate look with your own brand colors they will make your projects stand out from the rest
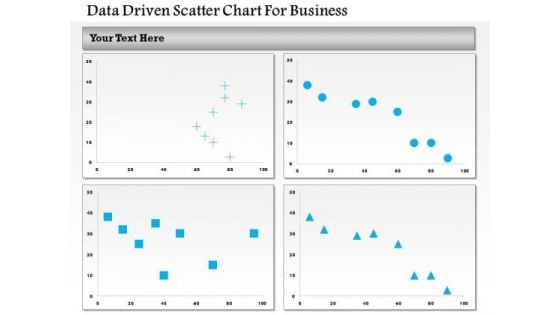
Business Diagram Data Driven Scatter Chart For Business PowerPoint Slide
This business diagram has been designed with four comparative charts. This slide suitable for data representation. You can also use this slide to present business analysis and reports. Use this diagram to present your views in a wonderful manner.
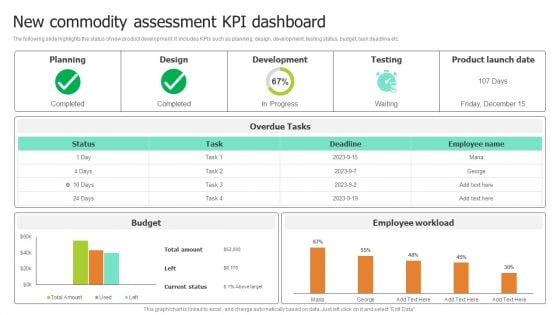
New Commodity Assessment Kpi Dashboard Pictures PDF
The following slide highlights the status of new product development. It includes KPIs such as planning, design, development, testing status, budget, task deadline etc.Showcasing this set of slides titled New Commodity Assessment Kpi Dashboard Pictures PDF. The topics addressed in these templates are Development, Product Launch Date, Overdue Tasks. All the content presented in this PPT design is completely editable. Download it and make adjustments in color, background, font etc. as per your unique business setting.
Ecommerce Kpis Reach Act Convert Engage Ppt PowerPoint Presentation Icon
This is a ecommerce kpis reach act convert engage ppt powerpoint presentation icon. This is a five stage process. The stages in this process are kpi proposal, kpi plan, kpi scheme.
Monthly Sales KPI Dashboard For Tracking Brand Recommendation Progress Background PDF
Following slide demonstrates key performance indicator dashboard for tracking monthly sales to monitor business performance. It includes components such as monthly execution cost, sales, state wise events, Brand market, and programs. Showcasing this set of slides titled Monthly Sales KPI Dashboard For Tracking Brand Recommendation Progress Background PDF. The topics addressed in these templates are Products Sold, Engagements, Events, Active Markets, Sampled, Attendance. All the content presented in this PPT design is completely editable. Download it and make adjustments in color, background, font etc. as per your unique business setting.

Data Lineage Implementation Working Process Of Data Lineage System Designs PDF
This slide talks about the working process of the data lineage system, from metadata to final reports or dashboards for non-technical end users. The components include metadata, process, database systems and reports. This Data Lineage Implementation Working Process Of Data Lineage System Designs PDF is perfect for any presentation, be it in front of clients or colleagues. It is a versatile and stylish solution for organizing your meetings. The Data Lineage Implementation Working Process Of Data Lineage System Designs PDF features a modern design for your presentation meetings. The adjustable and customizable slides provide unlimited possibilities for acing up your presentation. Slidegeeks has done all the homework before launching the product for you. So, do not wait, grab the presentation templates today
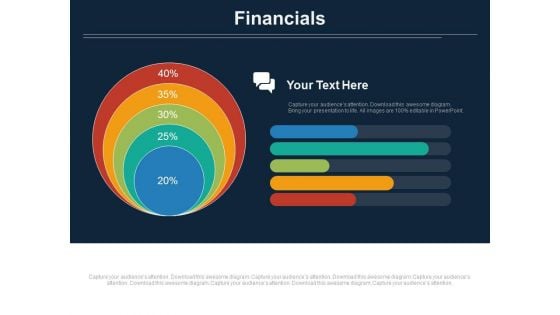
Concentric Chart With Five Financial Steps Powerpoint Slides
This PowerPoint slide contains diagram of concentric chart with five financial steps This professional slide helps to exhibit financial planning for business. Use this PowerPoint template to make impressive presentations.
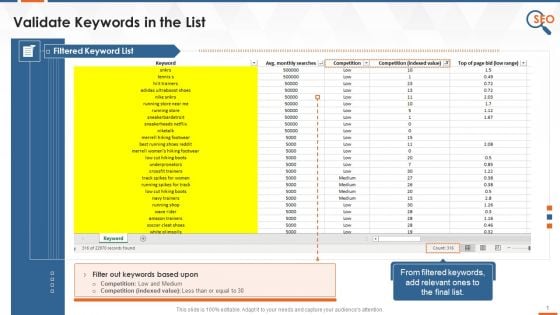
Validated Keywords List In SEO Training Ppt
These slides contain information about how to perform SEO keyword validation using google planner and google trends.
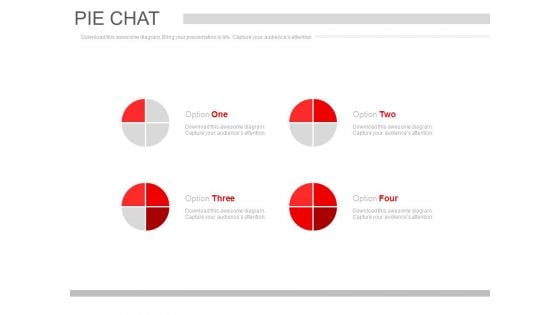
Pie Charts For Market Segmentation Powerpoint Slides
This PowerPoint contains graphics of pie charts. Download this diagram slide to display market segmentations. This template is editable, You can edit text, color, shade and style of this diagram as per you need.
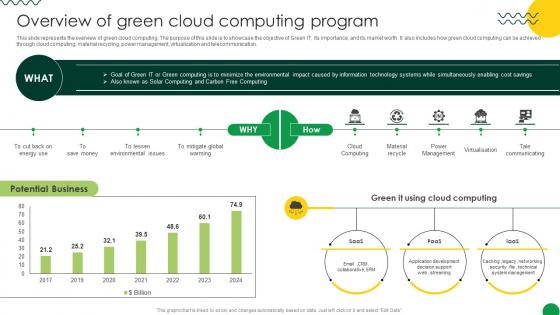
Sustainable Overview Of Green Cloud Computing Program
This slide represents the overview of green cloud computing. The purpose of this slide is to showcase the objective of Green IT, its importance, and its market worth. It also includes how green cloud computing can be achieved through cloud computing, material recycling, power management, virtualization and telecommunication. Slidegeeks is here to make your presentations a breeze with Sustainable Overview Of Green Cloud Computing Program With our easy-to-use and customizable templates, you can focus on delivering your ideas rather than worrying about formatting. With a variety of designs to choose from, you are sure to find one that suits your needs. And with animations and unique photos, illustrations, and fonts, you can make your presentation pop. So whether you are giving a sales pitch or presenting to the board, make sure to check out Slidegeeks first This slide represents the overview of green cloud computing. The purpose of this slide is to showcase the objective of Green IT, its importance, and its market worth. It also includes how green cloud computing can be achieved through cloud computing, material recycling, power management, virtualization and telecommunication.
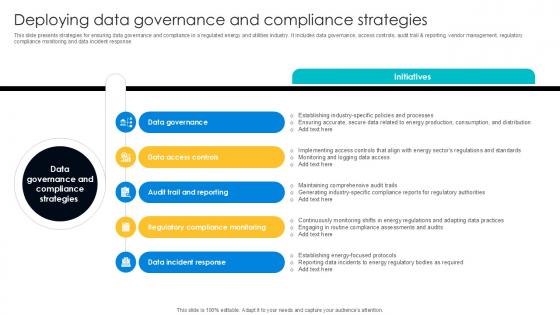
Deploying Data Governance Digital Transformation Journey PPT PowerPoint DT SS V
This slide presents strategies for ensuring data governance and compliance in a regulated energy and utilities industry. It includes data governance, access controls, audit trail and reporting, vendor management, regulatory compliance monitoring and data incident response. This modern and well-arranged Deploying Data Governance Digital Transformation Journey PPT PowerPoint DT SS V provides lots of creative possibilities. It is very simple to customize and edit with the Powerpoint Software. Just drag and drop your pictures into the shapes. All facets of this template can be edited with Powerpoint, no extra software is necessary. Add your own material, put your images in the places assigned for them, adjust the colors, and then you can show your slides to the world, with an animated slide included. This slide presents strategies for ensuring data governance and compliance in a regulated energy and utilities industry. It includes data governance, access controls, audit trail and reporting, vendor management, regulatory compliance monitoring and data incident response.
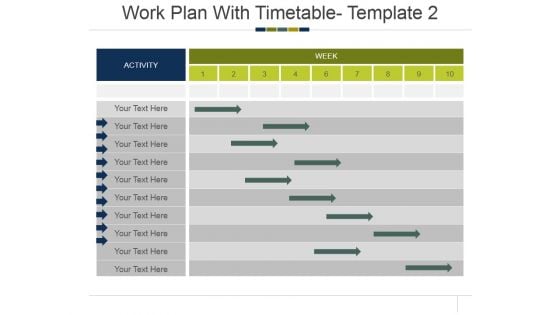
Work Plan With Timetable Template 2 Ppt PowerPoint Presentation Slides Picture
This is a work plan with timetable template 2 ppt powerpoint presentation slides picture. This is a two stage process. The stages in this process are activity, week.
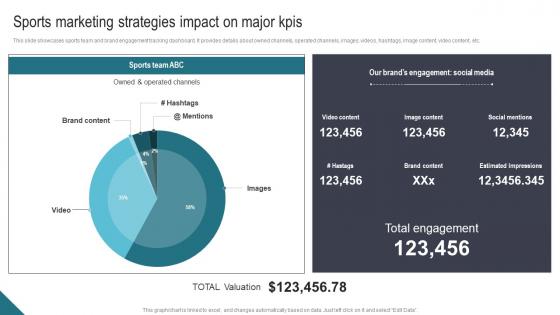
Sports Marketing Strategies Impact On Major KPIs Athletic Activities Advertising Program Graphics Pdf
This slide showcases sports team and brand engagement tracking dashboard. It provides details about owned channels, operated channels, images, videos, hashtags, image content, video content, etc. Do you have an important presentation coming up Are you looking for something that will make your presentation stand out from the rest Look no further than Sports Marketing Strategies Impact On Major KPIs Athletic Activities Advertising Program Graphics Pdf. With our professional designs, you can trust that your presentation will pop and make delivering it a smooth process. And with Slidegeeks, you can trust that your presentation will be unique and memorable. So why wait Grab Sports Marketing Strategies Impact On Major KPIs Athletic Activities Advertising Program Graphics Pdf today and make your presentation stand out from the rest. This slide showcases sports team and brand engagement tracking dashboard. It provides details about owned channels, operated channels, images, videos, hashtags, image content, video content, etc.
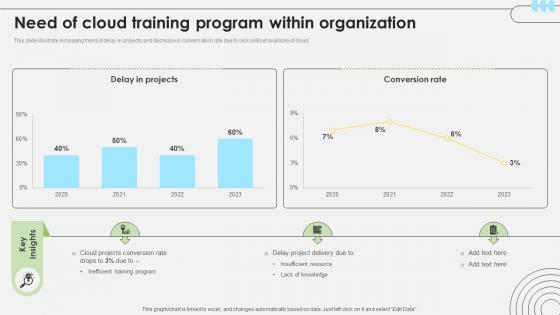
Workforce Competency Enhancement Need Of Cloud Training Program Within Organization DTE SS V
This slide illustrate increasing trend of delay in projects and decrease in conversation rate due to lack skillset available of cloud. The Workforce Competency Enhancement Need Of Cloud Training Program Within Organization DTE SS V is a compilation of the most recent design trends as a series of slides. It is suitable for any subject or industry presentation, containing attractive visuals and photo spots for businesses to clearly express their messages. This template contains a variety of slides for the user to input data, such as structures to contrast two elements, bullet points, and slides for written information. Slidegeeks is prepared to create an impression. This slide illustrate increasing trend of delay in projects and decrease in conversation rate due to lack skillset available of cloud.
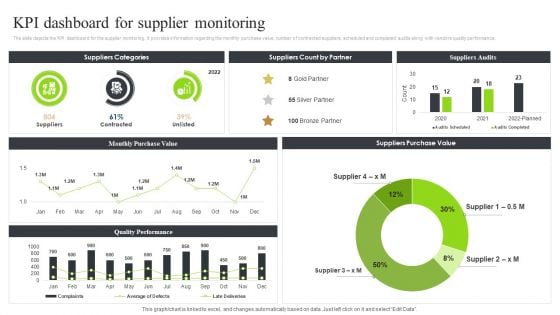
Strategic Sourcing And Supplier Quality Kpi Dashboard For Supplier Monitoring Graphics PDF
The slide depicts the KPI dashboard for the supplier monitoring. It provides information regarding the monthly purchase value, number of contracted suppliers, scheduled and completed audits along with vendors quality performance.Take your projects to the next level with our ultimate collection of Strategic Sourcing And Supplier Quality Kpi Dashboard For Supplier Monitoring Graphics PDF. Slidegeeks has designed a range of layouts that are perfect for representing task or activity duration, keeping track of all your deadlines at a glance. Tailor these designs to your exact needs and give them a truly corporate look with your own brand colors they all make your projects stand out from the rest.
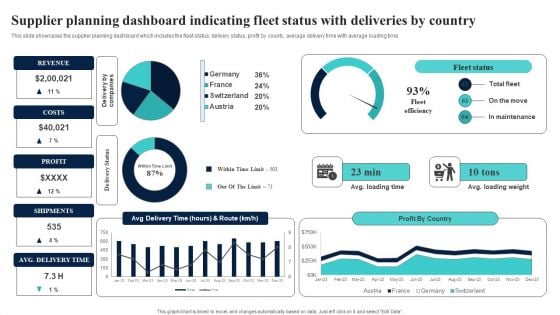
Supplier Planning Dashboard Indicating Fleet Status With Deliveries By Country Microsoft PDF
This slide showcases the supplier planning dashboard which includes the fleet status, delivery status, profit by county, average delivery time with average loading time. This Supplier Planning Dashboard Indicating Fleet Status With Deliveries By Country Microsoft PDF from Slidegeeks makes it easy to present information on your topic with precision. It provides customization options, so you can make changes to the colors, design, graphics, or any other component to create a unique layout. It is also available for immediate download, so you can begin using it right away. Slidegeeks has done good research to ensure that you have everything you need to make your presentation stand out. Make a name out there for a brilliant performance.
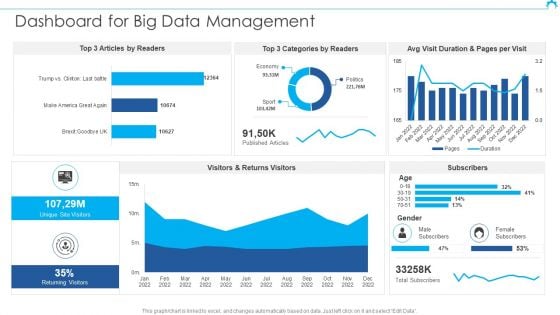
Big Data Architect Dashboard For Big Data Management Brochure PDF
Deliver and pitch your topic in the best possible manner with this Big Data Architect Dashboard For Big Data Management Brochure PDF. Use them to share invaluable insights on Categories Readers, Duration Pages, Returns Visitors and impress your audience. This template can be altered and modified as per your expectations. So, grab it now.
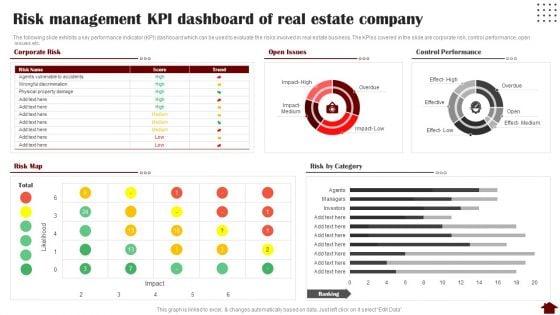
Risk Management KPI Dashboard Of Real Estate Company Rules PDF
The following slide exhibits a key performance indicator KPI dashboard which can be used to evaluate the risks involved in real estate business. The KPIss covered in the slide are corporate risk, control performance, open issues etc. Deliver and pitch your topic in the best possible manner with this Risk Management KPI Dashboard Of Real Estate Company Rules PDF. Use them to share invaluable insights on Risk Management KPI Dashboard, Real Estate Company and impress your audience. This template can be altered and modified as per your expectations. So, grab it now.


 Continue with Email

 Home
Home


