Daily Snapshot
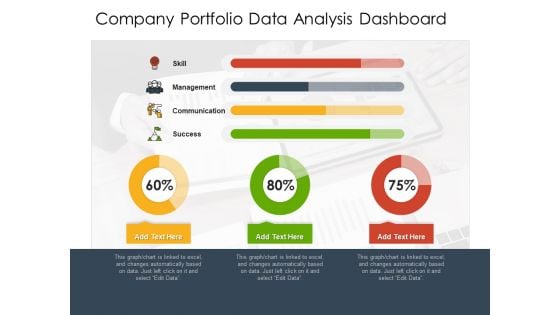
Company Portfolio Data Analysis Dashboard Ppt PowerPoint Presentation File Example Topics PDF
Presenting this set of slides with name company portfolio data analysis dashboard ppt powerpoint presentation file example topics pdf. The topics discussed in these slides are management, communication, success. This is a completely editable PowerPoint presentation and is available for immediate download. Download now and impress your audience.
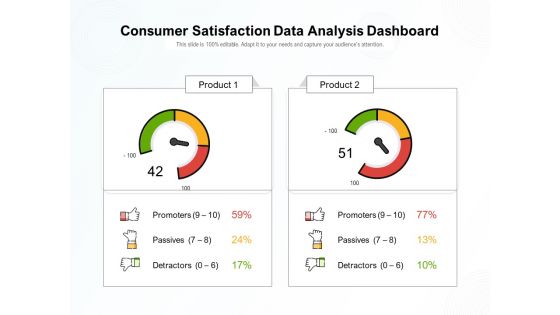
Consumer Satisfaction Data Analysis Dashboard Ppt PowerPoint Presentation Gallery Microsoft PDF
Pitch your topic with ease and precision using this consumer satisfaction data analysis dashboard ppt powerpoint presentation gallery microsoft pdf. This layout presents information on promoters, passives, detractors. It is also available for immediate download and adjustment. So, changes can be made in the color, design, graphics or any other component to create a unique layout.
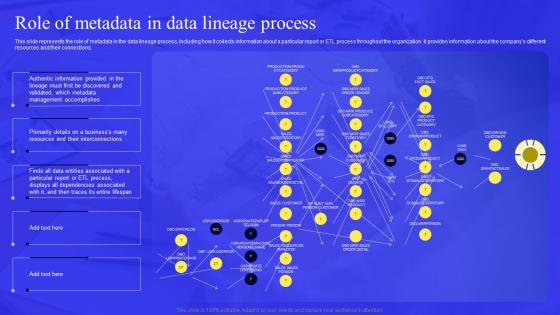
Business Process Data Lineage Role Of Metadata In Data Lineage Process Portrait Pdf
This slide represents the role of metadata in the data lineage process, including how it collects information about a particular report or ETL process throughout the organization. It provides information about the companys different resources and their connections. Do you have an important presentation coming up Are you looking for something that will make your presentation stand out from the rest Look no further than Business Process Data Lineage Role Of Metadata In Data Lineage Process Portrait Pdf. With our professional designs, you can trust that your presentation will pop and make delivering it a smooth process. And with Slidegeeks, you can trust that your presentation will be unique and memorable. So why wait Grab Business Process Data Lineage Role Of Metadata In Data Lineage Process Portrait Pdf today and make your presentation stand out from the rest This slide represents the role of metadata in the data lineage process, including how it collects information about a particular report or ETL process throughout the organization. It provides information about the companys different resources and their connections.
Influencers Marketing Campaign Performance Tracking Dashboard Ppt PowerPoint Presentation Diagram Lists PDF
This slide covers performance monitoring dashboard of influencer based referral marketing program. It includes elements such as impressions on Instagram, likes, comments, clicks, sales generated along with value calculators and campaign breakdown based on gender and age. Formulating a presentation can take up a lot of effort and time, so the content and message should always be the primary focus. The visuals of the PowerPoint can enhance the presenters message, so our Influencers Marketing Campaign Performance Tracking Dashboard Ppt PowerPoint Presentation Diagram Lists PDF was created to help save time. Instead of worrying about the design, the presenter can concentrate on the message while our designers work on creating the ideal templates for whatever situation is needed. Slidegeeks has experts for everything from amazing designs to valuable content, we have put everything into Influencers Marketing Campaign Performance Tracking Dashboard Ppt PowerPoint Presentation Diagram Lists PDF
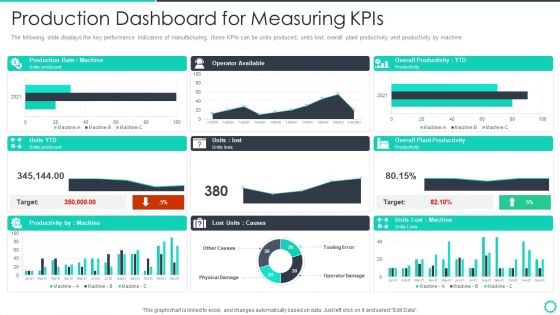
Manufacturing Operation Quality Improvement Practices Tools Templates Production Dashboard For Mockup PDF
The following slide displays the key performance Indicators of manufacturing, these KPIs can be units produced, units lost, overall plant productivity and productivity by machine. Deliver an awe inspiring pitch with this creative manufacturing operation quality improvement practices tools templates production dashboard for mockup pdf bundle. Topics like production dashboard for measuring kpis can be discussed with this completely editable template. It is available for immediate download depending on the needs and requirements of the user.

Advanced Big Data Analytics Framework Developing Strategic Insights Using Big Data Analytics SS V
This slide showcases framework illustrating use of big data analytics in retain industry to improve operational efficiency. It includes elements such as demand forecasting, personalized marketing, price optimization, fraud detection etc. Boost your pitch with our creative Advanced Big Data Analytics Framework Developing Strategic Insights Using Big Data Analytics SS V. Deliver an awe-inspiring pitch that will mesmerize everyone. Using these presentation templates you will surely catch everyones attention. You can browse the ppts collection on our website. We have researchers who are experts at creating the right content for the templates. So you do not have to invest time in any additional work. Just grab the template now and use them. This slide showcases framework illustrating use of big data analytics in retain industry to improve operational efficiency. It includes elements such as demand forecasting, personalized marketing, price optimization, fraud detection etc.
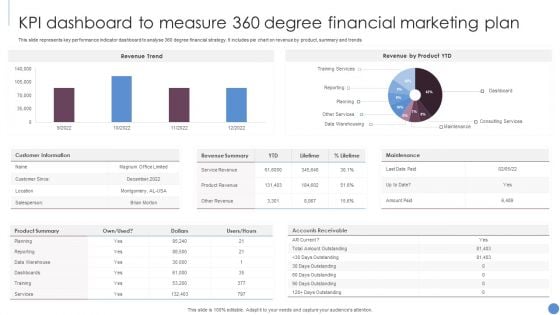
KPI Dashboard To Measure 360 Degree Financial Marketing Plan Slides PDF
This slide represents key performance indicator dashboard to analyse 360 degree financial strategy. It includes pie chart on revenue by product, summary and trends. Showcasing this set of slides titled KPI Dashboard To Measure 360 Degree Financial Marketing Plan Slides PDF. The topics addressed in these templates are Revenue Trend, Revenue Product YTD, Customer Information. All the content presented in this PPT design is completely editable. Download it and make adjustments in color, background, font etc. as per your unique business setting.
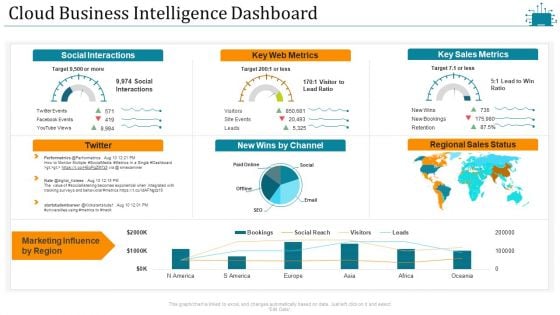
Cloud Intelligence Framework For Application Consumption Cloud Business Intelligence Dashboard Slides PDF
Deliver an awe inspiring pitch with this creative cloud intelligence framework for application consumption cloud business intelligence dashboard slides pdf bundle. Topics like social interactions, key web metrics, key sales metrics, marketing influence by region can be discussed with this completely editable template. It is available for immediate download depending on the needs and requirements of the user.
Employee Performance Tracking And Management Dashboard Pictures PDF
This slide showcases a dashboard presenting various metrics to measure and analyze employee overall performance. It outlines information about average absenteeism rate, yearly average overtime hours, training costs and overall labor effectiveness. Find highly impressive Employee Performance Tracking And Management Dashboard Pictures PDF on Slidegeeks to deliver a meaningful presentation. You can save an ample amount of time using these presentation templates. No need to worry to prepare everything from scratch because Slidegeeks experts have already done a huge research and work for you. You need to download Employee Performance Tracking And Management Dashboard Pictures PDF for your upcoming presentation. All the presentation templates are 100 percent editable and you can change the color and personalize the content accordingly. Download now.
Linear Steps Timeline Chart And Icons Powerpoint Slides
This PowerPoint template graphics of linear timeline steps. Download this PPT chart for yearly business performance analysis. This PowerPoint slide is of great help in the business sector to make realistic presentations and provides effective way of presenting your newer thoughts.
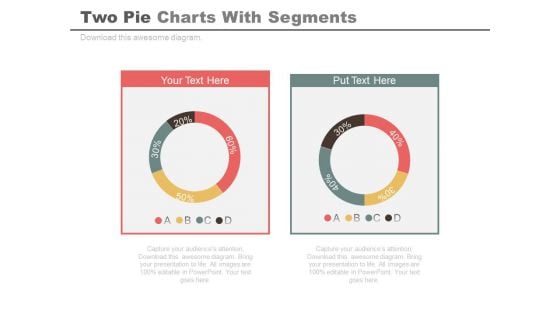
Two Pie Charts For Comparison And Analysis Powerpoint Slides
Develop competitive advantage with our above template of two pie charts. This PowerPoint diagram provides an effective way of displaying business information. You can edit text, color, shade and style as per you need.
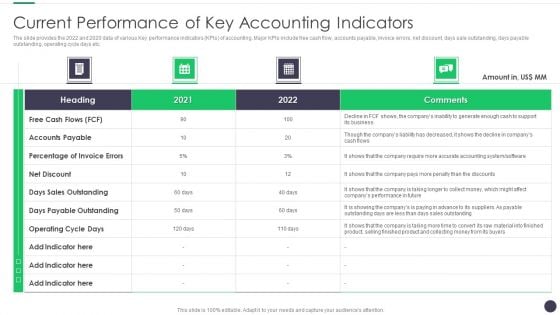
Finance And Accounting Online Conversion Plan Current Performance Of Key Accounting Indicators Template PDF
The slide provides the 2022 and 2020 data of various Key performance indicators KPIs of accounting. Major KPIs include free cash flow, accounts payable, invoice errors, net discount, days sale outstanding, days payable outstanding, operating cycle days etc. Deliver and pitch your topic in the best possible manner with this Finance And Accounting Online Conversion Plan Current Performance Of Key Accounting Indicators Template PDF. Use them to share invaluable insights on Sales Outstanding, Payable Outstanding, Accounts Payable and impress your audience. This template can be altered and modified as per your expectations. So, grab it now.
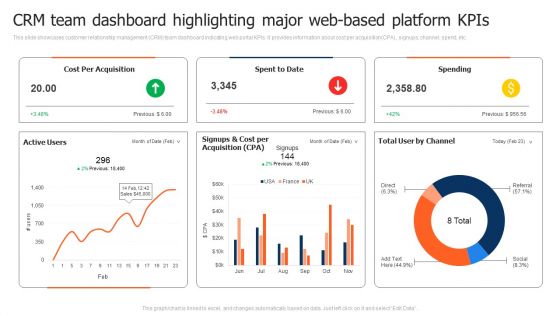
CRM Team Dashboard Highlighting Major Web Based Platform Kpis Template PDF
This slide showcases customer relationship management CRM team dashboard indicating web portal KPIs. It provides information about cost per acquisition CPA, signups, channel, spend, etc. Pitch your topic with ease and precision using this CRM Team Dashboard Highlighting Major Web Based Platform Kpis Template PDF. This layout presents information on CRM Team Dashboard Highlighting, Web Based Platform Kpis. It is also available for immediate download and adjustment. So, changes can be made in the color, design, graphics or any other component to create a unique layout.
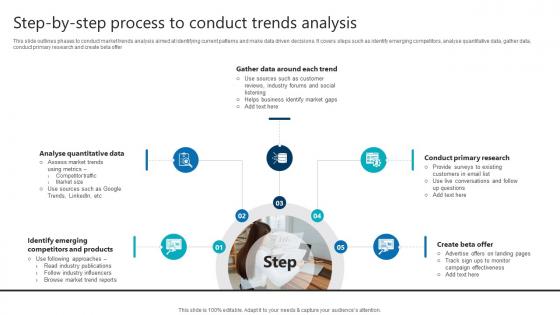
Step By Step Process To Conduct Trends Analysis Product Analytics Implementation Data Analytics V
This slide outlines phases to conduct market trends analysis aimed at identifying current patterns and make data driven decisions. It covers steps such as identify emerging competitors, analyse quantitative data, gather data, conduct primary research and create beta offerComing up with a presentation necessitates that the majority of the effort goes into the content and the message you intend to convey. The visuals of a PowerPoint presentation can only be effective if it supplements and supports the story that is being told. Keeping this in mind our experts created Step By Step Process To Conduct Trends Analysis Product Analytics Implementation Data Analytics V to reduce the time that goes into designing the presentation. This way, you can concentrate on the message while our designers take care of providing you with the right template for the situation. This slide outlines phases to conduct market trends analysis aimed at identifying current patterns and make data driven decisions. It covers steps such as identify emerging competitors, analyse quantitative data, gather data, conduct primary research and create beta offer

Key Metrics To Track Employee Relations Performance Plan To Develop Ppt Template
This slide shows various metrics which can be used by organizations to evaluate employee relations performance of current year. It also contains information regarding previous year key performance indicators. This modern and well-arranged Key Metrics To Track Employee Relations Performance Plan To Develop Ppt Template provides lots of creative possibilities. It is very simple to customize and edit with the Powerpoint Software. Just drag and drop your pictures into the shapes. All facets of this template can be edited with Powerpoint, no extra software is necessary. Add your own material, put your images in the places assigned for them, adjust the colors, and then you can show your slides to the world, with an animated slide included. This slide shows various metrics which can be used by organizations to evaluate employee relations performance of current year. It also contains information regarding previous year key performance indicators.
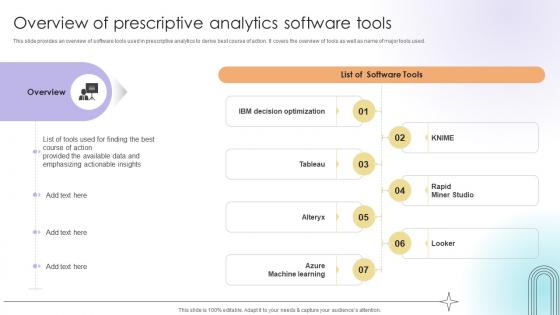
Overview Of Prescriptive Analytics Software Tools Data Analytics SS V
This slide provides an overview of software tools used in prescriptive analytics to derive best course of action. It covers the overview of tools as well as name of major tools used.Formulating a presentation can take up a lot of effort and time, so the content and message should always be the primary focus. The visuals of the PowerPoint can enhance the presenters message, so our Overview Of Prescriptive Analytics Software Tools Data Analytics SS V was created to help save time. Instead of worrying about the design, the presenter can concentrate on the message while our designers work on creating the ideal templates for whatever situation is needed. Slidegeeks has experts for everything from amazing designs to valuable content, we have put everything into Overview Of Prescriptive Analytics Software Tools Data Analytics SS V. This slide provides an overview of software tools used in prescriptive analytics to derive best course of action. It covers the overview of tools as well as name of major tools used.

Combined Strength Of Big Data Analytics Developing Strategic Insights Using Big Data Analytics SS V
This slide showcases benefits of leveraging descriptive, predictive and prescriptive analytics combined to improve business operations. It provides information regarding accurate forecasting, identifying uncertainties, outcome driven recommendations etc. Formulating a presentation can take up a lot of effort and time, so the content and message should always be the primary focus. The visuals of the PowerPoint can enhance the presenters message, so our Combined Strength Of Big Data Analytics Developing Strategic Insights Using Big Data Analytics SS V was created to help save time. Instead of worrying about the design, the presenter can concentrate on the message while our designers work on creating the ideal templates for whatever situation is needed. Slidegeeks has experts for everything from amazing designs to valuable content, we have put everything into Combined Strength Of Big Data Analytics Developing Strategic Insights Using Big Data Analytics SS V This slide showcases benefits of leveraging descriptive, predictive and prescriptive analytics combined to improve business operations. It provides information regarding accurate forecasting, identifying uncertainties, outcome driven recommendations etc.
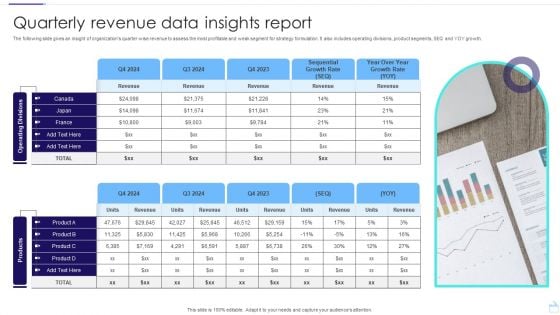
Quarterly Revenue Data Insights Report Template PDF
The following slide gives an insight of organizations quarter wise revenue to assess the most profitable and weak segment for strategy formulation. It also includes operating divisions, product segments, SEQ and YOY growth. Showcasing this set of slides titled Quarterly Revenue Data Insights Report Template PDF. The topics addressed in these templates are Operating, Divisions products, Insights Report. All the content presented in this PPT design is completely editable. Download it and make adjustments in color, background, font etc. as per your unique business setting.
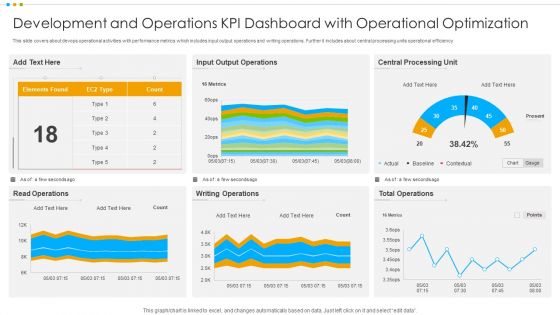
Development And Operations KPI Dashboard With Operational Optimization Pictures PDF
This slide covers about devops operational activities with performance metrics which includes input output operations and writing operations. Further it includes about central processing units operational efficiency.Pitch your topic with ease and precision using this Development And Operations KPI Dashboard With Operational Optimization Pictures PDF This layout presents information on Output Operations, Central Processing, Total Operations It is also available for immediate download and adjustment. So, changes can be made in the color, design, graphics or any other component to create a unique layout.

Infrastructure Supervision Infrastructure Monitoring Dashboard Ppt PowerPoint Presentation File Professional PDF
This slide covers the dashboard which can be used to monitor the server count, geo activity, processor, memory space, network security, etc. Deliver an awe inspiring pitch with this creative Infrastructure Supervision Infrastructure Monitoring Dashboard Ppt PowerPoint Presentation File Professional PDF bundle. Topics like Calendar, Clock, Geo Activity, OS Assessment, Host Pending Reboot, Change Tracking can be discussed with this completely editable template. It is available for immediate download depending on the needs and requirements of the user.
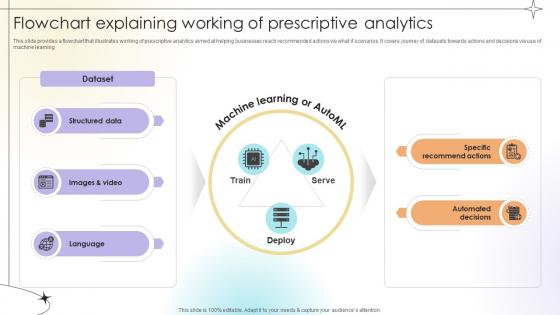
Flowchart Explaining Working Of Prescriptive Analytics Data Analytics SS V
This slide provides a flowchart that illustrates working of prescriptive analytics aimed at helping businesses reach recommended actions via what if scenarios. It covers journey of datasets towards actions and decisions via use of machine learning.This Flowchart Explaining Working Of Prescriptive Analytics Data Analytics SS V from Slidegeeks makes it easy to present information on your topic with precision. It provides customization options, so you can make changes to the colors, design, graphics, or any other component to create a unique layout. It is also available for immediate download, so you can begin using it right away. Slidegeeks has done good research to ensure that you have everything you need to make your presentation stand out. Make a name out there for a brilliant performance. This slide provides a flowchart that illustrates working of prescriptive analytics aimed at helping businesses reach recommended actions via what if scenarios. It covers journey of datasets towards actions and decisions via use of machine learning.
Organizational Competency Workflow Plan Icon Pictures Pdf
Pitch your topic with ease and precision using this Organizational Competency Workflow Plan Icon Pictures Pdf. This layout presents information on Organizational Competency, Workflow Plan Icon. It is also available for immediate download and adjustment. So, changes can be made in the color, design, graphics or any other component to create a unique layout. Our Organizational Competency Workflow Plan Icon Pictures Pdf are topically designed to provide an attractive backdrop to any subject. Use them to look like a presentation pro.
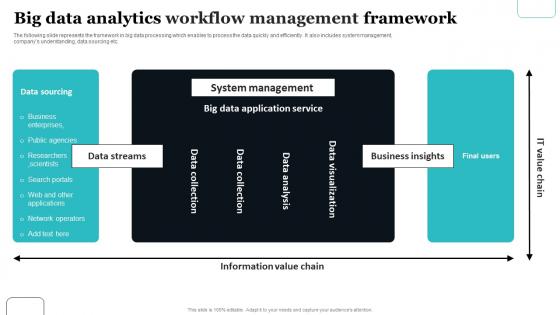
Big Data Analytics Workflow Management Framework Guidelines Pdf
The following slide represents the framework in big data processing which enables to process the data quickly and efficiently. It also includes system management, companys understanding, data sourcing etc. Showcasing this set of slides titled Big Data Analytics Workflow Management Framework Guidelines Pdf The topics addressed in these templates are System Management, Business Insights, Data Streams All the content presented in this PPT design is completely editable. Download it and make adjustments in color, background, font etc. as per your unique business setting. The following slide represents the framework in big data processing which enables to process the data quickly and efficiently. It also includes system management, companys understanding, data sourcing etc.
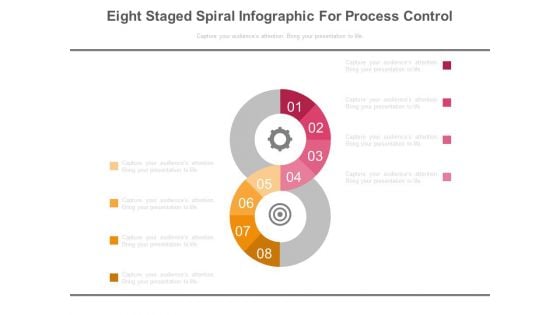
Eight Steps Dashboard Matrics Powerpoint Slides
This PowerPoint template eight number infographic chart. Download this PPT chart to depict target planning. This PowerPoint slide is of great help in the business sector to make realistic presentations and provides effective way of presenting your newer thoughts.
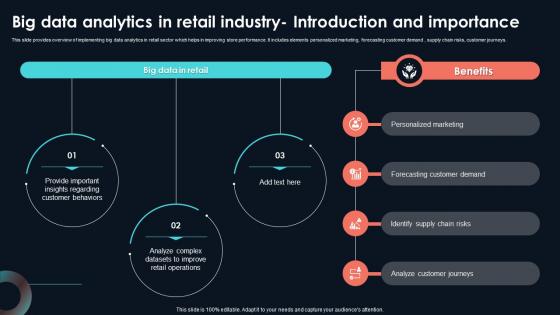
Big Data Analytics In Retail Industry Developing Strategic Insights Using Big Data Analytics SS V
This slide provides overview of implementing big data analytics in retail sector which helps in improving store performance. It includes elements personalized marketing, forecasting customer demand , supply chain risks, customer journeys. Are you in need of a template that can accommodate all of your creative concepts This one is crafted professionally and can be altered to fit any style. Use it with Google Slides or PowerPoint. Include striking photographs, symbols, depictions, and other visuals. Fill, move around, or remove text boxes as desired. Test out color palettes and font mixtures. Edit and save your work, or work with colleagues. Download Big Data Analytics In Retail Industry Developing Strategic Insights Using Big Data Analytics SS V and observe how to make your presentation outstanding. Give an impeccable presentation to your group and make your presentation unforgettable. This slide provides overview of implementing big data analytics in retail sector which helps in improving store performance. It includes elements personalized marketing, forecasting customer demand , supply chain risks, customer journeys.
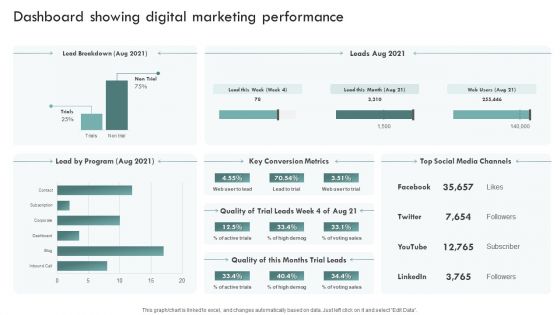
Brand Awareness Plan Dashboard Showing Digital Marketing Performance Sample PDF
This graph or chart is linked to excel, and changes automatically based on data. Just left click on it and select Edit Data. The best PPT templates are a great way to save time, energy, and resources. Slidegeeks have 100 percent editable powerpoint slides making them incredibly versatile. With these quality presentation templates, you can create a captivating and memorable presentation by combining visually appealing slides and effectively communicating your message. Download Brand Awareness Plan Dashboard Showing Digital Marketing Performance Sample PDF from Slidegeeks and deliver a wonderful presentation.
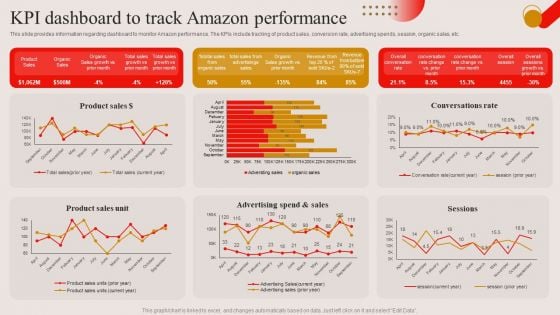
KPI Dashboard To Track Amazon Performance Ppt PowerPoint Presentation Diagram Lists PDF
This slide provides information regarding dashboard to monitor Amazon performance. The KPIs include tracking of product sales, conversion rate, advertising spends, session, organic sales, etc. Explore a selection of the finest KPI Dashboard To Track Amazon Performance Ppt PowerPoint Presentation Diagram Lists PDF here. With a plethora of professionally designed and pre made slide templates, you can quickly and easily find the right one for your upcoming presentation. You can use our KPI Dashboard To Track Amazon Performance Ppt PowerPoint Presentation Diagram Lists PDF to effectively convey your message to a wider audience. Slidegeeks has done a lot of research before preparing these presentation templates. The content can be personalized and the slides are highly editable. Grab templates today from Slidegeeks.
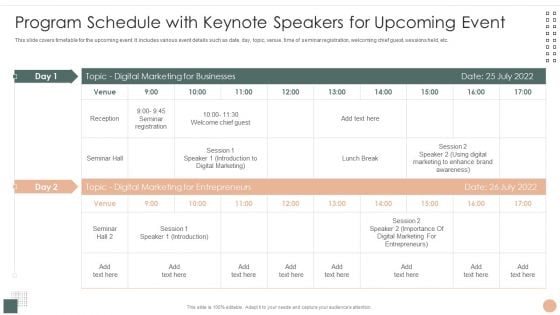
Effective Company Event Communication Tactics Program Schedule With Keynote Speakers For Upcoming Event Pictures PDF
This slide covers timetable for the upcoming event. It includes various event details such as date, day, topic, venue, time of seminar registration, welcoming chief guest, sessions held, etc. Deliver an awe inspiring pitch with this creative Effective Company Event Communication Tactics Program Schedule With Keynote Speakers For Upcoming Event Pictures PDF bundle. Topics like Organization Discounted, Remind Attendees, Continue Sending can be discussed with this completely editable template. It is available for immediate download depending on the needs and requirements of the user.
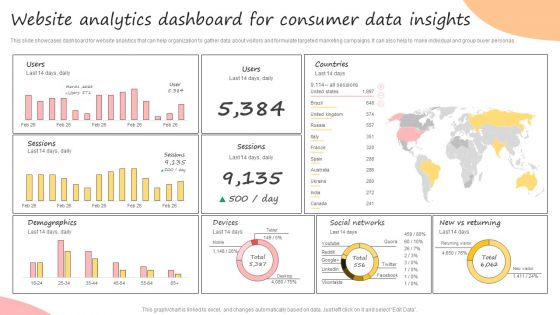
Developing Promotional Strategic Plan For Online Marketing Website Analytics Dashboard For Consumer Summary PDF
This slide showcases dashboard for website analytics that can help organization to gather data about visitors and formulate targeted marketing campaigns. It can also help to make individual and group buyer personas. Are you in need of a template that can accommodate all of your creative concepts This one is crafted professionally and can be altered to fit any style. Use it with Google Slides or PowerPoint. Include striking photographs, symbols, depictions, and other visuals. Fill, move around, or remove text boxes as desired. Test out color palettes and font mixtures. Edit and save your work, or work with colleagues. Download Developing Promotional Strategic Plan For Online Marketing Website Analytics Dashboard For Consumer Summary PDF and observe how to make your presentation outstanding. Give an impeccable presentation to your group and make your presentation unforgettable.
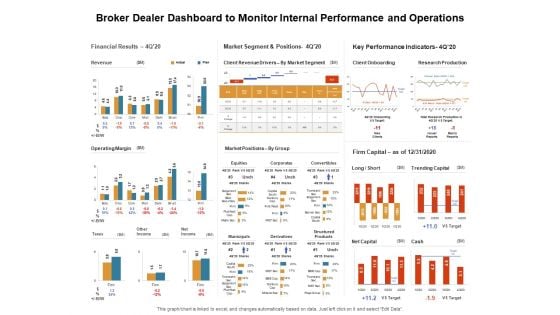
Venture Capitalist Control Board Broker Dealer Dashboard To Monitor Internal Performance And Operations Information PDF
Presenting this set of slides with name venture capitalist control board broker dealer dashboard to monitor internal performance and operations information pdf. The topics discussed in these slides are financial results, market segment and positions, key performance indicators. This is a completely editable PowerPoint presentation and is available for immediate download. Download now and impress your audience.
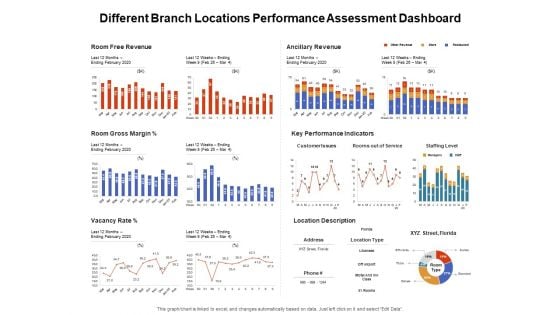
Venture Capitalist Control Board Different Branch Locations Performance Assessment Dashboard Graphics PDF
Presenting this set of slides with name venture capitalist control board different branch locations performance assessment dashboard graphics pdf. The topics discussed in these slides are room free revenue, ancillary revenue, key performance indicators, room gross margin, location description, vacancy rate. This is a completely editable PowerPoint presentation and is available for immediate download. Download now and impress your audience.
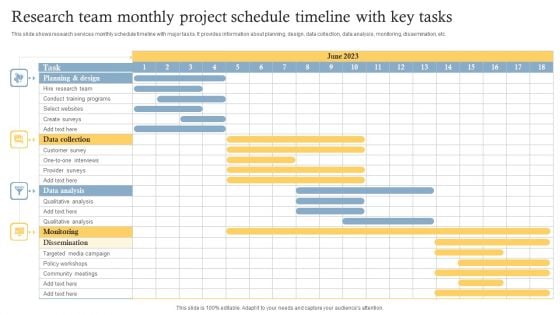
Research Team Monthly Project Schedule Timeline With Key Tasks Ideas PDF
This slide shows research services monthly schedule timeline with major tasks. It provides information about planning, design, data collection, data analysis, monitoring, dissemination, etc. Showcasing this set of slides titled Research Team Monthly Project Schedule Timeline With Key Tasks Ideas PDF. The topics addressed in these templates are Data Collection, Data Analysis, Monitoring. All the content presented in this PPT design is completely editable. Download it and make adjustments in color, background, font etc. as per your unique business setting.
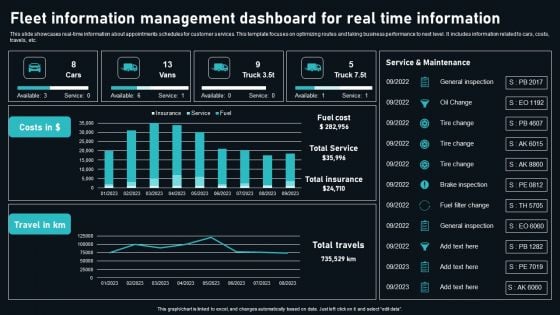
Fleet Information Management Dashboard For Real Time Information Graphics PDF
This slide showcases real time information about appointments schedules for customer services. This template focuses on optimizing routes and taking business performance to next level. It includes information related to cars, costs, travels, etc. Pitch your topic with ease and precision using this Fleet Information Management Dashboard For Real Time Information Graphics PDF. This layout presents information on General Inspection, Oil Change, Tire Change. It is also available for immediate download and adjustment. So, changes can be made in the color, design, graphics or any other component to create a unique layout.

Scientific Computing IT Dashboard For Computational Science Program Ideas PDF
This slide represents the dashboard for the computational science program, including details of fee status, students status, faculty, total expenses, fee invoice, and students attendance.Deliver an awe inspiring pitch with this creative scientific computing it dashboard for computational science program ideas pdf bundle. Topics like dashboard for computational science program can be discussed with this completely editable template. It is available for immediate download depending on the needs and requirements of the user.
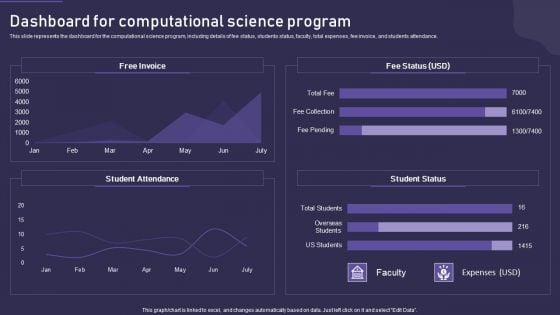
Computational Science Methodology Dashboard For Computational Science Program Structure PDF
This slide represents the dashboard for the computational science program, including details of fee status, students status, faculty, total expenses, fee invoice, and students attendance. Deliver an awe inspiring pitch with this creative Computational Science Methodology Dashboard For Computational Science Program Structure PDF bundle. Topics like Dashboard, Computational Science Program can be discussed with this completely editable template. It is available for immediate download depending on the needs and requirements of the user.
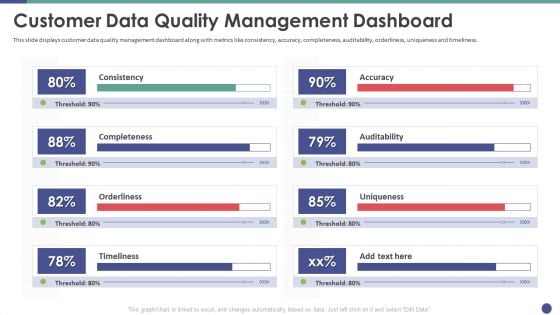
QC Engineering Customer Data Quality Management Dashboard Ppt Infographic Template Guide PDF
This slide displays customer data quality management dashboard along with metrics like consistency, accuracy, completeness, auditability, orderliness, uniqueness and timeliness. Deliver an awe inspiring pitch with this creative qc engineering customer data quality management dashboard ppt infographic template guide pdf bundle. Topics like auditability, timeliness, orderliness, completeness, consistency can be discussed with this completely editable template. It is available for immediate download depending on the needs and requirements of the user.
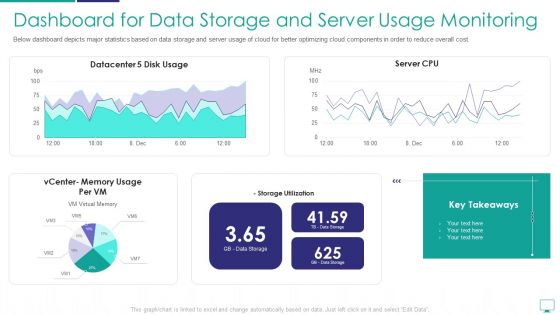
Dashboard For Data Storage And Server Usage Monitoring Mockup PDF
Below dashboard depicts major statistics based on data storage and server usage of cloud for better optimizing cloud components in order to reduce overall cost.Deliver an awe inspiring pitch with this creative dashboard for data storage and server usage monitoring mockup pdf bundle. Topics like dashboard for data storage and server usage monitoring can be discussed with this completely editable template. It is available for immediate download depending on the needs and requirements of the user.
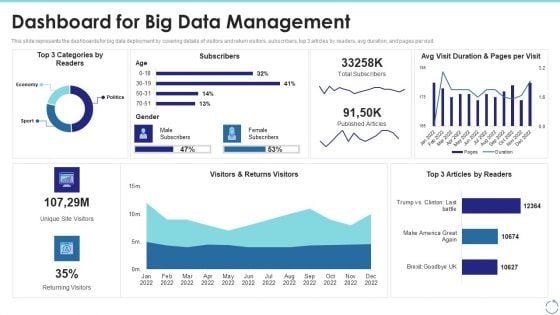
Dashboard For Big Data Management Ppt Outline Elements PDF
This slide represents the dashboards for big data deployment by covering details of visitors and return visitors, subscribers, top 3 articles by readers, avg duration, and pages per visit. Deliver an awe inspiring pitch with this creative dashboard for big data management ppt outline elements pdf bundle. Topics like dashboard for big data management can be discussed with this completely editable template. It is available for immediate download depending on the needs and requirements of the user.
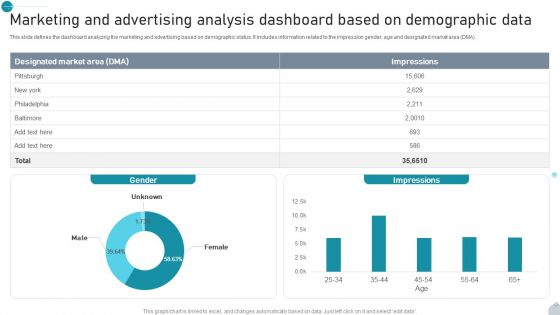
Marketing And Advertising Analysis Dashboard Based On Demographic Data Demonstration PDF
This slide defines the dashboard analyzing the marketing and advertising based on demographic status. It includes information related to the impression gender, age and designated market area DMA. Showcasing this set of slides titled Marketing And Advertising Analysis Dashboard Based On Demographic Data Demonstration PDF. The topics addressed in these templates are Gender, Impressions, Demographic Data All the content presented in this PPT design is completely editable. Download it and make adjustments in color, background, font etc. as per your unique business setting.
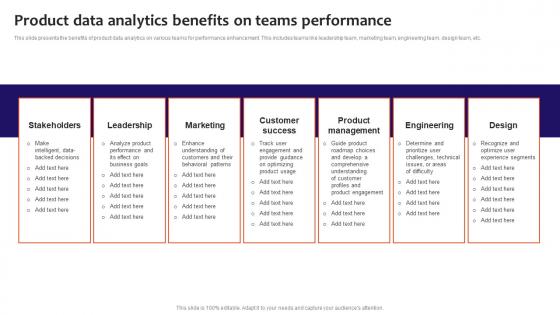
Product Data Analytics Benefits On Teams Performance Mockup Pdf
This slide presents the benefits of product data analytics on various teams for performance enhancement. This includes teams like leadership team, marketing team, engineering team, design team, etc. Pitch your topic with ease and precision using this Product Data Analytics Benefits On Teams Performance Mockup Pdf. This layout presents information on Leadership, Marketing, Customer Success. It is also available for immediate download and adjustment. So, changes can be made in the color, design, graphics or any other component to create a unique layout. This slide presents the benefits of product data analytics on various teams for performance enhancement. This includes teams like leadership team, marketing team, engineering team, design team, etc.
Icon Showing Data Insights At Edge Analytics Demonstration Pdf
Pitch your topic with ease and precision using this Icon Showing Data Insights At Edge Analytics Demonstration Pdf This layout presents information on Icon Showing, Data Insights, Edge Analytics It is also available for immediate download and adjustment. So, changes can be made in the color, design, graphics or any other component to create a unique layout. Our Icon Showing Data Insights At Edge Analytics Demonstration Pdf are topically designed to provide an attractive backdrop to any subject. Use them to look like a presentation pro.
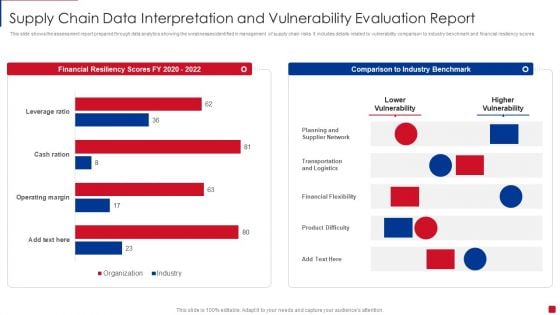
Supply Chain Data Interpretation And Vulnerability Evaluation Report Pictures PDF
This slide shows the assessment report prepared through data analytics showing the weaknesses identified in management of supply chain risks. It includes details related to vulnerability comparison to industry benchmark and financial resiliency scores Showcasing this set of slides titled Supply Chain Data Interpretation And Vulnerability Evaluation Report Pictures PDF. The topics addressed in these templates are Planning And Supplier Network, Transportation And Logistics, Financial Flexibility. All the content presented in this PPT design is completely editable. Download it and make adjustments in color, background, font etc. as per your unique business setting.
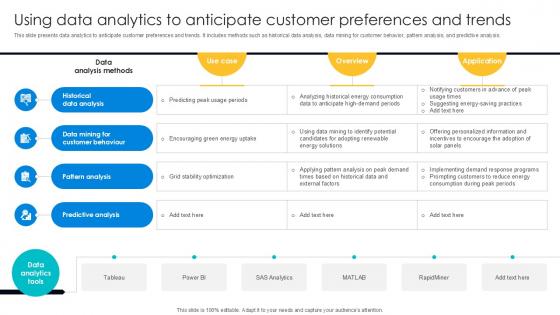
Using Data Analytics To Anticipate Digital Transformation Journey PPT PowerPoint DT SS V
This slide presents data analytics to anticipate customer preferences and trends. It includes methods such as historical data analysis, data mining for customer behavior, pattern analysis, and predictive analysis. Here you can discover an assortment of the finest PowerPoint and Google Slides templates. With these templates, you can create presentations for a variety of purposes while simultaneously providing your audience with an eye-catching visual experience. Download Historical Data Analysis, Data Mining For Customer Behaviour, Pattern Analysis to deliver an impeccable presentation. These templates will make your job of preparing presentations much quicker, yet still, maintain a high level of quality. Slidegeeks has experienced researchers who prepare these templates and write high-quality content for you. Later on, you can personalize the content by editing the Historical Data Analysis, Data Mining For Customer Behaviour, Pattern Analysis. This slide presents data analytics to anticipate customer preferences and trends. It includes methods such as historical data analysis, data mining for customer behavior, pattern analysis, and predictive analysis.
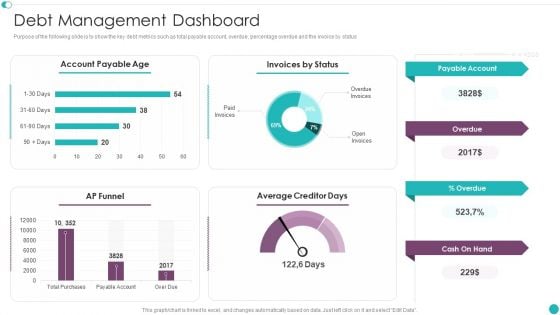
Credit Management And Recovery Policies Debt Management Dashboard Sample PDF
Purpose of the following slide is to show the key debt metrics such as total payable account, overdue, percentage overdue and the invoice by status. Deliver and pitch your topic in the best possible manner with this Credit Management And Recovery Policies Debt Management Dashboard Sample PDF. Use them to share invaluable insights on Account Payable, Invoices Status, Payable Account and impress your audience. This template can be altered and modified as per your expectations. So, grab it now.
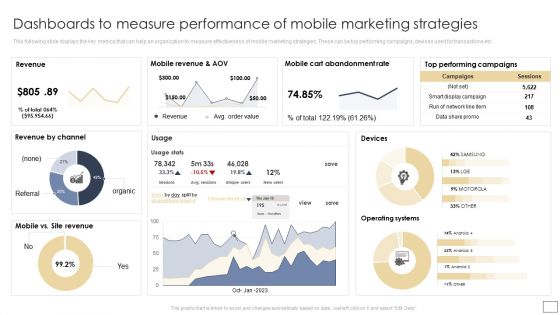
Dashboards To Measure Performance Of Mobile Marketing Strategies Graphics PDF
This following slide displays the key metrics that can help an organization to measure effectiveness of mobile marketing strategies. These can be top performing campaigns, devises used for transactions etc. There are so many reasons you need a Dashboards To Measure Performance Of Mobile Marketing Strategies Graphics PDF. The first reason is you can not spend time making everything from scratch, Thus, Slidegeeks has made presentation templates for you too. You can easily download these templates from our website easily.
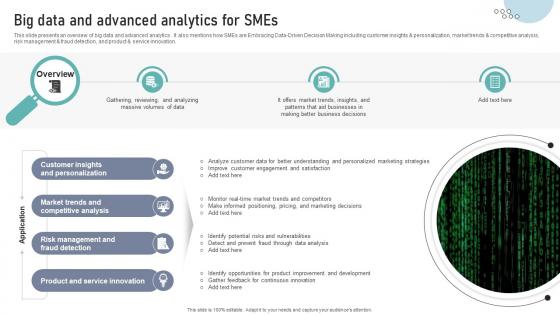
Big Data And Advanced Analytics For SMEs DT SS V
This slide presents an overview of big data and advanced analytics . It also mentions how SMEs are Embracing Data-Driven Decision Making including customer insights and personalization, market trends and competitive analysis, risk management and fraud detection, and product and service innovation.Get a simple yet stunning designed Big Data And Advanced Analytics For SMEs DT SS V. It is the best one to establish the tone in your meetings. It is an excellent way to make your presentations highly effective. So, download this PPT today from Slidegeeks and see the positive impacts. Our easy-to-edit Big Data And Advanced Analytics For SMEs DT SS V can be your go-to option for all upcoming conferences and meetings. So, what are you waiting for Grab this template today. This slide presents an overview of big data and advanced analytics . It also mentions how SMEs are Embracing Data-Driven Decision Making including customer insights and personalization, market trends and competitive analysis, risk management and fraud detection, and product and service innovation.
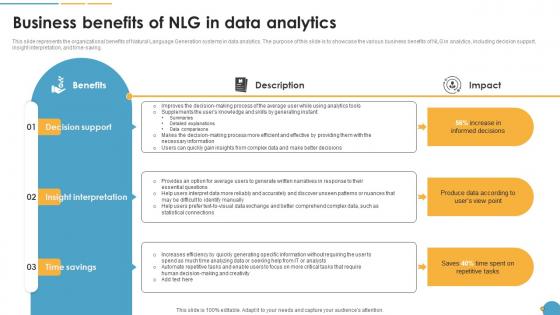
Business Benefits Of NLG In Data Analytics Natural Language Automation
This slide represents the organizational benefits of Natural Language Generation systems in data analytics. The purpose of this slide is to showcase the various business benefits of NLG in analytics, including decision support, insight interpretation, and time-saving. From laying roadmaps to briefing everything in detail, our templates are perfect for you. You can set the stage with your presentation slides. All you have to do is download these easy-to-edit and customizable templates. Business Benefits Of NLG In Data Analytics Natural Language Automation will help you deliver an outstanding performance that everyone would remember and praise you for. Do download this presentation today. This slide represents the organizational benefits of Natural Language Generation systems in data analytics. The purpose of this slide is to showcase the various business benefits of NLG in analytics, including decision support, insight interpretation, and time-saving.

Implementing Succession Planning HR Performance Management Dashboard Microsoft PDF
This graph or chart is linked to excel, and changes automatically based on data. Just left click on it and select Edit Data. Find highly impressive Implementing Succession Planning HR Performance Management Dashboard Microsoft PDF on Slidegeeks to deliver a meaningful presentation. You can save an ample amount of time using these presentation templates. No need to worry to prepare everything from scratch because Slidegeeks experts have already done a huge research and work for you. You need to download Implementing Succession Planning HR Performance Management Dashboard Microsoft PDF for your upcoming presentation. All the presentation templates are 100 percent editable and you can change the color and personalize the content accordingly. Download now.
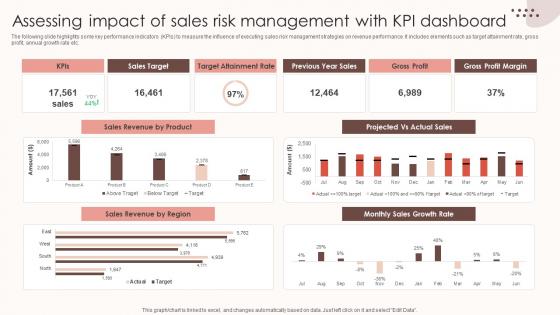
Assessing Sales Risks Assessing Impact Of Sales Risk Management With Kpi Dashboard Topics PDF
The following slide highlights some key performance indicators KPIs to measure the influence of executing sales risk management strategies on revenue performance. It includes elements such as target attainment rate, gross profit, annual growth rate etc. Create an editable Assessing Sales Risks Assessing Impact Of Sales Risk Management With Kpi Dashboard Topics PDF that communicates your idea and engages your audience. Whether you are presenting a business or an educational presentation, pre-designed presentation templates help save time. Assessing Sales Risks Assessing Impact Of Sales Risk Management With Kpi Dashboard Topics PDF is highly customizable and very easy to edit, covering many different styles from creative to business presentations. Slidegeeks has creative team members who have crafted amazing templates. So, go and get them without any delay. The following slide highlights some key performance indicators KPIs to measure the influence of executing sales risk management strategies on revenue performance. It includes elements such as target attainment rate, gross profit, annual growth rate etc.
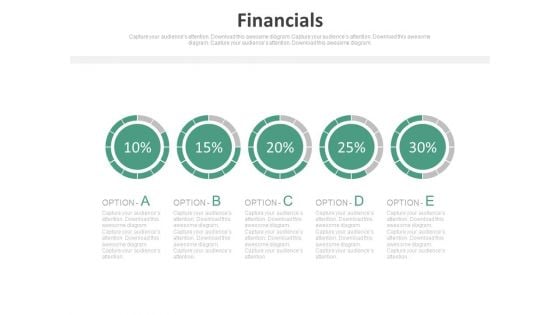
Pie Charts For Percentage Value Analysis Powerpoint Slides
Our above PPT slide displays graphics of Pie charts. This PowerPoint template may be used to display percentage value analysis. Download this template to leave permanent impression on your audience.
Icon For Sales Representative Individual Marketing Plan Pictures Pdf
Showcasing this set of slides titled Icon For Sales Representative Individual Marketing Plan Pictures Pdf. The topics addressed in these templates are Sales Representative, Individual Marketing Plan. All the content presented in this PPT design is completely editable. Download it and make adjustments in color, background, font etc. as per your unique business setting. Our Icon For Sales Representative Individual Marketing Plan Pictures Pdf are topically designed to provide an attractive backdrop to any subject. Use them to look like a presentation pro.
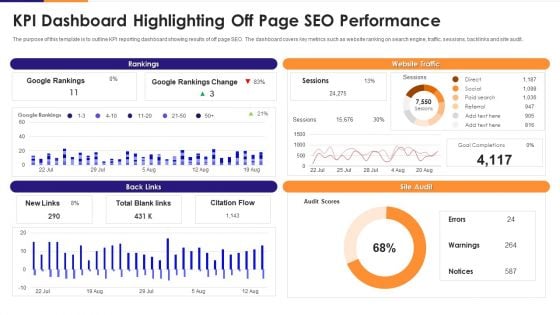
KPI Dashboard Highlighting Off Page Seo Performance Rules PDF
The purpose of this template is to outline KPI reporting dashboard showing results of off page SEO. The dashboard covers key metrics such as website ranking on search engine, traffic, sessions, backlinks and site audit. Showcasing this set of slides titled kpi dashboard highlighting off page seo performance rules pdf. The topics addressed in these templates are kpi dashboard highlighting off page seo performance. All the content presented in this PPT design is completely editable. Download it and make adjustments in color, background, font etc. as per your unique business setting.
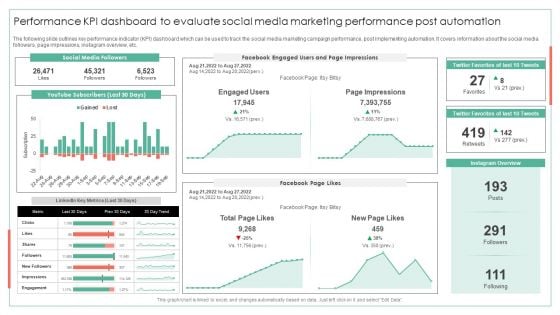
Performance KPI Dashboard To Evaluate Social Media Marketing Performance Post Automation Ideas PDF
The following slide outlines key performance indicator KPI dashboard which can be used to track the social media marketing campaign performance, post implementing automation. It covers information about the social media followers, page impressions, instagram overview, etc.Deliver an awe inspiring pitch with this creative Performance KPI Dashboard To Evaluate Social Media Marketing Performance Post Automation Ideas PDF bundle. Topics like Page Impressions, Twitter Favorites, Instagram Overview can be discussed with this completely editable template. It is available for immediate download depending on the needs and requirements of the user.

Business Diagram Data Driven Bar Graph And Pie Chart For Analysis PowerPoint Slide
This PowerPoint template displays technology gadgets with various business charts. Use this diagram slide, in your presentations to make business reports for statistical analysis. You may use this diagram to impart professional appearance to your presentations.
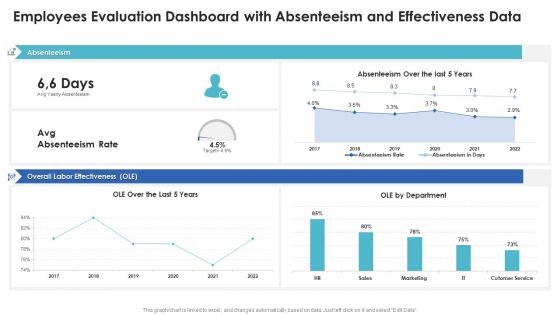
Employees Evaluation Dashboard With Absenteeism And Effectiveness Data Template PDF
Showcasing this set of slides titled employees evaluation dashboard with absenteeism and effectiveness data template pdf. The topics addressed in these templates are employees evaluation dashboard with absenteeism and effectiveness data. All the content presented in this PPT design is completely editable. Download it and make adjustments in color, background, font etc. as per your unique business setting.
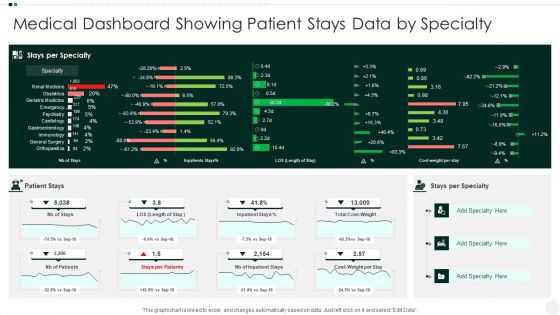
Medical Dashboard Showing Patient Stays Data By Specialty Ideas PDF
Showcasing this set of slides titled Medical Dashboard Showing Patient Stays Data By Specialty Ideas PDF. The topics addressed in these templates are Medical Dashboard Showing Patient Stays Data By Specialty. All the content presented in this PPT design is completely editable. Download it and make adjustments in color, background, font etc. as per your unique business setting.
Business Project Scheduling Calendar To Launch New Product Icons PDF
This slide shows calendar which can be used by organization in planning product launch calendar. It includes brainstorming, brochure preparation, develop kpis, write scripts. Etc. Pitch your topic with ease and precision using this Business Project Scheduling Calendar To Launch New Product Icons PDF. This layout presents information on Business Project Scheduling, Calendar To Launch, New Product. It is also available for immediate download and adjustment. So, changes can be made in the color, design, graphics or any other component to create a unique layout.
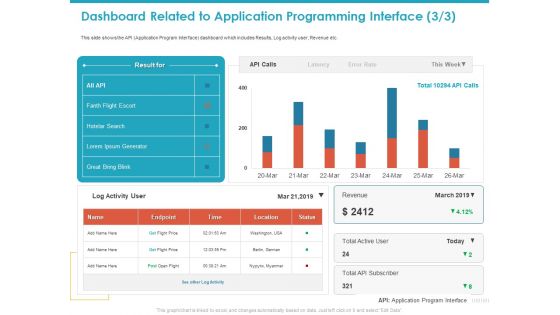
Dashboard Related To Application Programming Interface Status Slides PDF
This slide shows the API Application Program Interface dashboard which includes Results, Log activity user, Revenue etc. Deliver an awe-inspiring pitch with this creative dashboard related to application programming interface status slides pdf bundle. Topics like revenue, location, status, endpoint, time can be discussed with this completely editable template. It is available for immediate download depending on the needs and requirements of the user.
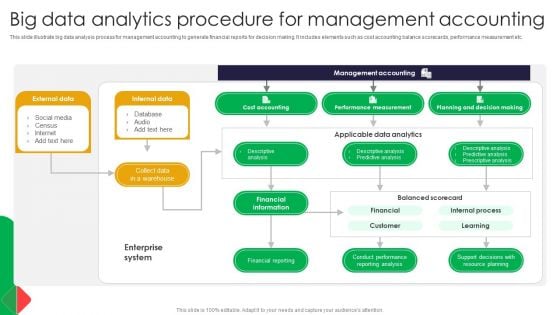
Big Data Analytics Procedure For Management Accounting Formats PDF
This slide illustrate big data analysis process for management accounting to generate financial reports for decision making. It includes elements such as cost accounting balance scorecards, performance measurement etc. Showcasing this set of slides titled Big Data Analytics Procedure For Management Accounting Formats PDF. The topics addressed in these templates are Accounting, Internal Data, Social Media. All the content presented in this PPT design is completely editable. Download it and make adjustments in color, background, font etc. as per your unique business setting.
Icon Showing Five Year Professional Development Plan Pictures Pdf
Pitch your topic with ease and precision using this Icon Showing Five Year Professional Development Plan Pictures Pdf. This layout presents information on Icon Showing Five Year, Professional Development Plan. It is also available for immediate download and adjustment. So, changes can be made in the color, design, graphics or any other component to create a unique layout. Our Icon Showing Five Year Professional Development Plan Pictures Pdf are topically designed to provide an attractive backdrop to any subject. Use them to look like a presentation pro.


 Continue with Email

 Home
Home


