Dashboard
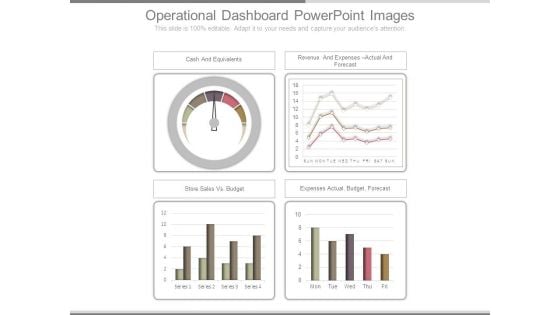
Operational Dashboard Powerpoint Images
This is a operational dashboard powerpoint images. This is a four stage process. The stages in this process are cash and equivalents, revenue and expenses actual and forecast, store sales vs budget, expenses actual budget forecast.
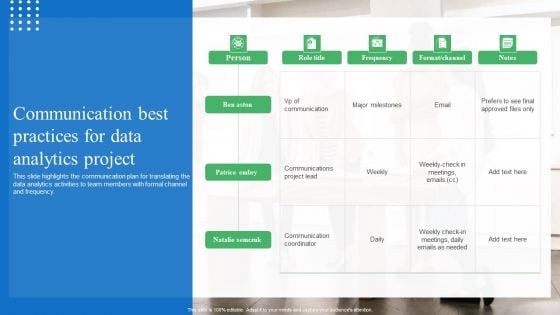
Toolkit For Data Science And Analytics Transition Communication Best Practices For Data Analytics Project Summary PDF
This slide highlights the communication plan for translating the data analytics activities to team members with formal channel and frequency. Do you know about Slidesgeeks Toolkit For Data Science And Analytics Transition Communication Best Practices For Data Analytics Project Summary PDF These are perfect for delivering any kind od presentation. Using it, create PowerPoint presentations that communicate your ideas and engage audiences. Save time and effort by using our pre designed presentation templates that are perfect for a wide range of topic. Our vast selection of designs covers a range of styles, from creative to business, and are all highly customizable and easy to edit. Download as a PowerPoint template or use them as Google Slides themes.
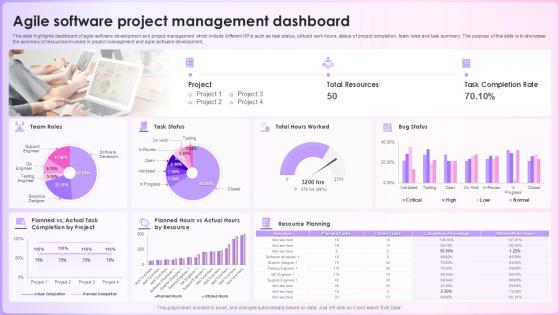
Agile Software Project Management Dashboard
Create an editable Agile Software Project Management Dashboard that communicates your idea and engages your audience. Whether you are presenting a business or an educational presentation, pre-designed presentation templates help save time. Agile Software Project Management Dashboard is highly customizable and very easy to edit, covering many different styles from creative to business presentations. Slidegeeks has creative team members who have crafted amazing templates. So, go and get them without any delay. This slide illustrates dashboard of agile software development and project management which include different KPIs such as task status, utilized work hours, status of project completion, team roles and task summary.
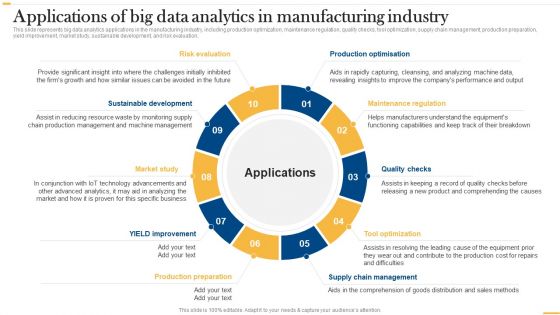
Deploying AI To Enhance Applications Of Big Data Analytics In Manufacturing Graphics PDF
This slide represents big data analytics applications in the manufacturing industry, including production optimization, maintenance regulation, quality checks, tool optimization, supply chain management, production preparation, yield improvement, market study, sustainable development, and risk evaluation. Slidegeeks is one of the best resources for PowerPoint templates. You can download easily and regulate Deploying AI To Enhance Applications Of Big Data Analytics In Manufacturing Graphics PDF for your personal presentations from our wonderful collection. A few clicks is all it takes to discover and get the most relevant and appropriate templates. Use our Templates to add a unique zing and appeal to your presentation and meetings. All the slides are easy to edit and you can use them even for advertisement purposes.
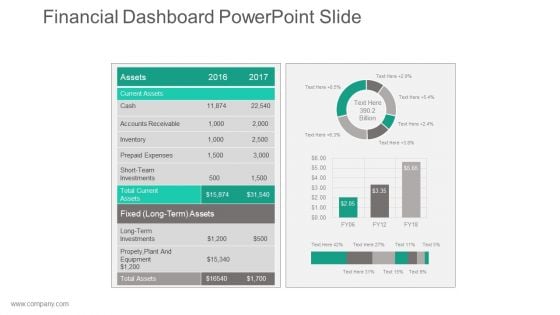
Financial Dashboard Powerpoint Slide
This is a financial dashboard powerpoint slide. This is a two stage process. The stages in this process are current assets, accounts receivable, prepaid expenses, short team investments.
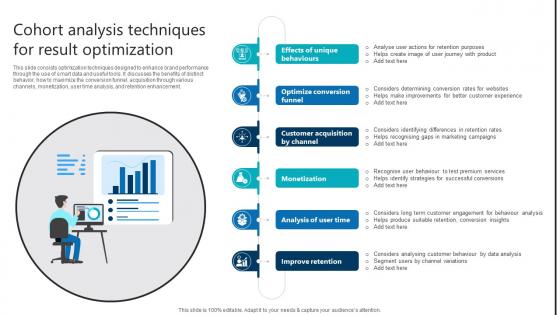
Cohort Analysis Techniques For Result Optimization Product Analytics Implementation Data Analytics V
This slide consists optimization techniques designed to enhance brand performance through the use of smart data and useful tools. It discusses the benefits of distinct behavior, how to maximize the conversion funnel, acquisition through various channels, monetization, user time analysis, and retention enhancement. Whether you have daily or monthly meetings, a brilliant presentation is necessary. Cohort Analysis Techniques For Result Optimization Product Analytics Implementation Data Analytics V can be your best option for delivering a presentation. Represent everything in detail using Cohort Analysis Techniques For Result Optimization Product Analytics Implementation Data Analytics V and make yourself stand out in meetings. The template is versatile and follows a structure that will cater to your requirements. All the templates prepared by Slidegeeks are easy to download and edit. Our research experts have taken care of the corporate themes as well. So, give it a try and see the results. This slide consists optimization techniques designed to enhance brand performance through the use of smart data and useful tools. It discusses the benefits of distinct behavior, how to maximize the conversion funnel, acquisition through various channels, monetization, user time analysis, and retention enhancement.
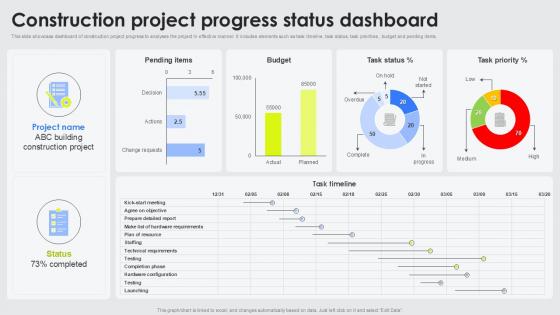
Construction Project Progress Status Dashboard
Create an editable Construction Project Progress Status Dashboard that communicates your idea and engages your audience. Whether you are presenting a business or an educational presentation, pre-designed presentation templates help save time. Construction Project Progress Status Dashboard is highly customizable and very easy to edit, covering many different styles from creative to business presentations. Slidegeeks has creative team members who have crafted amazing templates. So, go and get them without any delay. Our construction project progress status dashboard PowerPoint template covers detailed and efficient tool to analyze project performance. This slide showcases a comprehensive dashboard that includes details such as task timelines, task status, priorities, budget details,etc. It allows project managers and construction teams to effectively track and manage project milestones. This deck helps stakeholders to make informed decisions and effectively monitor progress. Improve your project presentations with our SEO-friendly and visually appealing progress tracking dashboard.
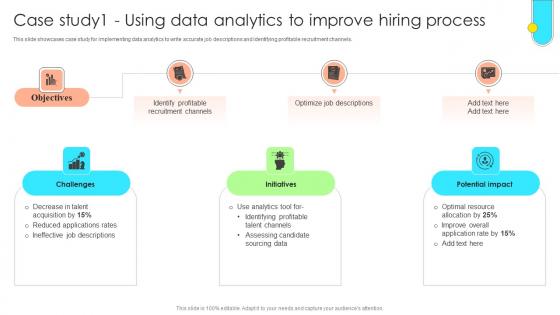
Data Driven Approach To Optimise Case Study1 Using Data Analytics To Improve CRP SS V
This slide showcases case study for implementing data analytics to write accurate job descriptions and identifying profitable recruitment channels. Whether you have daily or monthly meetings, a brilliant presentation is necessary. Data Driven Approach To Optimise Case Study1 Using Data Analytics To Improve CRP SS V can be your best option for delivering a presentation. Represent everything in detail using Data Driven Approach To Optimise Case Study1 Using Data Analytics To Improve CRP SS V and make yourself stand out in meetings. The template is versatile and follows a structure that will cater to your requirements. All the templates prepared by Slidegeeks are easy to download and edit. Our research experts have taken care of the corporate themes as well. So, give it a try and see the results. This slide showcases case study for implementing data analytics to write accurate job descriptions and identifying profitable recruitment channels.
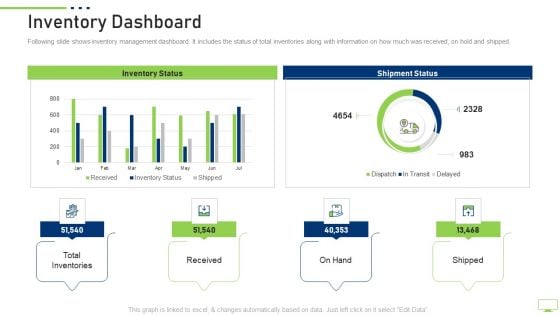
Inventory Dashboard Information PDF
Deliver an awe inspiring pitch with this creative inventory dashboard information pdf bundle. Topics like total inventories, received, shipment status can be discussed with this completely editable template. It is available for immediate download depending on the needs and requirements of the user.
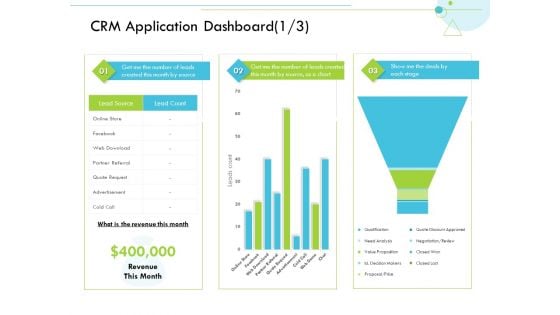
CRM Application Dashboard Source Customer Relationship Management CRM Formats PDF
Deliver and pitch your topic in the best possible manner with this crm application dashboard source customer relationship management crm formats pdf. Use them to share invaluable insights on source, analysis and impress your audience. This template can be altered and modified as per your expectations. So, grab it now.
Transforming Manufacturing With Automation Applications Of Big Data Analytics Icons PDF
This slide represents big data analytics applications in the manufacturing industry, including production optimization, maintenance regulation, quality checks, tool optimization, supply chain management, production preparation, yield improvement, market study, sustainable development, and risk evaluation. There are so many reasons you need a Transforming Manufacturing With Automation Applications Of Big Data Analytics Icons PDF. The first reason is you cannot spend time making everything from scratch, Thus, Slidegeeks has made presentation templates for you too. You can easily download these templates from our website easily.
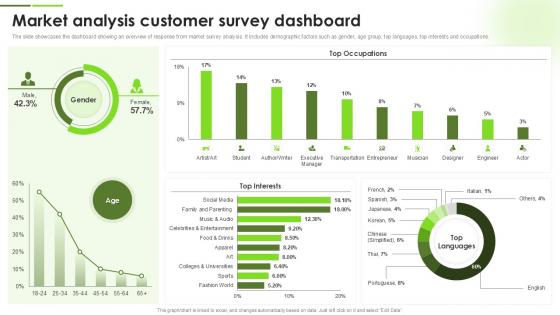
Market Analysis Customer Survey Dashboard
Present like a pro with Market Analysis Customer Survey Dashboard. Create beautiful presentations together with your team, using our easy-to-use presentation slides. Share your ideas in real-time and make changes on the fly by downloading our templates. So whether you are in the office, on the go, or in a remote location, you can stay in sync with your team and present your ideas with confidence. With Slidegeeks presentation got a whole lot easier. Grab these presentations today. This slide represents market survey analysis dashboard, providing a clear overview of responses. It highlights key demographic factors, including gender, age groups, top languages, interests, and occupations, offering valuable insights into the target audience.
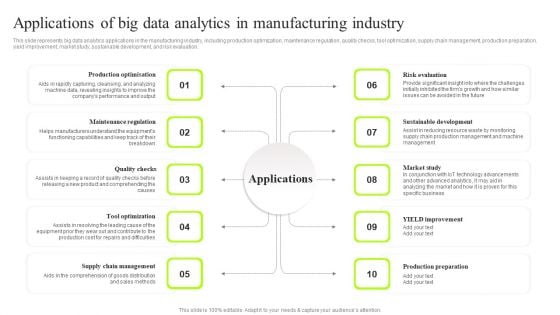
Applications Of Big Data Analytics In Manufacturing Industry Sample PDF
This slide represents big data analytics applications in the manufacturing industry, including production optimization, maintenance regulation, quality checks, tool optimization, supply chain management, production preparation, yield improvement, market study, sustainable development, and risk evaluation. This modern and well-arranged Applications Of Big Data Analytics In Manufacturing Industry Sample PDF provides lots of creative possibilities. It is very simple to customize and edit with the Powerpoint Software. Just drag and drop your pictures into the shapes. All facets of this template can be edited with Powerpoint, no extra software is necessary. Add your own material, put your images in the places assigned for them, adjust the colors, and then you can show your slides to the world, with an animated slide included.
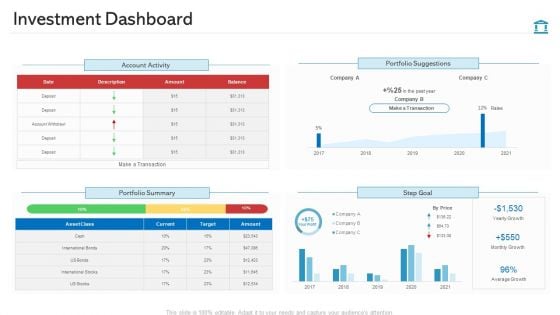
Investment Dashboard Themes PDF
Deliver and pitch your topic in the best possible manner with this investment dashboard themes pdf. Use them to share invaluable insights on account activity, portfolio suggestions, portfolio summary and impress your audience. This template can be altered and modified as per your expectations. So, grab it now.
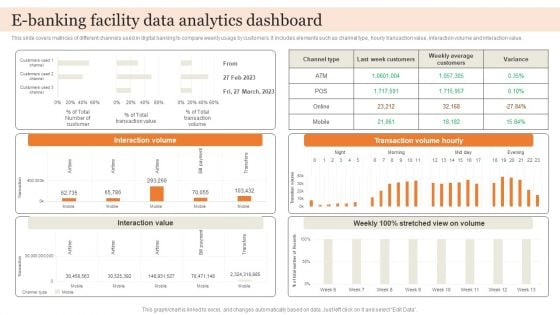
E Banking Facility Data Analytics Dashboard Brochure PDF
This slide covers matrices of different channels used in digital banking to compare weekly usage by customers. It includes elements such as channel type, hourly transaction value, interaction volume and interaction value. Showcasing this set of slides titled E Banking Facility Data Analytics Dashboard Brochure PDF. The topics addressed in these templates are Interaction Value, Transaction Volume Hourly, Interaction Volume. All the content presented in this PPT design is completely editable. Download it and make adjustments in color, background, font etc. as per your unique business setting.
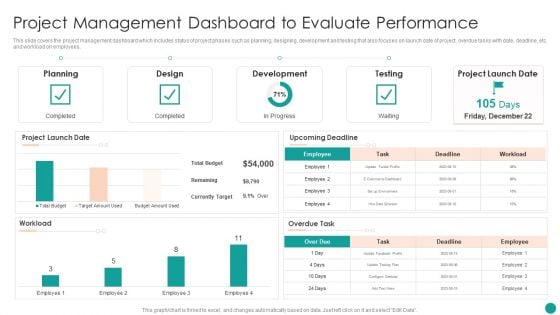
Time Management Techniques For Successful Project Project Management Dashboard To Evaluate Mockup PDF
This slide covers the project management dashboard which includes status of project phases such as planning, designing, development and testing that also focuses on launch date of project, overdue tasks with date, deadline, etc. and workload on employees.Deliver an awe inspiring pitch with this creative Time Management Techniques For Successful Project Project Management Dashboard To Evaluate Mockup PDF bundle. Topics like Development, Project Launch, Upcoming Deadline can be discussed with this completely editable template. It is available for immediate download depending on the needs and requirements of the user.
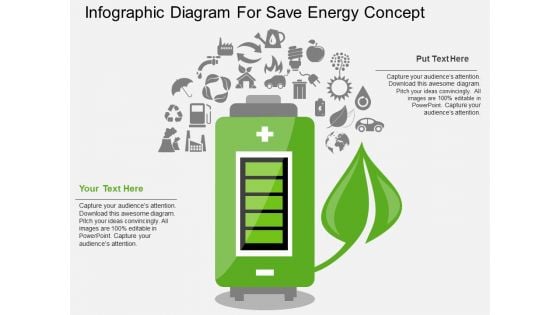
Infographic Diagram For Save Energy Concept PowerPoint Template
These days a gadget is not judged only on the basis of its performance or specs but also on how ecofriendly is the device. Whether it has been made out of recycled waste and if it can be recycled after its life span. This PowerPoint template can be the ideal slide to demonstrate your products or brands consideration towards environment. It can be the highlight of your presentation, visually explaining how your device can help you not only save energy and power but also laying emphasis on usage of renewable sources of energy. The text has been colored in such a manner that it will highlight the features of your product that make it ecofriendly. Add this to your presentation to give your product and convince your investors or clients that your product has that extra edge over your competitors.
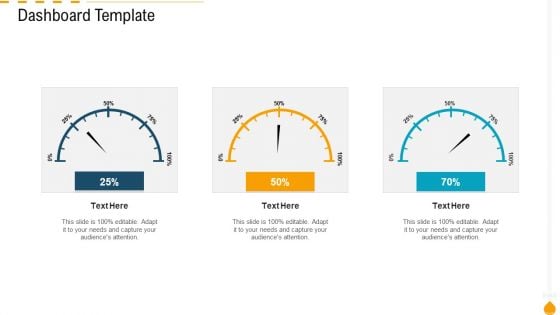
Dashboard Template Formats PDF
Deliver an awe inspiring pitch with this creative dashboard template formats pdf bundle. Topics like dashboard template can be discussed with this completely editable template. It is available for immediate download depending on the needs and requirements of the user.
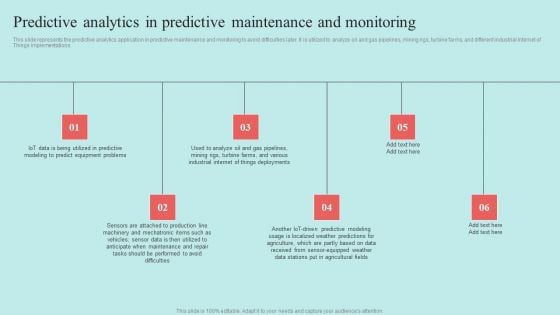
Predictive Data Model Predictive Analytics In Predictive Maintenance And Monitoring Brochure PDF
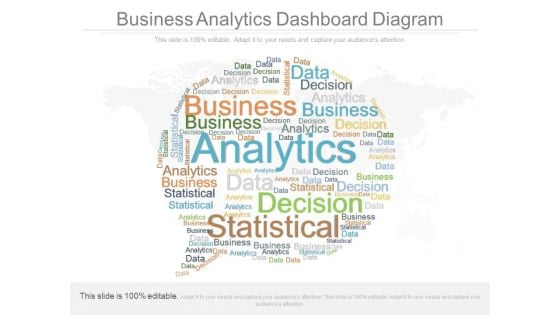
Business Analytics Dashboard Diagram
This is a business analytics dashboard diagram. This is a one stage process. The stages in this process are analytics, decision, data, business, statistics.
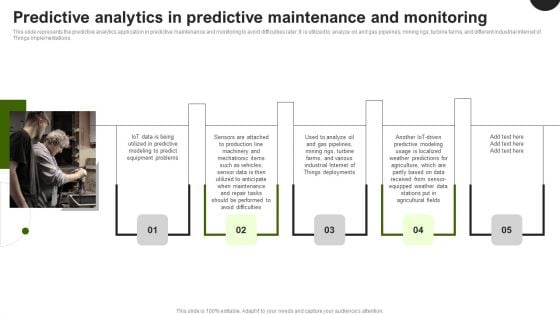
Predictive Analytics In The Age Of Big Data Predictive Analytics In Predictive Maintenance Graphics PDF
This slide represents the predictive analytics application in predictive maintenance and monitoring to avoid difficulties later. It is utilized to analyze oil and gas pipelines, mining rigs, turbine farms, and different industrial Internet of Things implementations. Are you searching for a Predictive Analytics In The Age Of Big Data Predictive Analytics In Predictive Maintenance Graphics PDF that is uncluttered, straightforward, and original Its easy to edit, and you can change the colors to suit your personal or business branding. For a presentation that expresses how much effort you have put in, this template is ideal. With all of its features, including tables, diagrams, statistics, and lists, its perfect for a business plan presentation. Make your ideas more appealing with these professional slides. Download Predictive Analytics In The Age Of Big Data Predictive Analytics In Predictive Maintenance Graphics PDF from Slidegeeks today.

Dashboard System Ppt Powerpoint Ideas
This is a dashboard system ppt powerpoint ideas. This is a four stage process. The stages in this process are description.
Retailer Channel Partner Boot Camp Magnify Ppt Outline Background Images PDF
Presenting retailer channel partner boot camp magnify ppt outline background images pdf to provide visual cues and insights. Share and navigate important information on five stages that need your due attention. This template can be used to pitch topic like magnify. In addition, this PPT design contains high-resolution images, graphics, etc, that are easily editable and available for immediate download.
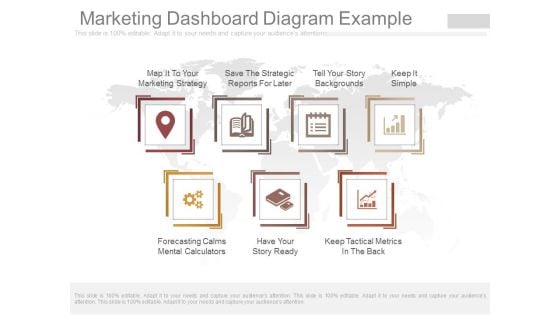
Marketing Dashboard Diagram Example
This is a marketing dashboard diagram example. This is a seven stage process. The stages in this process are map it to your marketing strategy, save the strategic reports for later, tell your story backgrounds, keep it simple, forecasting calms mental calculators, have your story ready, keep tactical metrics in the back.
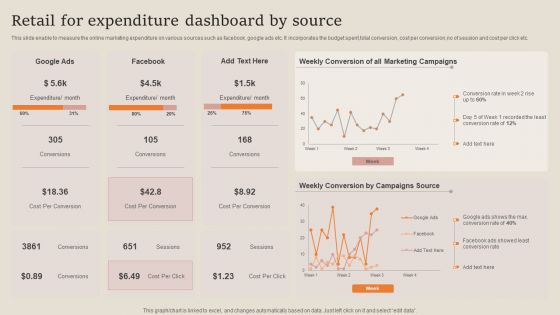
Retail For Expenditure Dashboard By Source Professional PDF
This slide enable to measure the online marketing expenditure on various sources such as facebook, google ads etc. It incorporates the budget spent,total conversion, cost per conversion,no of session and cost per click etc. Pitch your topic with ease and precision using this Retail For Expenditure Dashboard By Source Professional PDF. This layout presents information on Campaigns Source, Conversion Rate, Marketing Campaigns. It is also available for immediate download and adjustment. So, changes can be made in the color, design, graphics or any other component to create a unique layout.
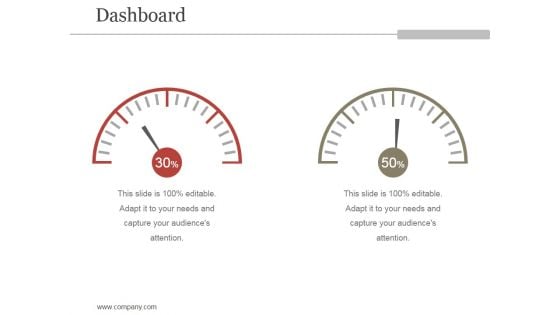
Dashboard Ppt PowerPoint Presentation Backgrounds
This is a dashboard ppt powerpoint presentation backgrounds. This is a two stage process. The stages in this process are dashboard, percentage, finance, measurement, business.
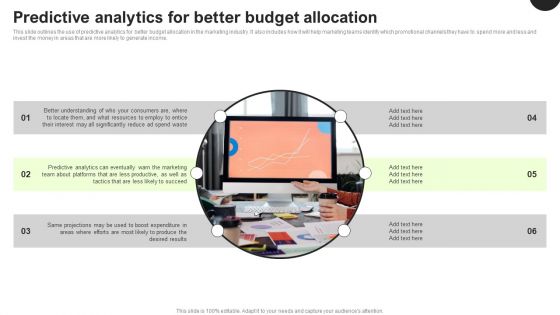
Predictive Analytics In The Age Of Big Data Predictive Analytics For Better Budget Allocation Inspiration PDF
This slide outlines the use of predictive analytics for better budget allocation in the marketing industry. It also includes how it will help marketing teams identify which promotional channels they have to spend more and less and invest the money in areas that are more likely to generate income. Make sure to capture your audiences attention in your business displays with our gratis customizable Predictive Analytics In The Age Of Big Data Predictive Analytics For Better Budget Allocation Inspiration PDF. These are great for business strategies, office conferences, capital raising or task suggestions. If you desire to acquire more customers for your tech business and ensure they stay satisfied, create your own sales presentation with these plain slides.
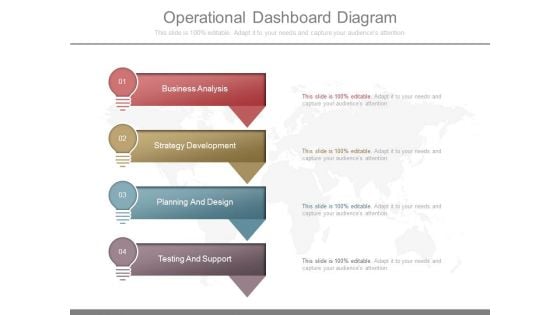
Operational Dashboard Diagram
This is a operational dashboard diagram. This is a four stage process. The stages in this process are business analysis, strategy development, planning and design, testing and support.
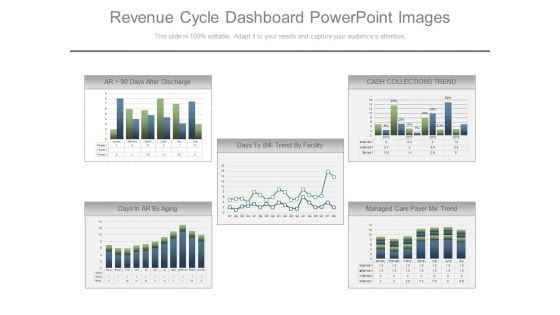
Revenue Cycle Dashboard Powerpoint Images
This is a revenue cycle dashboard powerpoint images. This is a five stage process. The stages in this process are days after discharge, cash collections trend, days to bill trend by facility, days in ar by aging, managed care payer mix trend.
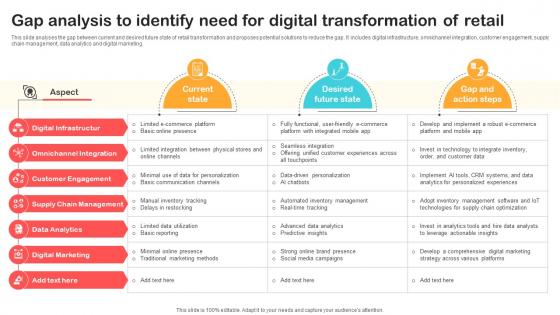
Gap Analysis To Identify Need For Digital Transformation Optimizing Retail Operations With Digital DT SS V
This slide analyses the gap between current and desired future state of retail transformation and proposes potential solutions to reduce the gap. It includes digital infrastructure, omnichannel integration, customer engagement, supply chain management, data analytics and digital marketing.This Gap Analysis To Identify Need For Digital Transformation Optimizing Retail Operations With Digital DT SS V from Slidegeeks makes it easy to present information on your topic with precision. It provides customization options, so you can make changes to the colors, design, graphics, or any other component to create a unique layout. It is also available for immediate download, so you can begin using it right away. Slidegeeks has done good research to ensure that you have everything you need to make your presentation stand out. Make a name out there for a brilliant performance. This slide analyses the gap between current and desired future state of retail transformation and proposes potential solutions to reduce the gap. It includes digital infrastructure, omnichannel integration, customer engagement, supply chain management, data analytics and digital marketing.
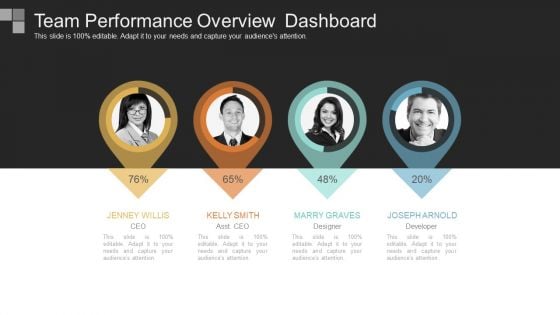
Team Performance Overview Dashboard
This is a team performance overview dashboard. This is a four stage process. The stages in this process are jenney willis ceo, kelly smith asst ceo, marry graves designer, joseph arnold developer.
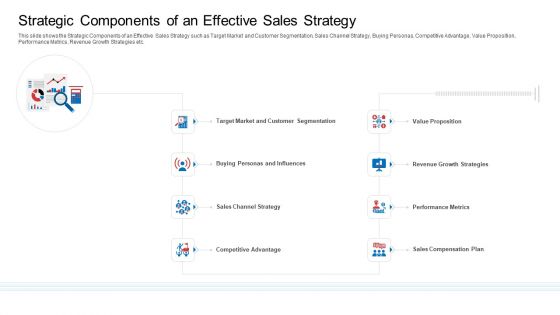
Strategic Plan To Increase Sales Volume And Revenue Strategic Components Of An Effective Sales Strategy Microsoft PDF
This slide shows the Strategic Components of an Effective Sales Strategy such as Target Market and Customer Segmentation, Sales Channel Strategy, Buying Personas, Competitive Advantage, Value Proposition, Performance Metrics, Revenue Growth Strategies etc. Presenting strategic plan to increase sales volume and revenue strategic components of an effective sales strategy microsoft pdf to provide visual cues and insights. Share and navigate important information on eight stages that need your due attention. This template can be used to pitch topics like value proposition, performance metrics, growth strategies, compensation plan, competitive advantage. In addtion, this PPT design contains high resolution images, graphics, etc, that are easily editable and available for immediate download.
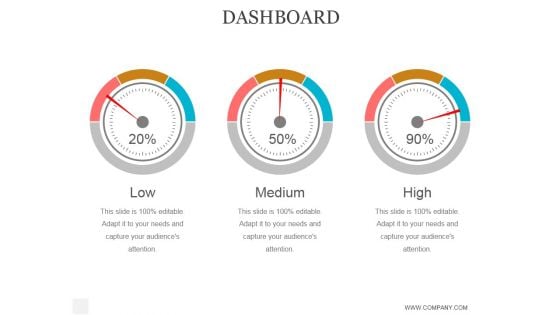
Dashboard Ppt PowerPoint Presentation Designs
This is a dashboard ppt powerpoint presentation designs. This is a three stage process. The stages in this process are business, strategy, marketing, analysis, success, dashboard.
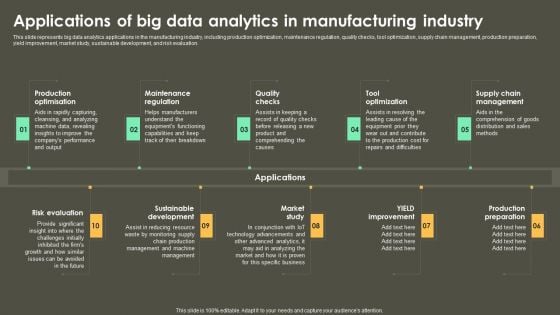
Iot Integration In Manufacturing Applications Of Big Data Analytics In Manufacturing Industry Inspiration PDF
This slide represents big data analytics applications in the manufacturing industry, including production optimization, maintenance regulation, quality checks, tool optimization, supply chain management, production preparation, yield improvement, market study, sustainable development, and risk evaluation. Want to ace your presentation in front of a live audience Our Iot Integration In Manufacturing Applications Of Big Data Analytics In Manufacturing Industry Inspiration PDF can help you do that by engaging all the users towards you.. Slidegeeks experts have put their efforts and expertise into creating these impeccable powerpoint presentations so that you can communicate your ideas clearly. Moreover, all the templates are customizable, and easy-to-edit and downloadable. Use these for both personal and commercial use.
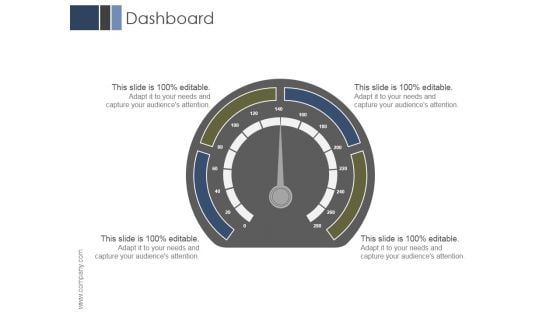
Dashboard Ppt PowerPoint Presentation Graphics
This is a dashboard ppt powerpoint presentation graphics. This is a four stage process. The stages in this process are business, marketing, management, dashboard, analysis.

HR Recruitment Dashboard Kpis With Open Positions Ppt Model Good PDF
Following slide showcases the recruitment dashboard metrics for measuring placement per department. It include KPIs like applications received by departments, applicant details, sources, time to hire. Pitch your topic with ease and precision using this HR Recruitment Dashboard Kpis With Open Positions Ppt Model Good PDF. This layout presents information on Offer Acceptance Ratio, Recruitment Funnel, Applicant Details. It is also available for immediate download and adjustment. So, changes can be made in the color, design, graphics or any other component to create a unique layout.
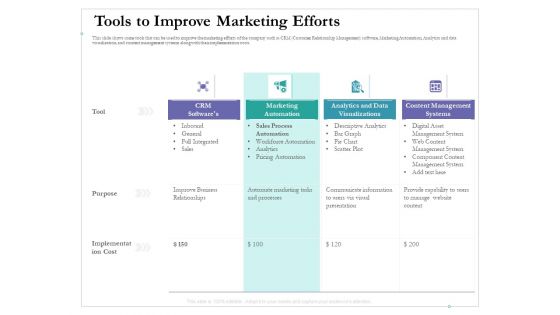
Cross Channel Marketing Benefits Tools To Improve Marketing Efforts Themes PDF
This slide shows some tools that can be used to improve the marketing efforts of the company such as CRM Customer Relationship Management software, Marketing Automation, Analytics and data visualization, and content management systems along with their implementation costs. Deliver an awe-inspiring pitch with this creative cross channel marketing benefits tools to improve marketing efforts themes pdf bundle. Topics like improve business relationships, implementation cost, analytics data visualizations, marketing automation, content management systems can be discussed with this completely editable template. It is available for immediate download depending on the needs and requirements of the user.
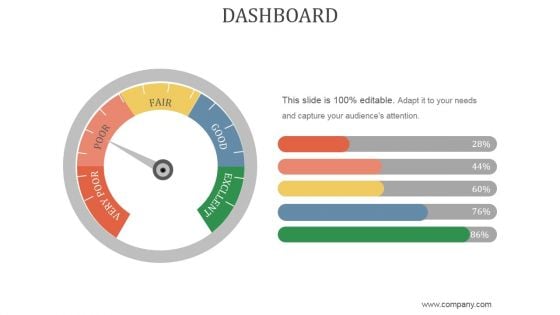
Dashboard Ppt PowerPoint Presentation Shapes
This is a dashboard ppt powerpoint presentation shapes. This is a five stage process. The stages in this process are very poor, poor, fair, good, excllent.
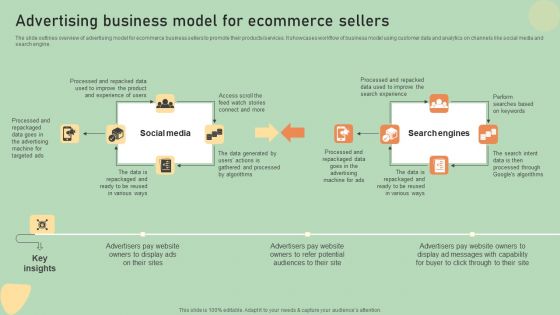
E Commerce Business Development Plan Advertising Business Model For Ecommerce Sellers Guidelines PDF
The slide outlines overview of advertising model for ecommerce business sellers to promote their products or services. It showcases workflow of business model using customer data and analytics on channels like social media and search engine. Create an editable E Commerce Business Development Plan Advertising Business Model For Ecommerce Sellers Guidelines PDF that communicates your idea and engages your audience. Whether you are presenting a business or an educational presentation, pre-designed presentation templates help save time. E Commerce Business Development Plan Advertising Business Model For Ecommerce Sellers Guidelines PDF is highly customizable and very easy to edit, covering many different styles from creative to business presentations. Slidegeeks has creative team members who have crafted amazing templates. So, go and get them without any delay.
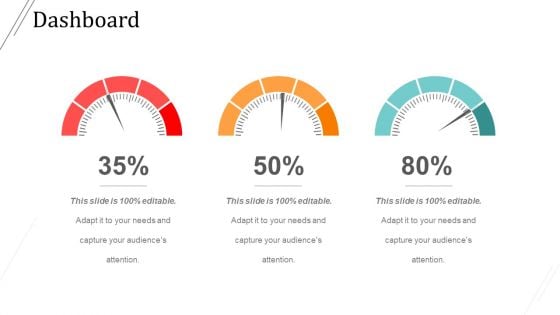
Dashboard Ppt PowerPoint Presentation Deck
This is a dashboard ppt powerpoint presentation deck. This is a three stage process. The stages in this process are dashboard, planning, management, business, strategy.
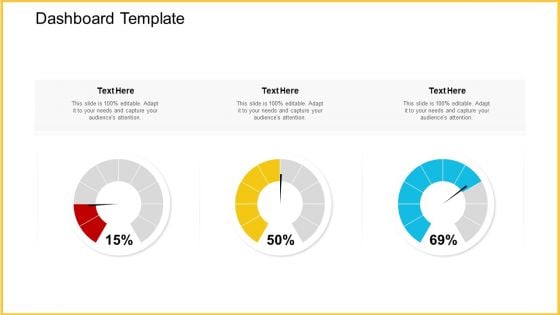
Dashboard Template Ideas PDF
Deliver an awe-inspiring pitch with this creative dashboard template ideas pdf. bundle. Topics like dashboard template can be discussed with this completely editable template. It is available for immediate download depending on the needs and requirements of the user.
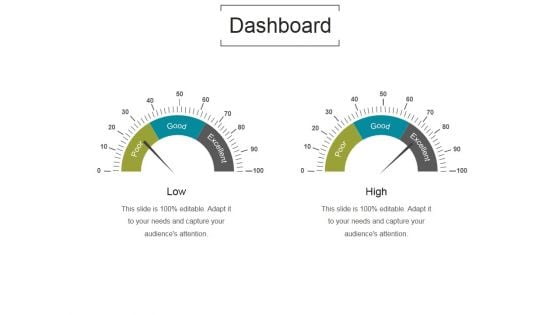
Dashboard Ppt PowerPoint Presentation Themes
This is a dashboard ppt powerpoint presentation themes. This is a two stage process. The stages in this process are low, high, poor, good, excellent.
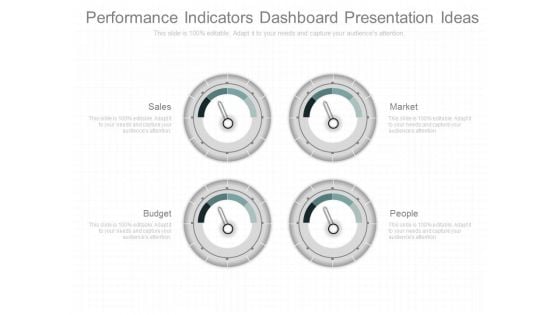
Performance Indicators Dashboard Presentation Ideas
This is a performance indicators dashboard presentation ideas. This is a four stage process. The stages in this process are sales, market, budget, people.
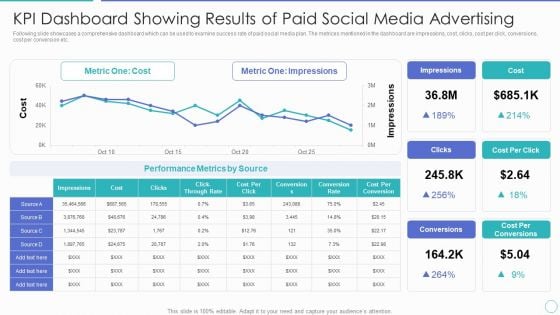
KPI Dashboard Showing Results Of Paid Social Media Advertising Ppt PowerPoint Presentation File Summary PDF
Following slide showcases a comprehensive dashboard which can be used to examine success rate of paid social media plan. The metrices mentioned in the dashboard are impressions, cost, clicks, cost per click, conversions, cost per conversion etc. Showcasing this set of slides titled kpi dashboard showing results of paid social media advertising ppt powerpoint presentation file summary pdf. The topics addressed in these templates are metric one cost, metric one impressions, performance metrics by source. All the content presented in this PPT design is completely editable. Download it and make adjustments in color, background, font etc. as per your unique business setting.
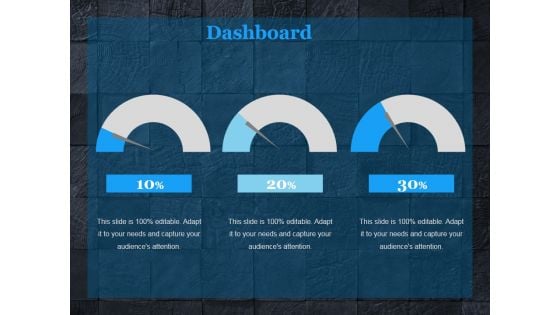
Dashboard Ppt PowerPoint Presentation Pictures
This is a dashboard ppt powerpoint presentation pictures. This is a three stage process. The stages in this process are dashboard, measure, marketing, strategy, business.
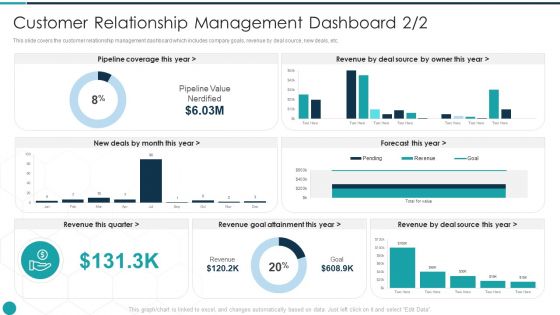
Upgrade Management Of Complex Business Associates Customer Relationship Management Download PDF
This slide covers the customer relationship management dashboard which includes company goals, revenue by deal source, new deals, etc. Deliver an awe inspiring pitch with this creative upgrade management of complex business associates customer relationship management download pdf bundle. Topics like source, revenue, goal can be discussed with this completely editable template. It is available for immediate download depending on the needs and requirements of the user.
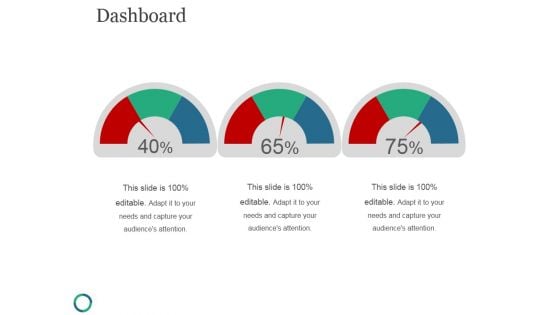
Dashboard Ppt PowerPoint Presentation Guidelines
This is a dashboard ppt powerpoint presentation guidelines. This is a three stage process. The stages in this process are dashboard, strategy, business, success, marketing, management.
File Transfer Data Management Vector Icon Ppt PowerPoint Presentation File Graphic Images
Presenting this set of slides with name file transfer data management vector icon ppt powerpoint presentation file graphic images. The topics discussed in these slides are data sources, database management, marketing. This is a completely editable PowerPoint presentation and is available for immediate download. Download now and impress your audience.
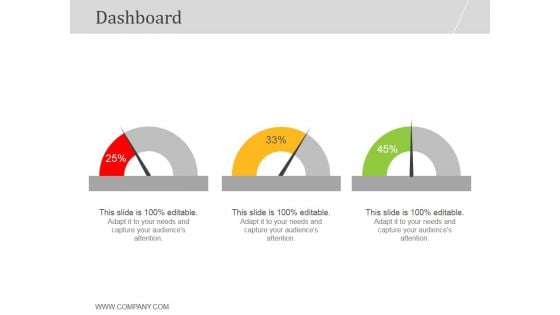
Dashboard Ppt PowerPoint Presentation Example
This is a dashboard ppt powerpoint presentation example. This is a three stage process. The stages in this process are dashboard, management, marketing, strategy, success.
Loyalty Program Performance Tracking Dashboard Topics PDF
This slide covers the KPI dashboard for analyzing customer loyalty campaign results. It includes metrics such as revenue, liability, NQP accrued, transaction count, members, redemption ratio, etc. Deliver an awe inspiring pitch with this creative Loyalty Program Performance Tracking Dashboard Topics PDF bundle. Topics like Loyalty Program Performance, Tracking Dashboard can be discussed with this completely editable template. It is available for immediate download depending on the needs and requirements of the user.
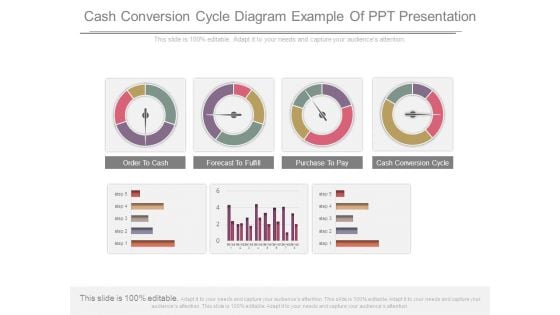
Cash Conversion Cycle Diagram Example Of Ppt Presentation
This is a cash conversion cycle diagram example of ppt presentation. This is a four stage process. The stages in this process are order to cash, forecast to fulfill, purchase to pay, cash conversion cycle.
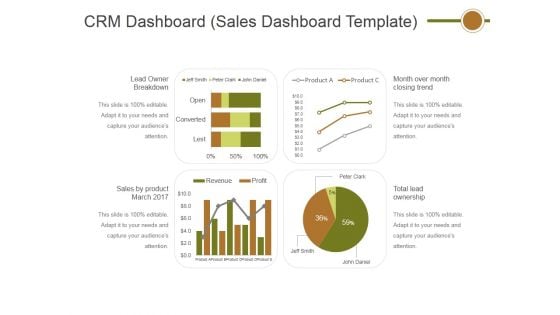
Crm Dashboard Sales Dashboard Template Ppt PowerPoint Presentation Professional Layout
This is a crm dashboard sales dashboard template ppt powerpoint presentation professional layout. This is a four stage process. The stages in this process are lead owner breakdown, sales by product march 2017, total lead ownership, month over month closing trend.
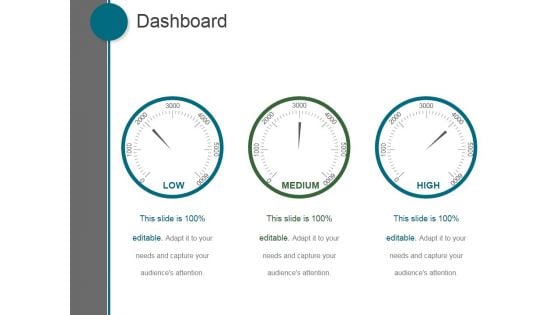
Dashboard Ppt PowerPoint Presentation Gallery
This is a dashboard ppt powerpoint presentation gallery. This is a three stage process. The stages in this process are low, medium, high.
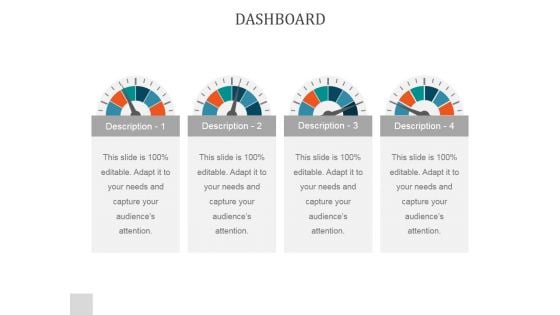
Dashboard Ppt PowerPoint Presentation Introduction
This is a dashboard ppt powerpoint presentation introduction. This is a four stage process. The stages in this process are dashboard, measure, strategy, business, success.
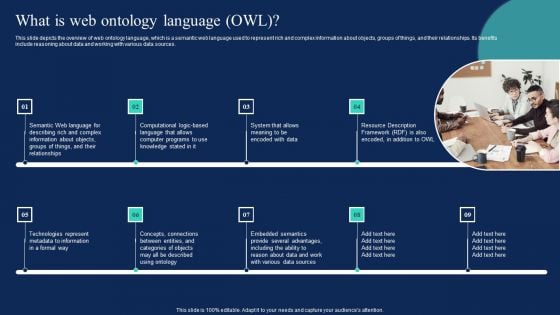
Enterprise Information Web Standards What Is Web Ontology Language OWL Themes PDF
This slide depicts the overview of web ontology language, which is a semantic web language used to represent rich and complex information about objects, groups of things, and their relationships. Its benefits include reasoning about data and working with various data sources. Explore a selection of the finest Enterprise Information Web Standards What Is Web Ontology Language OWL Themes PDF here. With a plethora of professionally designed and pre made slide templates, you can quickly and easily find the right one for your upcoming presentation. You can use our Enterprise Information Web Standards What Is Web Ontology Language OWL Themes PDF to effectively convey your message to a wider audience. Slidegeeks has done a lot of research before preparing these presentation templates. The content can be personalized and the slides are highly editable. Grab templates today from Slidegeeks.
Dashboard Ppt PowerPoint Presentation Icon
This is a dashboard ppt powerpoint presentation icon. This is a three stage process. The stages in this process are revenue, units sold, purchase value revenue, units sold, purchase value.
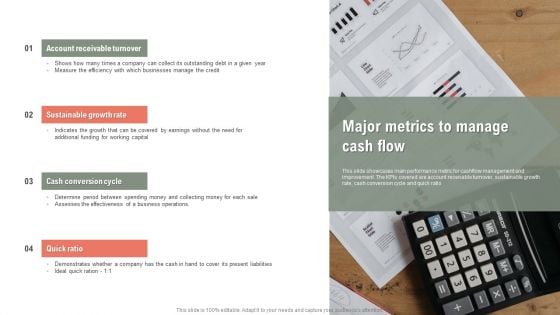
Major Metrics To Manage Cash Flow Ppt Infographics Portfolio PDF
This slide showcases main performance metric for cashflow management and improvement. The KPIs covered are account receivable turnover, sustainable growth rate, cash conversion cycle and quick ratio. Presenting Major Metrics To Manage Cash Flow Ppt Infographics Portfolio PDF to dispense important information. This template comprises four stages. It also presents valuable insights into the topics including Account Receivable Turnover, Sustainable Growth Rate, Cash Conversion Cycle. This is a completely customizable PowerPoint theme that can be put to use immediately. So, download it and address the topic impactfully.
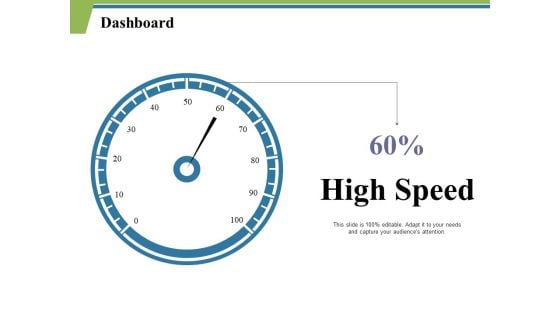
Dashboard Ppt PowerPoint Presentationmodel Brochure
This is a dashboard ppt powerpoint presentationmodel brochure. This is a one stage process. The stages in this process are dashboard, business, management, planning, strategy.
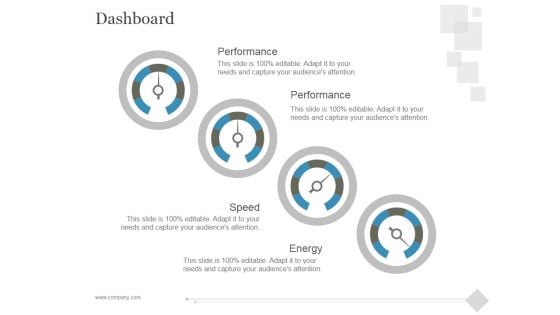
Dashboard Ppt PowerPoint Presentation Diagrams
This is a dashboard ppt powerpoint presentation diagrams. This is a four stage process. The stages in this process are performance, energy, speed.
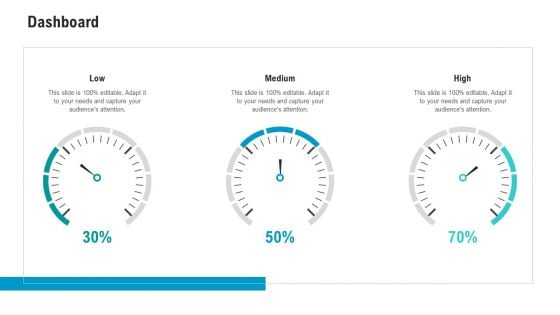
API Ecosystem Dashboard Clipart PDF
This is a api ecosystem dashboard clipart pdf template with various stages. Focus and dispense information on three stages using this creative set, that comes with editable features. It contains large content boxes to add your information on topics like dashboard. You can also showcase facts, figures, and other relevant content using this PPT layout. Grab it now.


 Continue with Email

 Home
Home


