Financial Dashboard
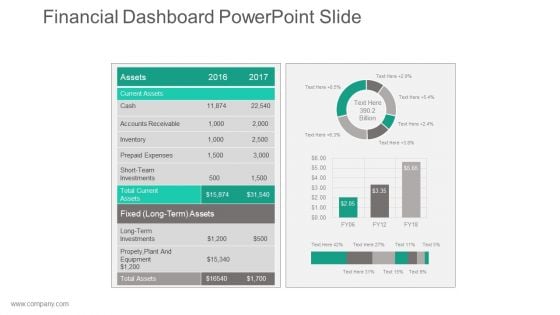
Financial Dashboard Powerpoint Slide
This is a financial dashboard powerpoint slide. This is a two stage process. The stages in this process are current assets, accounts receivable, prepaid expenses, short team investments.
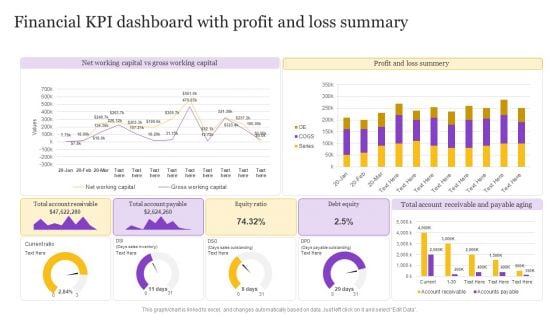
Financial KPI Dashboard With Profit And Loss Summary Professional PDF
Pitch your topic with ease and precision using this Financial KPI Dashboard With Profit And Loss Summary Professional PDF. This layout presents information on Net Working Capital, Gross Working Capital. It is also available for immediate download and adjustment. So, changes can be made in the color, design, graphics or any other component to create a unique layout.
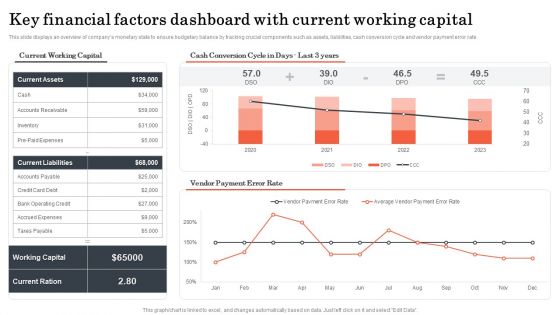
Key Financial Factors Dashboard With Current Working Capital Introduction PDF
This slide displays an overview of companys monetary state to ensure budgetary balance by tracking crucial components such as assets, liabilities, cash conversion cycle and vendor payment error rate. Showcasing this set of slides titled Key Financial Factors Dashboard With Current Working Capital Introduction PDF. The topics addressed in these templates are Key Financial Factors, Dashboard With Current, Working Capital. All the content presented in this PPT design is completely editable. Download it and make adjustments in color, background, font etc. as per your unique business setting.
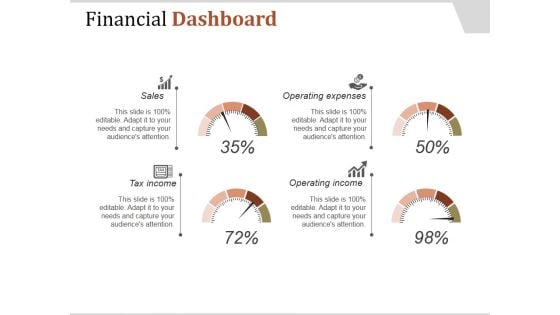
Financial Dashboard Ppt PowerPoint Presentation Influencers
This is a financial dashboard ppt powerpoint presentation influencers. This is a four stage process. The stages in this process are sales, tax income, operating income, operating expenses.
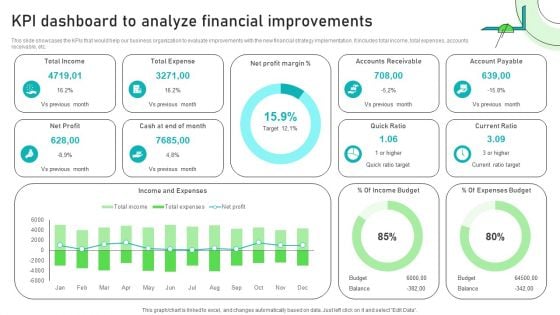
Adjusting Financial Strategies And Planning KPI Dashboard To Analyze Financial Improvements Inspiration PDF
This slide showcases the KPIs that would help our business organization to evaluate improvements with the new financial strategy implementation. It includes total income, total expenses, accounts receivable, etc. The best PPT templates are a great way to save time, energy, and resources. Slidegeeks have 100 percent editable powerpoint slides making them incredibly versatile. With these quality presentation templates, you can create a captivating and memorable presentation by combining visually appealing slides and effectively communicating your message. Download Adjusting Financial Strategies And Planning KPI Dashboard To Analyze Financial Improvements Inspiration PDF from Slidegeeks and deliver a wonderful presentation.
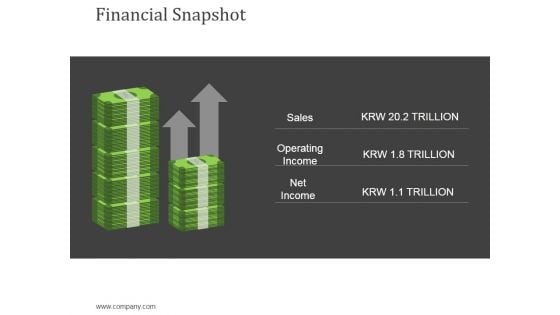
Financial Snapshot Ppt Powerpoint Presentation Layouts Slides
This is a financial snapshot ppt powerpoint presentation layouts slides. This is a two stage process. The stages in this process are sales, operating income, net income, currency, finance.
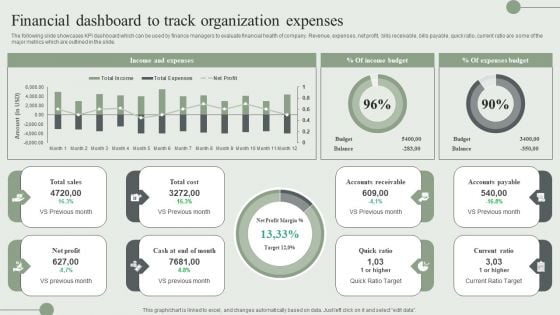
Financial Dashboard To Track Organization Expenses Ppt PowerPoint Presentation File Ideas PDF
The following slide showcases KPI dashboard which can be used by finance managers to evaluate financial health of company. Revenue, expenses, net profit, bills receivable, bills payable, quick ratio, current ratio are some of the major metrics which are outlined in the slide. Boost your pitch with our creative Financial Dashboard To Track Organization Expenses Ppt PowerPoint Presentation File Ideas PDF. Deliver an awe-inspiring pitch that will mesmerize everyone. Using these presentation templates you will surely catch everyones attention. You can browse the ppts collection on our website. We have researchers who are experts at creating the right content for the templates. So you do not have to invest time in any additional work. Just grab the template now and use them.
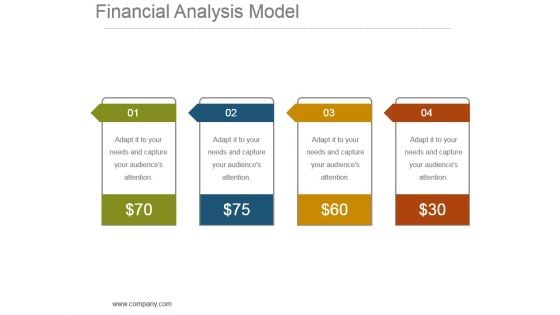
Financial Analysis Model Powerpoint Slide Show
This is a financial analysis model powerpoint slide show. This is a four stage process. The stages in this process are dollar, symbol, business, marketing, finance.
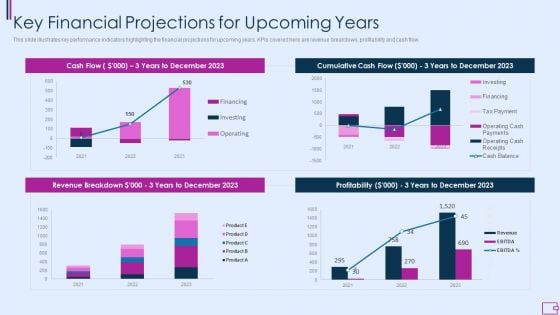
Capital Fundraising And Financial Forecast Pitch Deck Key Financial Projections For Upcoming Years Portrait PDF
This slide illustrates key performance indicators highlighting the financial projections for upcoming years. KPIs covered here are revenue breakdown, profitability and cash flow. Deliver an awe inspiring pitch with this creative capital fundraising and financial forecast pitch deck key financial projections for upcoming years portrait pdf bundle. Topics like key financial projections for upcoming years can be discussed with this completely editable template. It is available for immediate download depending on the needs and requirements of the user.
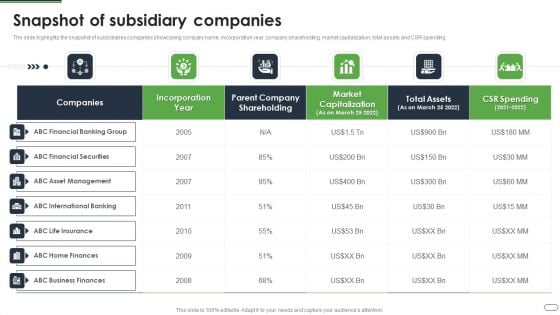
Financial Solutions Company Profile Snapshot Of Subsidiary Companies Graphics PDF
The slide highlights the snapshot of subsidiaries companies showcasing company name, incorporation year, company shareholding, market capitalization, total assets and CSR spending Deliver and pitch your topic in the best possible manner with this Financial Solutions Company Profile Snapshot Of Subsidiary Companies Graphics PDF Use them to share invaluable insights on Financial Banking, Financial Securities, Asset Management and impress your audience. This template can be altered and modified as per your expectations. So, grab it now.
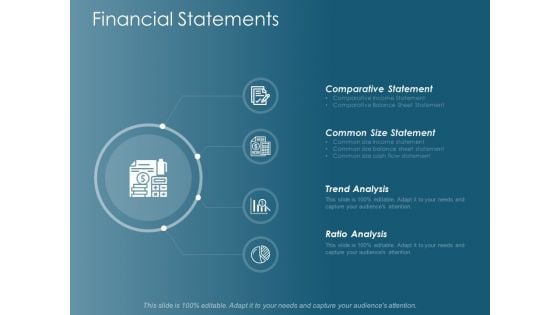
Financial Statements Ppt Powerpoint Presentation Inspiration Example
This is a financial statements ppt powerpoint presentation inspiration example. This is a four stage process. The stages in this process are financial statements, comparative statement, common size statement, trend analysis, ratio analysis.
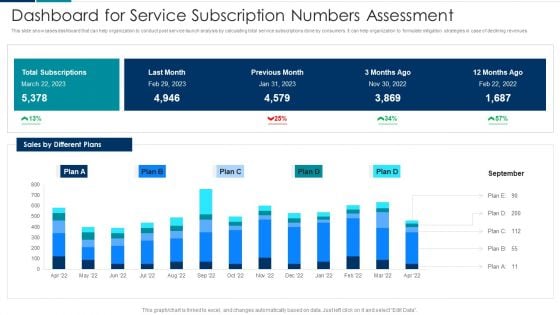
Managing New Service Roll Out And Marketing Procedure Dashboard For Service Subscription Numbers Assessment Clipart PDF
This slide showcases dashboard that can help organization to conduct post service launch analysis by calculating total service subscriptions done by consumers. It can help organization to formulate mitigation strategies in case of declining revenues. Deliver an awe inspiring pitch with this creative Managing New Service Roll Out And Marketing Procedure Dashboard For Service Subscription Numbers Assessment Clipart PDF bundle. Topics like Dashboard For Service, Subscription Numbers Assessment can be discussed with this completely editable template. It is available for immediate download depending on the needs and requirements of the user.
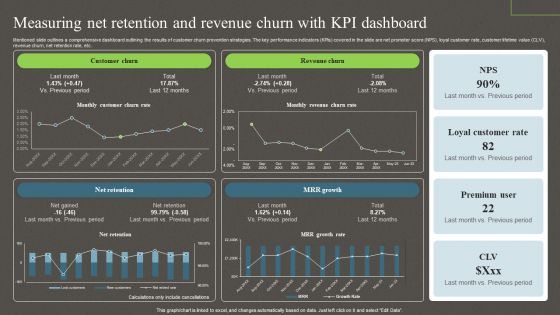
Measuring Net Retention And Revenue Churn With Kpi Dashboard Ppt PowerPoint Presentation File Backgrounds PDF
Mentioned slide outlines a comprehensive dashboard outlining the results of customer churn prevention strategies. The key performance indicators KPIs covered in the slide are net promoter score NPS, loyal customer rate, customer lifetime value CLV, revenue churn, net retention rate, etc. Boost your pitch with our creative Measuring Net Retention And Revenue Churn With Kpi Dashboard Ppt PowerPoint Presentation File Backgrounds PDF. Deliver an awe inspiring pitch that will mesmerize everyone. Using these presentation templates you will surely catch everyones attention. You can browse the ppts collection on our website. We have researchers who are experts at creating the right content for the templates. So you do not have to invest time in any additional work. Just grab the template now and use them.
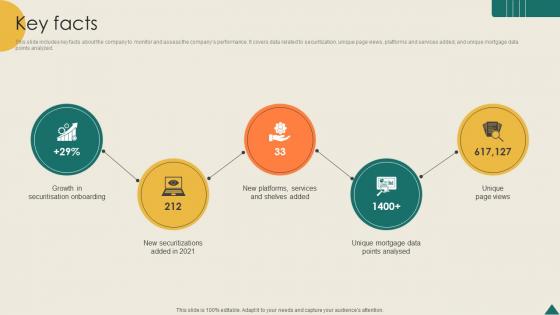
Key Facts Financial Analytics Platform Investor Elevator Pitch Deck
This slide includes key facts about the company to monitor and assess the companys performance. It covers data related to securitization, unique page views, platforms and services added, and unique mortgage data points analyzed. There are so many reasons you need a Key Facts Financial Analytics Platform Investor Elevator Pitch Deck. The first reason is you can not spend time making everything from scratch, Thus, Slidegeeks has made presentation templates for you too. You can easily download these templates from our website easily. This slide includes key facts about the company to monitor and assess the companys performance. It covers data related to securitization, unique page views, platforms and services added, and unique mortgage data points analyzed.

Financial Management Cycle Ppt Powerpoint Presentation Gallery Guide
This is a financial management cycle ppt powerpoint presentation gallery guide. This is a four stage process. The stages in this process are financial management cycle, customer need assessment, operating and monitoring, evaluation and reporting, planning and budgeting.
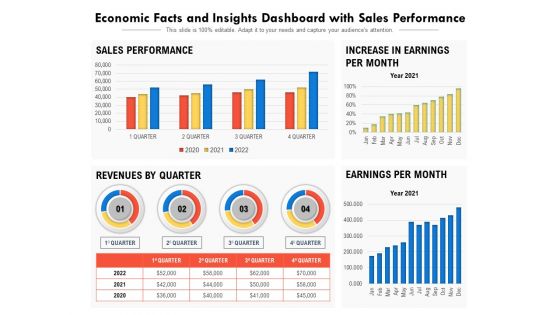
Economic Facts And Insights Dashboard With Sales Performance Ppt PowerPoint Presentation Show Gallery PDF
Showcasing this set of slides titled economic facts and insights dashboard with sales performance ppt powerpoint presentation show gallery pdf. The topics addressed in these templates are sales performance, increase in earnings per month, revenues by quarter, earnings per month. All the content presented in this PPT design is completely editable. Download it and make adjustments in color, background, font etc. as per your unique business setting.
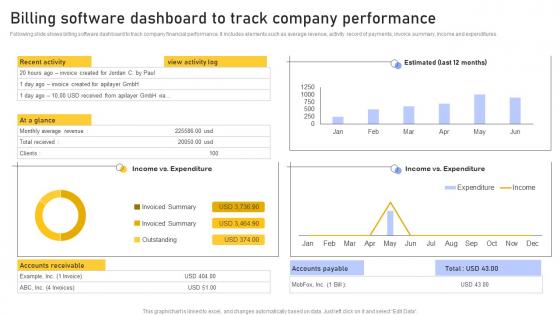
Billing Software Dashboard Enhancing Customer Service Operations Using CRM Technology Microsoft Pdf
Following slide shows billing software dashboard to track company financial performance. It includes elements such as average revenue, activity record of payments, invoice summary, income and expenditures. Create an editable Billing Software Dashboard Enhancing Customer Service Operations Using CRM Technology Microsoft Pdf that communicates your idea and engages your audience. Whether you are presenting a business or an educational presentation, pre designed presentation templates help save time. Billing Software Dashboard Enhancing Customer Service Operations Using CRM Technology Microsoft Pdf is highly customizable and very easy to edit, covering many different styles from creative to business presentations. Slidegeeks has creative team members who have crafted amazing templates. So, go and get them without any delay. Following slide shows billing software dashboard to track company financial performance. It includes elements such as average revenue, activity record of payments, invoice summary, income and expenditures.
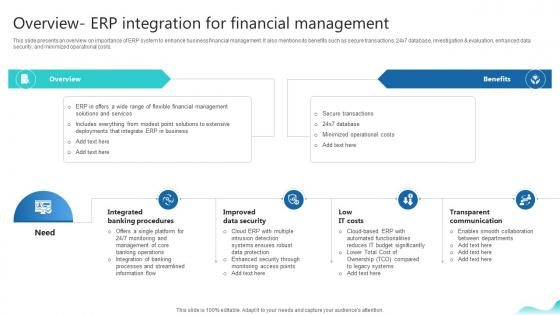
Overview Erp Integration For Financial Management Erp And Digital Transformation For Maximizing DT SS V
This slide presents an overview on importance of ERP system to enhance business financial management. It also mentions its benefits such as secure transactions, 24x7 database, investigation and evaluation, enhanced data security, and minimized operational costs.The Overview Erp Integration For Financial Management Erp And Digital Transformation For Maximizing DT SS V is a compilation of the most recent design trends as a series of slides. It is suitable for any subject or industry presentation, containing attractive visuals and photo spots for businesses to clearly express their messages. This template contains a variety of slides for the user to input data, such as structures to contrast two elements, bullet points, and slides for written information. Slidegeeks is prepared to create an impression. This slide presents an overview on importance of ERP system to enhance business financial management. It also mentions its benefits such as secure transactions, 24x7 database, investigation and evaluation, enhanced data security, and minimized operational costs.
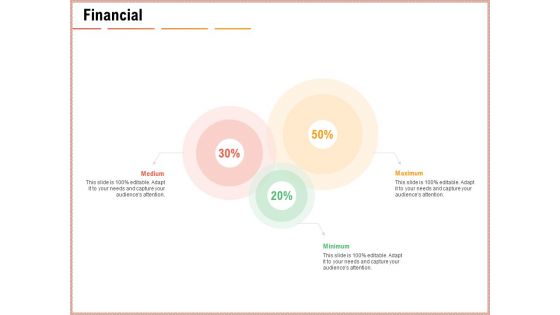
Net Promoter Score Dashboard Financial Ppt Styles Show PDF
Presenting net promoter score dashboard financial ppt styles show pdf to provide visual cues and insights. Share and navigate important information on three stages that need your due attention. This template can be used to pitch topics like financial, medium, minimum, maximum. In addtion, this PPT design contains high-resolution images, graphics, etc, that are easily editable and available for immediate download.
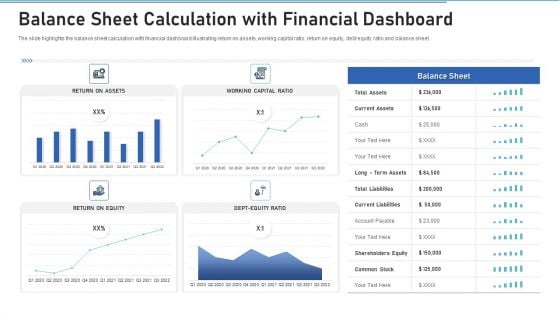
Balance Sheet Calculation With Financial Dashboard Background PDF
Pitch your topic with ease and precision using this balance sheet calculation with financial dashboard background pdf. This layout presents information on balance sheet calculation with financial dashboard. It is also available for immediate download and adjustment. So, changes can be made in the color, design, graphics or any other component to create a unique layout.
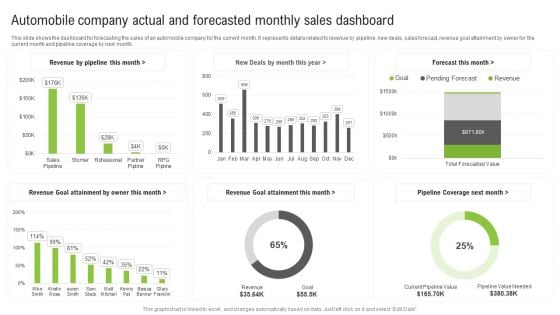
Automobile Company Actual And Forecasted Monthly Sales Dashboard Ppt Infographic Template Aids PDF
This slide shows the dashboard for forecasting the sales of an automobile company for the current month. It represents details related to revenue by pipeline, new deals, sales forecast, revenue goal attainment by owner for the current month and pipeline coverage by next month. Showcasing this set of slides titled Automobile Company Actual And Forecasted Monthly Sales Dashboard Ppt Infographic Template Aids PDF. The topics addressed in these templates are Forecast Month, Revenue Goal Attainment, Revenue Goal Attainment. All the content presented in this PPT design is completely editable. Download it and make adjustments in color, background, font etc. as per your unique business setting.
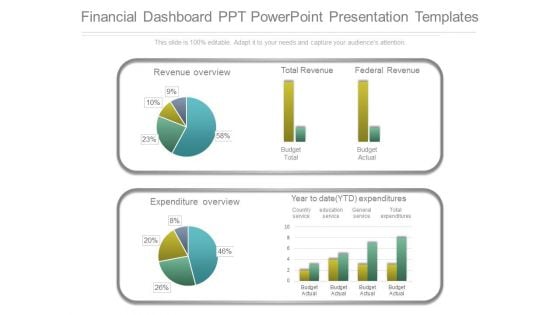
Financial Dashboard Ppt Powerpoint Presentation Templates
This is a financial dashboard ppt powerpoint presentation templates. This is a two stage process. The stages in this process are revenue overview, total revenue, federal revenue, budget total, budget actual, expenditure overview, year to date ytd expenditures, country service, education service, general service, total expenditures.
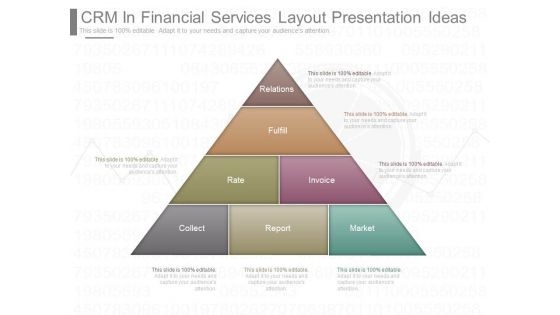
Crm In Financial Services Layout Presentation Ideas
This is a crm in financial services layout presentation ideas. This is a seven stage process. The stages in this process are relations, fulfill, rate, invoice, collect, report, market.
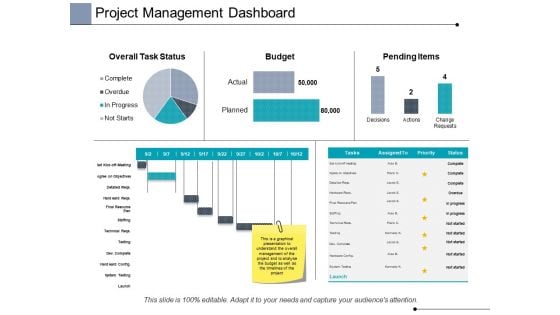
Project Management Dashboard Ppt PowerPoint Presentation Infographic Template Graphics
This is a project management dashboard ppt powerpoint presentation infographic template graphics. This is a three stage process. The stages in this process are finance, analysis, business, investment, marketing.
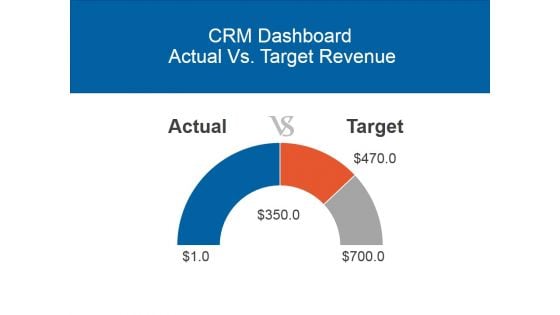
Crm Dashboard Actual Vs Target Revenue Ppt PowerPoint Presentation Guidelines
This is a crm dashboard actual vs target revenue ppt powerpoint presentation guidelines. This is a three stage process. The stages in this process are actual, target.
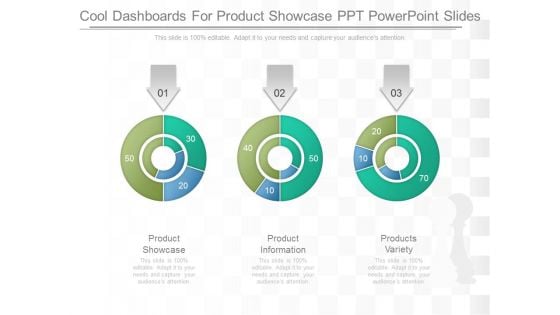
Cool Dashboards For Product Showcase Ppt Powerpoint Slides
This is a cool dashboards for product showcase ppt powerpoint slides. This is a three stage process. The stages in this process are product showcase, product information, products variety.
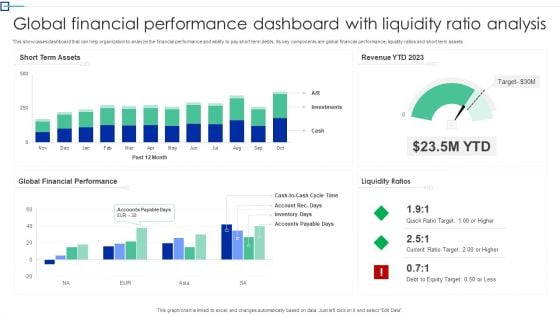
Global Financial Performance Dashboard With Liquidity Ratio Analysis Information PDF
This showcases dashboard that can help organization to analyze the financial performance and ability to pay short term debts. Its key components are global financial performance, liquidity ratios and short term assets. Pitch your topic with ease and precision using this Global Financial Performance Dashboard With Liquidity Ratio Analysis Information PDF. This layout presents information on Short Term Assets, Global Financial Performance, Liquidity Ratios. It is also available for immediate download and adjustment. So, changes can be made in the color, design, graphics or any other component to create a unique layout.
Internal And External Business Environment Analysis Financial Dashboard For Business Impact Tracking Formats PDF
This slide shows financial dashboard for business impact tracking with key performance indicators like quick ratio, current ratio, monthly cash flow etc Deliver an awe inspiring pitch with this creative internal and external business environment analysis financial dashboard for business impact tracking formats pdf bundle. Topics like financial dashboard for business impact tracking can be discussed with this completely editable template. It is available for immediate download depending on the needs and requirements of the user.
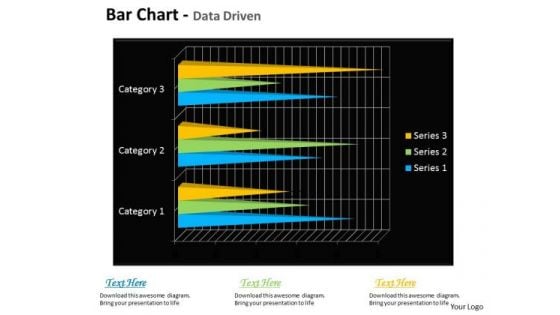
Quantitative Data Analysis Bar Chart For Financial Markets PowerPoint Templates
Draft It Out On Our quantitative data analysis bar chart for financial markets Powerpoint Templates . Give The Final Touches With Your Ideas.
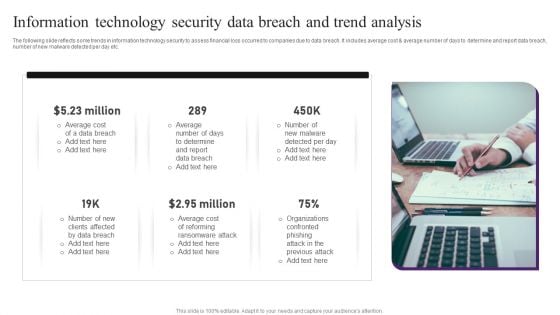
Information Technology Security Data Breach And Trend Analysis Professional PDF
The following slide reflects some trends in information technology security to assess financial loss occurred to companies due to data breach. It includes average cost and average number of days to determine and report data breach, number of new malware detected per day etc. Presenting Information Technology Security Data Breach And Trend Analysis Professional PDF to dispense important information. This template comprises six stages. It also presents valuable insights into the topics including Data Breach, Average Cost, Determine. This is a completely customizable PowerPoint theme that can be put to use immediately. So, download it and address the topic impactfully.
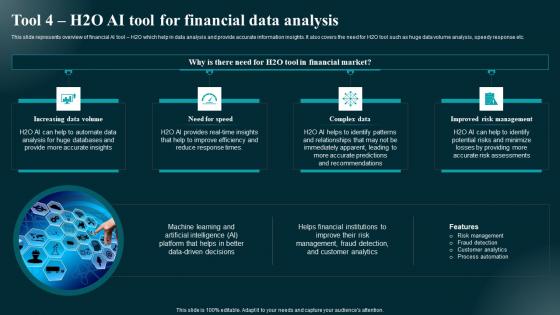
Tool 4 H2o AI Tool For Financial Data Analysis Applications And Impact Structure Pdf
This slide represents overview of financial AI tool H2O which help in data analysis and provide accurate information insights. It also covers the need for H2O tool such as huge data volume analysis, speedy response etc. Are you searching for a Tool 4 H2o AI Tool For Financial Data Analysis Applications And Impact Structure Pdf that is uncluttered, straightforward, and original Its easy to edit, and you can change the colors to suit your personal or business branding. For a presentation that expresses how much effort you have put in, this template is ideal With all of its features, including tables, diagrams, statistics, and lists, its perfect for a business plan presentation. Make your ideas more appealing with these professional slides. Download Tool 4 H2o AI Tool For Financial Data Analysis Applications And Impact Structure Pdf from Slidegeeks today. This slide represents overview of financial AI tool H2O which help in data analysis and provide accurate information insights. It also covers the need for H2O tool such as huge data volume analysis, speedy response etc.
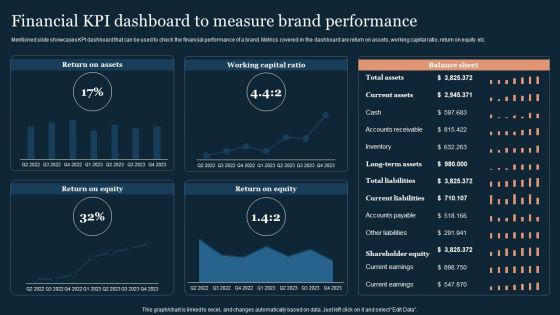
Guide To Develop And Estimate Brand Value Financial KPI Dashboard To Measure Brand Performance Formats PDF
Mentioned slide showcases KPI dashboard that can be used to check the financial performance of a brand. Metrics covered in the dashboard are return on assets, working capital ratio, return on equity etc.Coming up with a presentation necessitates that the majority of the effort goes into the content and the message you intend to convey. The visuals of a PowerPoint presentation can only be effective if it supplements and supports the story that is being told. Keeping this in mind our experts created Guide To Develop And Estimate Brand Value Financial KPI Dashboard To Measure Brand Performance Formats PDF to reduce the time that goes into designing the presentation. This way, you can concentrate on the message while our designers take care of providing you with the right template for the situation.
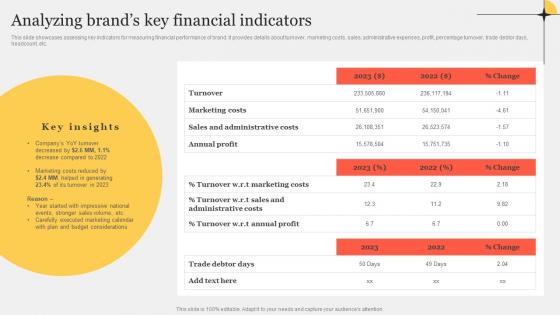
Analyzing Brands Key Financial Indicators Improving Customer Interaction Through Microsoft Pdf
This slide showcases assessing key indicators for measuring financial performance of brand. It provides details about turnover, marketing costs, sales, administrative expenses, profit, percentage turnover, trade debtor days, headcount, etc.Find highly impressive Analyzing Brands Key Financial Indicators Improving Customer Interaction Through Microsoft Pdf on Slidegeeks to deliver a meaningful presentation. You can save an ample amount of time using these presentation templates. No need to worry to prepare everything from scratch because Slidegeeks experts have already done a huge research and work for you. You need to download Analyzing Brands Key Financial Indicators Improving Customer Interaction Through Microsoft Pdf for your upcoming presentation. All the presentation templates are 100Precent editable and you can change the color and personalize the content accordingly. Download now. This slide showcases assessing key indicators for measuring financial performance of brand. It provides details about turnover, marketing costs, sales, administrative expenses, profit, percentage turnover, trade debtor days, headcount, etc.
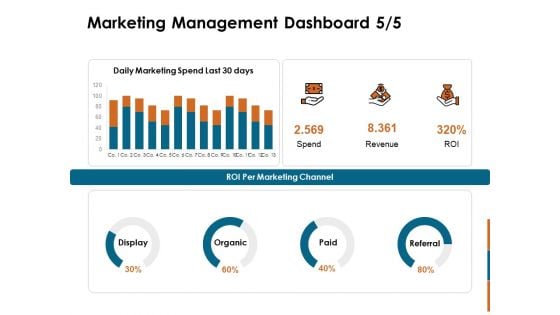
Key Statistics Of Marketing Marketing Management Dashboard Spend Ppt PowerPoint Presentation Portfolio Slide Portrait PDF
Deliver an awe-inspiring pitch with this creative key statistics of marketing marketing management dashboard spend ppt powerpoint presentation portfolio slide portrait pdf bundle. Topics like display, organic, paid, referral, roi per marketing channel, spend, revenue, roi can be discussed with this completely editable template. It is available for immediate download depending on the needs and requirements of the user.
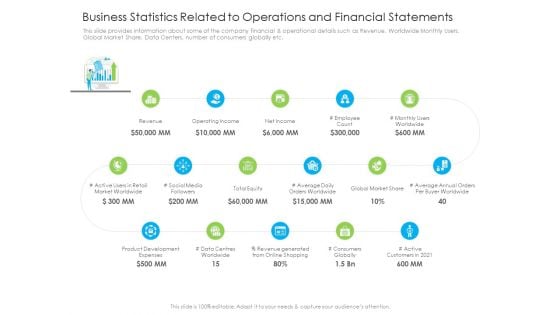
Business Statistics Related To Operations And Financial Statements Mockup PDF
This slide provides information about some of the company financial and operational details such as Revenue, Worldwide Monthly Users, Global Market Share, Data Centers, number of consumers globally etc. Deliver and pitch your topic in the best possible manner with this business statistics related to operations and financial statements mockup pdf. Use them to share invaluable insights on revenue, operating income, net income, global market share, social media and impress your audience. This template can be altered and modified as per your expectations. So, grab it now.
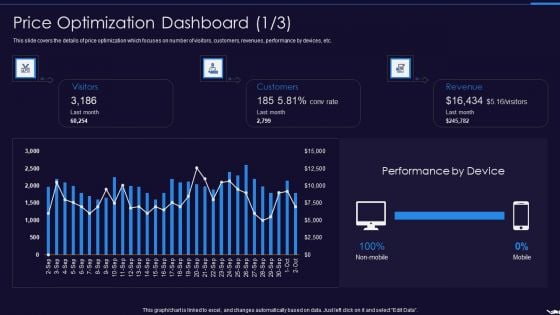
Optimize Marketing Pricing Price Optimization Dashboard Customers Graphics PDF
This slide covers the details of price optimization which focuses on number of visitors, customers, revenues, performance by devices, etc. Deliver and pitch your topic in the best possible manner with this optimize marketing pricing price optimization dashboard customers graphics pdf. Use them to share invaluable insights on visitors, customers, revenue and impress your audience. This template can be altered and modified as per your expectations. So, grab it now.
Wellness Management Content Ppt Icon Template PDF
Deliver an awe-inspiring pitch with this creative wellness management content ppt icon template pdf bundle. Topics like cost accounting, financial management, strategic planning, marketing, dashboard can be discussed with this completely editable template. It is available for immediate download depending on the needs and requirements of the user.
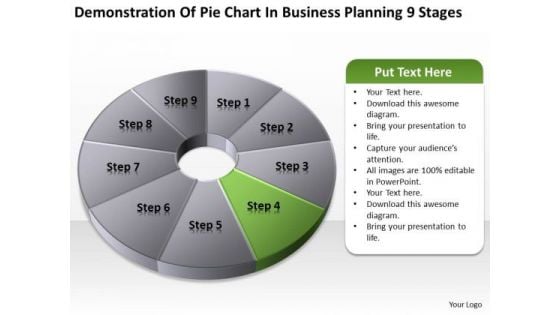
Pie Chart In Business Planning 9 Stages Ppt Plans For Free PowerPoint Slides
We present our pie chart in business planning 9 stages ppt plans for free PowerPoint Slides.Download and present our Process and Flows PowerPoint Templates because Our PowerPoint Templates and Slides provide you with a vast range of viable options. Select the appropriate ones and just fill in your text. Use our Circle Charts PowerPoint Templates because Our PowerPoint Templates and Slides will help you be quick off the draw. Just enter your specific text and see your points hit home. Download and present our Business PowerPoint Templates because It will mark the footprints of your journey. Illustrate how they will lead you to your desired destination. Download our Shapes PowerPoint Templates because You have gained great respect for your brilliant ideas. Use our PowerPoint Templates and Slides to strengthen and enhance your reputation. Use our Marketing PowerPoint Templates because Our PowerPoint Templates and Slides will generate and maintain the level of interest you desire. They will create the impression you want to imprint on your audience.Use these PowerPoint slides for presentations relating to Chart, pie, graph, wheel, vector, process, marketing, diagram, business, website, network, statistics, document, junction, plan, presentation, circle, brochure, data, stock, management, options, direction, design, company, navigation, financial, structure, button, goals. The prominent colors used in the PowerPoint template are Green, Gray, Black. Get on the boat with our Pie Chart In Business Planning 9 Stages Ppt Plans For Free PowerPoint Slides. Set sail for the port of success.
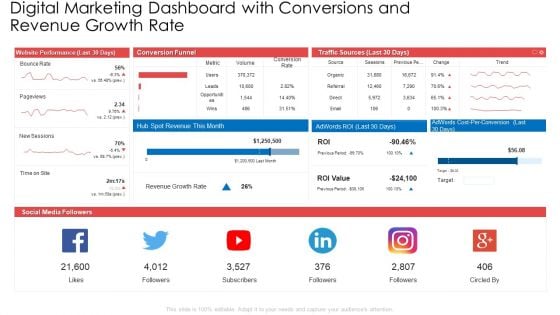
Digital Marketing Dashboard With Conversions And Revenue Growth Rate Ppt Outline Elements PDF
Deliver and pitch your topic in the best possible manner with this digital marketing dashboard with conversions and revenue growth rate ppt outline elements pdf. Use them to share invaluable insights on revenue, cost, growth, value and impress your audience. This template can be altered and modified as per your expectations. So, grab it now.

Business Executive Financial Summary Report
Slidegeeks is one of the best resources for PowerPoint templates. You can download easily and regulate Business Executive Financial Summary Report for your personal presentations from our wonderful collection. A few clicks is all it takes to discover and get the most relevant and appropriate templates. Use our Templates to add a unique zing and appeal to your presentation and meetings. All the slides are easy to edit and you can use them even for advertisement purposes. This slide showcase the executive financial summary report which includes the last four quarters EBITDA calculation and major expense budget variance. It includes elements such as cost of services, operating expenses, depreciation, advertisement, marketing etc.depreciation, advertisement, marketing etc. Presenting our well structured Business Executive Financial Summary Report. The topics discussed in this slide are Financial, Summary, Budget. This is an instantly available PowerPoint presentation that can be edited conveniently. Download it right away and captivate your audience
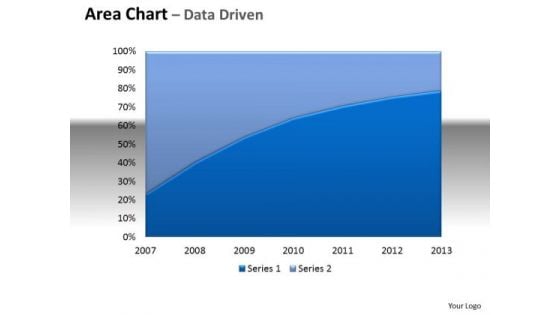
Financial Data Analysis Area Chart With Plotted Line Center PowerPoint Templates
Be The Doer With Our financial data analysis area chart with plotted line center Powerpoint Templates . Put Your Thoughts Into Practice.
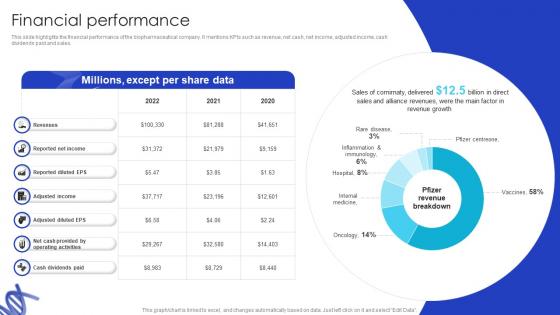
Financial Performance Biotech Firm Pitch Deck
This slide highlights the financial performance of the biopharmaceutical company. It mentions KPIs such as revenue, net cash, net income, adjusted income, cash dividends paid and sales. Present like a pro with Financial Performance Biotech Firm Pitch Deck. Create beautiful presentations together with your team, using our easy-to-use presentation slides. Share your ideas in real-time and make changes on the fly by downloading our templates. So whether you are in the office, on the go, or in a remote location, you can stay in sync with your team and present your ideas with confidence. With Slidegeeks presentation got a whole lot easier. Grab these presentations today. This slide highlights the financial performance of the biopharmaceutical company. It mentions KPIs such as revenue, net cash, net income, adjusted income, cash dividends paid and sales.

Financial Data Revelation To Varied Stakeholders Limitations Related To Financial Reporting Management Information PDF
This slide shows the limitations related to managing financial reports such as not provides full information, other sources, etc. This Financial Data Revelation To Varied Stakeholders Limitations Related To Financial Reporting Management Information PDF is perfect for any presentation, be it in front of clients or colleagues. It is a versatile and stylish solution for organizing your meetings. The Financial Data Revelation To Varied Stakeholders Limitations Related To Financial Reporting Management Information PDF features a modern design for your presentation meetings. The adjustable and customizable slides provide unlimited possibilities for acing up your presentation. Slidegeeks has done all the homework before launching the product for you. So, do not wait, grab the presentation templates today.

Financial Analyst Growth Chart Presentation Diagrams
This is a financial analyst growth chart presentation diagrams. This is a three stage process. The stages in this process are reporting, growth, analysis.
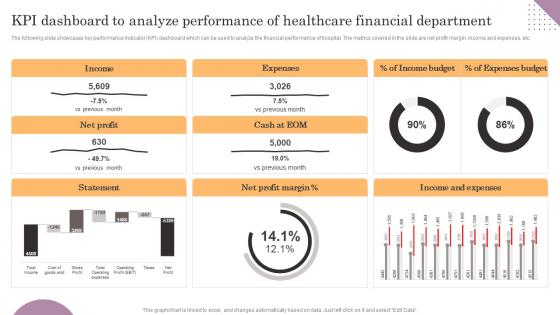
KPI Dashboard To Analyze Performance Of Healthcare General Management Introduction Pdf
The following slide showcases key performance indicator KPI dashboard which can be used to analyze the financial performance of hospital. The metrics covered in the slide are net profit margin, income and expenses, etc. Slidegeeks has constructed KPI Dashboard To Analyze Performance Of Healthcare General Management Introduction Pdf after conducting extensive research and examination. These presentation templates are constantly being generated and modified based on user preferences and critiques from editors. Here, you will find the most attractive templates for a range of purposes while taking into account ratings and remarks from users regarding the content. This is an excellent jumping-off point to explore our content and will give new users an insight into our top-notch PowerPoint Templates. The following slide showcases key performance indicator KPI dashboard which can be used to analyze the financial performance of hospital. The metrics covered in the slide are net profit margin, income and expenses, etc.
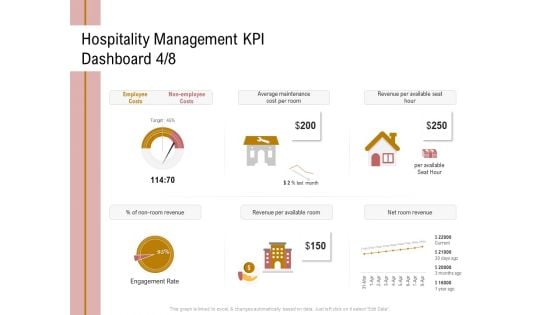
Action Plan Or Hospitality Industry Hospitality Management KPI Dashboard Employee Professional PDF
Presenting this set of slides with name action plan or hospitality industry hospitality management kpi dashboard employee professional pdf. The topics discussed in these slides are costs, maintenance, revenue, average. This is a completely editable PowerPoint presentation and is available for immediate download. Download now and impress your audience.
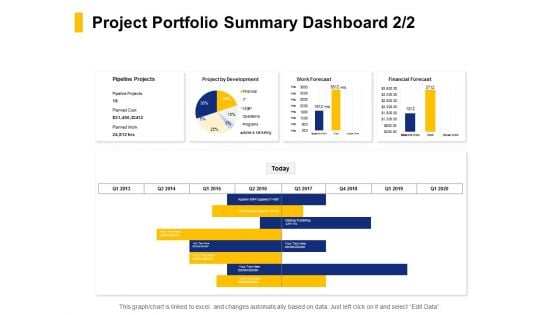
Project Portfolio Summary Dashboard Financial Ppt PowerPoint Presentation Outline Aids
Presenting this set of slides with name project portfolio summary dashboard financial ppt powerpoint presentation outline aids. The topics discussed in these slides are pipeline projects, project development, financial forecast. This is a completely editable PowerPoint presentation and is available for immediate download. Download now and impress your audience.
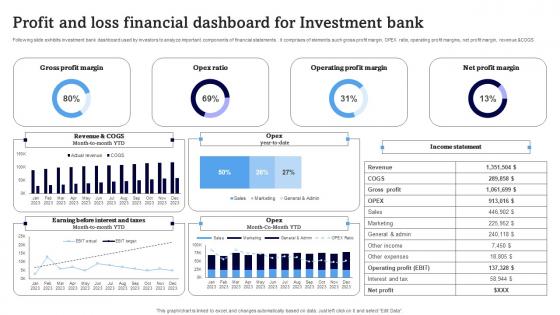
Profit And Loss Financial Dashboard For Investment Bank Download Pdf
Following slide exhibits investment bank dashboard used by investors to analyze important components of financial statements . it comprises of elements such gross profit margin, OPEX ratio, operating profit margins, net profit margin, revenue andCOGS Pitch your topic with ease and precision using this Profit And Loss Financial Dashboard For Investment Bank Download Pdf. This layout presents information on Gross Profit Margin, Opex Ratio, Operating Profit Margin. It is also available for immediate download and adjustment. So, changes can be made in the color, design, graphics or any other component to create a unique layout. Following slide exhibits investment bank dashboard used by investors to analyze important components of financial statements . it comprises of elements such gross profit margin, OPEX ratio, operating profit margins, net profit margin, revenue andCOGS
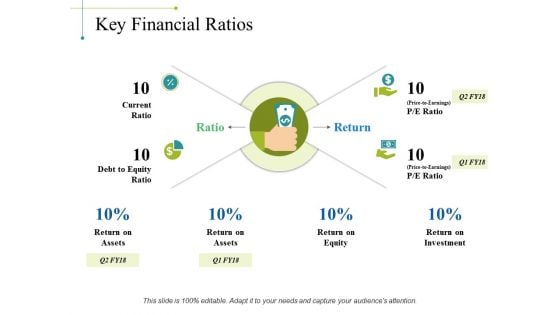
Key Financial Ratios Ppt PowerPoint Presentation Guidelines
This is a key financial ratios ppt powerpoint presentation guidelines. This is a four stage process. The stages in this process are current ratio, debt to equity ratio, ratio, return, return on assets.
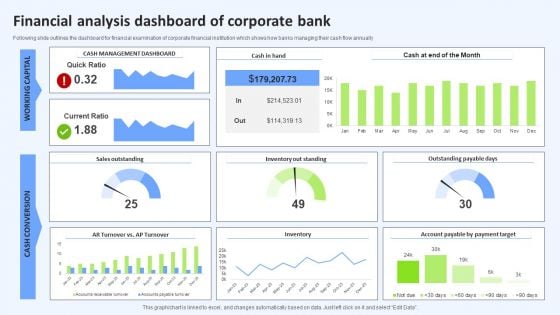
Financial Analysis Dashboard Of Corporate Bank Mockup PDF
Following slide outlines the dashboard for financial examination of corporate financial institution which shows how banks managing their cash flow annually Pitch your topic with ease and precision using this Financial Analysis Dashboard Of Corporate Bank Mockup PDF. This layout presents information on Month, Current Ratio, Inventory. It is also available for immediate download and adjustment. So, changes can be made in the color, design, graphics or any other component to create a unique layout.
Multiple Ways To Gather Financial Strategies To Develop Effective Ppt Example Fin SS V
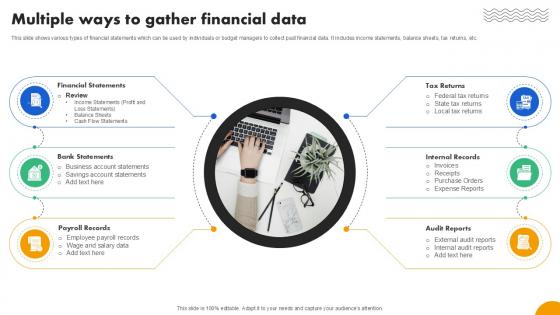
This slide shows various types of financial statements which can be used by individuals or budget managers to collect past financial data. It includes income statements, balance sheets, tax returns, etc. Retrieve professionally designed Multiple Ways To Gather Financial Strategies To Develop Effective Ppt Example Fin SS V to effectively convey your message and captivate your listeners. Save time by selecting pre-made slideshows that are appropriate for various topics, from business to educational purposes. These themes come in many different styles, from creative to corporate, and all of them are easily adjustable and can be edited quickly. Access them as PowerPoint templates or as Google Slides themes. You do not have to go on a hunt for the perfect presentation because Slidegeeks got you covered from everywhere. This slide shows various types of financial statements which can be used by individuals or budget managers to collect past financial data. It includes income statements, balance sheets, tax returns, etc.
Applications Of Natural Language Generation In Financial Services AI Content Creation It Ppt Sample
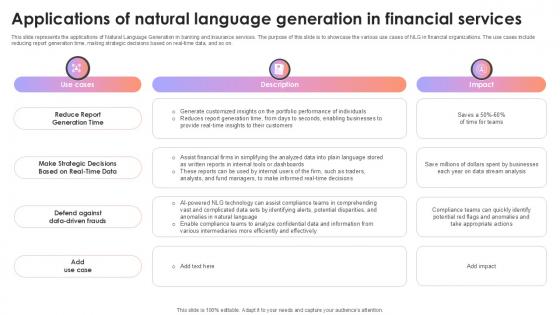
This slide represents the applications of Natural Language Generation in banking and insurance services. The purpose of this slide is to showcase the various use cases of NLG in financial organizations. The use cases include reducing report generation time, making strategic decisions based on real-time data, and so on. Create an editable Applications Of Natural Language Generation In Financial Services AI Content Creation It Ppt Sample that communicates your idea and engages your audience. Whether you are presenting a business or an educational presentation, pre-designed presentation templates help save time. Applications Of Natural Language Generation In Financial Services AI Content Creation It Ppt Sample is highly customizable and very easy to edit, covering many different styles from creative to business presentations. Slidegeeks has creative team members who have crafted amazing templates. So, go and get them without any delay. This slide represents the applications of Natural Language Generation in banking and insurance services. The purpose of this slide is to showcase the various use cases of NLG in financial organizations. The use cases include reducing report generation time, making strategic decisions based on real-time data, and so on.
Key Financial Assumptions For Retail Pharmacy Business Plan Go To Market Strategy Icons Pdf
This slide provides a glimpse of important financial assumptions that are to be made while setting retail pharmacy store in terms of income, expense, and balance sheet. The computations are based on market trends and conditions prevailing in the pharmacy industry. This modern and well arranged Key Financial Assumptions For Retail Pharmacy Business Plan Go To Market Strategy Icons Pdf provides lots of creative possibilities. It is very simple to customize and edit with the Powerpoint Software. Just drag and drop your pictures into the shapes. All facets of this template can be edited with Powerpoint, no extra software is necessary. Add your own material, put your images in the places assigned for them, adjust the colors, and then you can show your slides to the world, with an animated slide included. This slide provides a glimpse of important financial assumptions that are to be made while setting retail pharmacy store in terms of income, expense, and balance sheet. The computations are based on market trends and conditions prevailing in the pharmacy industry.
Investment Project KPI Dashboard For Production Analysis Ideas PDF
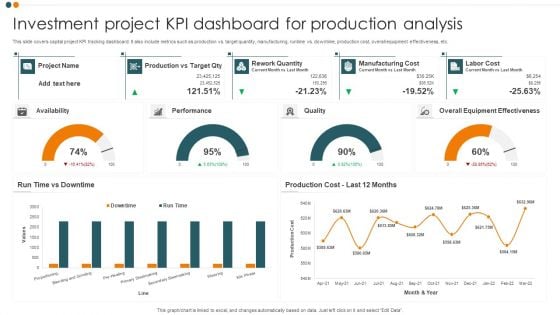
This slide covers capital project KPI tracking dashboard. It also include metrics such as production vs. target quantity, manufacturing, runtime vs. downtime, production cost, overall equipment effectiveness, etc. Showcasing this set of slides titled Investment Project KPI Dashboard For Production Analysis Ideas PDF. The topics addressed in these templates are Project, Performance, Quality, Overall Equipment Effectiveness. All the content presented in this PPT design is completely editable. Download it and make adjustments in color, background, font etc. as per your unique business setting.
IT Cost Reduction Strategies Determine IT Department Cost Management Dashboard Guidelines PDF
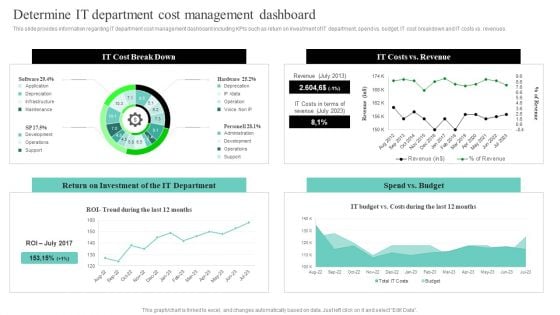
This slide provides information regarding IT department cost management dashboard including KPIs such as return on investment of IT department, spend vs. budget, IT cost breakdown and IT costs vs. revenues. Get a simple yet stunning designed IT Cost Reduction Strategies Determine IT Department Cost Management Dashboard Guidelines PDF. It is the best one to establish the tone in your meetings. It is an excellent way to make your presentations highly effective. So, download this PPT today from Slidegeeks and see the positive impacts. Our easy-to-edit IT Cost Reduction Strategies Determine IT Department Cost Management Dashboard Guidelines PDF can be your go-to option for all upcoming conferences and meetings. So, what are you waiting for Grab this template today.
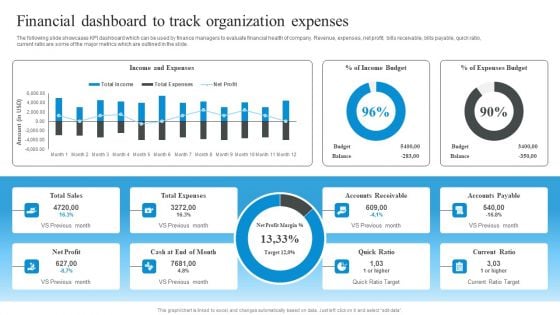
Market Evaluation Of IT Industry Financial Dashboard To Track Organization Expenses Clipart PDF
The following slide showcases KPI dashboard which can be used by finance managers to evaluate financial health of company. Revenue, expenses, net profit, bills receivable, bills payable, quick ratio, current ratio are some of the major metrics which are outlined in the slide. Do you have an important presentation coming up Are you looking for something that will make your presentation stand out from the rest Look no further than Market Evaluation Of IT Industry Financial Dashboard To Track Organization Expenses Clipart PDF. With our professional designs, you can trust that your presentation will pop and make delivering it a smooth process. And with Slidegeeks, you can trust that your presentation will be unique and memorable. So why wait Grab Market Evaluation Of IT Industry Financial Dashboard To Track Organization Expenses Clipart PDF today and make your presentation stand out from the rest.
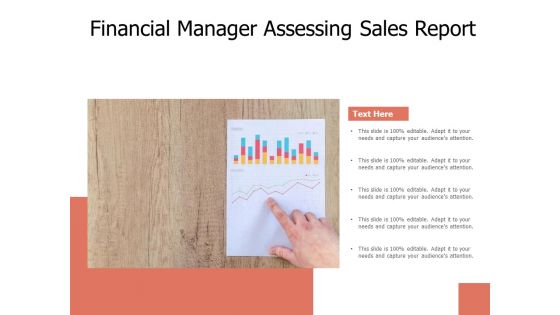
Financial Manager Assessing Sales Report Ppt PowerPoint Presentation Portfolio Slide Download PDF
Presenting this set of slides with name financial manager assessing sales report ppt powerpoint presentation portfolio slide download pdf. This is a one stage process. The stage in this process is financial manager assessing sales report. This is a completely editable PowerPoint presentation and is available for immediate download. Download now and impress your audience.
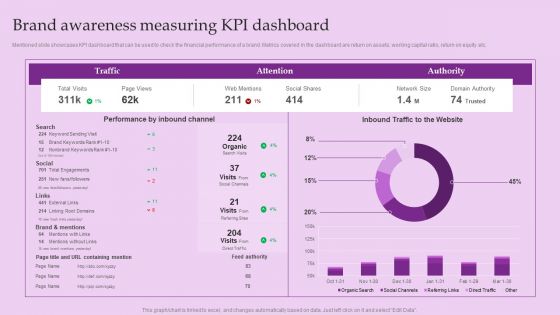
Brand Awareness Measuring Kpi Dashboard Brand And Equity Evaluation Techniques Ideas PDF
Mentioned slide showcases KPI dashboard that can be used to check the financial performance of a brand. Metrics covered in the dashboard are return on assets, working capital ratio, return on equity etc.From laying roadmaps to briefing everything in detail, our templates are perfect for you. You can set the stage with your presentation slides. All you have to do is download these easy-to-edit and customizable templates. Brand Awareness Measuring Kpi Dashboard Brand And Equity Evaluation Techniques Ideas PDF will help you deliver an outstanding performance that everyone would remember and praise you for. Do download this presentation today.

KPI Dashboard To Measure Financial Institution Industry Revenue Summary PDF
Pitch your topic with ease and precision using this KPI Dashboard To Measure Financial Institution Industry Revenue Summary PDF. This layout presents information on Measure Financial, Institution Industry . It is also available for immediate download and adjustment. So, changes can be made in the color, design, graphics or any other component to create a unique layout.
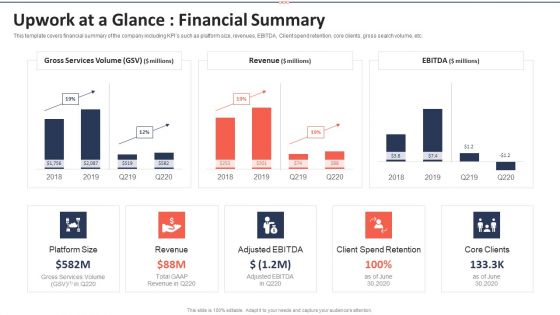
Upwork Investor Financing Upwork At A Glance Financial Summary Slides PDF
This template covers financial summary of the company including KPIs such as platform size, revenues, EBITDA, Client spend retention, core clients, gross search volume, etc. Deliver and pitch your topic in the best possible manner with this Upwork Investor Financing Upwork At A Glance Financial Summary Slides PDF. Use them to share invaluable insights on revenue, services, retention, core clients and impress your audience. This template can be altered and modified as per your expectations. So, grab it now.


 Continue with Email

 Home
Home


