Dashboards Construction
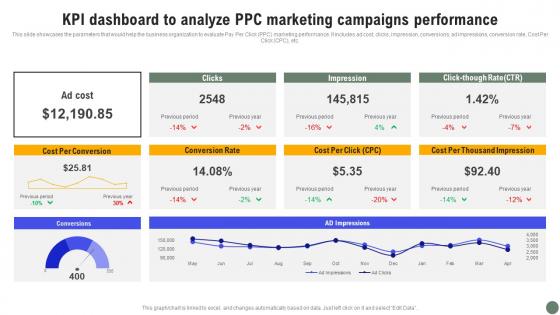
KPI Dashboard To Analyze PPC Exhaustive Guide Of Pay Per Click Advertising Initiatives Inspiration Pdf
This slide showcases the parameters that would help the business organization to evaluate Pay Per Click PPC marketing performance. It includes ad cost, clicks, impression, conversions, ad impressions, conversion rate, Cost Per Click CPC, etc. Formulating a presentation can take up a lot of effort and time, so the content and message should always be the primary focus. The visuals of the PowerPoint can enhance the presenters message, so our KPI Dashboard To Analyze PPC Exhaustive Guide Of Pay Per Click Advertising Initiatives Inspiration Pdf was created to help save time. Instead of worrying about the design, the presenter can concentrate on the message while our designers work on creating the ideal templates for whatever situation is needed. Slidegeeks has experts for everything from amazing designs to valuable content, we have put everything into KPI Dashboard To Analyze PPC Exhaustive Guide Of Pay Per Click Advertising Initiatives Inspiration Pdf This slide showcases the parameters that would help the business organization to evaluate Pay Per Click PPC marketing performance. It includes ad cost, clicks, impression, conversions, ad impressions, conversion rate, Cost Per Click CPC, etc.
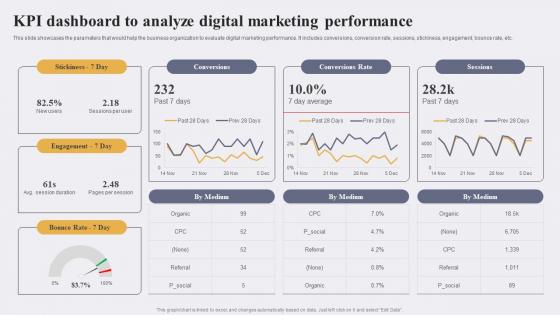
KPI Dashboard To Analyze Digital Marketing Enhancing Conversion Rate By Leveraging Background Pdf
This slide showcases the parameters that would help the business organization to evaluate digital marketing performance. It includes conversions, conversion rate, sessions, stickiness, engagement, bounce rate, etc.If you are looking for a format to display your unique thoughts, then the professionally designed KPI Dashboard To Analyze Digital Marketing Enhancing Conversion Rate By Leveraging Background Pdf is the one for you. You can use it as a Google Slides template or a PowerPoint template. Incorporate impressive visuals, symbols, images, and other charts. Modify or reorganize the text boxes as you desire. Experiment with shade schemes and font pairings. Alter, share or cooperate with other people on your work. Download KPI Dashboard To Analyze Digital Marketing Enhancing Conversion Rate By Leveraging Background Pdf and find out how to give a successful presentation. Present a perfect display to your team and make your presentation unforgettable. This slide showcases the parameters that would help the business organization to evaluate digital marketing performance. It includes conversions, conversion rate, sessions, stickiness, engagement, bounce rate, etc.
Agile Project Playbook Presentation Agile Project Management Activities Tracking Dashboard Tasks Designs PDF
This slide provides information regarding the dashboard which will help team in managing different activities associated to agile projects and keep track on the time, task summary, etc. Deliver and pitch your topic in the best possible manner with this agile project playbook presentation agile project management activities tracking dashboard tasks designs pdf. Use them to share invaluable insights on agile project management activities tracking dashboard and impress your audience. This template can be altered and modified as per your expectations. So, grab it now.
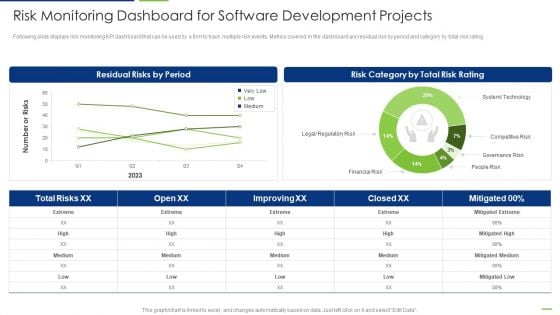
Professional Scrum Master Risk Monitoring Dashboard For Software Development Projects Designs PDF
Following slide displays risk monitoring KPI dashboard that can be used by a firm to track multiple risk events. Metrics covered in the dashboard are residual risk by period and category by total risk rating. Deliver an awe inspiring pitch with this creative Professional Scrum Master Risk Monitoring Dashboard For Software Development Projects Designs PDF bundle. Topics like Residual Risks By Period, Risk Category By Total Risk Rating, Total Risks can be discussed with this completely editable template. It is available for immediate download depending on the needs and requirements of the user.
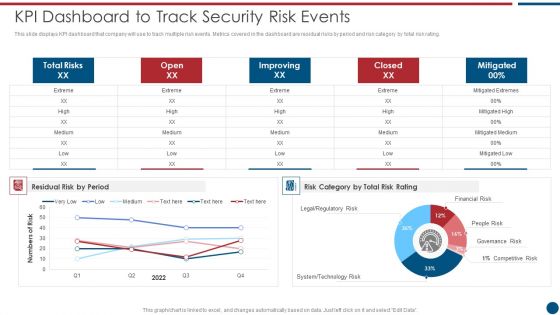
Risk Based Procedures To IT Security KPI Dashboard To Track Security Risk Events Designs PDF
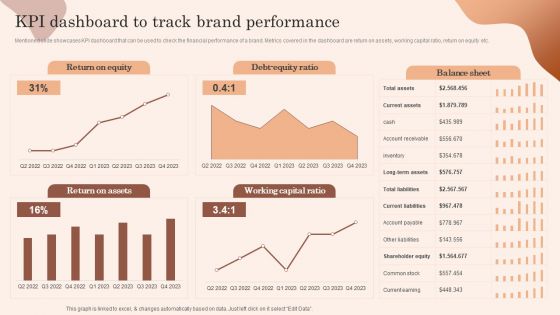
Building Market Brand Leadership Strategies Kpi Dashboard To Track Brand Performance Designs PDF
Mentioned slide showcases KPI dashboard that can be used to check the financial performance of a brand. Metrics covered in the dashboard are return on assets, working capital ratio, return on equity etc. There are so many reasons you need a Building Market Brand Leadership Strategies Kpi Dashboard To Track Brand Performance Designs PDF. The first reason is you cannot spend time making everything from scratch, Thus, Slidegeeks has made presentation templates for you too. You can easily download these templates from our website easily.
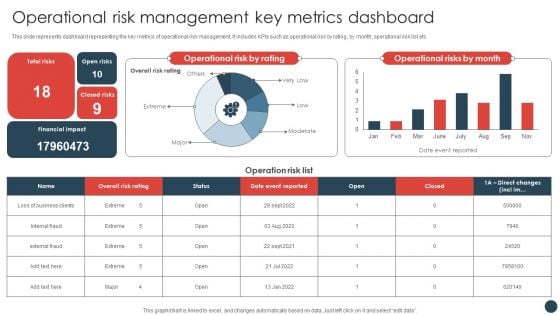
Strategic Risk Management Plan Operational Risk Management Key Metrics Dashboard Structure PDF
This slide represents dashboard representing the key metrics of operational risk management. It includes KPIs such as operational risk by rating, by month, operational risk list etc.Create an editable Strategic Risk Management Plan Operational Risk Management Key Metrics Dashboard Structure PDF that communicates your idea and engages your audience. Whether you are presenting a business or an educational presentation, pre-designed presentation templates help save time. Strategic Risk Management Plan Operational Risk Management Key Metrics Dashboard Structure PDF is highly customizable and very easy to edit, covering many different styles from creative to business presentations. Slidegeeks has creative team members who have crafted amazing templates. So, go and get them without any delay.
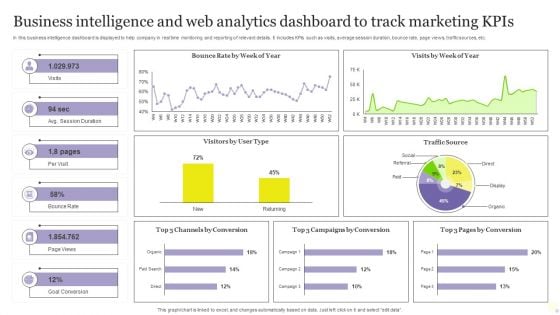
Business Intelligence And Web Analytics Dashboard To Track Marketing Kpis Inspiration PDF
In this business intelligence dashboard is displayed to help company in real time monitoring and reporting of relevant details. It includes KPIs such as visits, average session duration, bounce rate, page views, traffic sources, etc. Showcasing this set of slides titled Business Intelligence And Web Analytics Dashboard To Track Marketing Kpis Inspiration PDF. The topics addressed in these templates are Goal Conversion, Track Marketing Kpis, Web Analytics Dashboard. All the content presented in this PPT design is completely editable. Download it and make adjustments in color, background, font etc. as per your unique business setting.
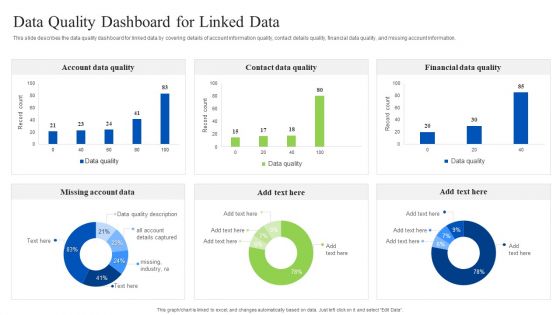
Linked Data Visualization Data Quality Dashboard For Linked Data Pictures PDF
This slide describes the data quality dashboard for linked data by covering details of account information quality, contact details quality, financial data quality, and missing account information. Create an editable Linked Data Visualization Data Quality Dashboard For Linked Data Pictures PDF that communicates your idea and engages your audience. Whether youre presenting a business or an educational presentation, pre-designed presentation templates help save time. Linked Data Visualization Data Quality Dashboard For Linked Data Pictures PDF is highly customizable and very easy to edit, covering many different styles from creative to business presentations. Slidegeeks has creative team members who have crafted amazing templates. So, go and get them without any delay.
Dashboard For Tracking Mobile Commercial Banking Marketing Campaign Performance Slides PDF
This slide depicts a dashboard for tracking performance of marketing campaigns of mobile banking across paid media channels. The key performing indicators are client acquisition metrics, client conversion metrics, expense metrics among many others. Showcasing this set of slides titled Dashboard For Tracking Mobile Commercial Banking Marketing Campaign Performance Slides PDF. The topics addressed in these templates are Dashboard For Tracking Mobile, Commercial Banking, Marketing Campaign Performance. All the content presented in this PPT design is completely editable. Download it and make adjustments in color, background, font etc. as per your unique business setting.
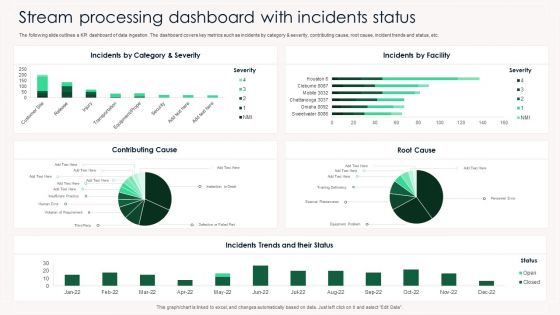
Stream Processing Dashboard With Incidents Status Ppt PowerPoint Presentation Gallery Portrait PDF
The following slide outlines a KPI dashboard of data ingestion. The dashboard covers key metrics such as incidents by category and severity, contributing cause, root cause, incident trends and status, etc. Showcasing this set of slides titled Stream Processing Dashboard With Incidents Status Ppt PowerPoint Presentation Gallery Portrait PDF. The topics addressed in these templates are Incidens, Category And Severity, Incidents By Facility, Contributing Cause. All the content presented in this PPT design is completely editable. Download it and make adjustments in color, background, font etc. as per your unique business setting.
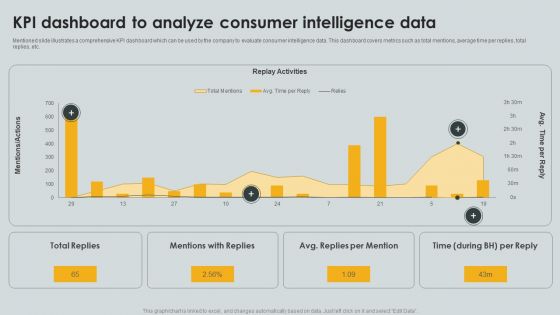
KPI Dashboard To Analyze Consumer Intelligence Data Ppt PowerPoint Presentation File Portfolio PDF
Mentioned slide illustrates a comprehensive KPI dashboard which can be used by the company to evaluate consumer intelligence data. This dashboard covers metrics such as total mentions, average time per replies, total replies, etc. Pitch your topic with ease and precision using this KPI Dashboard To Analyze Consumer Intelligence Data Ppt PowerPoint Presentation File Portfolio PDF. This layout presents information on Replay Activities, Total Replies, Mentions Replies. It is also available for immediate download and adjustment. So, changes can be made in the color, design, graphics or any other component to create a unique layout.
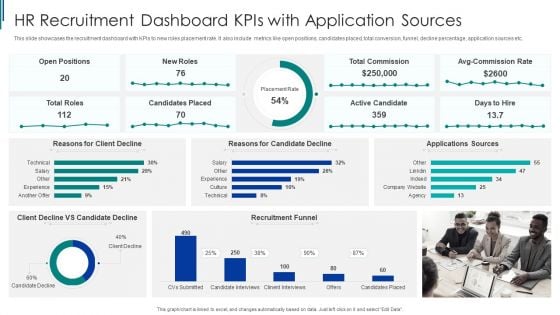
HR Recruitment Dashboard Kpis With Application Sources Ppt Pictures Styles PDF
This slide showcases the recruitment dashboard with KPIs to new roles placement rate. It also include metrics like open positions, candidates placed, total conversion, funnel, decline percentage, application sources etc. Pitch your topic with ease and precision using this HR Recruitment Dashboard Kpis With Application Sources Ppt Pictures Styles PDF. This layout presents information on Recruitment Funnel, HR Recruitment, Dashboard Kpis. It is also available for immediate download and adjustment. So, changes can be made in the color, design, graphics or any other component to create a unique layout.
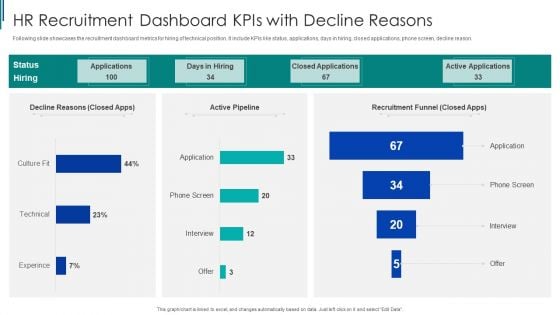
HR Recruitment Dashboard Kpis With Decline Reasons Ppt Pictures Example Introduction PDF
Following slide showcases the recruitment dashboard metrics for hiring of technical position. It include KPIs like status, applications, days in hiring, closed applications, phone screen, decline reason. Showcasing this set of slides titled HR Recruitment Dashboard Kpis With Decline Reasons Ppt Pictures Example Introduction PDF. The topics addressed in these templates are Recruitment Funnel, HR Recruitment, Dashboard Kpis. All the content presented in this PPT design is completely editable. Download it and make adjustments in color, background, font etc. as per your unique business setting.
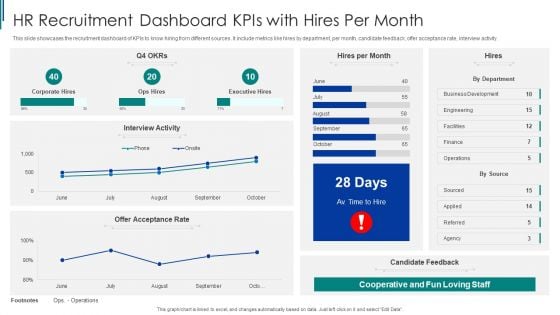
HR Recruitment Dashboard Kpis With Hires Per Month Ppt Slides Portfolio PDF
This slide showcases the recruitment dashboard of KPIs to know hiring from different sources. It include metrics like hires by department, per month, candidate feedback, offer acceptance rate, interview activity. Pitch your topic with ease and precision using this HR Recruitment Dashboard Kpis With Hires Per Month Ppt Slides Portfolio PDF. This layout presents information on HR Recruitment, Dashboard Kpis, Business Development. It is also available for immediate download and adjustment. So, changes can be made in the color, design, graphics or any other component to create a unique layout.
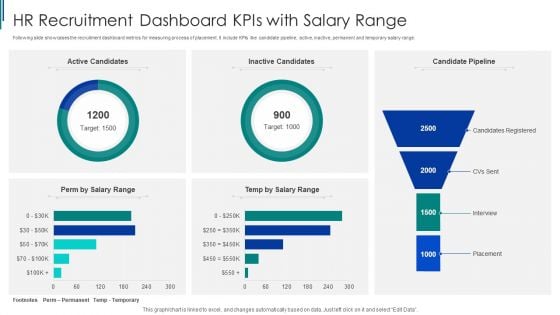
HR Recruitment Dashboard Kpis With Salary Range Ppt Inspiration Rules PDF
Following slide showcases the recruitment dashboard metrics for measuring process of placement. It include KPIs like candidate pipeline, active, inactive, permanent and temporary salary range. Pitch your topic with ease and precision using this HR Recruitment Dashboard Kpis With Salary Range Ppt Inspiration Rules PDF. This layout presents information on HR Recruitment, Dashboard Kpis, Salary Range. It is also available for immediate download and adjustment. So, changes can be made in the color, design, graphics or any other component to create a unique layout.
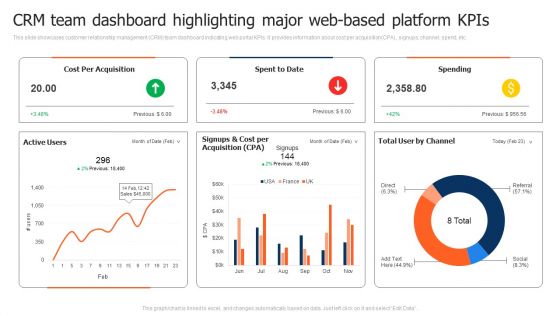
CRM Team Dashboard Highlighting Major Web Based Platform Kpis Template PDF
This slide showcases customer relationship management CRM team dashboard indicating web portal KPIs. It provides information about cost per acquisition CPA, signups, channel, spend, etc. Pitch your topic with ease and precision using this CRM Team Dashboard Highlighting Major Web Based Platform Kpis Template PDF. This layout presents information on CRM Team Dashboard Highlighting, Web Based Platform Kpis. It is also available for immediate download and adjustment. So, changes can be made in the color, design, graphics or any other component to create a unique layout.
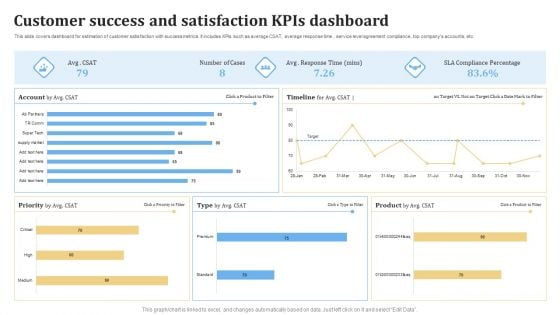
Customer Success And Satisfaction KPIS Dashboard Ppt PowerPoint Presentation Outline Visuals PDF
This slide covers dashboard for estimation of customer satisfaction with success metrics. It includes KPIs such as average CSAT, average response time , service level agreement compliance, top companys accounts, etc. Pitch your topic with ease and precision using this Customer Success And Satisfaction KPIS Dashboard Ppt PowerPoint Presentation Outline Visuals PDF. This layout presents information on Customer Success, Satisfaction KPIs Dashboard. It is also available for immediate download and adjustment. So, changes can be made in the color, design, graphics or any other component to create a unique layout.
Youtube Marketing Dashboard Highlighting Traffic Source And Average Views Icons PDF
This slide showcases the youtube marketing dashboard which includes subscriber gained vs loss list which includes traffic sources and lasted uploaded videos data.Create an editable Youtube Marketing Dashboard Highlighting Traffic Source And Average Views Icons PDF that communicates your idea and engages your audience. Whether you are presenting a business or an educational presentation, pre-designed presentation templates help save time. Youtube Marketing Dashboard Highlighting Traffic Source And Average Views Icons PDF is highly customizable and very easy to edit, covering many different styles from creative to business presentations. Slidegeeks has creative team members who have crafted amazing templates. So, go and get them without any delay.
HR Recruitment Dashboard Kpis With Recruitment Cost Ppt Inspiration Icons PDF
This slide showcases the recruitment dashboard of company of Hr department. It include time to hire days, cost, source, department, funnel no. of applications, male female ratio. Showcasing this set of slides titled HR Recruitment Dashboard Kpis With Recruitment Cost Ppt Inspiration Icons PDF. The topics addressed in these templates are Recruitment Funnel, Operational Dashboard, Application Date. All the content presented in this PPT design is completely editable. Download it and make adjustments in color, background, font etc. as per your unique business setting.

KPI Analytics Dashboard With Sourcing Raw Material Cycle Time Inspiration PDF
Following slide shows the key performance indicator KPI dashboard which will assist corporates to effectively monitor procurement process. The metrics are number of suppliers, contract compliance, average procurement cycle time, etc. Showcasing this set of slides titled KPI Analytics Dashboard With Sourcing Raw Material Cycle Time Inspiration PDF. The topics addressed in these templates are Kpi Analytics Dashboard, Sourcing Raw Material, Cycle Time. All the content presented in this PPT design is completely editable. Download it and make adjustments in color, background, font etc. as per your unique business setting.
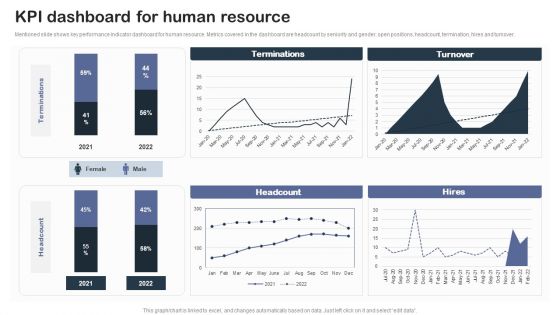
Staff Succession Planning And Development Strategy Kpi Dashboard For Human Clipart PDF
Mentioned slide shows key performance indicator dashboard for human resource. Metrics covered in the dashboard are headcount by seniority and gender, open positions, headcount, termination, hires and turnover.If your project calls for a presentation, then Slidegeeks is your go-to partner because we have professionally designed, easy-to-edit templates that are perfect for any presentation. After downloading, you can easily edit Staff Succession Planning And Development Strategy Kpi Dashboard For Human Clipart PDF and make the changes accordingly. You can rearrange slides or fill them with different images. Check out all the handy templates.
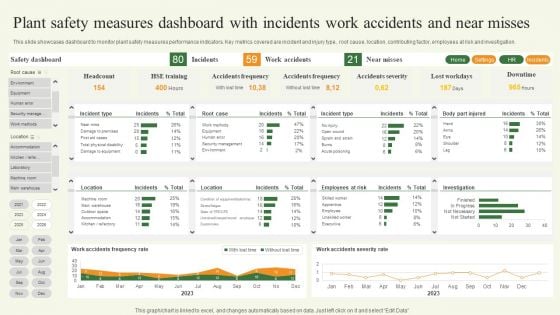
Plant Safety Measures Dashboard With Incidents Work Accidents And Near Misses Template PDF
This slide showcases dashboard to monitor plant safety measures performance indicators. Key metrics covered are incident and injury type, root cause, location, contributing factor, employees at risk and investigation. Pitch your topic with ease and precision using this Plant Safety Measures Dashboard With Incidents Work Accidents And Near Misses Template PDF. This layout presents information on Plant Safety Measures Dashboard, Incidents Work Accidents. It is also available for immediate download and adjustment. So, changes can be made in the color, design, graphics or any other component to create a unique layout.
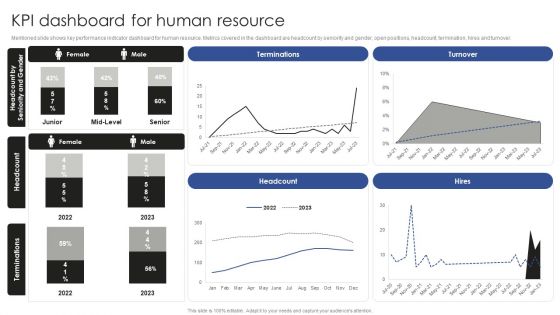
Talent Administration And Succession KPI Dashboard For Human Resource Rules PDF
Mentioned slide shows key performance indicator dashboard for human resource. Metrics covered in the dashboard are headcount by seniority and gender, open positions, headcount, termination, hires and turnover. If your project calls for a presentation, then Slidegeeks is your go-to partner because we have professionally designed, easy-to-edit templates that are perfect for any presentation. After downloading, you can easily edit Talent Administration And Succession KPI Dashboard For Human Resource Rules PDF and make the changes accordingly. You can rearrange slides or fill them with different images. Check out all the handy templates
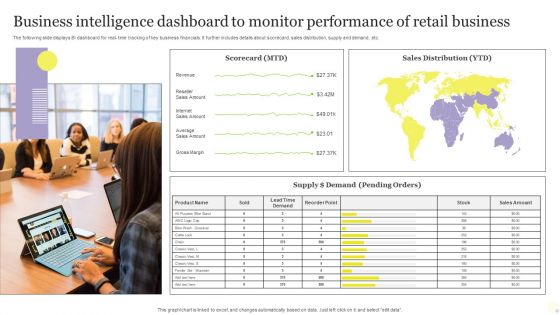
Business Intelligence Dashboard To Monitor Performance Of Retail Business Infographics PDF
The following slide displays BI dashboard for real time tracking of key business financials. It further includes details about scorecard, sales distribution, supply and demand, etc. Pitch your topic with ease and precision using this Business Intelligence Dashboard To Monitor Performance Of Retail Business Infographics PDF. This layout presents information on Business Intelligence Dashboard, Monitor Performance, Retail Business. It is also available for immediate download and adjustment. So, changes can be made in the color, design, graphics or any other component to create a unique layout.
Monthly Sales Reporting And Projections Dashboard Icon Ppt Icon Clipart Images PDF
Persuade your audience using this Monthly Sales Reporting And Projections Dashboard Icon Ppt Icon Clipart Images PDF. This PPT design covers three stages, thus making it a great tool to use. It also caters to a variety of topics including Monthly Sale,s Reporting And Projections, Dashboard Icon. Download this PPT design now to present a convincing pitch that not only emphasizes the topic but also showcases your presentation skills.
Staff Training Effectiveness Tracking Dashboard Techniques For Crafting Killer Summary PDF
This slide provides information regarding workforce training effectiveness monitoring dashboard. The dashboard includes details such as training cost, cost per participant, number of participants, hours of training, etc. The Staff Training Effectiveness Tracking Dashboard Techniques For Crafting Killer Summary PDF is a compilation of the most recent design trends as a series of slides. It is suitable for any subject or industry presentation, containing attractive visuals and photo spots for businesses to clearly express their messages. This template contains a variety of slides for the user to input data, such as structures to contrast two elements, bullet points, and slides for written information. Slidegeeks is prepared to create an impression.
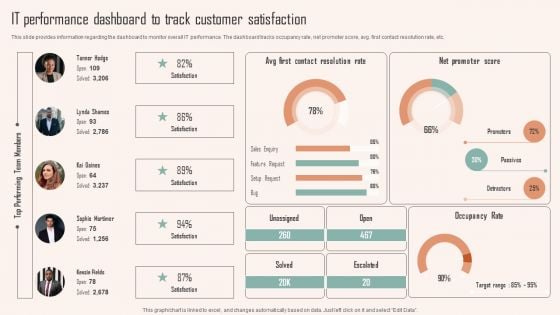
IT Performance Dashboard To Track Customer Satisfaction Ppt PowerPoint Presentation File Styles PDF
This slide provides information regarding the dashboard to monitor overall IT performance. The dashboard tracks occupancy rate, net promoter score, avg. first contact resolution rate, etc. The IT Performance Dashboard To Track Customer Satisfaction Ppt PowerPoint Presentation File Styles PDF is a compilation of the most recent design trends as a series of slides. It is suitable for any subject or industry presentation, containing attractive visuals and photo spots for businesses to clearly express their messages. This template contains a variety of slides for the user to input data, such as structures to contrast two elements, bullet points, and slides for written information. Slidegeeks is prepared to create an impression.
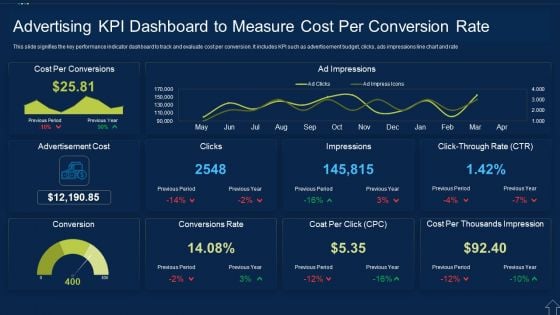
Advertising KPI Dashboard To Measure Cost Per Conversion Rate Themes PDF
This slide signifies the key performance indicator dashboard to track and evaluate cost per conversion. It includes KPI such as advertisement budget, clicks, ads impressions line chart and rate Showcasing this set of slides titled Advertising KPI Dashboard To Measure Cost Per Conversion Rate Themes PDF The topics addressed in these templates are Advertising Kpi Dashboard To Measure Cost Per Conversion Rate All the content presented in this PPT design is completely editable. Download it and make adjustments in color, background, font etc. as per your unique business setting.
KPI Dashboard For Tracking Commercial Banking And Financial Activities Download PDF
This slide depicts a dashboard for tracking the banking and financial activities of a business enterprise to measure the income and expenses. The key performing indicators are business accounts, paid, pending and cancelled transactions etc. Pitch your topic with ease and precision using this KPI Dashboard For Tracking Commercial Banking And Financial Activities Download PDF. This layout presents information on KPI Dashboard, Tracking Commercial Banking, Financial Activities. It is also available for immediate download and adjustment. So, changes can be made in the color, design, graphics or any other component to create a unique layout.
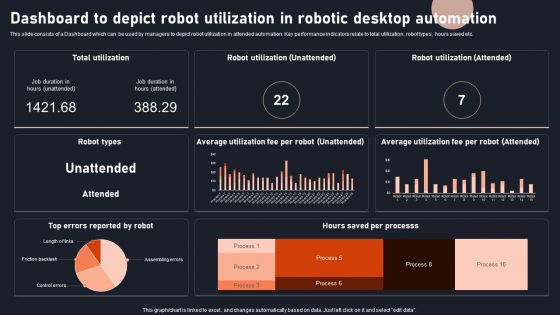
Dashboard To Depict Robot Utilization In Robotic Desktop Automation Download PDF
This slide consists of a Dashboard which can be used by managers to depict robot utilization in attended automation. Key performance indicators relate to total utilization, robot types, hours saved etc. Pitch your topic with ease and precision using this Dashboard To Depict Robot Utilization In Robotic Desktop Automation Download PDF. This layout presents information on Dashboard, Depict Robot Utilization, Robotic Desktop Automation. It is also available for immediate download and adjustment. So, changes can be made in the color, design, graphics or any other component to create a unique layout.
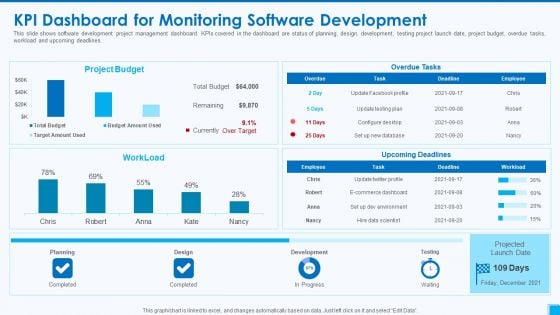
Devops Tools And Configuration IT Kpi Dashboard For Monitoring Software Development Slides PDF
This slide shows software development project management dashboard. KPIs covered in the dashboard are status of planning, design, development, testing project launch date, project budget, overdue tasks, workload and upcoming deadlines. Deliver and pitch your topic in the best possible manner with this devops tools and configuration it kpi dashboard for monitoring software development slides pdf. Use them to share invaluable insights on project budget, planning, design, development and impress your audience. This template can be altered and modified as per your expectations. So, grab it now.

KPI Dashboard Showing Results Of Sales And Marketing Project Campaign Formats PDF
Following slide showcases performance KPI dashboard used to evaluate marketing project campaign results. The dashboard provides overview of key metrics such as total revenue, marketing spend, profit and cost per acquisition, leads etc. Showcasing this set of slides titled KPI Dashboard Showing Results Of Sales And Marketing Project Campaign Formats PDF. The topics addressed in these templates are Marketing Spend, Revenue, Profit Per Acquisition. All the content presented in this PPT design is completely editable. Download it and make adjustments in color, background, font etc. as per your unique business setting.
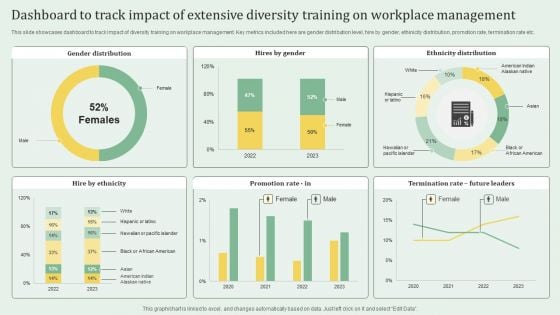
Dashboard To Track Impact Of Extensive Diversity Training On Workplace Management Portrait PDF
This slide showcases dashboard to track impact of diversity training on workplace management. Key metrics included here are gender distribution level, hire by gender, ethinicity distribution, promotion rate, termination rate etc. Pitch your topic with ease and precision using this Dashboard To Track Impact Of Extensive Diversity Training On Workplace Management Portrait PDF. This layout presents information on Dashboard To Track Impact, Extensive Diversity Training, Workplace Management. It is also available for immediate download and adjustment. So, changes can be made in the color, design, graphics or any other component to create a unique layout.
Procurement Kpi Dashboard For Tracking Supplier Action Plan Impact Graphics PDF
This slide covers procurement spend analysis dashboard for tracking new supplier strategy results. It include KPIs such as invoice count, invoices information, due dates, spend by payment terms, supplier payment terms, spend by entity, spend by category, spend by country. Showcasing this set of slides titled procurement kpi dashboard for tracking supplier action plan impact graphics pdf. The topics addressed in these templates are procurement kpi dashboard for tracking supplier action plan impact. All the content presented in this PPT design is completely editable. Download it and make adjustments in color, background, font etc. as per your unique business setting.
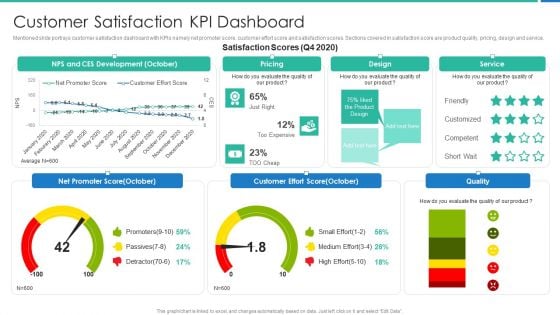
Strong Business Partnership To Ensure Company Success Customer Satisfaction KPI Dashboard Ideas PDF
Mentioned slide portrays customer satisfaction dashboard with KPIs namely net promoter score, customer effort score and satisfaction scores. Sections covered in satisfaction score are product quality, pricing, design and service.Deliver and pitch your topic in the best possible manner with this strong business partnership to ensure company success customer satisfaction kpi dashboard ideas pdf Use them to share invaluable insights on customer satisfaction kpi dashboard and impress your audience. This template can be altered and modified as per your expectations. So, grab it now.
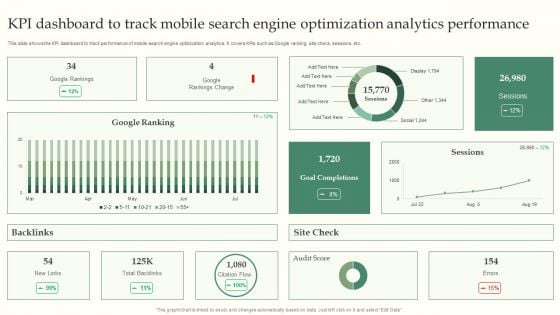
KPI Dashboard To Track Mobile Search Engine Optimization Analytics Performance Introduction PDF
This slide shows the KPI dashboard to track performance of mobile search engine optimization analytics. It covers KPIs such as Google ranking, site check, sessions, etc. Showcasing this set of slides titled KPI Dashboard To Track Mobile Search Engine Optimization Analytics Performance Introduction PDF. The topics addressed in these templates are KPI Dashboard, Search Engine Optimization, Analytics Performance. All the content presented in this PPT design is completely editable. Download it and make adjustments in color, background, font etc. as per your unique business setting.
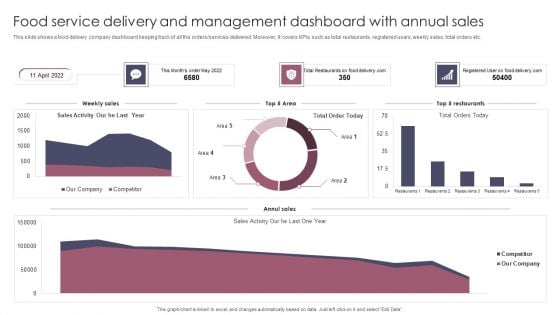
Food Service Delivery And Management Dashboard With Annual Sales Brochure PDF
This slide shows a food delivery company dashboard keeping track of all the orders or services delivered. Moreover, it covers KPIs such as total restaurants, registered users, weekly sales, total orders etc. Showcasing this set of slides titled Food Service Delivery And Management Dashboard With Annual Sales Brochure PDF. The topics addressed in these templates are Food Service Delivery, Management Dashboard, Annual Sales. All the content presented in this PPT design is completely editable. Download it and make adjustments in color, background, font etc. as per your unique business setting.

Inventory Overview Dashboard In Supply Chain Management To Enhance Logistics Operations Summary PDF
This slide showcases the inventory management dashboard. It include KPIs such as inventory value, re-order products, restocking cost, inventory value by vendor, item name, last order date, warehouse, etc. Showcasing this set of slides titled Inventory Overview Dashboard In Supply Chain Management To Enhance Logistics Operations Summary PDF. The topics addressed in these templates are Inventory Overview Dashboard, Supply Chain Management, Enhance Logistics Operations. All the content presented in this PPT design is completely editable. Download it and make adjustments in color, background, font etc. as per your unique business setting.
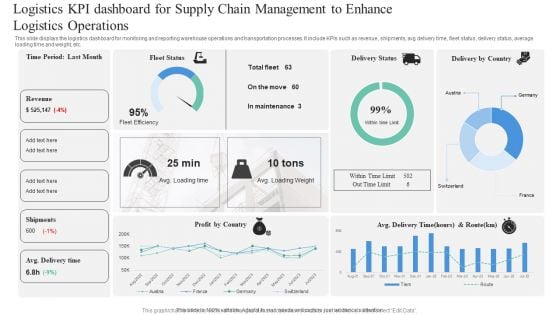
Logistics KPI Dashboard For Supply Chain Management To Enhance Logistics Operations Professional PDF
This slide displays the logistics dashboard for monitoring and reporting warehouse operations and transportation processes. It include KPIs such as revenue, shipments, avg delivery time, fleet status, delivery status, average loading time and weight, etc. Pitch your topic with ease and precision using this Logistics KPI Dashboard For Supply Chain Management To Enhance Logistics Operations Professional PDF. This layout presents information on Logistics KPI, Dashboard For Supply Chain, Management To Enhance, Logistics Operations. It is also available for immediate download and adjustment. So, changes can be made in the color, design, graphics or any other component to create a unique layout.
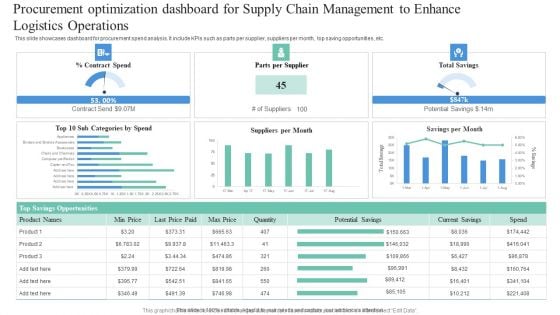
Procurement Optimization Dashboard For Supply Chain Management To Enhance Logistics Operations Elements PDF
This slide showcases dashboard for procurement spend analysis. It include KPIs such as parts per supplier, suppliers per month, top saving opportunities, etc. Pitch your topic with ease and precision using this Procurement Optimization Dashboard For Supply Chain Management To Enhance Logistics Operations Elements PDF. This layout presents information on Procurement Optimization Dashboard, Supply Chain Management, Enhance Logistic Operations. It is also available for immediate download and adjustment. So, changes can be made in the color, design, graphics or any other component to create a unique layout.
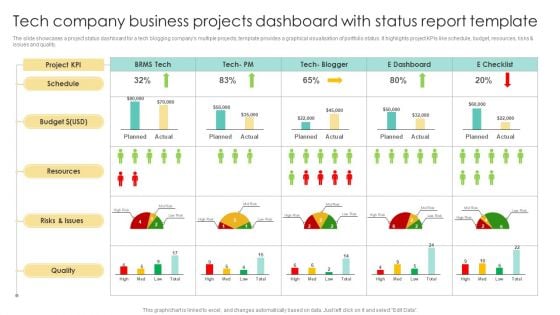
Tech Company Business Projects Dashboard With Status Report Template Brochure PDF
The slide showcases a project status dashboard for a tech blogging companys multiple projects, template provides a graphical visualisation of portfolio status. It highlights project KPIs like schedule, budget, resources, risks and issues and quality. Showcasing this set of slides titled Tech Company Business Projects Dashboard With Status Report Template Brochure PDF. The topics addressed in these templates are Tech Company Business, Projects Dashboard, Status Report Template. All the content presented in this PPT design is completely editable. Download it and make adjustments in color, background, font etc. as per your unique business setting.
Brand Identity Management Toolkit Overall Brand Performance Tracking Dashboard Diagrams PDF
This slide provides information regarding brand performance tracking dashboard capturing KPIs such as brand metric, brand commitment, advertising metrics, and purchase metrics. Create an editable Brand Identity Management Toolkit Overall Brand Performance Tracking Dashboard Diagrams PDF that communicates your idea and engages your audience. Whether youre presenting a business or an educational presentation, pre-designed presentation templates help save time. Brand Identity Management Toolkit Overall Brand Performance Tracking Dashboard Diagrams PDF is highly customizable and very easy to edit, covering many different styles from creative to business presentations. Slidegeeks has creative team members who have crafted amazing templates. So, go and get them without any delay.
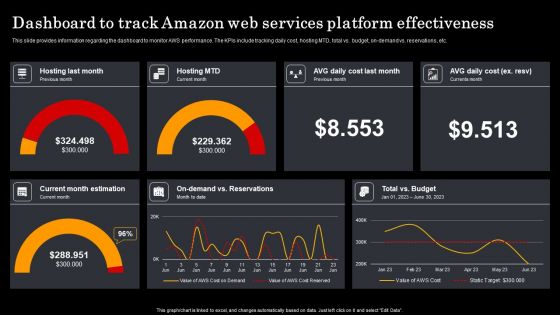
Assessment Of Amazon Brand Performance Dashboard To Track Amazon Web Guidelines PDF
This slide provides information regarding the dashboard to monitor AWS performance. The KPIs include tracking daily cost, hosting MTD, total vs. budget, on-demand vs. reservations, etc. Create an editable Assessment Of Amazon Brand Performance Dashboard To Track Amazon Web Guidelines PDF that communicates your idea and engages your audience. Whether you are presenting a business or an educational presentation, pre-designed presentation templates help save time. Assessment Of Amazon Brand Performance Dashboard To Track Amazon Web Guidelines PDF is highly customizable and very easy to edit, covering many different styles from creative to business presentations. Slidegeeks has creative team members who have crafted amazing templates. So, go and get them without any delay.
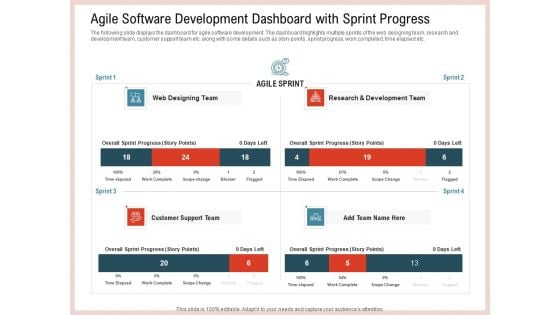
Agile Model Improve Task Team Performance Agile Software Development Dashboard With Sprint Progress Ideas PDF
The following slide displays the dashboard for agile software development. The dashboard highlights multiple sprints of the web designing team, research and development team, customer support team etc. along with some details such as story points, sprint progress, work completed, time elapsed etc. Deliver and pitch your topic in the best possible manner with this agile model improve task team performance agile software development dashboard with sprint progress ideas pdf. Use them to share invaluable insights on web designing team, research and development team, customer support team and impress your audience. This template can be altered and modified as per your expectations. So, grab it now.
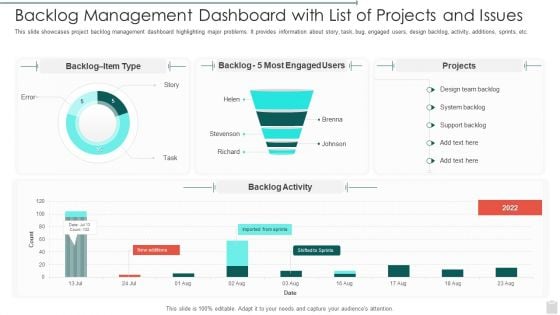
Backlog Management Dashboard With List Of Projects And Issues Template PDF
This slide showcases project backlog management dashboard highlighting major problems. It provides information about story, task, bug, engaged users, design backlog, activity, additions, sprints, etc. Pitch your topic with ease and precision using this Backlog Management Dashboard With List Of Projects And Issues Template PDF. This layout presents information on Backlog Management Dashboard With List Of Projects And Issues. It is also available for immediate download and adjustment. So, changes can be made in the color, design, graphics or any other component to create a unique layout.
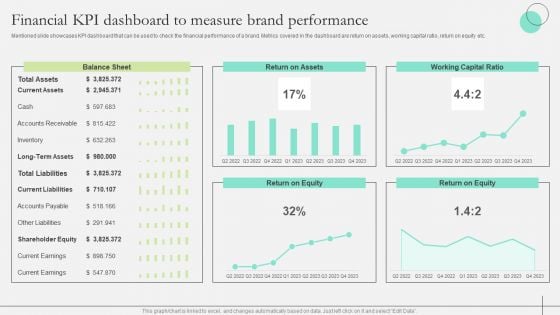
Comprehensive Guide To Strengthen Brand Equity Financial KPI Dashboard Measure Brand Structure PDF
Mentioned slide showcases KPI dashboard that can be used to check the financial performance of a brand. Metrics covered in the dashboard are return on assets, working capital ratio, return on equity etc. Take your projects to the next level with our ultimate collection of Comprehensive Guide To Strengthen Brand Equity Financial KPI Dashboard Measure Brand Structure PDF. Slidegeeks has designed a range of layouts that are perfect for representing task or activity duration, keeping track of all your deadlines at a glance. Tailor these designs to your exact needs and give them a truly corporate look with your own brand colors they will make your projects stand out from the rest
Performance Tracking Dashboard For 5G Architecture 5G Network Functional Architecture Mockup PDF
This slide describes the performance tracking dashboard for 5G architecture by covering the details of subscribers, quality of experience, consumption, customer support, coverage, devices, and dimensions.The best PPT templates are a great way to save time, energy, and resources. Slidegeeks have 100precent editable powerpoint slides making them incredibly versatile. With these quality presentation templates, you can create a captivating and memorable presentation by combining visually appealing slides and effectively communicating your message. Download Performance Tracking Dashboard For 5G Architecture 5G Network Functional Architecture Mockup PDF from Slidegeeks and deliver a wonderful presentation.
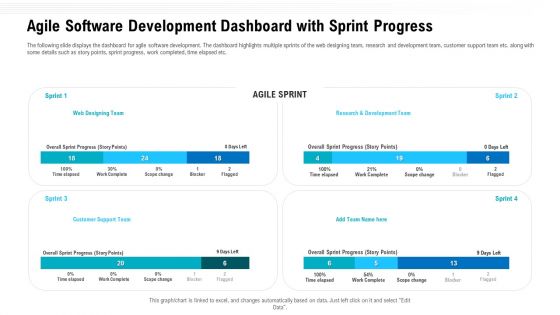
Agile Software Development Dashboard With Sprint Progress Ppt Model Guidelines PDF
The following slide displays the dashboard for agile software development. The dashboard highlights multiple sprints of the web designing team, research and development team, customer support team etc. along with some details such as story points, sprint progress, work completed, time elapsed etc. Deliver an awe inspiring pitch with this creative agile software development dashboard with sprint progress ppt model guidelines pdf bundle. Topics like overall sprint progress, customer support team, research development team can be discussed with this completely editable template. It is available for immediate download depending on the needs and requirements of the user.
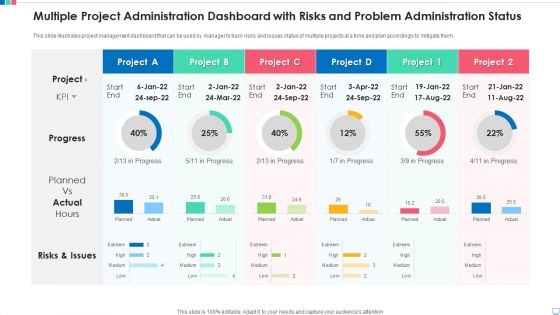
Multiple Project Administration Dashboard With Risks And Problem Administration Status Background PDF
This slide illustrates project management dashboard that can be used by manager to track risks and issues status of multiple projects at a time and plan accordingly to mitigate them. Showcasing this set of slides titled multiple project administration dashboard with risks and problem administration status background pdf. The topics addressed in these templates are multiple project administration dashboard with risks and problem administration status. All the content presented in this PPT design is completely editable. Download it and make adjustments in color, background, font etc. as per your unique business setting.
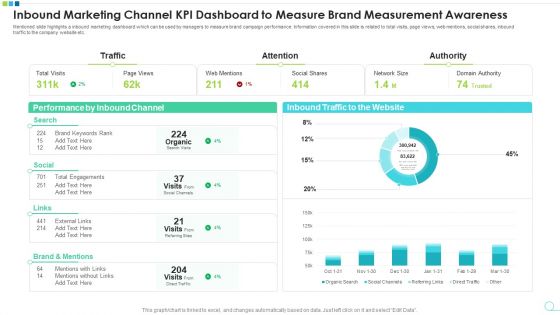
Inbound Marketing Channel KPI Dashboard To Measure Brand Measurement Awareness Pictures PDF
Mentioned slide highlights a inbound marketing dashboard which can be used by managers to measure brand campaign performance. Information covered in this slide is related to total visits, page views, web mentions, social shares, inbound traffic to the company website etc. Pitch your topic with ease and precision using this inbound marketing channel kpi dashboard to measure brand measurement awareness pictures pdf. This layout presents information on inbound marketing channel kpi dashboard to measure brand measurement awareness. It is also available for immediate download and adjustment. So, changes can be made in the color, design, graphics or any other component to create a unique layout.
Application Sources For Recruitment On Social Media Tracking Dashboard Microsoft PDF
This slide covers the dashboard for tracking the count of applicants profiles from various sources. It includes the open positions, new roles, total roles, candidates placed , application sources, client decline rates and commission received. Pitch your topic with ease and precision using this application sources for recruitment on social media tracking dashboard microsoft pdf. This layout presents information on application sources for recruitment on social media tracking dashboard. It is also available for immediate download and adjustment. So, changes can be made in the color, design, graphics or any other component to create a unique layout.
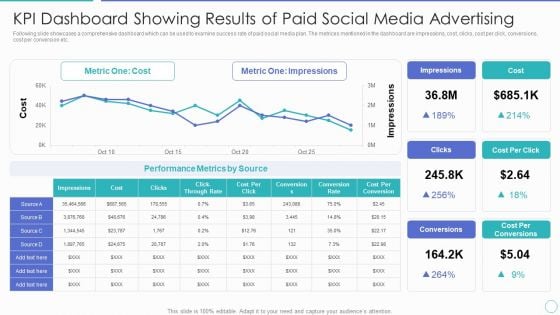
KPI Dashboard Showing Results Of Paid Social Media Advertising Ppt PowerPoint Presentation File Summary PDF
Following slide showcases a comprehensive dashboard which can be used to examine success rate of paid social media plan. The metrices mentioned in the dashboard are impressions, cost, clicks, cost per click, conversions, cost per conversion etc. Showcasing this set of slides titled kpi dashboard showing results of paid social media advertising ppt powerpoint presentation file summary pdf. The topics addressed in these templates are metric one cost, metric one impressions, performance metrics by source. All the content presented in this PPT design is completely editable. Download it and make adjustments in color, background, font etc. as per your unique business setting.
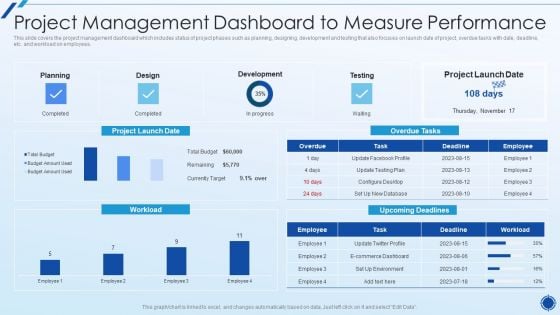
Organizing Action Plan For Successful Project Management Project Management Dashboard Topics PDF
This slide covers the project management dashboard which includes status of project phases such as planning, designing, development and testing that also focuses on launch date of project, overdue tasks with date, deadline, etc. and workload on employees.Deliver an awe inspiring pitch with this creative organizing action plan for successful project management project management dashboard topics pdf bundle. Topics like project management dashboard to measure performance can be discussed with this completely editable template. It is available for immediate download depending on the needs and requirements of the user.
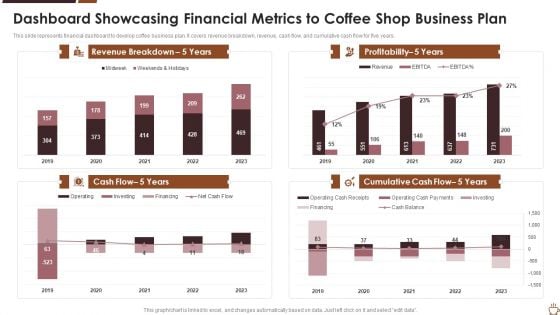
Dashboard Showcasing Financial Metrics To Coffee Shop Business Plan Background PDF
This slide represents financial dashboard to develop coffee business plan. It covers revenue breakdown, revenue, cash flow, and cumulative cash flow for five years. Showcasing this set of slides titled dashboard showcasing financial metrics to coffee shop business plan background pdf. The topics addressed in these templates are dashboard showcasing financial metrics to coffee shop business plan. All the content presented in this PPT design is completely editable. Download it and make adjustments in color, background, font etc. as per your unique business setting.

Cyber Phishing Scams And Attacks Dashboard With Improvement Curve Sample PDF
Mentioned slide showcases a comprehensive dashboard used to measure the cyber phishing attacks. Information covered in this slide is related to organization health risk, attack vendors, most vulnerable employees to attacks, improvement curve. Pitch your topic with ease and precision using this cyber phishing scams and attacks dashboard with improvement curve sample pdf. This layout presents information on cyber phishing scams and attacks dashboard with improvement curve. It is also available for immediate download and adjustment. So, changes can be made in the color, design, graphics or any other component to create a unique layout.
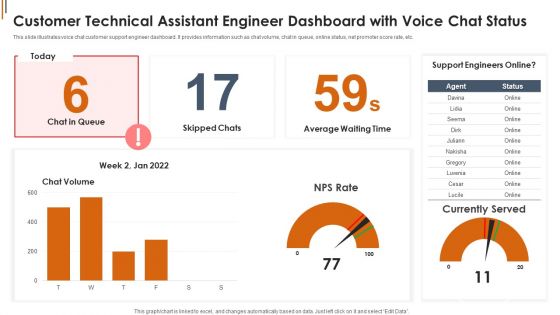
Customer Technical Assistant Engineer Dashboard With Voice Chat Status Slides PDF
This slide illustrates voice chat customer support engineer dashboard. It provides information such as chat volume, chat in queue, online status, net promoter score rate, etc. Showcasing this set of slides titled Customer Technical Assistant Engineer Dashboard With Voice Chat Status Slides PDF. The topics addressed in these templates are Customer Technical Assistant Engineer Dashboard With Voice Chat Status. All the content presented in this PPT design is completely editable. Download it and make adjustments in color, background, font etc. as per your unique business setting.
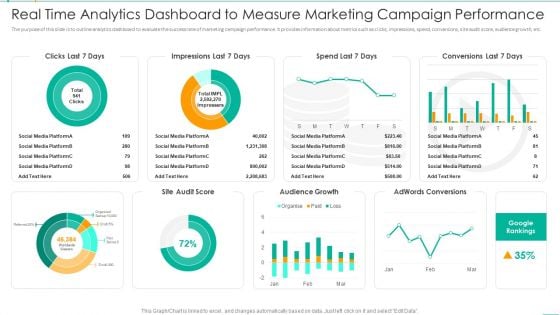
Real Time Analytics Dashboard To Measure Marketing Campaign Performance Information PDF
The purpose of this slide is to outline analytics dashboard to evaluate the success rate of marketing campaign performance. It provides information about metrics such as clicks, impressions, spend, conversions, site audit score, audience growth, etc. Pitch your topic with ease and precision using this Real Time Analytics Dashboard To Measure Marketing Campaign Performance Information PDF. This layout presents information on Real Time Analytics Dashboard To Measure Marketing Campaign Performance. It is also available for immediate download and adjustment. So, changes can be made in the color, design, graphics or any other component to create a unique layout.
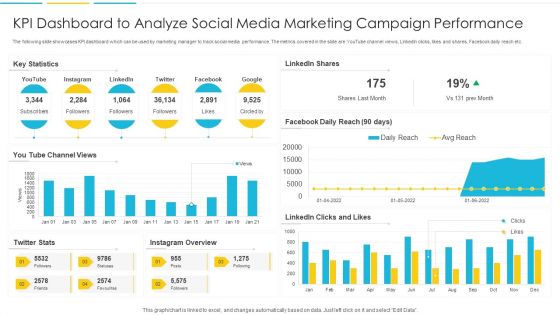
KPI Dashboard To Analyze Social Media Marketing Campaign Performance Rules PDF
The following slide showcases KPI dashboard which can be used by marketing manager to track social media performance. The metrics covered in the slide are YouTube channel views, LinkedIn clicks, likes and shares, Facebook daily reach etc. Pitch your topic with ease and precision using this KPI Dashboard To Analyze Social Media Marketing Campaign Performance Rules PDF. This layout presents information on Dashboard, Marketing, Analyze. It is also available for immediate download and adjustment. So, changes can be made in the color, design, graphics or any other component to create a unique layout.
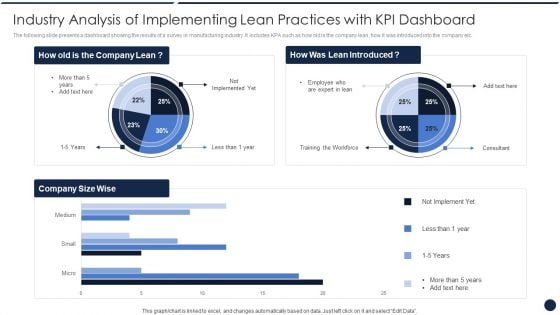
Industry Analysis Of Implementing Lean Practices With KPI Dashboard Sample PDF
The following slide presents a dashboard showing the results of a survey in manufacturing industry. It includes KPA such as how old is the company lean, how it was introduced into the company etc. Showcasing this set of slides titled Industry Analysis Of Implementing Lean Practices With KPI Dashboard Sample PDF The topics addressed in these templates are Industry Analysis, Implementing Lean, Practices With KPI Dashboard All the content presented in this PPT design is completely editable. Download it and make adjustments in color, background, font etc. as per your unique business setting.


 Continue with Email

 Home
Home


