Dashboards Construction
Driving Results Designing A Team Training And Development Program Tracking Dashboard
This slide depicts team development program tracking dashboard to analyze the impact of implementing training plan for the members. It includes training satisfaction rate, engagement score, drop-out rate and top 5 trainees. Take your projects to the next level with our ultimate collection of Driving Results Designing A Team Training And Development Program Tracking Dashboard. Slidegeeks has designed a range of layouts that are perfect for representing task or activity duration, keeping track of all your deadlines at a glance. Tailor these designs to your exact needs and give them a truly corporate look with your own brand colors they will make your projects stand out from the rest This slide depicts team development program tracking dashboard to analyze the impact of implementing training plan for the members. It includes training satisfaction rate, engagement score, drop-out rate and top 5 trainees.
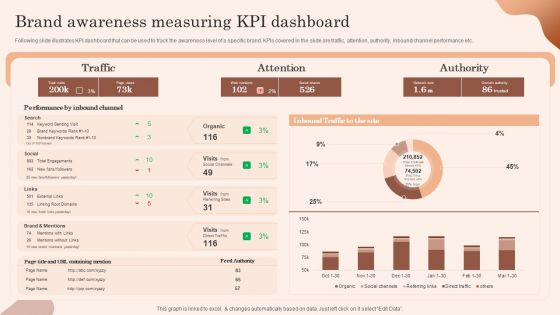
Building Market Brand Leadership Strategies Brand Awareness Measuring Kpi Dashboard Structure PDF
Following slide illustrates KPI dashboard that can be used to track the awareness level of a specific brand. KPIs covered in the slide are traffic, attention, authority, inbound channel performance etc. Boost your pitch with our creative Building Market Brand Leadership Strategies Brand Awareness Measuring Kpi Dashboard Structure PDF. Deliver an awe-inspiring pitch that will mesmerize everyone. Using these presentation templates you will surely catch everyones attention. You can browse the ppts collection on our website. We have researchers who are experts at creating the right content for the templates. So you do not have to invest time in any additional work. Just grab the template now and use them.
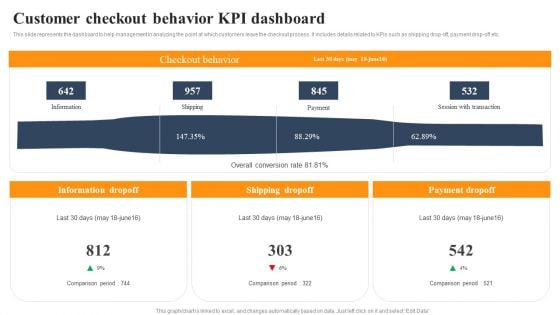
Implementing An Effective Ecommerce Management Framework Customer Checkout Behavior KPI Dashboard Designs PDF
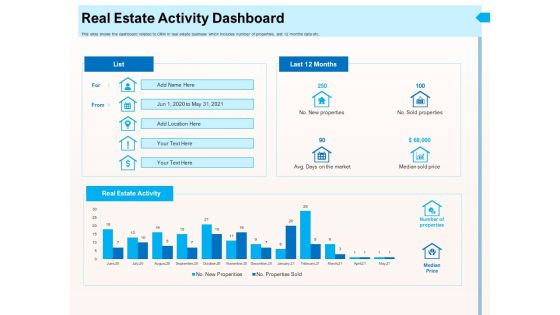
CRM For Realty Properties Real Estate Activity Dashboard Properties Ppt Infographic Template Deck PDF
Presenting this set of slides with name crm for realty properties real estate activity dashboard properties ppt infographic template deck pdf. The topics discussed in these slides are real estate activity, new properties, sold properties, median sold price, median price. This is a completely editable PowerPoint presentation and is available for immediate download. Download now and impress your audience.
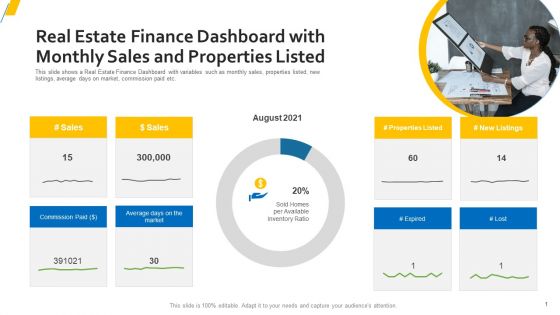
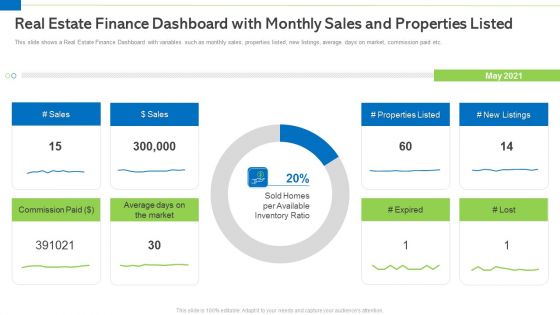
Real Estate Finance Dashboard With Monthly Sales And Properties Listed Microsoft PDF
Deliver an awe-inspiring pitch with this creative real estate finance dashboard with monthly sales and properties listed microsoft pdf. bundle. Topics like average days on the market, sales can be discussed with this completely editable template. It is available for immediate download depending on the needs and requirements of the user.
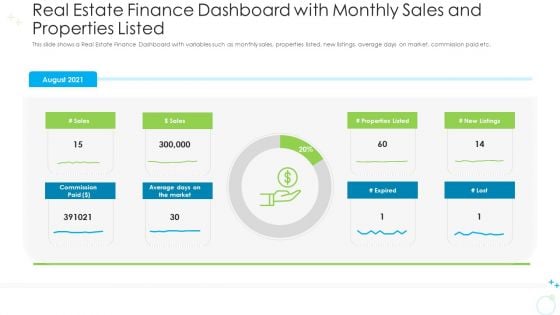
Real Estate Finance Dashboard With Monthly Sales And Properties Listed Portrait PDF
Deliver an awe-inspiring pitch with this creative real estate finance dashboard with monthly sales and properties listed portrait pdf bundle. Topics like sales, commission paid, properties listed, expired can be discussed with this completely editable template. It is available for immediate download depending on the needs and requirements of the user.
Real Estate Finance Dashboard With Monthly Sales And Properties Listed Ppt Gallery Visual Aids Pdf
Deliver and pitch your topic in the best possible manner with this real estate finance dashboard with monthly sales and properties listed ppt gallery visual aids pdf. Use them to share invaluable insights on average, market, sales and impress your audience. This template can be altered and modified as per your expectations. So, grab it now.
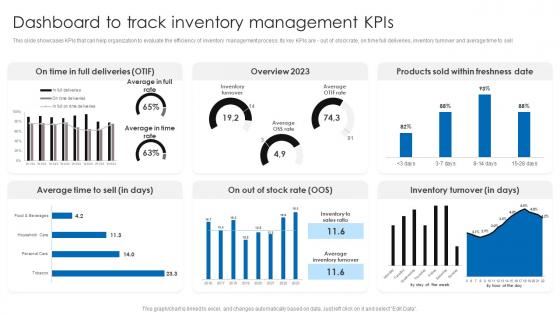
Dashboard To Track Inventory Management Kpis Retail Stock Administration Strategies Rules Pdf
This slide showcases KPIs that can help organization to evaluate the efficiency of inventory management process. Its key KPIs are - out of stock rate, on time full deliveries, inventory turnover and average time to sell.Coming up with a presentation necessitates that the majority of the effort goes into the content and the message you intend to convey. The visuals of a PowerPoint presentation can only be effective if it supplements and supports the story that is being told. Keeping this in mind our experts created Dashboard To Track Inventory Management Kpis Retail Stock Administration Strategies Rules Pdf to reduce the time that goes into designing the presentation. This way, you can concentrate on the message while our designers take care of providing you with the right template for the situation. This slide showcases KPIs that can help organization to evaluate the efficiency of inventory management process. Its key KPIs are out of stock rate, on time full deliveries, inventory turnover and average time to sell
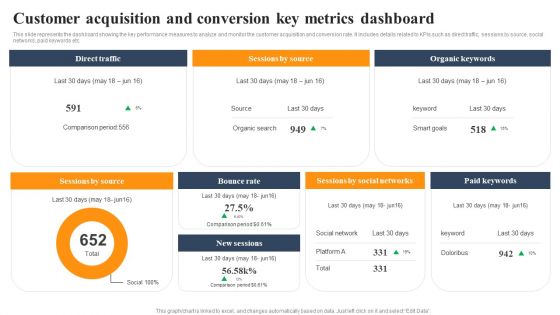
Implementing An Effective Ecommerce Management Framework Customer Acquisition And Conversion Key Metrics Dashboard Information PDF
Do you have to make sure that everyone on your team knows about any specific topic I yes, then you should give Implementing An Effective Ecommerce Management This slide represents the dashboard showing the key performance measures to analyze and monitor the customer acquisition and conversion rate. It includes details related to KPIs such as direct traffic, sessions by source, social networks, paid keywords etc. Framework Customer Acquisition And Conversion Key Metrics Dashboard Information PDF a try. Our experts have put a lot of knowledge and effort into creating this impeccable Implementing An Effective Ecommerce Management Framework Customer Acquisition And Conversion Key Metrics Dashboard Information PDF. You can use this template for your upcoming presentations, as the slides are perfect to represent even the tiniest detail. You can download these templates from the Slidegeeks website and these are easy to edit. So grab these today
Customer Relationship Strategy For Building Loyalty Business Revenue Dashboard Icons PDF
This slide highlights business dashboard with multiple statistics to estimate the revenue and profitability of company as a result of new customer intimacy strategy. Deliver an awe inspiring pitch with this creative customer relationship strategy for building loyalty business revenue dashboard icons pdf bundle. Topics like average revenue per customer, compared to previous year, customer acquisition cost, cac vs customer lifetime value, revenue can be discussed with this completely editable template. It is available for immediate download depending on the needs and requirements of the user.
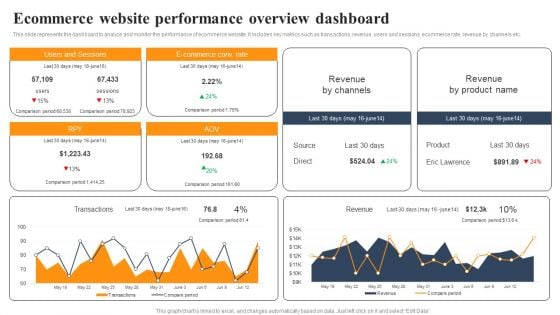
Implementing An Effective Ecommerce Management Framework Ecommerce Website Performance Overview Dashboard Clipart PDF
This slide represents the dashboard to analyze and monitor the performance of ecommerce website. It includes key metrics such as transactions, revenue, users and sessions, ecommerce rate, revenue by channels etc. Find highly impressive Implementing An Effective Ecommerce Management Framework Ecommerce Website Performance Overview Dashboard Clipart PDF on Slidegeeks to deliver a meaningful presentation. You can save an ample amount of time using these presentation templates. No need to worry to prepare everything from scratch because Slidegeeks experts have already done a huge research and work for you. You need to download Implementing An Effective Ecommerce Management Framework Ecommerce Website Performance Overview Dashboard Clipart PDFfor your upcoming presentation. All the presentation templates are 100 percent editable and you can change the color and personalize the content accordingly. Download now
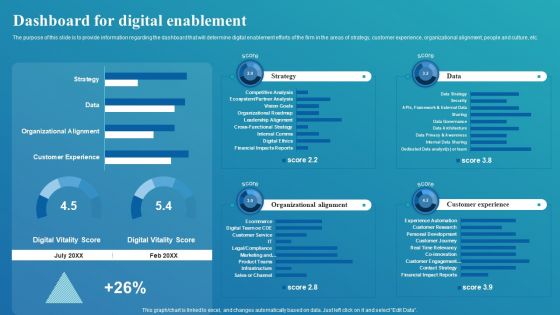
Framework For Digital Transformation And Modernization Dashboard For Digital Enablement Template PDF
The purpose of this slide is to provide information regarding the dashboard that will determine digital enablement efforts of the firm in the areas of strategy, customer experience, organizational alignment, people and culture, etc. Create an editable Framework For Digital Transformation And Modernization Dashboard For Digital Enablement Template PDF that communicates your idea and engages your audience. Whether youre presenting a business or an educational presentation, pre designed presentation templates help save time. Framework For Digital Transformation And Modernization Dashboard For Digital Enablement Template PDF is highly customizable and very easy to edit, covering many different styles from creative to business presentations. Slidegeeks has creative team members who have crafted amazing templates. So, go and get them without any delay.
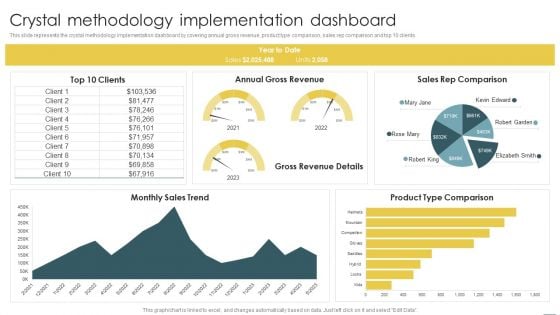
Crystal Methods In Agile Framework Crystal Methodology Implementation Dashboard Introduction PDF
This slide represents the crystal methodology implementation dashboard by covering annual gross revenue, product type comparison, sales rep comparison and top 10 clients. Here you can discover an assortment of the finest PowerPoint and Google Slides templates. With these templates, you can create presentations for a variety of purposes while simultaneously providing your audience with an eye catching visual experience. Download Crystal Methods In Agile Framework Crystal Methodology Implementation Dashboard Introduction PDF to deliver an impeccable presentation. These templates will make your job of preparing presentations much quicker, yet still, maintain a high level of quality. Slidegeeks has experienced researchers who prepare these templates and write high quality content for you. Later on, you can personalize the content by editing the Crystal Methods In Agile Framework Crystal Methodology Implementation Dashboard Introduction PDF.
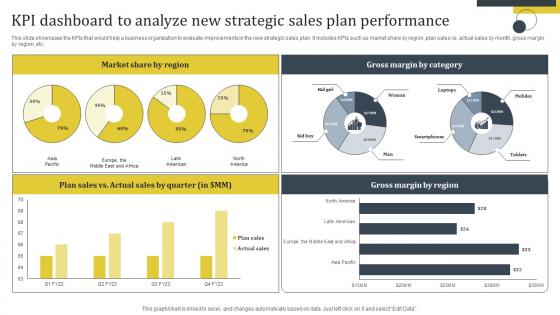
Enhance Customer Retention Kpi Dashboard To Analyze New Strategic Sales Plan Elements Pdf
This slide showcases the KPIs that would help a business organization to evaluate improvements in the new strategic sales plan. It includes KPIs such as market share by region, plan sales vs. actual sales by month, gross margin by region, etc. Welcome to our selection of the Enhance Customer Retention Kpi Dashboard To Analyze New Strategic Sales Plan Elements Pdf. These are designed to help you showcase your creativity and bring your sphere to life. Planning and Innovation are essential for any business that is just starting out. This collection contains the designs that you need for your everyday presentations. All of our PowerPoints are 100 percent editable, so you can customize them to suit your needs. This multi-purpose template can be used in various situations. Grab these presentation templates today. This slide showcases the KPIs that would help a business organization to evaluate improvements in the new strategic sales plan. It includes KPIs such as market share by region, plan sales vs. actual sales by month, gross margin by region, etc.
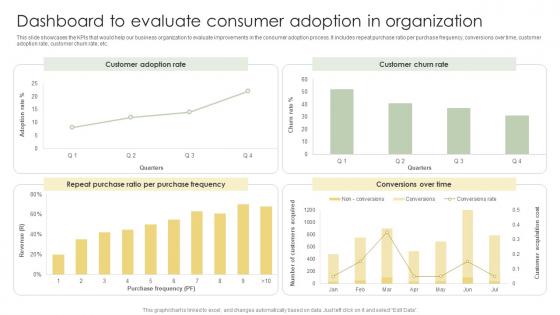
Dashboard To Evaluate Consumer Adoption In Organization Analyzing Customer Adoption Information Pdf
This slide showcases the KPIs that would help our business organization to evaluate improvements in the consumer adoption process. It includes repeat purchase ratio per purchase frequency, conversions over time, customer adoption rate, customer churn rate, etc.Slidegeeks is here to make your presentations a breeze with Dashboard To Evaluate Consumer Adoption In Organization Analyzing Customer Adoption Information Pdf With our easy-to-use and customizable templates, you can focus on delivering your ideas rather than worrying about formatting. With a variety of designs to choose from, you are sure to find one that suits your needs. And with animations and unique photos, illustrations, and fonts, you can make your presentation pop. So whether you are giving a sales pitch or presenting to the board, make sure to check out Slidegeeks first. This slide showcases the KPIs that would help our business organization to evaluate improvements in the consumer adoption process. It includes repeat purchase ratio per purchase frequency, conversions over time, customer adoption rate, customer churn rate, etc.
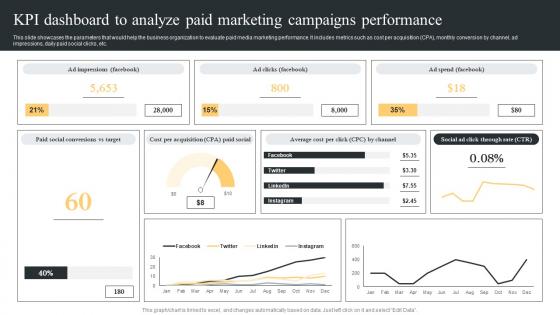
KPI Dashboard To Analyze Paid Comprehensive Guide For Paid Media Marketing Strategies Sample Pdf
This slide showcases the parameters that would help the business organization to evaluate paid media marketing performance. It includes metrics such as cost per acquisition CPA, monthly conversion by channel, ad impressions, daily paid social clicks, etc. Coming up with a presentation necessitates that the majority of the effort goes into the content and the message you intend to convey. The visuals of a PowerPoint presentation can only be effective if it supplements and supports the story that is being told. Keeping this in mind our experts created KPI Dashboard To Analyze Paid Comprehensive Guide For Paid Media Marketing Strategies Sample Pdf to reduce the time that goes into designing the presentation. This way, you can concentrate on the message while our designers take care of providing you with the right template for the situation. This slide showcases the parameters that would help the business organization to evaluate paid media marketing performance. It includes metrics such as cost per acquisition CPA, monthly conversion by channel, ad impressions, daily paid social clicks, etc.
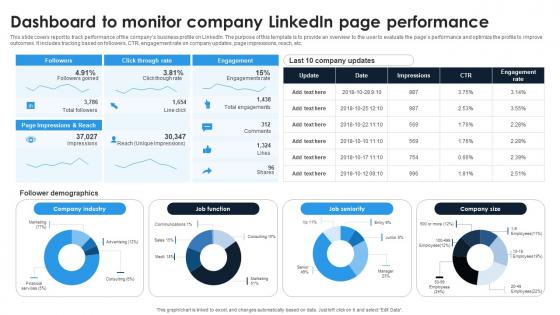
Linkedin Content Strategies Dashboard To Monitor Company Linkedin Page MKT SS V
This slide covers report to track performance of the compans business profile on LinkedIn. The purpose of this template is to provide an overview to the user to evaluate the pages performance and optimize the profile to improve outcomes. It includes tracking based on followers, CTR, engagement rate on company updates, page impressions, reach, etc. Slidegeeks is here to make your presentations a breeze with Linkedin Content Strategies Dashboard To Monitor Company Linkedin Page MKT SS V With our easy-to-use and customizable templates, you can focus on delivering your ideas rather than worrying about formatting. With a variety of designs to choose from, you are sure to find one that suits your needs. And with animations and unique photos, illustrations, and fonts, you can make your presentation pop. So whether you are giving a sales pitch or presenting to the board, make sure to check out Slidegeeks first This slide covers report to track performance of the compans business profile on LinkedIn. The purpose of this template is to provide an overview to the user to evaluate the pages performance and optimize the profile to improve outcomes. It includes tracking based on followers, CTR, engagement rate on company updates, page impressions, reach, etc.
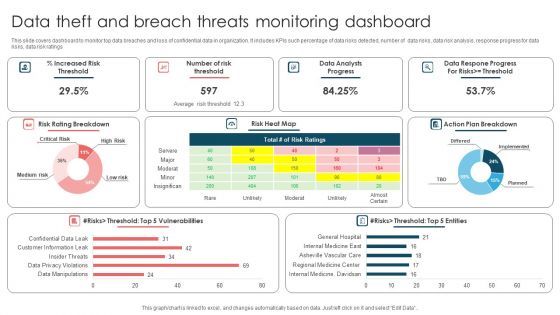
Data Theft And Breach Threats Monitoring Dashboard Ppt Outline Designs PDF
This slide covers dashboard to monitor top data breaches and loss of confidential data in organization. It includes KPIs such percentage of data risks detected, number of data risks, data risk analysis, response progress for data risks, data risk ratings. Showcasing this set of slides titled Data Theft And Breach Threats Monitoring Dashboard Ppt Outline Designs PDF. The topics addressed in these templates are Number Risk Threshold, Data Analysts Progress, Action Plan Breakdown. All the content presented in this PPT design is completely editable. Download it and make adjustments in color, background, font etc. as per your unique business setting.

Implementing An Effective Ecommerce Management Framework Email Campaign Performance KPI Dashboard Introduction PDF
This slide covers dashboard providing an insight related to how subscribers and resonating with email marketing campaign. It key performance metrics such as sessions from email, sessions from email by campaign, sessions by email by date etc. If your project calls for a presentation, then Slidegeeks is your go-to partner because we have professionally designed, easy-to-edit templates that are perfect for any presentation. After downloading, you can easily edit Implementing An Effective Ecommerce Management Framework Email Campaign Performance KPI Dashboard Introduction PDF and make the changes accordingly. You can rearrange slides or fill them with different images. Check out all the handy templates

Step 7 Monitor Analytics Implementation For Inventory Using Dashboard Data Analytics SS V
This slide provides a dashboard highlighting inventory performance aimed at helping businesses streamline operations. It covers details on sales orders, invoices, order value, invoice amount, YTD invoice value and sales growth. Welcome to our selection of the Step 7 Monitor Analytics Implementation For Inventory Using Dashboard Data Analytics SS V. These are designed to help you showcase your creativity and bring your sphere to life. Planning and Innovation are essential for any business that is just starting out. This collection contains the designs that you need for your everyday presentations. All of our PowerPoints are 100 percent editable, so you can customize them to suit your needs. This multi-purpose template can be used in various situations. Grab these presentation templates today. This slide provides a dashboard highlighting inventory performance aimed at helping businesses streamline operations. It covers details on sales orders, invoices, order value, invoice amount, YTD invoice value and sales growth.

Marketers Guide To Data Analysis Optimization Social Media Analytics KPI Dashboard Clipart PDF
This slide covers a dashboard for tracking social media KPIs such as face engagements, total likes, followers, audience growth, YouTube subscribers, views, Instagram reach and , likes, LinkedIn impressions, etc. Find a pre designed and impeccable Marketers Guide To Data Analysis Optimization Social Media Analytics KPI Dashboard Clipart PDF. The templates can ace your presentation without additional effort. You can download these easy to edit presentation templates to make your presentation stand out from others. So, what are you waiting for Download the template from Slidegeeks today and give a unique touch to your presentation.
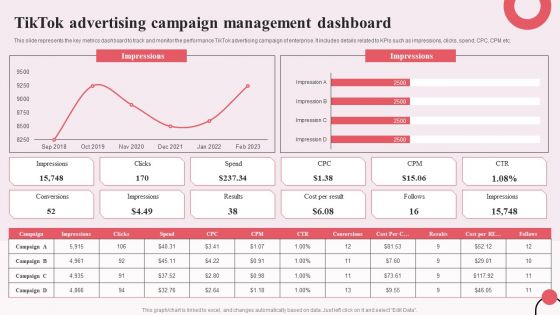
Tiktok Digital Marketing Campaign Tiktok Advertising Campaign Management Dashboard Designs PDF
This slide represents the key metrics dashboard to track and monitor the performance TikTok advertising campaign of enterprise. It includes details related to KPIs such as impressions, clicks, spend, CPC, CPM etc. Formulating a presentation can take up a lot of effort and time, so the content and message should always be the primary focus. The visuals of the PowerPoint can enhance the presenters message, so our Tiktok Digital Marketing Campaign Tiktok Advertising Campaign Management Dashboard Designs PDF was created to help save time. Instead of worrying about the design, the presenter can concentrate on the message while our designers work on creating the ideal templates for whatever situation is needed. Slidegeeks has experts for everything from amazing designs to valuable content, we have put everything into Tiktok Digital Marketing Campaign Tiktok Advertising Campaign Management Dashboard Designs PDF
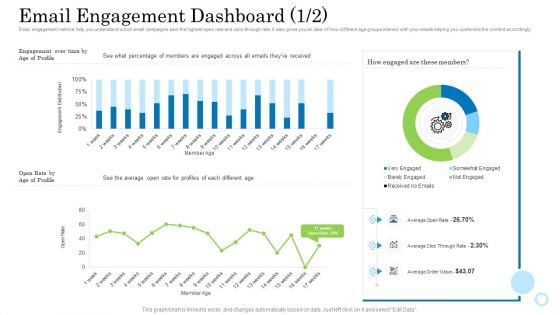
Customer Behavioral Data And Analytics Email Engagement Dashboard Rate Designs PDF
Email engagement metrics help you understand which email campaigns saw the highest open rate and click-through rate. It also gives you an idea of how different age groups interact with your emails helping you customize the content accordingly. Deliver an awe inspiring pitch with this creative customer behavioral data and analytics email engagement dashboard rate designs pdf bundle. Topics like email engagement dashboard can be discussed with this completely editable template. It is available for immediate download depending on the needs and requirements of the user.
Data Driven Marketing Campaigns Key Metrics Dashboard Ppt Icon Graphics Pictures PDF
This slide represents the KPI dashboard to track and monitor performance of data driven marketing campaigns launched by the marketing team. It includes details related to conversions by google ads, Facebook and Instagram etc. Explore a selection of the finest Data Driven Marketing Campaigns Key Metrics Dashboard Ppt Icon Graphics Pictures PDF here. With a plethora of professionally designed and pre made slide templates, you can quickly and easily find the right one for your upcoming presentation. You can use our Data Driven Marketing Campaigns Key Metrics Dashboard Ppt Icon Graphics Pictures PDF to effectively convey your message to a wider audience. Slidegeeks has done a lot of research before preparing these presentation templates. The content can be personalized and the slides are highly editable. Grab templates today from Slidegeeks.
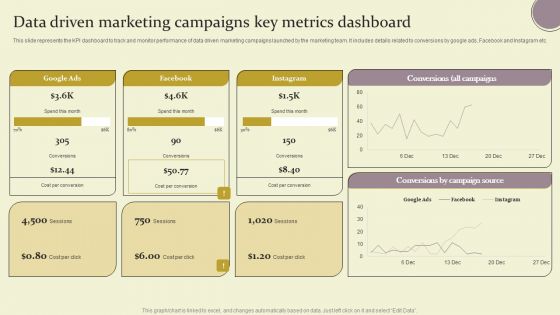
Data Driven Marketing Campaigns Key Metrics Dashboard Ppt Outline Example Introduction PDF
This slide represents the KPI dashboard to track and monitor performance of data driven marketing campaigns launched by the marketing team. It includes details related to conversions by google ads, Facebook and Instagram etc. Explore a selection of the finest Data Driven Marketing Campaigns Key Metrics Dashboard Ppt Outline Example Introduction PDF here. With a plethora of professionally designed and pre made slide templates, you can quickly and easily find the right one for your upcoming presentation. You can use our Data Driven Marketing Campaigns Key Metrics Dashboard Ppt Outline Example Introduction PDF to effectively convey your message to a wider audience. Slidegeeks has done a lot of research before preparing these presentation templates. The content can be personalized and the slides are highly editable. Grab templates today from Slidegeeks.
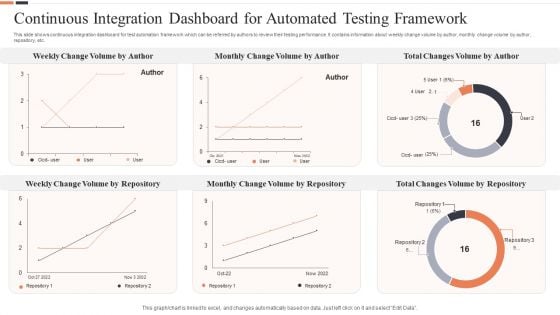
Continuous Integration Dashboard For Automated Testing Framework Ppt Layouts Layout Ideas PDF
This slide shows continuous integration dashboard for test automation framework which can be referred by authors to review their testing performance. It contains information about weekly change volume by author, monthly change volume by author, repository, etc. Pitch your topic with ease and precision using this Continuous Integration Dashboard For Automated Testing Framework Ppt Layouts Layout Ideas PDF. This layout presents information on Total Changes Volume, Monthly Change Volume, Weekly Change Volume. It is also available for immediate download and adjustment. So, changes can be made in the color, design, graphics or any other component to create a unique layout.
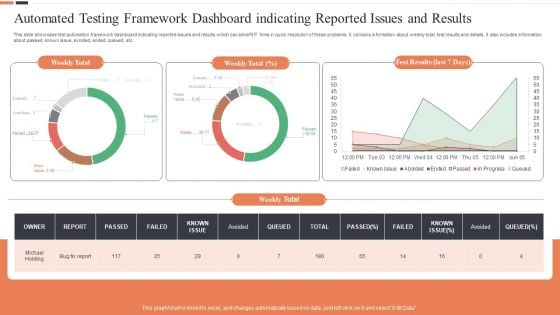
Automated Testing Framework Dashboard Indicating Reported Issues And Results Ideas PDF
This slide showcase test automation framework dashboard indicating reported issues and results which can benefit IT firms in quick resolution of these problems. It contains information about weekly total, test results and details. It also includes information about passed, known issue, avoided, ended, queued, etc. Showcasing this set of slides titled Automated Testing Framework Dashboard Indicating Reported Issues And Results Ideas PDF. The topics addressed in these templates are Weekly Total, Test Results, Last 7 Days. All the content presented in this PPT design is completely editable. Download it and make adjustments in color, background, font etc. as per your unique business setting.
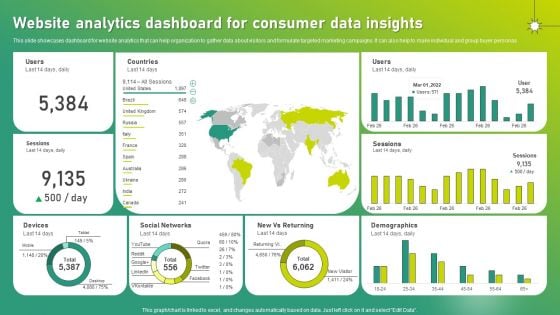
Targeted Marketing Strategic Plan For Audience Engagement Website Analytics Dashboard For Consumer Data Insights Guidelines PDF
This slide showcases dashboard for website analytics that can help organization to gather data about visitors and formulate targeted marketing campaigns. It can also help to make individual and group buyer personas. This Targeted Marketing Strategic Plan For Audience Engagement Website Analytics Dashboard For Consumer Data Insights Guidelines PDF is perfect for any presentation, be it in front of clients or colleagues. It is a versatile and stylish solution for organizing your meetings. The Targeted Marketing Strategic Plan For Audience Engagement Website Analytics Dashboard For Consumer Data Insights Guidelines PDF features a modern design for your presentation meetings. The adjustable and customizable slides provide unlimited possibilities for acing up your presentation. Slidegeeks has done all the homework before launching the product for you. So, do not wait, grab the presentation templates today.

HR Service Excellence Framework Helpdesk Dashboard To Track HR Service Delivery Effectiveness Clipart PDF
This slide provides information regarding helpdesk dashboard to track HR service delivery model effectiveness in terms of monitoring case resolution rate, employee self service effectiveness, knowledge base effectiveness, etc. Find a pre designed and impeccable HR Service Excellence Framework Helpdesk Dashboard To Track HR Service Delivery Effectiveness Clipart PDF. The templates can ace your presentation without additional effort. You can download these easy to edit presentation templates to make your presentation stand out from others. So, what are you waiting for Download the template from Slidegeeks today and give a unique touch to your presentation.
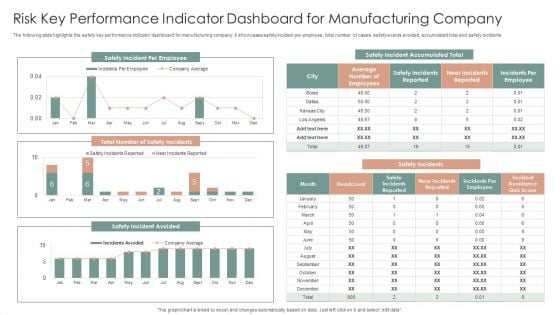
Risk Key Performance Indicator Dashboard For Manufacturing Company Ppt Gallery Graphics Design PDF
The following slide highlights the safety key performance indicator dashboard for manufacturing company. It showcases safety incident per employee, total number of cases, safety events avoided, accumulated total and safety incidents. Pitch your topic with ease and precision using this Risk Key Performance Indicator Dashboard For Manufacturing Company Ppt Gallery Graphics Design PDF. This layout presents information on Safety Incidents, Safety Incident Avoided, Safety Incident Accumulated. It is also available for immediate download and adjustment. So, changes can be made in the color, design, graphics or any other component to create a unique layout.
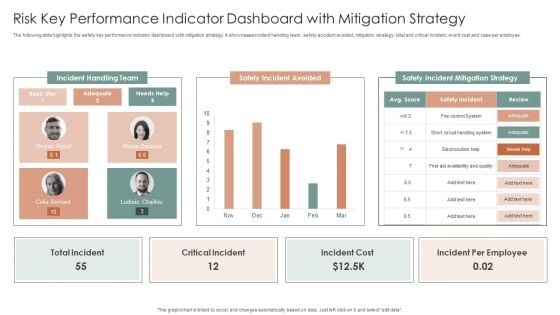
Risk Key Performance Indicator Dashboard With Mitigation Strategy Ppt Inspiration Design Templates PDF
The following slide highlights the safety key performance indicator dashboard with mitigation strategy. It showcases incident handling team, safety accident avoided, mitigation strategy, total and critical incident, event cost and case per employee. Showcasing this set of slides titled Risk Key Performance Indicator Dashboard With Mitigation Strategy Ppt Inspiration Design Templates PDF. The topics addressed in these templates are Incident Handling Team, Safety Incident Avoided, Safety Incident. All the content presented in this PPT design is completely editable. Download it and make adjustments in color, background, font etc. as per your unique business setting.
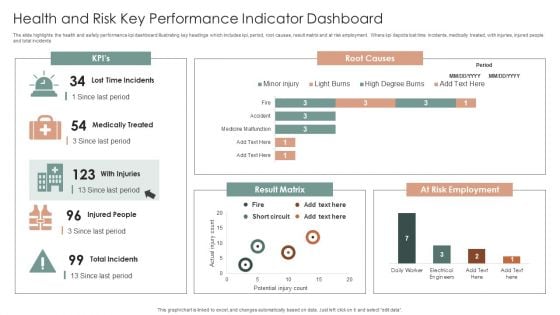
Health And Risk Key Performance Indicator Dashboard Ppt Layouts Graphics Design PDF
The slide highlights the health and safety performance kpi dashboard illustrating key headings which includes kpi, period, root causes, result matrix and at risk employment. Where kpi depicts lost time incidents, medically treated, with injuries, injured people and total incidents. Showcasing this set of slides titled Health And Risk Key Performance Indicator Dashboard Ppt Layouts Graphics Design PDF. The topics addressed in these templates are Root Causes, Result Matrix, At Risk Employment. All the content presented in this PPT design is completely editable. Download it and make adjustments in color, background, font etc. as per your unique business setting.
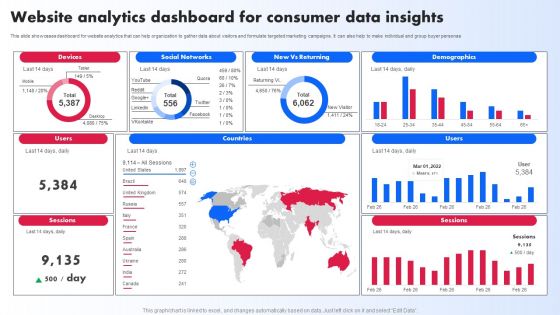
Website Analytics Dashboard For Consumer Data Insights Ppt PowerPoint Presentation File Slides PDF
This slide showcases dashboard for website analytics that can help organization to gather data about visitors and formulate targeted marketing campaigns. It can also help to make individual and group buyer personas. If you are looking for a format to display your unique thoughts, then the professionally designed Website Analytics Dashboard For Consumer Data Insights Ppt PowerPoint Presentation File Slides PDF is the one for you. You can use it as a Google Slides template or a PowerPoint template. Incorporate impressive visuals, symbols, images, and other charts. Modify or reorganize the text boxes as you desire. Experiment with shade schemes and font pairings. Alter, share or cooperate with other people on your work. Download Website Analytics Dashboard For Consumer Data Insights Ppt PowerPoint Presentation File Slides PDF and find out how to give a successful presentation. Present a perfect display to your team and make your presentation unforgettable.
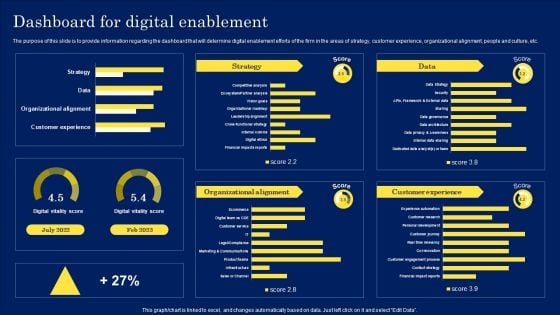
Digitization Framework For Technology Advancement Dashboard For Digital Enablement Ideas PDF
The purpose of this slide is to provide information regarding the dashboard that will determine digital enablement efforts of the firm in the areas of strategy, customer experience, organizational alignment, people and culture, etc. There are so many reasons you need a Digitization Framework For Technology Advancement Dashboard For Digital Enablement Ideas PDF. The first reason is you can not spend time making everything from scratch, Thus, Slidegeeks has made presentation templates for you too. You can easily download these templates from our website easily.
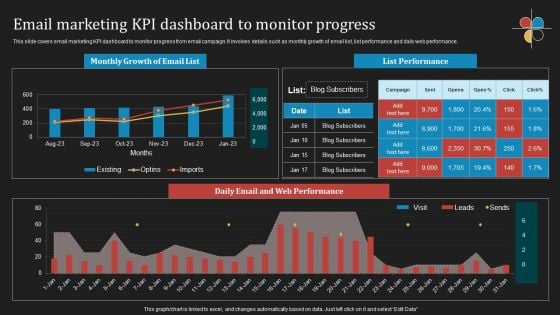
Deploying B2B Advertising Techniques For Lead Generation Email Marketing Kpi Dashboard To Monitor Progress Designs PDF
This slide covers email marketing KPI dashboard to monitor progress from email campaign. It involves details such as monthly growth of email list, list performance and daily web performance. Formulating a presentation can take up a lot of effort and time, so the content and message should always be the primary focus. The visuals of the PowerPoint can enhance the presenters message, so our Deploying B2B Advertising Techniques For Lead Generation Email Marketing Kpi Dashboard To Monitor Progress Designs PDF was created to help save time. Instead of worrying about the design, the presenter can concentrate on the message while our designers work on creating the ideal templates for whatever situation is needed. Slidegeeks has experts for everything from amazing designs to valuable content, we have put everything into Deploying B2B Advertising Techniques For Lead Generation Email Marketing Kpi Dashboard To Monitor Progress Designs PDF
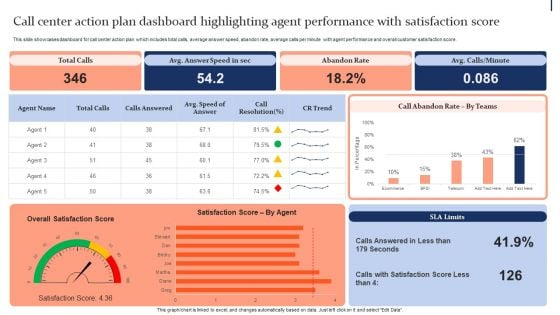
Quality Enhancement Strategic Call Center Action Plan Dashboard Highlighting Agent Designs PDF
This slide showcases dashboard for call center action plan which includes total calls, average answer speed, abandon rate, average calls per minute with agent performance and overall customer satisfaction score. Get a simple yet stunning designed Quality Enhancement Strategic Call Center Action Plan Dashboard Highlighting Agent Designs PDF. It is the best one to establish the tone in your meetings. It is an excellent way to make your presentations highly effective. So, download this PPT today from Slidegeeks and see the positive impacts. Our easy-to-edit Quality Enhancement Strategic Call Center Action Plan Dashboard Highlighting Agent Designs PDF can be your go-to option for all upcoming conferences and meetings. So, what are you waiting for Grab this template today.
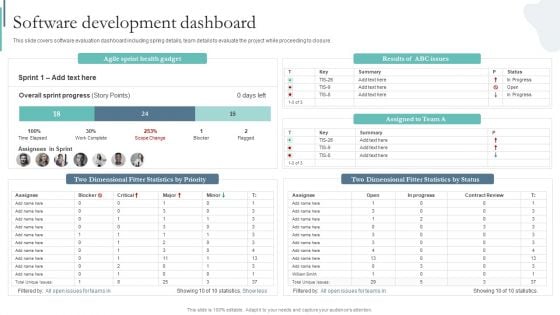
Agile Playbook For Program Designers Software Development Dashboard Ppt Infographics Brochure PDF
This slide covers software evaluation dashboard including spring details, team details to evaluate the project while proceeding to closure. If you are looking for a format to display your unique thoughts, then the professionally designed Agile Playbook For Program Designers Software Development Dashboard Ppt Infographics Brochure PDF is the one for you. You can use it as a Google Slides template or a PowerPoint template. Incorporate impressive visuals, symbols, images, and other charts. Modify or reorganize the text boxes as you desire. Experiment with shade schemes and font pairings. Alter, share or cooperate with other people on your work. Download Agile Playbook For Program Designers Software Development Dashboard Ppt Infographics Brochure PDF and find out how to give a successful presentation. Present a perfect display to your team and make your presentation unforgettable.
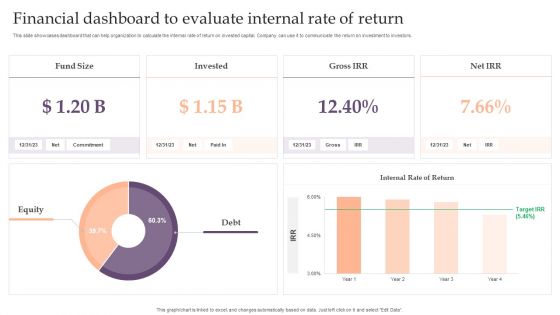
Assessing Debt And Equity Fundraising Alternatives For Business Growth Financial Dashboard To Evaluate Internal Designs PDF
This slide showcases dashboard that can help organization to calculate the internal rate of return on invested capital. Company can use it to communicate the return on investment to investors. Create an editable Assessing Debt And Equity Fundraising Alternatives For Business Growth Financial Dashboard To Evaluate Internal Designs PDF that communicates your idea and engages your audience. Whether you are presenting a business or an educational presentation, pre designed presentation templates help save time.Assessing Debt And Equity Fundraising Alternatives For Business Growth Financial Dashboard To Evaluate Internal Designs PDF is highly customizable and very easy to edit, covering many different styles from creative to business presentations. Slidegeeks has creative team members who have crafted amazing templates. So, go and get them without any delay.
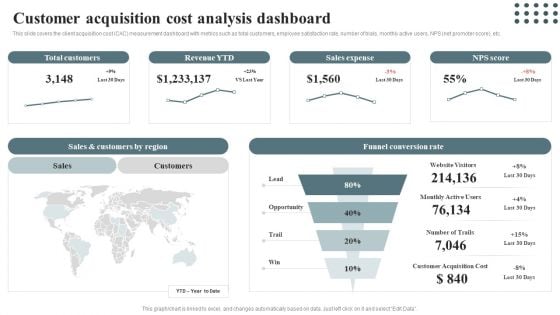
Techniques For Enhancing Buyer Acquisition Customer Acquisition Cost Analysis Dashboard Designs PDF
This slide covers the client acquisition cost CAC measurement dashboard with metrics such as total customers, employee satisfaction rate, number of trials, monthly active users, NPS net promoter score, etc.Explore a selection of the finest Techniques For Enhancing Buyer Acquisition Customer Acquisition Cost Analysis Dashboard Designs PDF here. With a plethora of professionally designed and pre-made slide templates, you can quickly and easily find the right one for your upcoming presentation. You can use our Techniques For Enhancing Buyer Acquisition Customer Acquisition Cost Analysis Dashboard Designs PDF to effectively convey your message to a wider audience. Slidegeeks has done a lot of research before preparing these presentation templates. The content can be personalized and the slides are highly editable. Grab templates today from Slidegeeks.
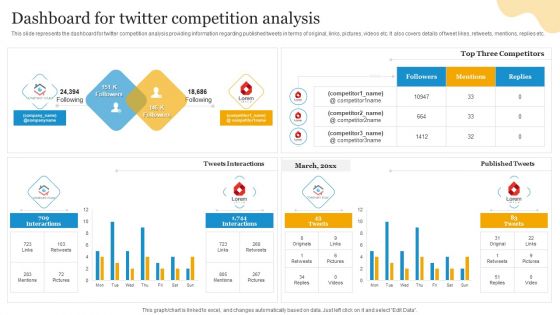
Social Media Advertising Through Twitter Dashboard For Twitter Competition Analysis Designs PDF
This slide represents the dashboard for twitter competition analysis providing information regarding published tweets in terms of original, links, pictures, videos etc. It also covers details of tweet likes, retweets, mentions, replies etc. Get a simple yet stunning designed Social Media Advertising Through Twitter Dashboard For Twitter Competition Analysis Designs PDF. It is the best one to establish the tone in your meetings. It is an excellent way to make your presentations highly effective. So, download this PPT today from Slidegeeks and see the positive impacts. Our easy to edit Social Media Advertising Through Twitter Dashboard For Twitter Competition Analysis Designs PDF can be your go to option for all upcoming conferences and meetings. So, what are you waiting for Grab this template today.
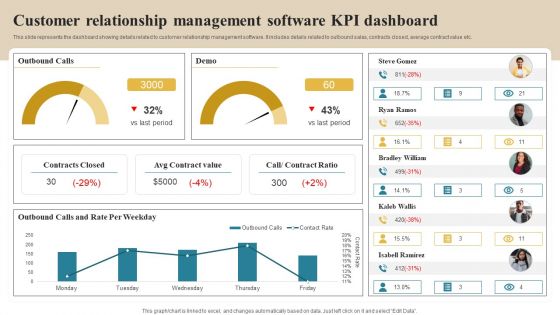
Software Implementation Technique Customer Relationship Management Software KPI Dashboard Designs PDF
This slide represents the dashboard showing details related to customer relationship management software. It includes details related to outbound sales, contracts closed, average contract value etc. Get a simple yet stunning designed Software Implementation Technique Customer Relationship Management Software KPI Dashboard Designs PDF. It is the best one to establish the tone in your meetings. It is an excellent way to make your presentations highly effective. So, download this PPT today from Slidegeeks and see the positive impacts. Our easy to edit Software Implementation Technique Customer Relationship Management Software KPI Dashboard Designs PDF can be your go to option for all upcoming conferences and meetings. So, what are you waiting for Grab this template today.
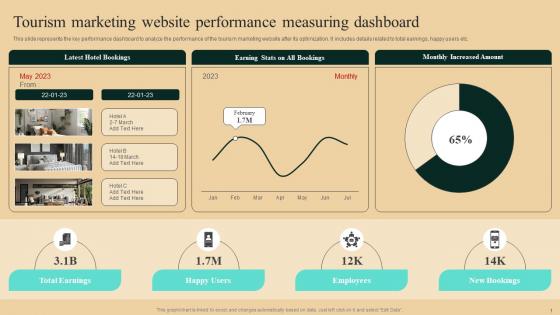
Guide To Winning Tourism Tourism Marketing Website Performance Measuring Dashboard Designs Pdf
This slide represents the key performance dashboard to analyze the performance of the tourism marketing website after its optimization. It includes details related to total earnings, happy users etc.Welcome to our selection of the Guide To Winning Tourism Tourism Marketing Website Performance Measuring Dashboard Designs Pdf These are designed to help you showcase your creativity and bring your sphere to life. Planning and Innovation are essential for any business that is just starting out. This collection contains the designs that you need for your everyday presentations. All of our PowerPoints are 100 percent editable, so you can customize them to suit your needs. This multi-purpose template can be used in various situations. Grab these presentation templates today This slide represents the key performance dashboard to analyze the performance of the tourism marketing website after its optimization. It includes details related to total earnings, happy users etc.
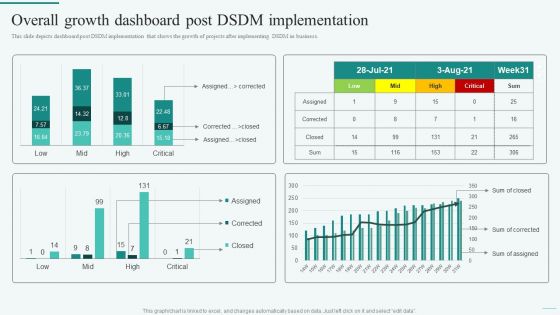
Overall Growth Dashboard Post DSDM Implementation Integration Of Dynamic System To Enhance Processes Designs PDF
This slide depicts dashboard post DSDM implementation that shows the growth of projects after implementing DSDM in business.Here you can discover an assortment of the finest PowerPoint and Google Slides templates. With these templates, you can create presentations for a variety of purposes while simultaneously providing your audience with an eye-catching visual experience. Download Overall Growth Dashboard Post DSDM Implementation Integration Of Dynamic System To Enhance Processes Designs PDF to deliver an impeccable presentation. These templates will make your job of preparing presentations much quicker, yet still, maintain a high level of quality. Slidegeeks has experienced researchers who prepare these templates and write high-quality content for you. Later on, you can personalize the content by editing the Overall Growth Dashboard Post DSDM Implementation Integration Of Dynamic System To Enhance Processes Designs PDF.
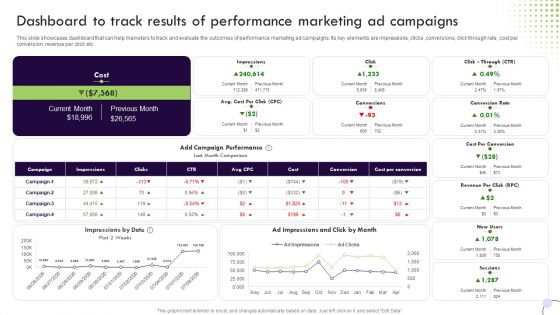
Performance Based Marketing Dashboard To Track Results Of Performance Marketing Ad Designs PDF
This slide showcases dashboard that can help marketers to track and evaluate the outcomes of performance marketing ad campaigns. Its key elements are impressions, clicks, conversions, click through rate, cost per conversion, revenue per click etc. Whether you have daily or monthly meetings, a brilliant presentation is necessary. Performance Based Marketing Dashboard To Track Results Of Performance Marketing Ad Designs PDF can be your best option for delivering a presentation. Represent everything in detail using Performance Based Marketing Dashboard To Track Results Of Performance Marketing Ad Designs PDF and make yourself stand out in meetings. The template is versatile and follows a structure that will cater to your requirements. All the templates prepared by Slidegeeks are easy to download and edit. Our research experts have taken care of the corporate themes as well. So, give it a try and see the results.
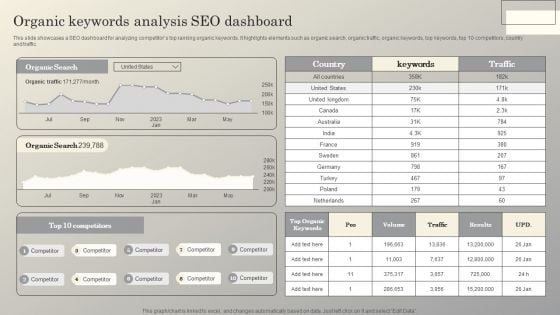
Steps To Conduct Competitor Analysis Organic Keywords Analysis Seo Dashboard Designs PDF
This slide showcases a SEO dashboard for analyzing competitors top ranking organic keywords. It highlights elements such as organic search, organic traffic, organic keywords, top keywords, top 10 competitors, country and traffic. Whether you have daily or monthly meetings, a brilliant presentation is necessary. Steps To Conduct Competitor Analysis Organic Keywords Analysis Seo Dashboard Designs PDF can be your best option for delivering a presentation. Represent everything in detail using Steps To Conduct Competitor Analysis Organic Keywords Analysis Seo Dashboard Designs PDF and make yourself stand out in meetings. The template is versatile and follows a structure that will cater to your requirements. All the templates prepared by Slidegeeks are easy to download and edit. Our research experts have taken care of the corporate themes as well. So, give it a try and see the results.
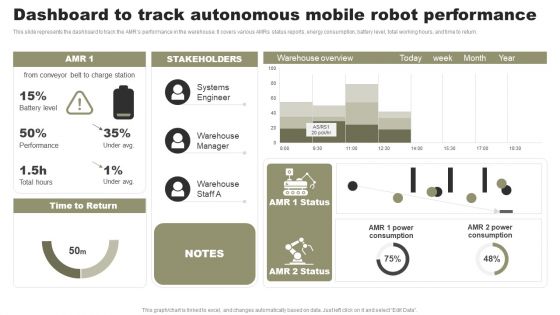
Types Of Independent Robotic System Dashboard To Track Autonomous Mobile Robot Performance Designs PDF
This slide represents the dashboard to track the AMRs performance in the warehouse. It covers various AMRs status reports, energy consumption, battery level, total working hours, and time to return. Find highly impressive Types Of Independent Robotic System Dashboard To Track Autonomous Mobile Robot Performance Designs PDF on Slidegeeks to deliver a meaningful presentation. You can save an ample amount of time using these presentation templates. No need to worry to prepare everything from scratch because Slidegeeks experts have already done a huge research and work for you. You need to download Types Of Independent Robotic System Dashboard To Track Autonomous Mobile Robot Performance Designs PDF for your upcoming presentation. All the presentation templates are 100 percent editable and you can change the color and personalize the content accordingly. Download now.
Fitness Product Promotion Campaigns Sports Team And Brand Engagement Tracking Dashboard Designs PDF
This slide showcases sports team and brand engagement tracking dashboard. It provides details about owned channels, operated channels, images, videos, hashtags, image content, video content, etc. Do you have to make sure that everyone on your team knows about any specific topic I yes, then you should give Fitness Product Promotion Campaigns Sports Team And Brand Engagement Tracking Dashboard Designs PDF a try. Our experts have put a lot of knowledge and effort into creating this impeccable Fitness Product Promotion Campaigns Sports Team And Brand Engagement Tracking Dashboard Designs PDF. You can use this template for your upcoming presentations, as the slides are perfect to represent even the tiniest detail. You can download these templates from the Slidegeeks website and these are easy to edit. So grab these today
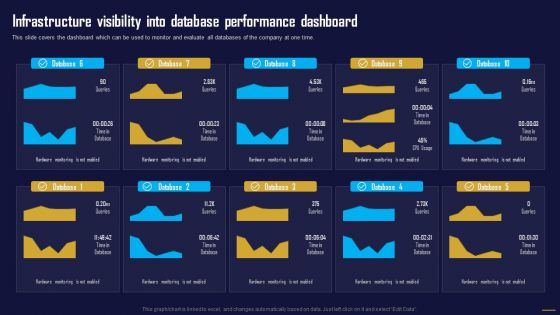
Infrastructure Visibility Into Database Dashboard Information Tech System Maintenance Designs PDF
This slide covers the dashboard which can be used to monitor and evaluate all databases of the company at one time.This slide covers the dashboard which can be used to monitor and evaluate all databases of the company at one time.Slidegeeks is one of the best resources for PowerPoint templates. You can download easily and regulate Infrastructure Visibility Into Database Dashboard Information Tech System Maintenance Designs PDF for your personal presentations from our wonderful collection. A few clicks is all it takes to discover and get the most relevant and appropriate templates. Use our Templates to add a unique zing and appeal to your presentation and meetings. All the slides are easy to edit and you can use them even for advertisement purposes.
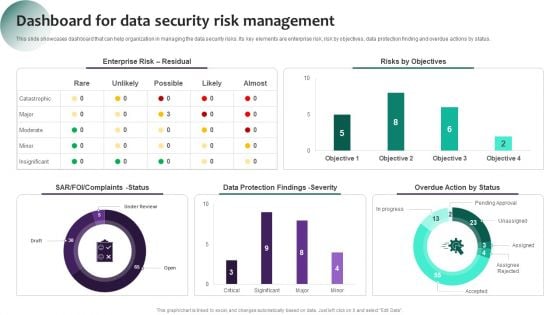
Information Systems Security And Risk Management Plan Dashboard For Data Security Risk Management Information PDF
This slide showcases dashboard that can help organization in managing the data security risks. Its key elements are enterprise risk, risk by objectives, data protection finding and overdue actions by status. If you are looking for a format to display your unique thoughts, then the professionally designed Information Systems Security And Risk Management Plan Dashboard For Data Security Risk Management Information PDF is the one for you. You can use it as a Google Slides template or a PowerPoint template. Incorporate impressive visuals, symbols, images, and other charts. Modify or reorganize the text boxes as you desire. Experiment with shade schemes and font pairings. Alter, share or cooperate with other people on your work. Download Information Systems Security And Risk Management Plan Dashboard For Data Security Risk Management Information PDF and find out how to give a successful presentation. Present a perfect display to your team and make your presentation unforgettable.
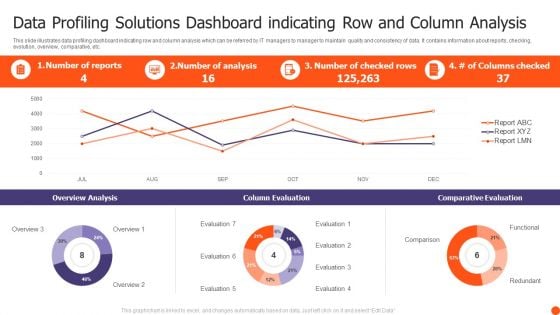
Data Profiling Solutions Dashboard Indicating Row And Column Analysis Summary PDF
This slide illustrates data profiling dashboard indicating row and column analysis which can be referred by IT managers to manager to maintain quality and consistency of data. It contains information about reports, checking, evolution, overview, comparative, etc. Showcasing this set of slides titled Data Profiling Solutions Dashboard Indicating Row And Column Analysis Summary PDF. The topics addressed in these templates are Overview Analysis, Column Evaluation, Comparative Evaluation. All the content presented in this PPT design is completely editable. Download it and make adjustments in color, background, font etc. as per your unique business setting.
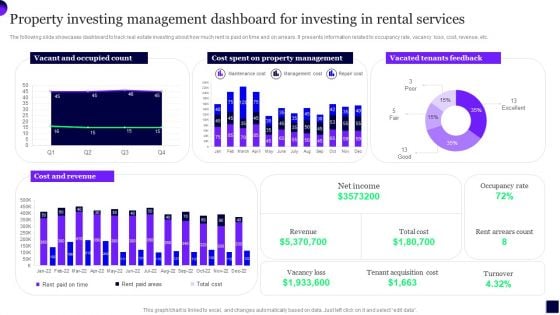
Property Investing Management Dashboard For Investing In Rental Services Template PDF
The following slide showcases dashboard to track real estate investing about how much rent is paid on time and on arrears. It presents information related to occupancy rate, vacancy loss, cost, revenue, etc. Showcasing this set of slides titled Property Investing Management Dashboard For Investing In Rental Services Template PDF. The topics addressed in these templates are Cost, Property Management, Revenue. All the content presented in this PPT design is completely editable. Download it and make adjustments in color, background, font etc. as per your unique business setting.
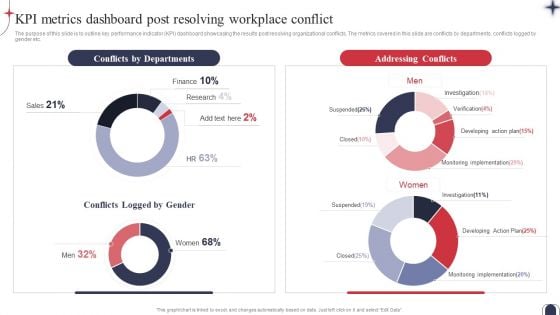
Workplace Conflict Resolution KPI Metrics Dashboard Post Resolving Workplace Designs PDF
The purpose of this slide is to outline key performance indicator KPI dashboard showcasing the results post resolving organizational conflicts. The metrics covered in this slide are conflicts by departments, conflicts logged by gender etc. The best PPT templates are a great way to save time, energy, and resources. Slidegeeks have 100 percent editable powerpoint slides making them incredibly versatile. With these quality presentation templates, you can create a captivating and memorable presentation by combining visually appealing slides and effectively communicating your message. Download Workplace Conflict Resolution KPI Metrics Dashboard Post Resolving Workplace Designs PDF from Slidegeeks and deliver a wonderful presentation.
Guide To Winning Tourism Tourism Marketing Campaign Performance Tracking Dashboard Download Pdf
This slide represents KPI dashboard to effectively measure and analyze the performance of tourism marketing campaign. It includes details related to KPIs such as page views, visitor and spend etc. This modern and well-arranged Guide To Winning Tourism Tourism Marketing Campaign Performance Tracking Dashboard Download Pdf provides lots of creative possibilities. It is very simple to customize and edit with the Powerpoint Software. Just drag and drop your pictures into the shapes. All facets of this template can be edited with Powerpoint, no extra software is necessary. Add your own material, put your images in the places assigned for them, adjust the colors, and then you can show your slides to the world, with an animated slide included. This slide represents KPI dashboard to effectively measure and analyze the performance of tourism marketing campaign. It includes details related to KPIs such as page views, visitor and spend etc.
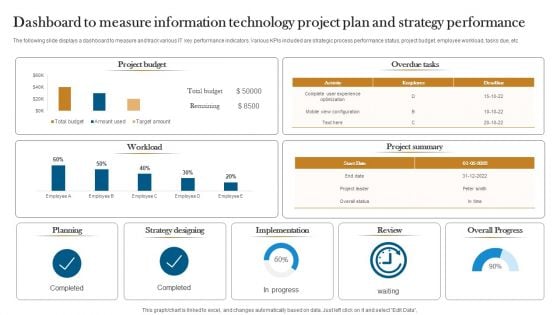
Dashboard To Measure Information Technology Project Plan And Strategy Performance Designs PDF
The following slide displays a dashboard to measure and track various IT key performance indicators. Various KPIs included are strategic process performance status, project budget, employee workload, tasks due, etc. Showcasing this set of slides titled Dashboard To Measure Information Technology Project Plan And Strategy Performance Designs PDF. The topics addressed in these templates are Strategy Designing, Implementation, Overall Progress. All the content presented in this PPT design is completely editable. Download it and make adjustments in color, background, font etc. as per your unique business setting.
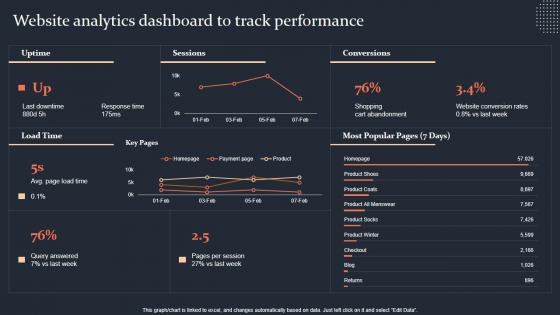
Website Analytics Dashboard To Track Performance Step By Step Guide Inspiration PDF
This graph chart is linked to excel, and changes automatically based on data. Just left click on it and select Edit Data. Slidegeeks is here to make your presentations a breeze with Website Analytics Dashboard To Track Performance Step By Step Guide Inspiration PDF With our easy-to-use and customizable templates, you can focus on delivering your ideas rather than worrying about formatting. With a variety of designs to choose from, you are sure to find one that suits your needs. And with animations and unique photos, illustrations, and fonts, you can make your presentation pop. So whether you are giving a sales pitch or presenting to the board, make sure to check out Slidegeeks first This graph chart is linked to excel, and changes automatically based on data. Just left click on it and select Edit Data.
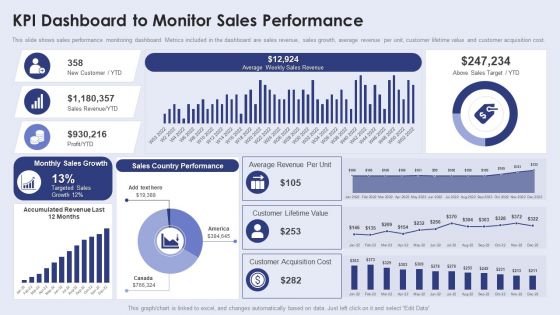
Creating New Product Launch Campaign Strategy Kpi Dashboard To Monitor Sales Performance Introduction PDF
This slide shows sales performance monitoring dashboard. Metrics included in the dashboard are sales revenue, sales growth, average revenue per unit, customer lifetime value and customer acquisition cost. This modern and well arranged Creating New Product Launch Campaign Strategy Kpi Dashboard To Monitor Sales Performance Introduction PDF provides lots of creative possibilities. It is very simple to customize and edit with the Powerpoint Software. Just drag and drop your pictures into the shapes. All facets of this template can be edited with Powerpoint no extra software is necessary. Add your own material, put your images in the places assigned for them, adjust the colors, and then you can show your slides to the world, with an animated slide included.
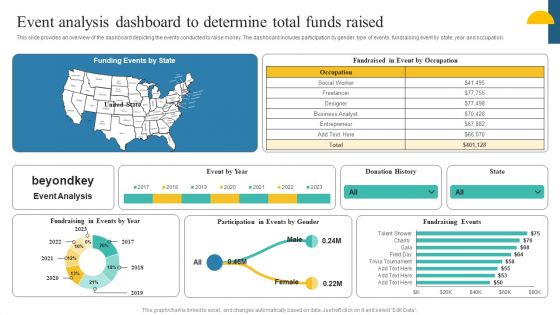
Charity Fundraising Marketing Plan Event Analysis Dashboard To Determine Total Guidelines PDF
This slide provides an overview of the dashboard depicting the events conducted to raise money. The dashboard includes participation by gender, type of events, fundraising event by state, year and occupation. This modern and well-arranged Charity Fundraising Marketing Plan Event Analysis Dashboard To Determine Total Guidelines PDF provides lots of creative possibilities. It is very simple to customize and edit with the Powerpoint Software. Just drag and drop your pictures into the shapes. All facets of this template can be edited with Powerpoint, no extra software is necessary. Add your own material, put your images in the places assigned for them, adjust the colors, and then you can show your slides to the world, with an animated slide included.
Effective NPO Promotional Strategies For Recruit Volunteers Event Analysis Dashboard Determine Total Funds Raised Icons PDF
This slide provides an overview of the dashboard depicting the events conducted to raise money. The dashboard includes participation by gender, type of events, fundraising event by state, year and occupation. This modern and well-arranged Effective NPO Promotional Strategies For Recruit Volunteers Event Analysis Dashboard Determine Total Funds Raised Icons PDF provides lots of creative possibilities. It is very simple to customize and edit with the Powerpoint Software. Just drag and drop your pictures into the shapes. All facets of this template can be edited with Powerpoint, no extra software is necessary. Add your own material, put your images in the places assigned for them, adjust the colors, and then you can show your slides to the world, with an animated slide included.
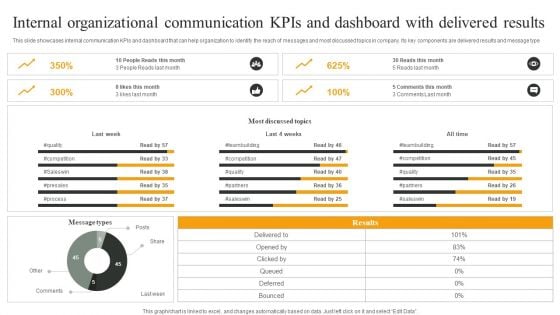
Internal Organizational Communication Kpis And Dashboard With Delivered Results Designs PDF
This slide showcases internal communication KPIs and dashboard that can help organization to identify the reach of messages and most discussed topics in company. Its key components are delivered results and message type. Showcasing this set of slides titled Internal Organizational Communication Kpis And Dashboard With Delivered Results Designs PDF. The topics addressed in these templates are Most Discussed Topics, All Time, Last Week. All the content presented in this PPT design is completely editable. Download it and make adjustments in color, background, font etc. as per your unique business setting.

Estimating Business Overall Kpi Metrics Dashboard Highlighting Organization Revenue Clipart PDF
The following slide outlines key performance indicator KPI dashboard showcasing various financial metrics of the organization. The key metrics are gross revenue, product revenue, service revenue, gross profit, net profit etc. Formulating a presentation can take up a lot of effort and time, so the content and message should always be the primary focus. The visuals of the PowerPoint can enhance the presenters message, so our Estimating Business Overall Kpi Metrics Dashboard Highlighting Organization Revenue Clipart PDF was created to help save time. Instead of worrying about the design, the presenter can concentrate on the message while our designers work on creating the ideal templates for whatever situation is needed. Slidegeeks has experts for everything from amazing designs to valuable content, we have put everything into Estimating Business Overall Kpi Metrics Dashboard Highlighting Organization Revenue Clipart PDF.


 Continue with Email

 Home
Home


