Dashboards Construction
Food Processing Business Profile Manufacturing Company Dashboard Brochure Pdf
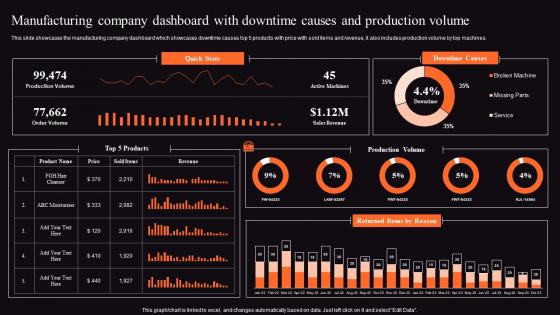
This slide showcases the manufacturing company dashboard which showcases downtime causes top 5 products with price with sold items and revenue, it also includes production volume by top machines. Do you know about Slidesgeeks Food Processing Business Profile Manufacturing Company Dashboard Brochure Pdf These are perfect for delivering any kind od presentation. Using it, create PowerPoint presentations that communicate your ideas and engage audiences. Save time and effort by using our pre designed presentation templates that are perfect for a wide range of topic. Our vast selection of designs covers a range of styles, from creative to business, and are all highly customizable and easy to edit. Download as a PowerPoint template or use them as Google Slides themes. This slide showcases the manufacturing company dashboard which showcases downtime causes top 5 products with price with sold items and revenue, it also includes production volume by top machines.
Product Reposition Dashboard Rebranding Marketing Strategies For Effective Diagrams Pdf
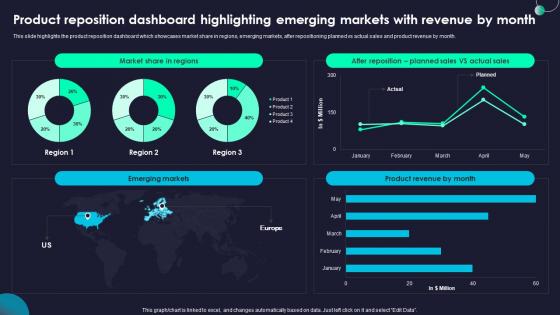
This slide highlights the product reposition dashboard which showcases market share in regions, emerging markets, after repositioning planned vs actual sales and product revenue by month. Welcome to our selection of the Product Reposition Dashboard Rebranding Marketing Strategies For Effective Diagrams Pdf, These are designed to help you showcase your creativity and bring your sphere to life. Planning and Innovation are essential for any business that is just starting out. This collection contains the designs that you need for your everyday presentations. All of our PowerPoints are 100 percent editable, so you can customize them to suit your needs. This multi purpose template can be used in various situations. Grab these presentation templates today This slide highlights the product reposition dashboard which showcases market share in regions, emerging markets, after repositioning planned vs actual sales and product revenue by month.
Website Promotion Dashboard Implementation Of Digital Advertising Strategies Rules Pdf
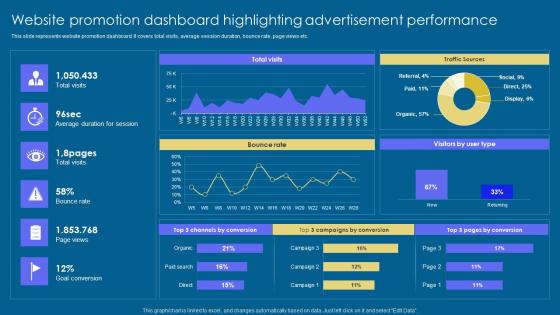
This slide represents website promotion dashboard. It covers total visits, average session duration, bounce rate, page views etc. Coming up with a presentation necessitates that the majority of the effort goes into the content and the message you intend to convey. The visuals of a PowerPoint presentation can only be effective if it supplements and supports the story that is being told. Keeping this in mind our experts created Website Promotion Dashboard Implementation Of Digital Advertising Strategies Rules Pdf to reduce the time that goes into designing the presentation. This way, you can concentrate on the message while our designers take care of providing you with the right template for the situation. This slide represents website promotion dashboard. It covers total visits, average session duration, bounce rate, page views etc.
KPI Dashboard To Assess Employee Performance Improvement Techniques Ideas Pdf
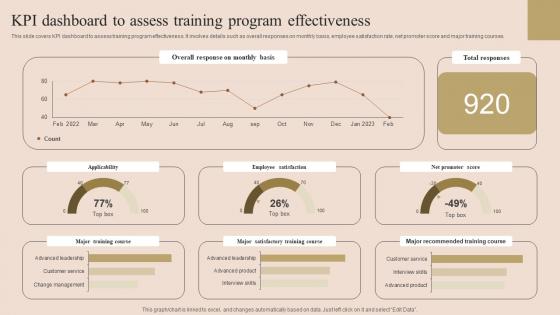
This slide covers KPI dashboard to assess training program effectiveness. It involves details such as overall responses on monthly basis, employee satisfaction rate, net promoter score and major training courses. Welcome to our selection of the KPI Dashboard To Assess Employee Performance Improvement Techniques Ideas Pdf. These are designed to help you showcase your creativity and bring your sphere to life. Planning and Innovation are essential for any business that is just starting out. This collection contains the designs that you need for your everyday presentations. All of our PowerPoints are 100 percent editable, so you can customize them to suit your needs. This multi purpose template can be used in various situations. Grab these presentation templates today This slide covers KPI dashboard to assess training program effectiveness. It involves details such as overall responses on monthly basis, employee satisfaction rate, net promoter score and major training courses.
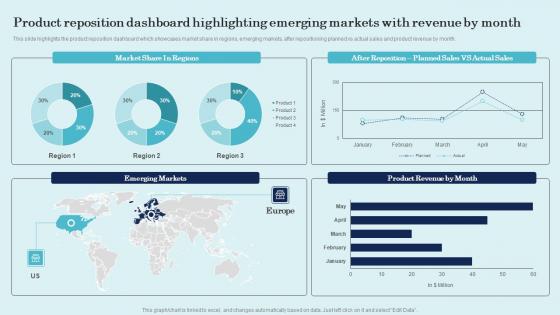
Product Reposition Dashboard Highlighting Emerging Product Repositioning Technique Pictures Pdf
This slide highlights the product reposition dashboard which showcases market share in regions, emerging markets, after repositioning planned vs actual sales and product revenue by month. Welcome to our selection of the Product Reposition Dashboard Highlighting Emerging Product Repositioning Technique Pictures Pdf. These are designed to help you showcase your creativity and bring your sphere to life. Planning and Innovation are essential for any business that is just starting out. This collection contains the designs that you need for your everyday presentations. All of our PowerPoints are 100 percent editable, so you can customize them to suit your needs. This multi-purpose template can be used in various situations. Grab these presentation templates today. This slide highlights the product reposition dashboard which showcases market share in regions, emerging markets, after repositioning planned vs actual sales and product revenue by month.
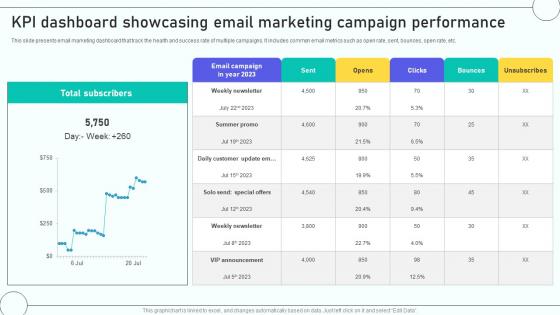
Email Marketing Automation Process KPI Dashboard Showcasing Email Marketing
This slide presents email marketing dashboard that track the health and success rate of multiple campaigns. It includes common email metrics such as open rate, sent, bounces, open rate, etc. Welcome to our selection of the Email Marketing Automation Process KPI Dashboard Showcasing Email Marketing. These are designed to help you showcase your creativity and bring your sphere to life. Planning and Innovation are essential for any business that is just starting out. This collection contains the designs that you need for your everyday presentations. All of our PowerPoints are 100 percent editable, so you can customize them to suit your needs. This multi-purpose template can be used in various situations. Grab these presentation templates today. This slide presents email marketing dashboard that track the health and success rate of multiple campaigns. It includes common email metrics such as open rate, sent, bounces, open rate, etc.

Complete Guide To Launch Website Analytics Dashboard To Track Performance
This Complete Guide To Launch Website Analytics Dashboard To Track Performance is perfect for any presentation, be it in front of clients or colleagues. It is a versatile and stylish solution for organizing your meetings. The Complete Guide To Launch Website Analytics Dashboard To Track Performance features a modern design for your presentation meetings. The adjustable and customizable slides provide unlimited possibilities for acing up your presentation. Slidegeeks has done all the homework before launching the product for you. So, do not wait, grab the presentation templates today Our Complete Guide To Launch Website Analytics Dashboard To Track Performance are topically designed to provide an attractive backdrop to any subject. Use them to look like a presentation pro.
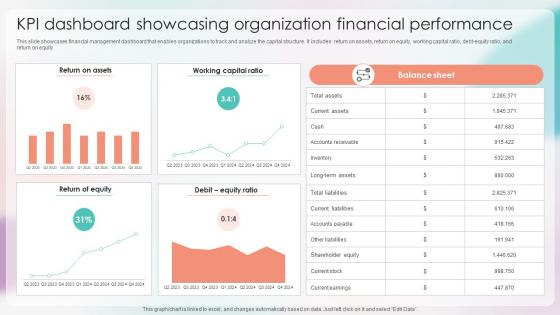
Strategies For Stabilizing Corporate KPI Dashboard Showcasing Organization Financial
This slide showcases financial management dashboard that enables organizations to track and analyze the capital structure. It includes return on assets, return on equity, working capital ratio, debt-equity ratio, and return on equity. Coming up with a presentation necessitates that the majority of the effort goes into the content and the message you intend to convey. The visuals of a PowerPoint presentation can only be effective if it supplements and supports the story that is being told. Keeping this in mind our experts created Strategies For Stabilizing Corporate KPI Dashboard Showcasing Organization Financial to reduce the time that goes into designing the presentation. This way, you can concentrate on the message while our designers take care of providing you with the right template for the situation. This slide showcases financial management dashboard that enables organizations to track and analyze the capital structure. It includes return on assets, return on equity, working capital ratio, debt-equity ratio, and return on equity.

Customer Segmentation Dashboard With Power BI Ppt Template SS
Do you have an important presentation coming up Are you looking for something that will make your presentation stand out from the rest Look no further than Customer Segmentation Dashboard With Power BI Ppt Template SS With our professional designs, you can trust that your presentation will pop and make delivering it a smooth process. And with Slidegeeks, you can trust that your presentation will be unique and memorable. So why wait Grab Customer Segmentation Dashboard With Power BI Ppt Template SS today and make your presentation stand out from the rest Our Customer Segmentation Dashboard With Power BI Ppt Template SS are topically designed to provide an attractive backdrop to any subject. Use them to look like a presentation pro.
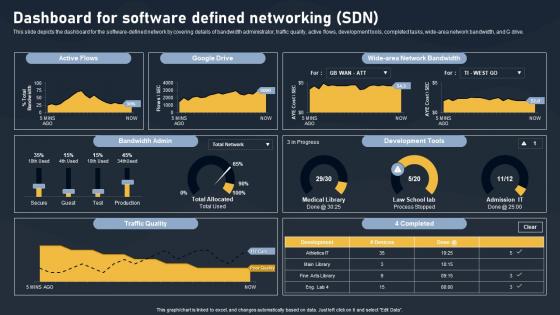
Dashboard For Software Defined Networking SDN Building Blocks Demonstration Pdf
This slide depicts the dashboard for the software-defined network by covering details of bandwidth administrator, traffic quality, active flows, development tools, completed tasks, wide-area network bandwidth, and G drive. Retrieve professionally designed Dashboard For Software Defined Networking SDN Building Blocks Demonstration Pdf to effectively convey your message and captivate your listeners. Save time by selecting pre-made slideshows that are appropriate for various topics, from business to educational purposes. These themes come in many different styles, from creative to corporate, and all of them are easily adjustable and can be edited quickly. Access them as PowerPoint templates or as Google Slides themes. You do not have to go on a hunt for the perfect presentation because Slidegeeks got you covered from everywhere. This slide depicts the dashboard for the software defined network by covering details of bandwidth administrator, traffic quality, active flows, development tools, completed tasks, wide area network bandwidth, and G drive.
B2B Sales Performance Tracking Dashboard B2B Digital Commerce Graphics Pdf
This slide represents metric dashboard to track sales performance on e-commerce website. It cover performance indicators such as sales breakdown, order breakdown, recurring sales etc. This B2B Sales Performance Tracking Dashboard B2B Digital Commerce Graphics Pdf from Slidegeeks makes it easy to present information on your topic with precision. It provides customization options, so you can make changes to the colors, design, graphics, or any other component to create a unique layout. It is also available for immediate download, so you can begin using it right away. Slidegeeks has done good research to ensure that you have everything you need to make your presentation stand out. Make a name out there for a brilliant performance. This slide represents metric dashboard to track sales performance on e-commerce website. It cover performance indicators such as sales breakdown, order breakdown, recurring sales etc.
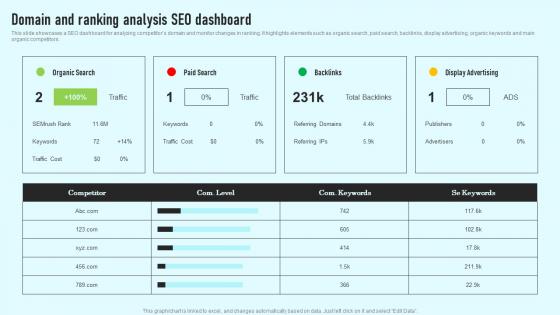
Domain And Ranking Analysis Seo Dashboard Comprehensive Guide Rules Pdf
This slide showcases a SEO dashboard for analyzing competitors domain and monitor changes in ranking. It highlights elements such as organic search, paid search, backlinks, display advertising, organic keywords and main organic competitors. Retrieve professionally designed Domain And Ranking Analysis Seo Dashboard Comprehensive Guide Rules Pdf to effectively convey your message and captivate your listeners. Save time by selecting pre-made slideshows that are appropriate for various topics, from business to educational purposes. These themes come in many different styles, from creative to corporate, and all of them are easily adjustable and can be edited quickly. Access them as PowerPoint templates or as Google Slides themes. You do not have to go on a hunt for the perfect presentation because Slidegeeks got you covered from everywhere. This slide showcases a SEO dashboard for analyzing competitors domain and monitor changes in ranking. It highlights elements such as organic search, paid search, backlinks, display advertising, organic keywords and main organic competitors.
Strategic Brand Management KPI Dashboard To Monitor Icons Pdf
Mentioned slide shows the KPI dashboard that can be used to track win and lost sales opportunities. It includes metrics namely won opportunities, lost opportunities, pipeline by territory, total opportunities. This Strategic Brand Management KPI Dashboard To Monitor Icons Pdf from Slidegeeks makes it easy to present information on your topic with precision. It provides customization options, so you can make changes to the colors, design, graphics, or any other component to create a unique layout. It is also available for immediate download, so you can begin using it right away. Slidegeeks has done good research to ensure that you have everything you need to make your presentation stand out. Make a name out there for a brilliant performance. Mentioned slide shows the KPI dashboard that can be used to track win and lost sales opportunities. It includes metrics namely won opportunities, lost opportunities, pipeline by territory, total opportunities.
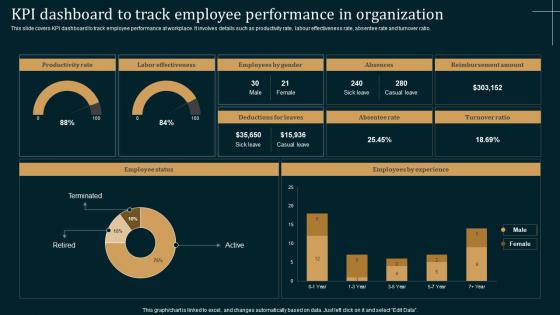
Employee Performance Improvement Strategies KPI Dashboard Track Employee Guidelines Pdf
This slide covers KPI dashboard to track employee performance at workplace. It involves details such as productivity rate, labour effectiveness rate, absentee rate and turnover ratio. Slidegeeks is here to make your presentations a breeze with Employee Performance Improvement Strategies KPI Dashboard Track Employee Guidelines Pdf With our easy to use and customizable templates, you can focus on delivering your ideas rather than worrying about formatting. With a variety of designs to choose from, you are sure to find one that suits your needs. And with animations and unique photos, illustrations, and fonts, you can make your presentation pop. So whether you are giving a sales pitch or presenting to the board, make sure to check out Slidegeeks first This slide covers KPI dashboard to track employee performance at workplace. It involves details such as productivity rate, labour effectiveness rate, absentee rate and turnover ratio.
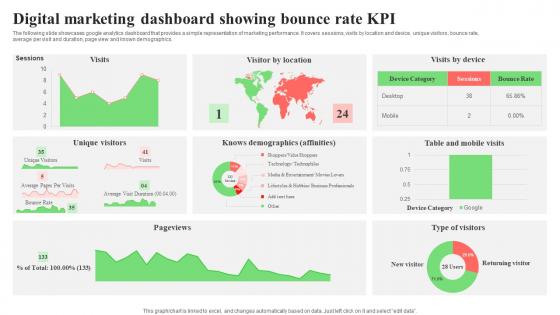
Digital Marketing Dashboard Showing Bounce Rate KPI Microsoft Pdf
The following slide showcases google analytics dashboard that provides a simple representation of marketing performance. It covers sessions, visits by location and device, unique visitors, bounce rate, average per visit and duration, page view and known demographics. Showcasing this set of slides titled Digital Marketing Dashboard Showing Bounce Rate KPI Microsoft Pdf. The topics addressed in these templates are Unique Visitors, Bounce Rate, Average Per Visit. All the content presented in this PPT design is completely editable. Download it and make adjustments in color, background, font etc. as per your unique business setting. The following slide showcases google analytics dashboard that provides a simple representation of marketing performance. It covers sessions, visits by location and device, unique visitors, bounce rate, average per visit and duration, page view and known demographics.
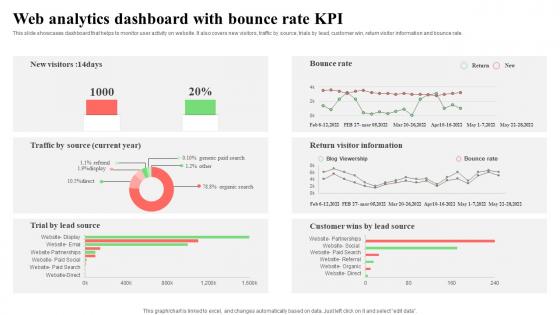
Web Analytics Dashboard With Bounce Rate KPI Elements Pdf
This slide showcases dashboard that helps to monitor user activity on website. It also covers new visitors, traffic by source, trials by lead, customer win, return visitor information and bounce rate. Showcasing this set of slides titled Web Analytics Dashboard With Bounce Rate KPI Elements Pdf. The topics addressed in these templates are Lead, Customer Win, Return Visitor Information. All the content presented in this PPT design is completely editable. Download it and make adjustments in color, background, font etc. as per your unique business setting. This slide showcases dashboard that helps to monitor user activity on website. It also covers new visitors, traffic by source, trials by lead, customer win, return visitor information and bounce rate.
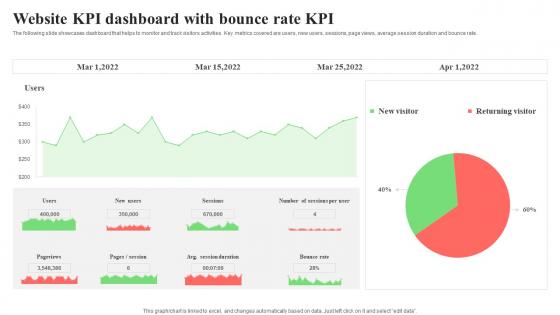
Website KPI Dashboard With Bounce Rate KPI Formats Pdf
The following slide showcases dashboard that helps to monitor and track visitors activities. Key metrics covered are users, new users, sessions, page views, average session duration and bounce rate. Pitch your topic with ease and precision using this Website KPI Dashboard With Bounce Rate KPI Formats Pdf. This layout presents information on Page Views, Average Session Duration, Bounce Rate. It is also available for immediate download and adjustment. So, changes can be made in the color, design, graphics or any other component to create a unique layout. The following slide showcases dashboard that helps to monitor and track visitors activities. Key metrics covered are users, new users, sessions, page views, average session duration and bounce rate.
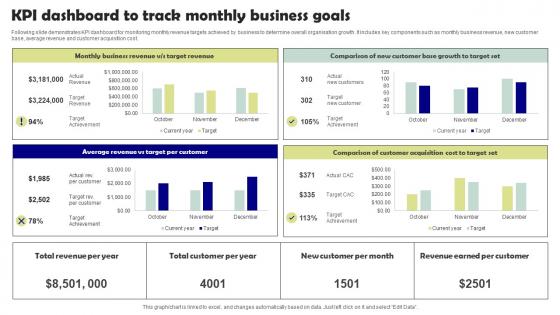
KPI Dashboard To Track Monthly Business Goals Microsoft Pdf
Following slide demonstrates KPI dashboard for monitoring monthly revenue targets achieved by business to determine overall organisation growth. It includes key components such as monthly business revenue, new customer base, average revenue and customer acquisition cost. Pitch your topic with ease and precision using this KPI Dashboard To Track Monthly Business Goals Microsoft Pdf. This layout presents information on Target Per Customer, Target Set. It is also available for immediate download and adjustment. So, changes can be made in the color, design, graphics or any other component to create a unique layout. Following slide demonstrates KPI dashboard for monitoring monthly revenue targets achieved by business to determine overall organisation growth. It includes key components such as monthly business revenue, new customer base, average revenue and customer acquisition cost.
Devops For Infrastructure Management Dashboard Showcasing Performance Tracking Portrait Pdf
This slide showcases the devops infrastructure dashboard showcasing performance tracking which helps an organization to carefully access the task completed. It include details such as work in progress, viruses, assigned items, etc. Pitch your topic with ease and precision using this Devops For Infrastructure Management Dashboard Showcasing Performance Tracking Portrait Pdf This layout presents information on Work In Progress, Backlog Work, Uncompleted Work It is also available for immediate download and adjustment. So, changes can be made in the color, design, graphics or any other component to create a unique layout. This slide showcases the devops infrastructure dashboard showcasing performance tracking which helps an organization to carefully access the task completed. It include details such as work in progress, viruses, assigned items, etc.
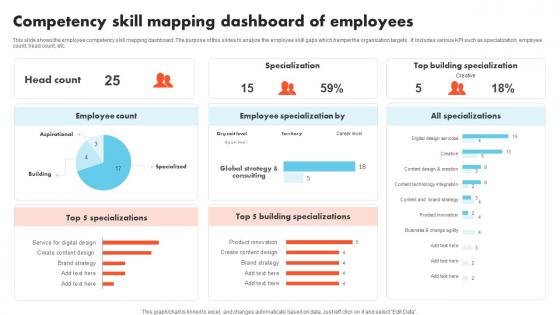
Competency Skill Mapping Dashboard Of Employees Formats Pdf
This slide shows the employee competency skill mapping dashboard .The purpose of this slides to analyze the employee skill gaps which hamper the organization targets .It includes various KPI such as specialization, employee count, head count, etc. Pitch your topic with ease and precision using this Competency Skill Mapping Dashboard Of Employees Formats Pdf This layout presents information on Employee Specialization, Building Specializations, Specialization It is also available for immediate download and adjustment. So, changes can be made in the color, design, graphics or any other component to create a unique layout. This slide shows the employee competency skill mapping dashboard .The purpose of this slides to analyze the employee skill gaps which hamper the organization targets .It includes various KPI such as specialization, employee count, head count, etc.
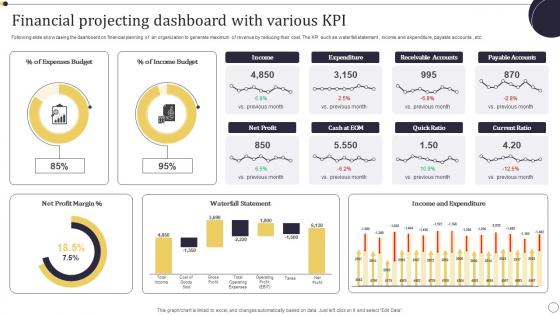
Financial Projecting Dashboard With Various KPI Themes Pdf
Following slide showcasing the dashboard on financial planning of an organization to generate maximum of revenue by reducing their cost. The KPI such as waterfall statement , income and expenditure, payable accounts , etc . Pitch your topic with ease and precision using this Financial Projecting Dashboard With Various KPI Themes Pdf. This layout presents information on Income Budget, Expenses Budget, Net Profit Margin. It is also available for immediate download and adjustment. So, changes can be made in the color, design, graphics or any other component to create a unique layout. Following slide showcasing the dashboard on financial planning of an organization to generate maximum of revenue by reducing their cost. The KPI such as waterfall statement , income and expenditure, payable accounts , etc .
KPI Dashboard For Tracking Policy Administration Progress Summary Pdf
Following slide demonstrates KPI dashboard to monitor business policies progress to improve organisation performance. It includes key component such as policies pending for review policy verification in process, expired policies, policy by control status, etc. Showcasing this set of slides titled KPI Dashboard For Tracking Policy Administration Progress Summary Pdf. The topics addressed in these templates are Process, Expired Policies, Policy Control Status. All the content presented in this PPT design is completely editable. Download it and make adjustments in color, background, font etc. as per your unique business setting. Following slide demonstrates KPI dashboard to monitor business policies progress to improve organisation performance. It includes key component such as policies pending for review policy verification in process, expired policies, policy by control status, etc.
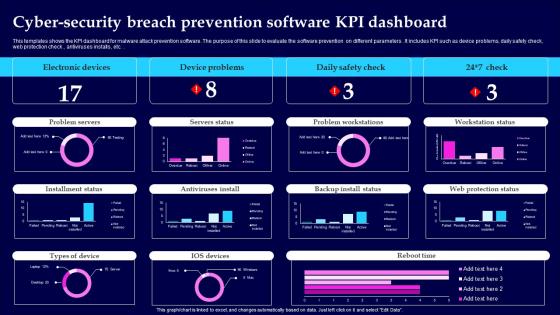
Cyber Security Breach Prevention Software KPI Dashboard Information Pdf
This templates shows the KPI dashboard for malware attack prevention software. The purpose of this slide to evaluate the software prevention on different parameters. It includes KPI such as device problems, daily safety check, web protection check, antiviruses installs , etc. Showcasing this set of slides titled Cyber Security Breach Prevention Software KPI Dashboard Information Pdf The topics addressed in these templates are Electronic Devices, Device Problems, Daily Safety Check All the content presented in this PPT design is completely editable. Download it and make adjustments in color, background, font etc. as per your unique business setting. This templates shows the KPI dashboard for malware attack prevention software. The purpose of this slide to evaluate the software prevention on different parameters. It includes KPI such as device problems, daily safety check, web protection check, antiviruses installs , etc.
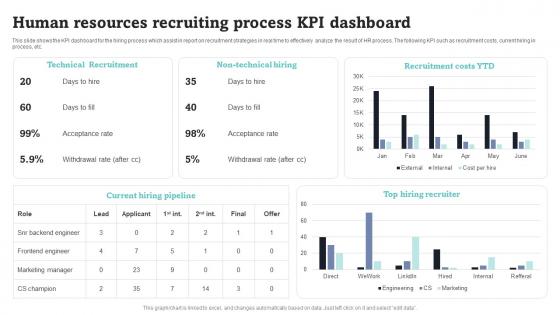
Human Resources Recruiting Process KPI Dashboard Summary Pdf
This slide shows the KPI dashboard for the hiring process which assist in report on recruitment strategies in real time to effectively analyze the result of HR process. The following KPI such as recruitment costs, current hiring in process, etc. Showcasing this set of slides titled Human Resources Recruiting Process KPI Dashboard Summary Pdf. The topics addressed in these templates are Technical Recruitment, Non Technical Hiring, Recruitment Costs. All the content presented in this PPT design is completely editable. Download it and make adjustments in color, background, font etc. as per your unique business setting. This slide shows the KPI dashboard for the hiring process which assist in report on recruitment strategies in real time to effectively analyze the result of HR process. The following KPI such as recruitment costs, current hiring in process, etc.
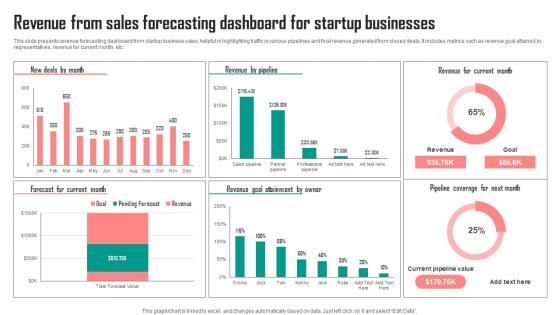
Revenue From Sales Forecasting Dashboard For Startup Businesses Graphics Pdf
This slide presents revenue forecasting dashboard from startup business sales, helpful in highlighting traffic in various pipelines and final revenue generated from closed deals. It includes metrics such as revenue goal attained by representatives, revenue for current month, etc. Showcasing this set of slides titled Revenue From Sales Forecasting Dashboard For Startup Businesses Graphics Pdf. The topics addressed in these templates are Owner, Current Month, Businesses. All the content presented in this PPT design is completely editable. Download it and make adjustments in color, background, font etc. as per your unique business setting. This slide presents revenue forecasting dashboard from startup business sales, helpful in highlighting traffic in various pipelines and final revenue generated from closed deals. It includes metrics such as revenue goal attained by representatives, revenue for current month, etc.
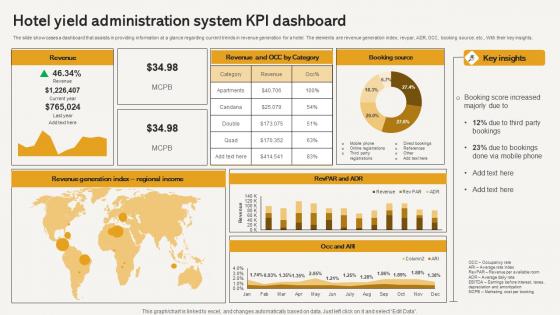
Hotel Yield Administration System Kpi Dashboard Elements Pdf
The slide showcases a dashboard that assists in providing information at a glance regarding current trends in revenue generation for a hotel. The elements are revenue generation index, revpar, ADR, OCC, booking source, etc., With their key insights. Pitch your topic with ease and precision using this Hotel Yield Administration System Kpi Dashboard Elements Pdf This layout presents information on Revenue, Booking Source, Regional Income, Key Insights It is also available for immediate download and adjustment. So, changes can be made in the color, design, graphics or any other component to create a unique layout. The slide showcases a dashboard that assists in providing information at a glance regarding current trends in revenue generation for a hotel. The elements are revenue generation index, revpar, ADR, OCC, booking source, etc., With their key insights.
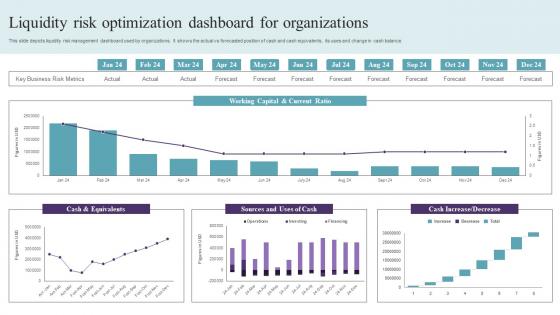
Liquidity Risk Optimization Dashboard For Organizations Graphics Pdf
This slide depicts liquidity risk management dashboard used by organizations. It shows the actual vs forecasted position of cash and cash equivalents, its uses and change in cash balance. Pitch your topic with ease and precision using this Liquidity Risk Optimization Dashboard For Organizations Graphics Pdf. This layout presents information on Cash And Equivalents, Working Capital, Current Ratio. It is also available for immediate download and adjustment. So, changes can be made in the color, design, graphics or any other component to create a unique layout. This slide depicts liquidity risk management dashboard used by organizations. It shows the actual vs forecasted position of cash and cash equivalents, its uses and change in cash balance.
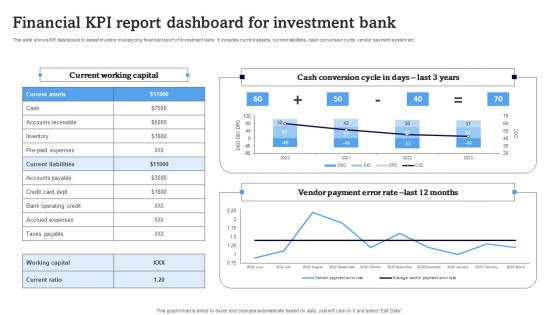
Financial KPI Report Dashboard For Investment Bank Structure Pdf
This slide shows KPI dashboard to assist investor in analyzing financial report of investment bank. It includes current assets, current liabilities, cash conversion cycle, vendor payment system etc. Showcasing this set of slides titled Financial KPI Report Dashboard For Investment Bank Structure Pdf. The topics addressed in these templates are Current Working Capital, Cash Conversion Cycle Days, Vendor Payment Error Rate. All the content presented in this PPT design is completely editable. Download it and make adjustments in color, background, font etc. as per your unique business setting. This slide shows KPI dashboard to assist investor in analyzing financial report of investment bank. It includes current assets, current liabilities, cash conversion cycle, vendor payment system etc.
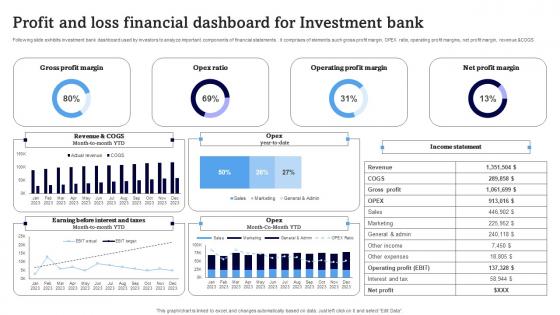
Profit And Loss Financial Dashboard For Investment Bank Download Pdf
Following slide exhibits investment bank dashboard used by investors to analyze important components of financial statements . it comprises of elements such gross profit margin, OPEX ratio, operating profit margins, net profit margin, revenue andCOGS Pitch your topic with ease and precision using this Profit And Loss Financial Dashboard For Investment Bank Download Pdf. This layout presents information on Gross Profit Margin, Opex Ratio, Operating Profit Margin. It is also available for immediate download and adjustment. So, changes can be made in the color, design, graphics or any other component to create a unique layout. Following slide exhibits investment bank dashboard used by investors to analyze important components of financial statements . it comprises of elements such gross profit margin, OPEX ratio, operating profit margins, net profit margin, revenue andCOGS

Smart Home Dashboard For Appliance Monitoring Smart Grid Working
This slide represents the smart home dashboard for monitoring total electricity consumption by rooms and appliances such as lights, microwave heating, room cooling temperature, home security, television and computers. This Smart Home Dashboard For Appliance Monitoring Smart Grid Working from Slidegeeks makes it easy to present information on your topic with precision. It provides customization options, so you can make changes to the colors, design, graphics, or any other component to create a unique layout. It is also available for immediate download, so you can begin using it right away. Slidegeeks has done good research to ensure that you have everything you need to make your presentation stand out. Make a name out there for a brilliant performance. This slide represents the smart home dashboard for monitoring total electricity consumption by rooms and appliances such as lights, microwave heating, room cooling temperature, home security, television and computers.
CASB 2 0 IT CASB Performance Tracking Dashboard
This slide outlines the performance tracking dashboard for CASB deployment. The purpose of this slide is to showcase the status of various applications, IP addresses, users, machines, and web traffic. It also includes cloud discovery open alerts, risk levels, and top entities. If your project calls for a presentation, then Slidegeeks is your go-to partner because we have professionally designed, easy-to-edit templates that are perfect for any presentation. After downloading, you can easily edit CASB 2 0 IT CASB Performance Tracking Dashboard and make the changes accordingly. You can rearrange slides or fill them with different images. Check out all the handy templates This slide outlines the performance tracking dashboard for CASB deployment. The purpose of this slide is to showcase the status of various applications, IP addresses, users, machines, and web traffic. It also includes cloud discovery open alerts, risk levels, and top entities.
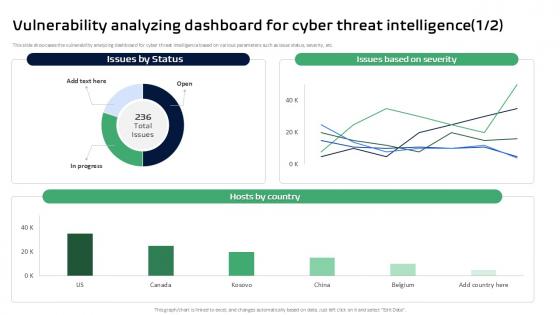
Vulnerability Analyzing Dashboard For Cyber Threat Intelligence Ppt Sample
This slide showcases the vulnerability analyzing dashboard for cyber threat intelligence based on various parameters such as issue status, severity, etc. This Vulnerability Analyzing Dashboard For Cyber Threat Intelligence Ppt Sample from Slidegeeks makes it easy to present information on your topic with precision. It provides customization options, so you can make changes to the colors, design, graphics, or any other component to create a unique layout. It is also available for immediate download, so you can begin using it right away. Slidegeeks has done good research to ensure that you have everything you need to make your presentation stand out. Make a name out there for a brilliant performance. This slide showcases the vulnerability analyzing dashboard for cyber threat intelligence based on various parameters such as issue status, severity, etc.
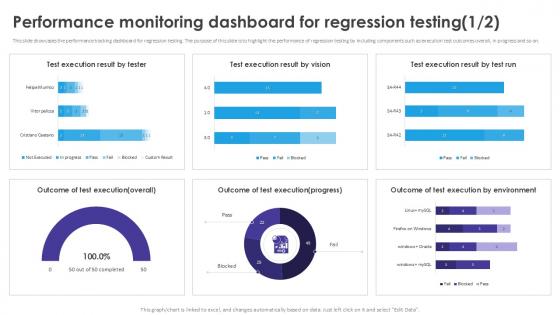
Performance Monitoring Dashboard Automated Regression Testing And Achieving PPT Example
This slide showcases the performance tracking dashboard for regression testing. The purpose of this slide is to highlight the performance of regression testing by including components such as execution test outcomes overall, in progress and so on. If your project calls for a presentation, then Slidegeeks is your go-to partner because we have professionally designed, easy-to-edit templates that are perfect for any presentation. After downloading, you can easily edit Performance Monitoring Dashboard Automated Regression Testing And Achieving PPT Example and make the changes accordingly. You can rearrange slides or fill them with different images. Check out all the handy templates This slide showcases the performance tracking dashboard for regression testing. The purpose of this slide is to highlight the performance of regression testing by including components such as execution test outcomes overall, in progress and so on.
Performance Tracking Dashboard Effective Strategies For Strengthening Food Ppt Slide
The slide showcases dashboard representing food and beverage business performance tracking tool , which assist to evaluate monthly performance of employees, customer retention etc. Retrieve professionally designed Performance Tracking Dashboard Effective Strategies For Strengthening Food Ppt Slide to effectively convey your message and captivate your listeners. Save time by selecting pre-made slideshows that are appropriate for various topics, from business to educational purposes. These themes come in many different styles, from creative to corporate, and all of them are easily adjustable and can be edited quickly. Access them as PowerPoint templates or as Google Slides themes. You do not have to go on a hunt for the perfect presentation because Slidegeeks got you covered from everywhere. The slide showcases dashboard representing food and beverage business performance tracking tool , which assist to evaluate monthly performance of employees, customer retention etc.
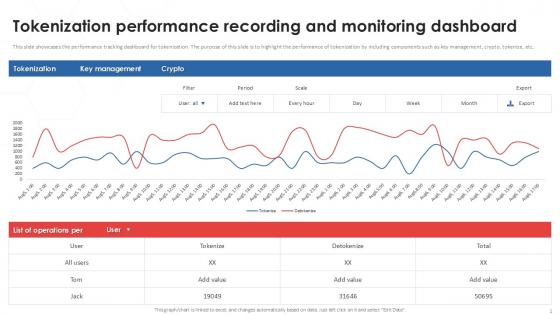
Tokenization Performance Recording And Monitoring Dashboard PPT Example
This slide showcases the performance tracking dashboard for tokenization. The purpose of this slide is to highlight the performance of tokenization by including components such as key management, crypto, tokenize, etc. Find a pre-designed and impeccable Tokenization Performance Recording And Monitoring Dashboard PPT Example. The templates can ace your presentation without additional effort. You can download these easy-to-edit presentation templates to make your presentation stand out from others. So, what are you waiting for Download the template from Slidegeeks today and give a unique touch to your presentation. This slide showcases the performance tracking dashboard for tokenization. The purpose of this slide is to highlight the performance of tokenization by including components such as key management, crypto, tokenize, etc.
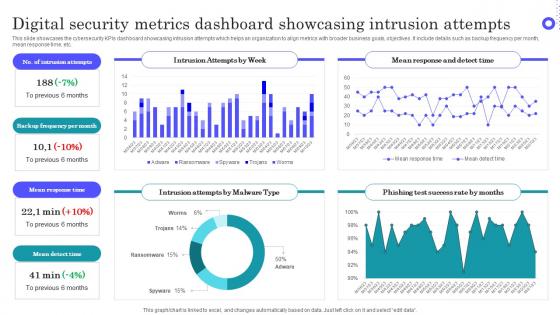
Digital Security Metrics Dashboard Showcasing Intrusion Attempts Topics Pdf
Pitch your topic with ease and precision using this Digital Security Metrics Dashboard Showcasing Intrusion Attempts Topics Pdf This layout presents information on Intrusion Attempts, Frequency Per Month, Mean Response Time It is also available for immediate download and adjustment. So, changes can be made in the color, design, graphics or any other component to create a unique layout. This slide showcases the cybersecurity KPIs dashboard showcasing intrusion attempts which helps an organization to align metrics with broader business goals, objectives. It include details such as backup frequency per month, mean response time, etc.
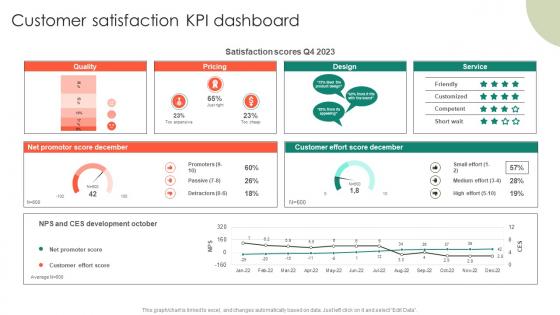
Customer Satisfaction KPI Dashboard Entrepreneurs Roadmap To Effective Demonstration Pdf
If your project calls for a presentation, then Slidegeeks is your go-to partner because we have professionally designed, easy-to-edit templates that are perfect for any presentation. After downloading, you can easily edit Customer Satisfaction KPI Dashboard Entrepreneurs Roadmap To Effective Demonstration Pdf and make the changes accordingly. You can rearrange slides or fill them with different images. Check out all the handy templates Our Customer Satisfaction KPI Dashboard Entrepreneurs Roadmap To Effective Demonstration Pdf are topically designed to provide an attractive backdrop to any subject. Use them to look like a presentation pro.

Learning And Improvement KPI Activities For Workforce Dashboard Formats Pdf
This slide provides glimpse about statistics related to progress status of training activities for employees. It includes activities, current courses status, etc. Pitch your topic with ease and precision using this Learning And Improvement KPI Activities For Workforce Dashboard Formats Pdf. This layout presents information on Learning And Improvement KPI, Workforce Dashboard, Current Courses Status. It is also available for immediate download and adjustment. So, changes can be made in the color, design, graphics or any other component to create a unique layout. This slide provides glimpse about statistics related to progress status of training activities for employees. It includes activities, current courses status, etc.
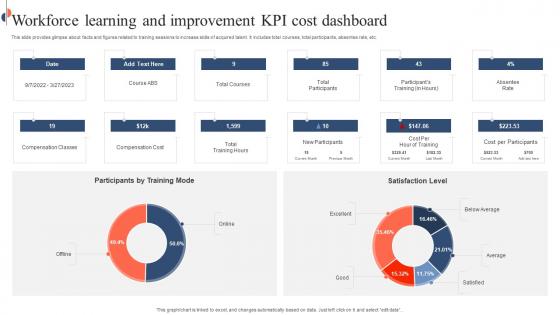
Workforce Learning And Improvement KPI Cost Dashboard Rules Pdf
This slide provides glimpse about facts and figures related to training sessions to increase skills of acquired talent. It includes total courses, total participants, absentee rate, etc. Pitch your topic with ease and precision using this Workforce Learning And Improvement KPI Cost Dashboard Rules Pdf. This layout presents information on Workforce Learning, Improvement KPI, Cost Dashboard. It is also available for immediate download and adjustment. So, changes can be made in the color, design, graphics or any other component to create a unique layout. This slide provides glimpse about facts and figures related to training sessions to increase skills of acquired talent. It includes total courses, total participants, absentee rate, etc.
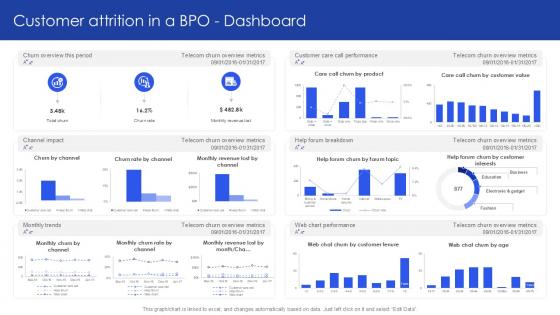
Customer Attrition In A BPO Dashboard PPT Example SS
Want to ace your presentation in front of a live audience Our Customer Attrition In A BPO Dashboard PPT Example SS can help you do that by engaging all the users towards you. Slidegeeks experts have put their efforts and expertise into creating these impeccable powerpoint presentations so that you can communicate your ideas clearly. Moreover, all the templates are customizable, and easy-to-edit and downloadable. Use these for both personal and commercial use. Our Customer Attrition In A BPO Dashboard PPT Example SS are topically designed to provide an attractive backdrop to any subject. Use them to look like a presentation pro.
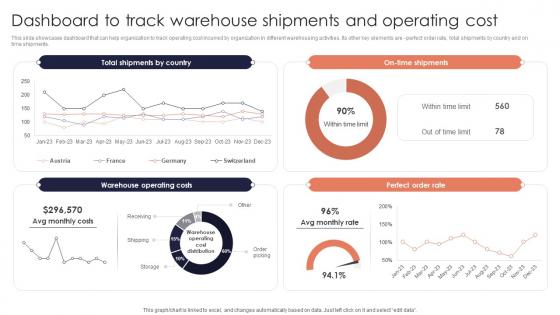
Dashboard Track Warehouse Minimizing Inventory Wastage Through Warehouse Designs Pdf
This slide showcases dashboard that can help organization to track operating cost incurred by organization in different warehousing activities. Its other key elements are perfect order rate, total shipments by country and on time shipments. Do you have to make sure that everyone on your team knows about any specific topic I yes, then you should give Dashboard Track Warehouse Minimizing Inventory Wastage Through Warehouse Designs Pdf a try. Our experts have put a lot of knowledge and effort into creating this impeccable Dashboard Track Warehouse Minimizing Inventory Wastage Through Warehouse Designs Pdf. You can use this template for your upcoming presentations, as the slides are perfect to represent even the tiniest detail. You can download these templates from the Slidegeeks website and these are easy to edit. So grab these today This slide showcases dashboard that can help organization to track operating cost incurred by organization in different warehousing activities. Its other key elements are perfect order rate, total shipments by country and on time shipments.
Pharmaceutical Management KPI Metrics And Dashboard Ppt File Professional PDF
Presenting pharmaceutical management kpi metrics and dashboard ppt file professional pdf to provide visual cues and insights. Share and navigate important information on two stages that need your due attention. This template can be used to pitch topics like kpi metrics, kpi dashboards. In addition, this PPT design contains high-resolution images, graphics, etc, that are easily editable and available for immediate download.
Hospital Management System KPI Metrics And Dashboard Microsoft PDF
Presenting hospital management system kpi metrics and dashboard microsoft pdf to provide visual cues and insights. Share and navigate important information on two stages that need your due attention. This template can be used to pitch topics like kpi metrics, kpi dashboards. In addtion, this PPT design contains high resolution images, graphics, etc, that are easily editable and available for immediate download.
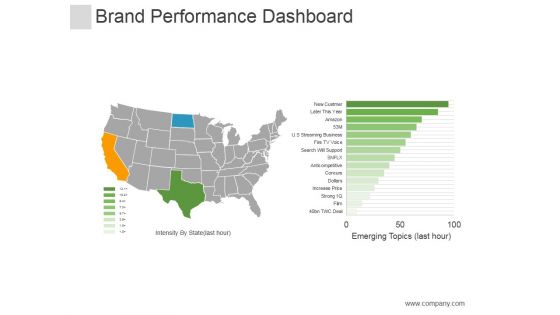
Brand Performance Dashboard Template Ppt PowerPoint Presentation Designs Download
This is a brand performance dashboard template ppt powerpoint presentation designs download. This is a five stage process. The stages in this process aresocial ,finance, icons, marketing.
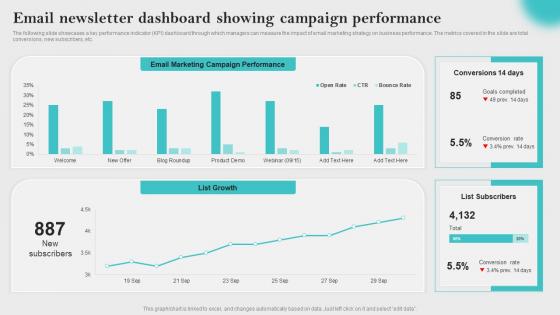
Email Newsletter Dashboard Innovative Business Promotion Ideas Sample Pdf
The following slide showcases a key performance indicator KPI dashboard through which managers can measure the impact of email marketing strategy on business performance. The metrics covered in the slide are total conversions, new subscribers, etc. Formulating a presentation can take up a lot of effort and time, so the content and message should always be the primary focus. The visuals of the PowerPoint can enhance the presenters message, so our Email Newsletter Dashboard Innovative Business Promotion Ideas Sample Pdf was created to help save time. Instead of worrying about the design, the presenter can concentrate on the message while our designers work on creating the ideal templates for whatever situation is needed. Slidegeeks has experts for everything from amazing designs to valuable content, we have put everything into Email Newsletter Dashboard Innovative Business Promotion Ideas Sample Pdf The following slide showcases a key performance indicator KPI dashboard through which managers can measure the impact of email marketing strategy on business performance. The metrics covered in the slide are total conversions, new subscribers, etc.
Dashboard Tracking Business Major Promotional Analytics Future Trends Clipart Pdf
This slide covers the dashboard for analyzing blogging KPIs such as performance, published posts, views, new blog subscribers, top blog posts by pageviews, top blog posts by CTR, etc. If you are looking for a format to display your unique thoughts, then the professionally designed Dashboard Tracking Business Major Promotional Analytics Future Trends Clipart Pdf is the one for you. You can use it as a Google Slides template or a PowerPoint template. Incorporate impressive visuals, symbols, images, and other charts. Modify or reorganize the text boxes as you desire. Experiment with shade schemes and font pairings. Alter, share or cooperate with other people on your work. Download Dashboard Tracking Business Major Promotional Analytics Future Trends Clipart Pdf and find out how to give a successful presentation. Present a perfect display to your team and make your presentation unforgettable. This slide covers the dashboard for analyzing blogging KPIs such as performance, published posts, views, new blog subscribers, top blog posts by pageviews, top blog posts by CTR, etc.
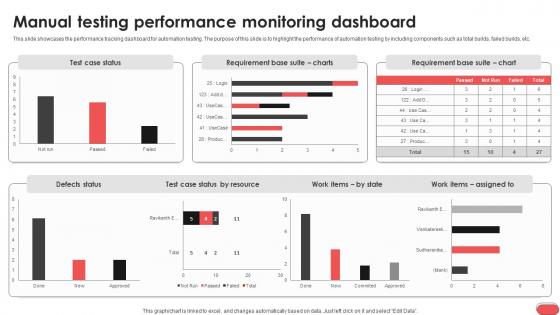
Manual Testing Performance Monitoring Dashboard Gray Box Testing Best Practices
This slide showcases the performance tracking dashboard for automation testing. The purpose of this slide is to highlight the performance of automation testing by including components such as total builds, failed builds, etc. Formulating a presentation can take up a lot of effort and time, so the content and message should always be the primary focus. The visuals of the PowerPoint can enhance the presenters message, so our Manual Testing Performance Monitoring Dashboard Gray Box Testing Best Practices was created to help save time. Instead of worrying about the design, the presenter can concentrate on the message while our designers work on creating the ideal templates for whatever situation is needed. Slidegeeks has experts for everything from amazing designs to valuable content, we have put everything into Manual Testing Performance Monitoring Dashboard Gray Box Testing Best Practices This slide showcases the performance tracking dashboard for automation testing. The purpose of this slide is to highlight the performance of automation testing by including components such as total builds, failed builds, etc.
Dashboard Analytics Measuring Supply Chain Efficiency DT SS V
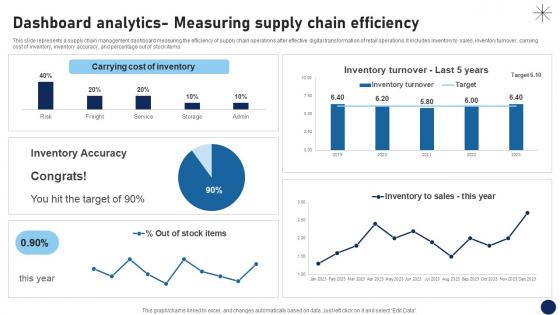
This slide represents a supply chain management dashboard measuring the efficiency of supply chain operations after effective digital transformation of retail operations. It includes inventory to sales, inventory turnover, carrying cost of inventory, inventory accuracy, and percentage out of stock items.If you are looking for a format to display your unique thoughts, then the professionally designed Dashboard Analytics Measuring Supply Chain Efficiency DT SS V is the one for you. You can use it as a Google Slides template or a PowerPoint template. Incorporate impressive visuals, symbols, images, and other charts. Modify or reorganize the text boxes as you desire. Experiment with shade schemes and font pairings. Alter, share or cooperate with other people on your work. Download Dashboard Analytics Measuring Supply Chain Efficiency DT SS V and find out how to give a successful presentation. Present a perfect display to your team and make your presentation unforgettable. This slide represents a supply chain management dashboard measuring the efficiency of supply chain operations after effective digital transformation of retail operations. It includes inventory to sales, inventory turnover, carrying cost of inventory, inventory accuracy, and percentage out of stock items.
Green Cloud Computing Performance Tracking Dashboard Eco Friendly Computing IT
This slide depicts the performance tracking dashboard for green cloud computing. This slide aims to showcase the performance tracking report of green cloud computing by covering parameters such as Power Use Effectiveness PUE, high-density zone, history, consumption, and Average Propensity to Consume APC consumption.If you are looking for a format to display your unique thoughts, then the professionally designed Green Cloud Computing Performance Tracking Dashboard Eco Friendly Computing IT is the one for you. You can use it as a Google Slides template or a PowerPoint template. Incorporate impressive visuals, symbols, images, and other charts. Modify or reorganize the text boxes as you desire. Experiment with shade schemes and font pairings. Alter, share or cooperate with other people on your work. Download Green Cloud Computing Performance Tracking Dashboard Eco Friendly Computing IT and find out how to give a successful presentation. Present a perfect display to your team and make your presentation unforgettable. This slide depicts the performance tracking dashboard for green cloud computing. This slide aims to showcase the performance tracking report of green cloud computing by covering parameters such as Power Use Effectiveness ,PUE, high-density zone, history, consumption, and Average Propensity to Consume ,APC consumption.
Project Stakeholders Management Dashboard To Track Stakeholder Satisfaction Ppt Powerpoint
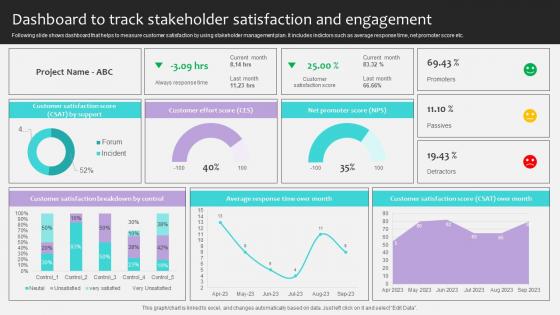
Following slide shows dashboard that helps to measure customer satisfaction by using stakeholder management plan. It includes indictors such as average response time, net promoter score etc. If you are looking for a format to display your unique thoughts, then the professionally designed Project Stakeholders Management Dashboard To Track Stakeholder Satisfaction Ppt Powerpoint is the one for you. You can use it as a Google Slides template or a PowerPoint template. Incorporate impressive visuals, symbols, images, and other charts. Modify or reorganize the text boxes as you desire. Experiment with shade schemes and font pairings. Alter, share or cooperate with other people on your work. Download Project Stakeholders Management Dashboard To Track Stakeholder Satisfaction Ppt Powerpoint and find out how to give a successful presentation. Present a perfect display to your team and make your presentation unforgettable. Following slide shows dashboard that helps to measure customer satisfaction by using stakeholder management plan. It includes indictors such as average response time, net promoter score etc.

Store Performance Dashboard In Powerpoint And Google Slides Cpb
Introducing our well designed Store Performance Dashboard In Powerpoint And Google Slides Cpb. This PowerPoint design presents information on topics like Store Performance Dashboard. As it is predesigned it helps boost your confidence level. It also makes you a better presenter because of its high quality content and graphics. This PPT layout can be downloaded and used in different formats like PDF, PNG, and JPG. Not only this, it is available in both Standard Screen and Widescreen aspect ratios for your convenience. Therefore, click on the download button now to persuade and impress your audience. Our Store Performance Dashboard In Powerpoint And Google Slides Cpb are topically designed to provide an attractive backdrop to any subject. Use them to look like a presentation pro.
Real Estate Property Management System Dashboard Ppt Styles Introduction PDF
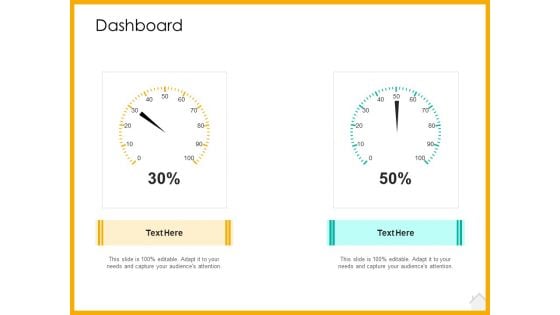
Deliver and pitch your topic in the best possible manner with this real estate property management system dashboard ppt styles introduction pdf. Use them to share invaluable insights on dashboard and impress your audience. This template can be altered and modified as per your expectations. So, grab it now.
Real Estate Asset Management Dashboard Ppt File Templates PDF
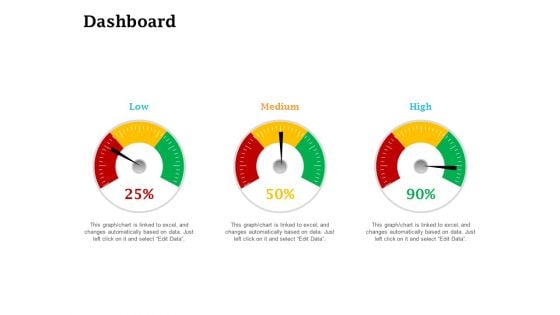
Deliver and pitch your topic in the best possible manner with this real estate asset management dashboard ppt file templates pdf. Use them to share invaluable insights on dashboard and impress your audience. This template can be altered and modified as per your expectations. So, grab it now.
Selling Home Property Dashboard Ppt Pictures Icons PDF
Deliver and pitch your topic in the best possible manner with this selling home property dashboard ppt pictures icons pdf. Use them to share invaluable insights on dashboard and impress your audience. This template can be altered and modified as per your expectations. So, grab it now.
Consumer Segmentation Dashboard Ppt Powerpoint Presentation Complete Deck With Slides
This Consumer Segmentation Dashboard Ppt Powerpoint Presentation Complete Deck With Slides acts as backup support for your ideas, vision, thoughts, etc. Use it to present a thorough understanding of the topic. This PPT slideshow can be utilized for both in-house and outside presentations depending upon your needs and business demands. Entailing twelve slides with a consistent design and theme, this template will make a solid use case. As it is intuitively designed, it suits every business vertical and industry. All you have to do is make a few tweaks in the content or any other component to design unique presentations. The biggest advantage of this complete deck is that it can be personalized multiple times once downloaded. The color, design, shapes, and other elements are free to modify to add personal touches. You can also insert your logo design in this PPT layout. Therefore a well-thought and crafted presentation can be delivered with ease and precision by downloading this Consumer Segmentation Dashboard Ppt Powerpoint Presentation Complete Deck With Slides PPT slideshow. Our Consumer Segmentation Dashboard Ppt Powerpoint Presentation Complete Deck With Slides are topically designed to provide an attractive backdrop to any subject. Use them to look like a presentation pro.
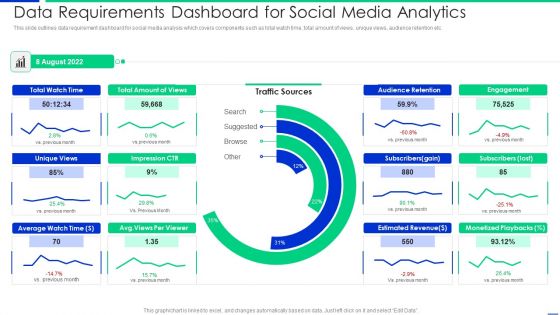
Data Requirements Dashboard For Social Media Analytics Professional PDF
This slide outlines data requirement dashboard for social media analysis which covers components such as total watch time, total amount of views, unique views, audience retention etc. Showcasing this set of slides titled data requirements dashboard for social media analytics professional pdf. The topics addressed in these templates are data requirements dashboard for social media analytics. All the content presented in this PPT design is completely editable. Download it and make adjustments in color, background, font etc. as per your unique business setting.
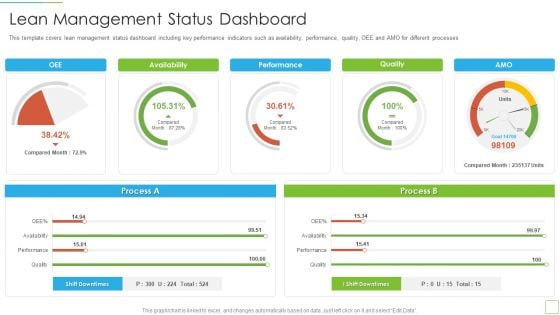
Hoshin Kanri Pitch Deck Lean Management Status Dashboard Designs PDF
This template covers lean management status dashboard including key performance indicators such as availability, performance, quality, OEE and AMO for different processes Deliver an awe inspiring pitch with this creative hoshin kanri pitch deck lean management status dashboard designs pdf bundle. Topics like lean management status dashboard can be discussed with this completely editable template. It is available for immediate download depending on the needs and requirements of the user.
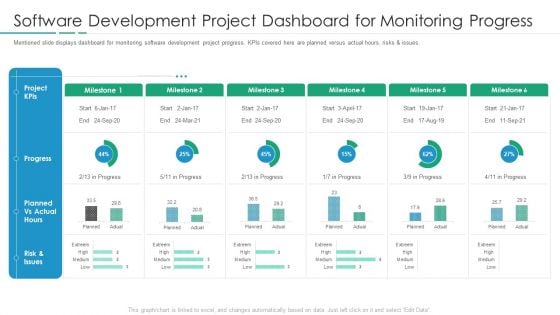
Software Development Project Dashboard For Monitoring Progress Designs PDF
Mentioned slide displays dashboard for monitoring software development project progress. KPIs covered here are planned versus actual hours, risks and issues. Deliver an awe inspiring pitch with this creative software development project dashboard for monitoring progress designs pdf bundle. Topics like software development project dashboard for monitoring progress can be discussed with this completely editable template. It is available for immediate download depending on the needs and requirements of the user.
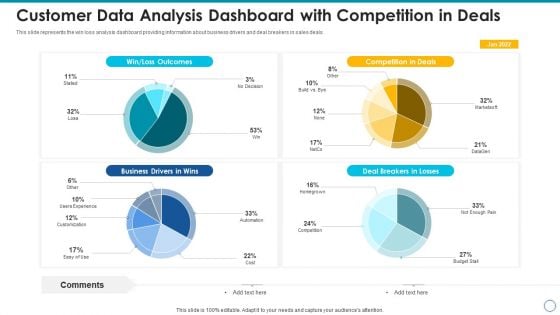
Customer Data Analysis Dashboard With Competition In Deals Infographics PDF
This slide represents the win loss analysis dashboard providing information about business drivers and deal breakers in sales deals. Pitch your topic with ease and precision using this customer data analysis dashboard with competition in deals infographics pdf. This layout presents information on customer data analysis dashboard with competition in deals. It is also available for immediate download and adjustment. So, changes can be made in the color, design, graphics or any other component to create a unique layout.
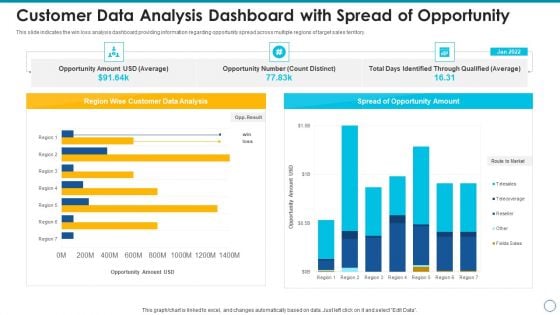
Customer Data Analysis Dashboard With Spread Of Opportunity Professional PDF
This slide indicates the win loss analysis dashboard providing information regarding opportunity spread across multiple regions of target sales territory. Showcasing this set of slides titled customer data analysis dashboard with spread of opportunity professional pdf. The topics addressed in these templates are customer data analysis dashboard with spread of opportunity. All the content presented in this PPT design is completely editable. Download it and make adjustments in color, background, font etc. as per your unique business setting.


 Continue with Email

 Home
Home


