Dashboards Summary
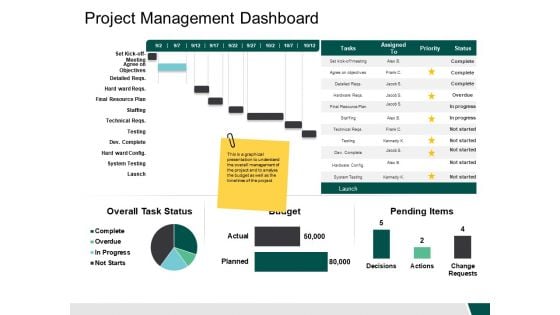
Project Management Dashboard Budget Ppt PowerPoint Presentation Slides Templates
This is a project management dashboard budget ppt powerpoint presentation slides templates. This is a two stage process. The stages in this process are finanace, management, strategy, analysis, marketing.

Loyalty Program Performance Dashboard Ppt Powerpoint Presentation Professional Templates
This is a loyalty program performance dashboard ppt powerpoint presentation professional templates. This is a six stage process. The stages in this process are finance, marketing, management, investment, analysis.
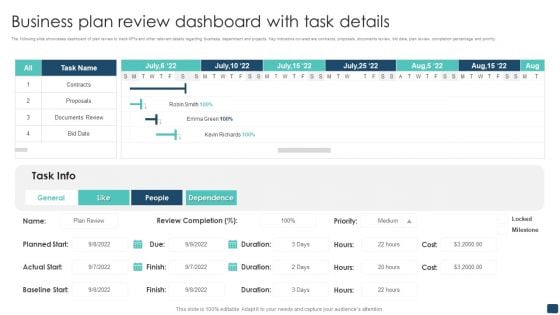
Business Plan Review Dashboard With Task Details Sample PDF
The following slide showcases dashboard of plan review to track KPIs and other relevant details regarding business, department and projects. Key indicators covered are contracts, proposals, documents review, bid date, plan review, completion percentage and priority. Pitch your topic with ease and precision using this Business Plan Review Dashboard With Task Details Sample PDF. This layout presents information on Business Plan Review, Dashboard With Task Details. It is also available for immediate download and adjustment. So, changes can be made in the color, design, graphics or any other component to create a unique layout.
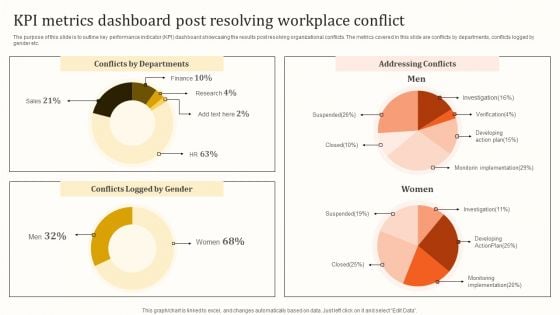
KPI Metrics Dashboard Post Resolving Workplace Conflict Template PDF
The purpose of this slide is to outline key performance indicator KPI dashboard showcasing the results post resolving organizational conflicts. The metrics covered in this slide are conflicts by departments, conflicts logged by gender etc. Presenting this PowerPoint presentation, titled KPI Metrics Dashboard Post Resolving Workplace Conflict Template PDF, with topics curated by our researchers after extensive research. This editable presentation is available for immediate download and provides attractive features when used. Download now and captivate your audience. Presenting this KPI Metrics Dashboard Post Resolving Workplace Conflict Template PDF. Our researchers have carefully researched and created these slides with all aspects taken into consideration. This is a completely customizable KPI Metrics Dashboard Post Resolving Workplace Conflict Template PDF that is available for immediate downloading. Download now and make an impact on your audience. Highlight the attractive features available with our PPTs.
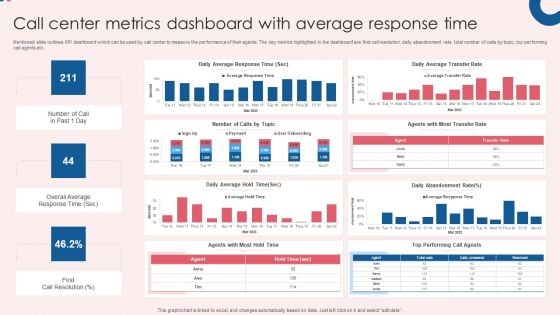
Call Center Metrics Dashboard With Average Response Time Inspiration PDF
Mentioned slide outlines KPI dashboard which can be used by call center to measure the performance of their agents. The key metrics highlighted in the dashboard are first call resolution, daily abandonment rate, total number of calls by topic, top performing call agents etc. Showcasing this set of slides titled Call Center Metrics Dashboard With Average Response Time Inspiration PDF. The topics addressed in these templates are Efficiency, Quality, Activity, Daily Average Response, Daily Average Transfer. All the content presented in this PPT design is completely editable. Download it and make adjustments in color, background, font etc. as per your unique business setting.
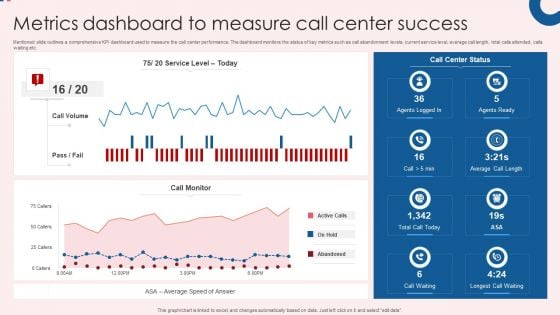
Metrics Dashboard To Measure Call Center Success Themes PDF
Mentioned slide outlines a comprehensive KPI dashboard used to measure the call center performance. The dashboard monitors the status of key metrics such as call abandonment levels, current service level, average call length, total calls attended, calls waiting etc. Showcasing this set of slides titled Metrics Dashboard To Measure Call Center Success Themes PDF. The topics addressed in these templates are Center Success, Call Center Status, Call Monitor. All the content presented in this PPT design is completely editable. Download it and make adjustments in color, background, font etc. as per your unique business setting.
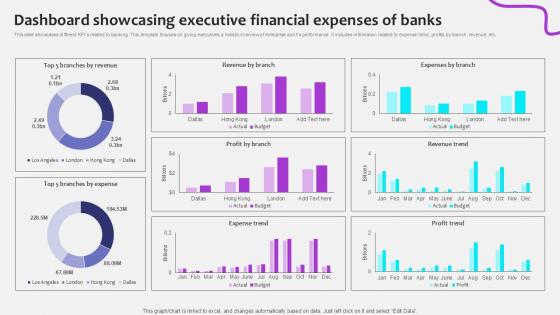
Dashboard Showcasing Executive Initiating Globalization Of Banking Ppt Template
This slide showcases different KPIs related to banking. This template focuses on giving executives a holistic overview of enterprise and ts performance. It includes information related to expense trend, profits by branch, revenue, etc. Present like a pro with Dashboard Showcasing Executive Initiating Globalization Of Banking Ppt Template. Create beautiful presentations together with your team, using our easy-to-use presentation slides. Share your ideas in real-time and make changes on the fly by downloading our templates. So whether you are in the office, on the go, or in a remote location, you can stay in sync with your team and present your ideas with confidence. With Slidegeeks presentation got a whole lot easier. Grab these presentations today. This slide showcases different KPIs related to banking. This template focuses on giving executives a holistic overview of enterprise and ts performance. It includes information related to expense trend, profits by branch, revenue, etc.
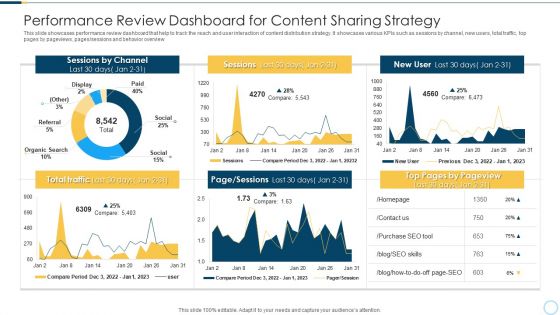
Performance Review Dashboard For Content Sharing Strategy Designs PDF
This slide showcases performance review dashboard that help to track the reach and user interaction of content distribution strategy. It showcases various KPIs such as sessions by channel, new users, total traffic, top pages by pageviews, pages or sessions and behavior overview Showcasing this set of slides titled performance review dashboard for content sharing strategy designs pdf. The topics addressed in these templates are performance review dashboard for content sharing strategy. All the content presented in this PPT design is completely editable. Download it and make adjustments in color, background, font etc. as per your unique business setting.
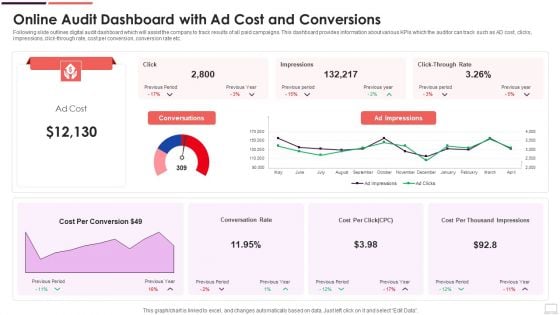
Online Audit Dashboard With Ad Cost And Conversions Themes PDF
Following slide outlines digital audit dashboard which will assist the company to track results of all paid campaigns. This dashboard provides information about various KPIs which the auditor can track such as AD cost, clicks, impressions, click through rate, cost per conversion, conversion rate etc. Pitch your topic with ease and precision using this Online Audit Dashboard With Ad Cost And Conversions Themes PDF. This layout presents information on Conversations, Impressions, Cost. It is also available for immediate download and adjustment. So, changes can be made in the color, design, graphics or any other component to create a unique layout.
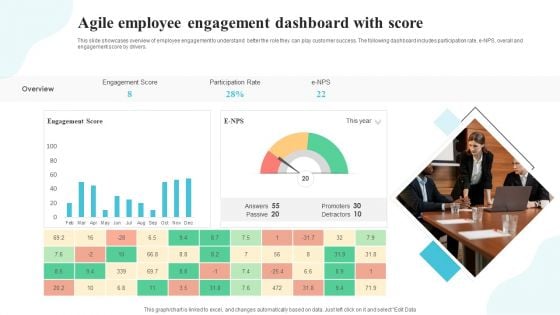
Agile Employee Engagement Dashboard With Score Introduction PDF
This slide showcases overview of employee engagement to understand better the role they can play customer success. The following dashboard includes participation rate, e-NPS, overall and engagement score by drivers. Showcasing this set of slides titled Agile Employee Engagement Dashboard With Score Introduction PDF. The topics addressed in these templates are Agile Employee Engagement, Dashboard With Score. All the content presented in this PPT design is completely editable. Download it and make adjustments in color, background, font etc. as per your unique business setting.
KPI Dashboard For Tracking Marcom Mix Strategy Progress Ideas PDF
Following slide showcases marketing mix progress monitoring dashboard to determine business performance. It includes elements such as clicks, impressions, click through rate, conversion rate, cost per click and monthly overview to Google ads. Showcasing this set of slides titled KPI Dashboard For Tracking Marcom Mix Strategy Progress Ideas PDF. The topics addressed in these templates are Kpi Dashboard, Tracking Marcom, Mix Strategy Progress. All the content presented in this PPT design is completely editable. Download it and make adjustments in color, background, font etc. as per your unique business setting.
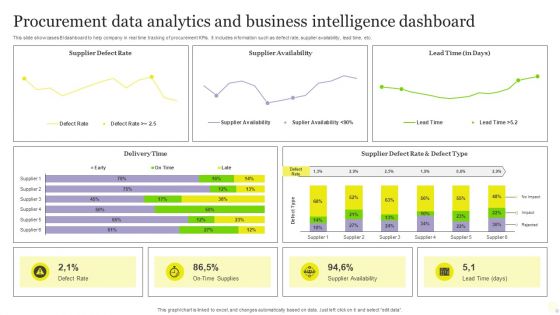
Procurement Data Analytics And Business Intelligence Dashboard Pictures PDF
This slide showcases BI dashboard to help company in real time tracking of procurement KPIs. It includes information such as defect rate, supplier availability, lead time, etc. Pitch your topic with ease and precision using this Procurement Data Analytics And Business Intelligence Dashboard Pictures PDF. This layout presents information on Procurement Data Analytics, Business Intelligence Dashboard. It is also available for immediate download and adjustment. So, changes can be made in the color, design, graphics or any other component to create a unique layout.
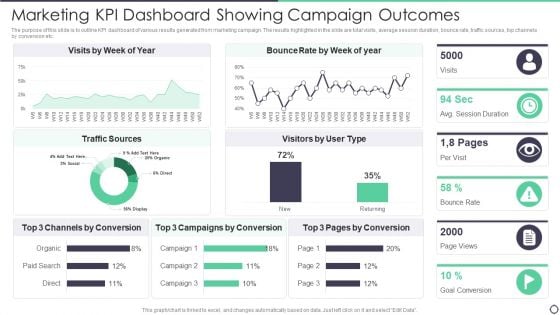
Marketing Kpi Dashboard Showing Campaign Outcomes Pictures PDF
The purpose of this slide is to outline KPI dashboard of various results generated from marketing campaign. The results highlighted in the slide are total visits, average session duration, bounce rate, traffic sources, top channels by conversion etc. Pitch your topic with ease and precision using this Marketing Kpi Dashboard Showing Campaign Outcomes Pictures PDF. This layout presents information on Marketing Kpi Dashboard Showing Campaign Outcomes. It is also available for immediate download and adjustment. So, changes can be made in the color, design, graphics or any other component to create a unique layout.
Brand Awareness Activities Tracking Dashboard Ppt Layout PDF
This slide provides information regarding brand activities tracking dashboard in terms of site traffic, attention, search, brand mentions, inbound traffic, etc. Presenting this PowerPoint presentation, titled Brand Awareness Activities Tracking Dashboard Ppt Layout PDF, with topics curated by our researchers after extensive research. This editable presentation is available for immediate download and provides attractive features when used. Download now and captivate your audience. Presenting this Brand Awareness Activities Tracking Dashboard Ppt Layout PDF. Our researchers have carefully researched and created these slides with all aspects taken into consideration. This is a completely customizable Brand Awareness Activities Tracking Dashboard Ppt Layout PDF that is available for immediate downloading. Download now and make an impact on your audience. Highlight the attractive features available with our PPTs.
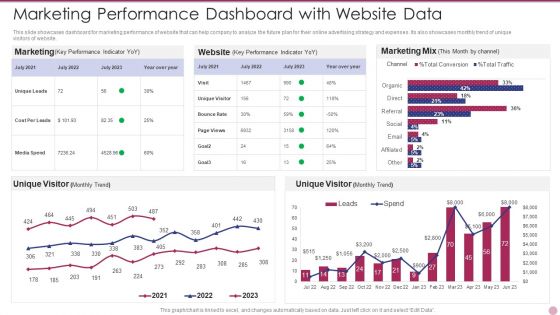
Marketing Performance Dashboard With Website Data Elements PDF
This slide showcases dashboard for marketing performance of website that can help company to analyze the future plan for their online advertising strategy and expenses. Its also showcases monthly trend of unique visitors of website. Pitch your topic with ease and precision using this Marketing Performance Dashboard With Website Data Elements PDF. This layout presents information on Marketing Performance Dashboard With Website Data. It is also available for immediate download and adjustment. So, changes can be made in the color, design, graphics or any other component to create a unique layout.
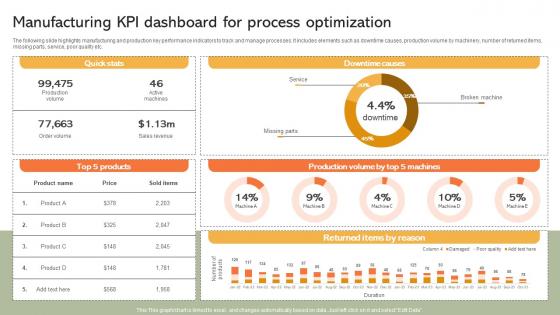
Manufacturing KPI Dashboard For Process Implementing Manufacturing Strategy SS V
The following slide highlights manufacturing and production key performance indicators to track and manage processes. It includes elements such as downtime causes, production volume by machinery, number of returned items, missing parts, service, poor quality etc. Formulating a presentation can take up a lot of effort and time, so the content and message should always be the primary focus. The visuals of the PowerPoint can enhance the presenters message, so our Manufacturing KPI Dashboard For Process Implementing Manufacturing Strategy SS V was created to help save time. Instead of worrying about the design, the presenter can concentrate on the message while our designers work on creating the ideal templates for whatever situation is needed. Slidegeeks has experts for everything from amazing designs to valuable content, we have put everything into Manufacturing KPI Dashboard For Process Implementing Manufacturing Strategy SS V The following slide highlights manufacturing and production key performance indicators to track and manage processes. It includes elements such as downtime causes, production volume by machinery, number of returned items, missing parts, service, poor quality etc.
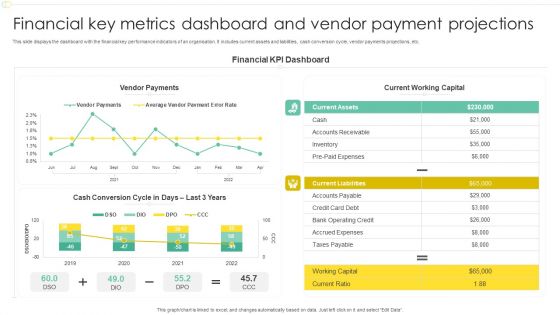
Financial Key Metrics Dashboard And Vendor Payment Projections Professional PDF
This slide displays the dashboard with the financial key performance indicators of an organisation. It includes current assets and liabilities, cash conversion cycle, vendor payments projections, etc. Pitch your topic with ease and precision using this Financial Key Metrics Dashboard And Vendor Payment Projections Professional PDF. This layout presents information on Financial KPI Dashboard, Current Working Capital, Vendor Payments. It is also available for immediate download and adjustment. So, changes can be made in the color, design, graphics or any other component to create a unique layout.
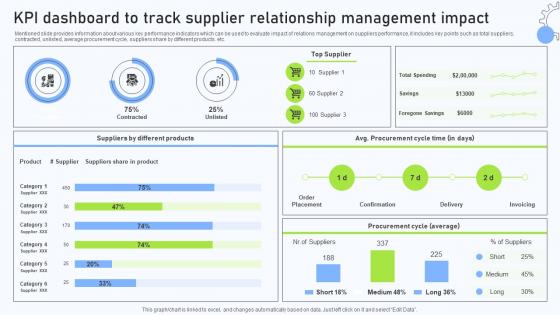
Relationship Management Automation KPI Dashboard To Track Supplier Relationship
Mentioned slide provides information about various key performance indicators which can be used to evaluate impact of relations management on suppliers performance, it includes key points such as total suppliers, contracted, unlisted, average procurement cycle, suppliers share by different products. etc. This Relationship Management Automation KPI Dashboard To Track Supplier Relationship is perfect for any presentation, be it in front of clients or colleagues. It is a versatile and stylish solution for organizing your meetings. The Relationship Management Automation KPI Dashboard To Track Supplier Relationship features a modern design for your presentation meetings. The adjustable and customizable slides provide unlimited possibilities for acing up your presentation. Slidegeeks has done all the homework before launching the product for you. So, do not wait, grab the presentation templates today Mentioned slide provides information about various key performance indicators which can be used to evaluate impact of relations management on suppliers performance, it includes key points such as total suppliers, contracted, unlisted, average procurement cycle, suppliers share by different products. etc.
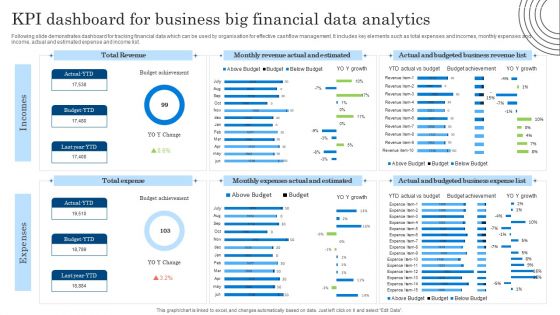
KPI Dashboard For Business Big Financial Data Analytics Diagrams PDF
Following slide demonstrates dashboard for tracking financial data which can be used by organisation for effective cashflow management. It includes key elements such as total expenses and incomes, monthly expenses and income, actual and estimated expense and income list. Showcasing this set of slides titled KPI Dashboard For Business Big Financial Data Analytics Diagrams PDF. The topics addressed in these templates are KPI Dashboard, Business Big Financial, Data Analytics. All the content presented in this PPT design is completely editable. Download it and make adjustments in color, background, font etc. as per your unique business setting.
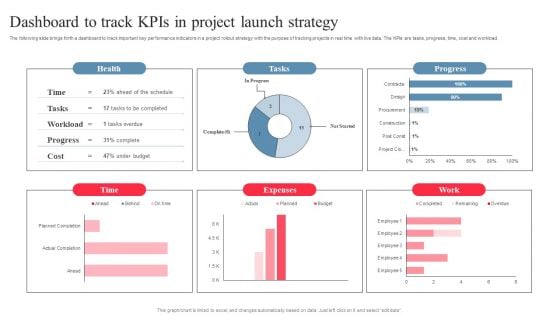
Dashboard To Track Kpis In Project Launch Strategy Pictures PDF
The following slide brings forth a dashboard to track important key performance indicators in a project rollout strategy with the purpose of tracking projects in real time with live data. The KPIs are tasks, progress, time, cost and workload. Showcasing this set of slides titled Dashboard To Track Kpis In Project Launch Strategy Pictures PDF. The topics addressed in these templates are Expenses, Project Launch Strategy, Dashboard To Track Kpis. All the content presented in this PPT design is completely editable. Download it and make adjustments in color, background, font etc. as per your unique business setting.
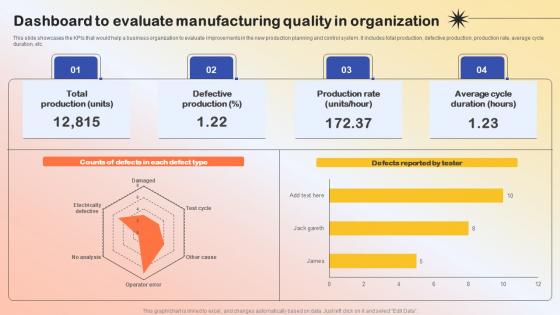
Dashboard To Evaluate Manufacturing Quality Production Quality Administration Portrait Pdf
This slide showcases the KPIs that would help a business organization to evaluate improvements in the new production planning and control system. It includes total production, defective production, production rate, average cycle duration, etc.Do you have to make sure that everyone on your team knows about any specific topic I yes, then you should give Dashboard To Evaluate Manufacturing Quality Production Quality Administration Portrait Pdf a try. Our experts have put a lot of knowledge and effort into creating this impeccable Dashboard To Evaluate Manufacturing Quality Production Quality Administration Portrait Pdf. You can use this template for your upcoming presentations, as the slides are perfect to represent even the tiniest detail. You can download these templates from the Slidegeeks website and these are easy to edit. So grab these today. This slide showcases the KPIs that would help a business organization to evaluate improvements in the new production planning and control system. It includes total production, defective production, production rate, average cycle duration, etc.
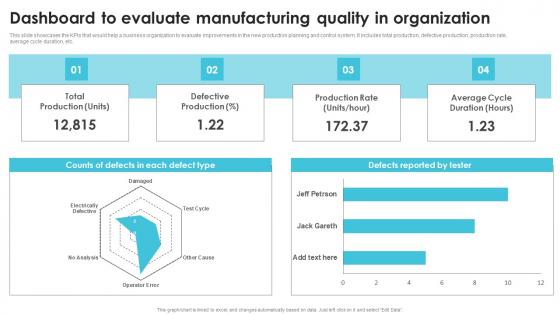
Dashboard To Evaluate Manufacturing Quality Streamlining Production Operational Professional PDF
This slide showcases the KPIs that would help a business organization to evaluate improvements in the new production planning and control system. It includes total production, defective production, production rate, average cycle duration, etc. Do you have to make sure that everyone on your team knows about any specific topic I yes, then you should give Dashboard To Evaluate Manufacturing Quality Streamlining Production Operational Professional PDF a try. Our experts have put a lot of knowledge and effort into creating this impeccable Dashboard To Evaluate Manufacturing Quality Streamlining Production Operational Professional PDF. You can use this template for your upcoming presentations, as the slides are perfect to represent even the tiniest detail. You can download these templates from the Slidegeeks website and these are easy to edit. So grab these today This slide showcases the KPIs that would help a business organization to evaluate improvements in the new production planning and control system. It includes total production, defective production, production rate, average cycle duration, etc.
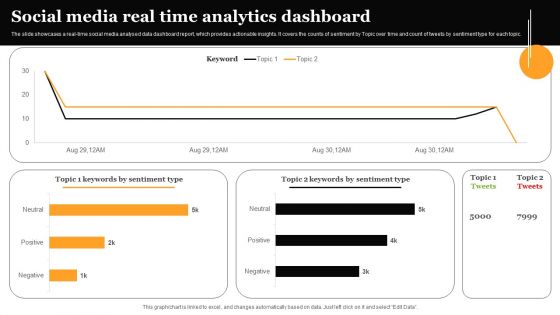
Social Media Real Time Analytics Dashboard Formats PDF
The slide showcases a real-time social media analysed data dashboard report, which provides actionable insights. It covers the counts of sentiment by Topic over time and count of tweets by sentiment type for each topic. Showcasing this set of slides titled Social Media Real Time Analytics Dashboard Formats PDF. The topics addressed in these templates are Social Media Real, Time Analytics, Dashboard. All the content presented in this PPT design is completely editable. Download it and make adjustments in color, background, font etc. as per your unique business setting.
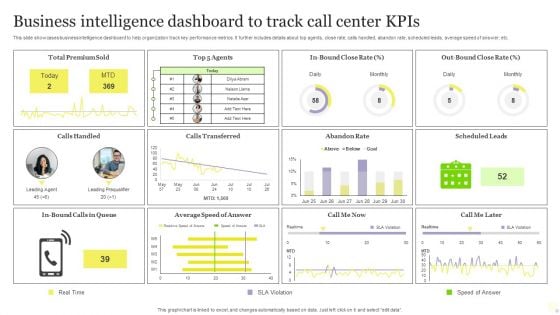
Business Intelligence Dashboard To Track Call Center Kpis Download PDF
This slide showcases business intelligence dashboard to help organization track key performance metrics. It further includes details about top agents, close rate, calls handled, abandon rate, scheduled leads, average speed of answer, etc. Pitch your topic with ease and precision using this Business Intelligence Dashboard To Track Call Center Kpis Download PDF. This layout presents information on Business Intelligence Dashboard, Track Call Center Kpis. It is also available for immediate download and adjustment. So, changes can be made in the color, design, graphics or any other component to create a unique layout.
Sales Performance Dashboard Ppt PowerPoint Presentation Professional Icons
This is a sales performance dashboard template ppt powerpoint presentation slides example file. This is a six stage process. The stages in this process are business, marketing, strategy, finance, planning.
Key Business Metrics Dashboard Ppt Powerpoint Presentation Icon Graphics Design
This is a key business metrics dashboard ppt powerpoint presentation icon graphics design. This is a five stage process. The stages in this process are finance, marketing, management, investment, analysis.
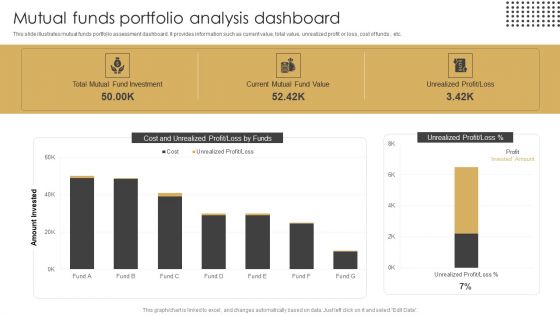
Mutual Funds Portfolio Analysis Dashboard Ppt Layouts Brochure PDF
This slide illustrates mutual funds portfolio assessment dashboard. It provides information such as current value, total value, unrealized profit or loss, cost of funds , etc. Showcasing this set of slides titled Mutual Funds Portfolio Analysis Dashboard Ppt Layouts Brochure PDF. The topics addressed in these templates are Total Mutual, Fund Investment, Current Mutual, Fund Value. All the content presented in this PPT design is completely editable. Download it and make adjustments in color, background, font etc. as per your unique business setting.
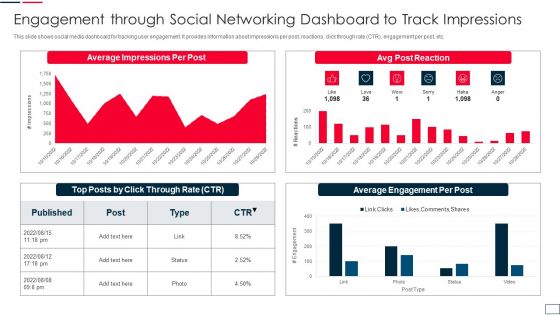
Engagement Through Social Networking Dashboard To Track Impressions Template PDF
This slide shows social media dashboard for tracking user engagement. It provides information about impressions per post, reactions, click through rate CTR, engagement per post, etc. Showcasing this set of slides titled engagement through social networking dashboard to track impressions template pdf. The topics addressed in these templates are engagement through social networking dashboard to track impressions. All the content presented in this PPT design is completely editable. Download it and make adjustments in color, background, font etc. as per your unique business setting.
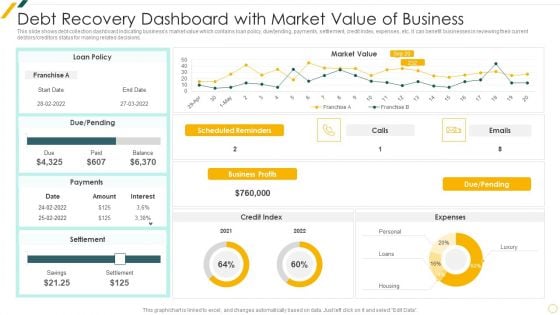
Debt Recovery Dashboard With Market Value Of Business Template PDF
This slide shows debt collection dashboard indicating businesss market value which contains loan policy, due ending, payments, settlement, credit index, expenses, etc. It can benefit businesses in reviewing their current debtors creditors status for making related decisions.Showcasing this set of slides titled Debt Recovery Dashboard With Market Value Of Business Template PDF The topics addressed in these templates are Debt Recovery, Dashboard Market, Value Of Business All the content presented in this PPT design is completely editable. Download it and make adjustments in color, background, font etc. as per your unique business setting.
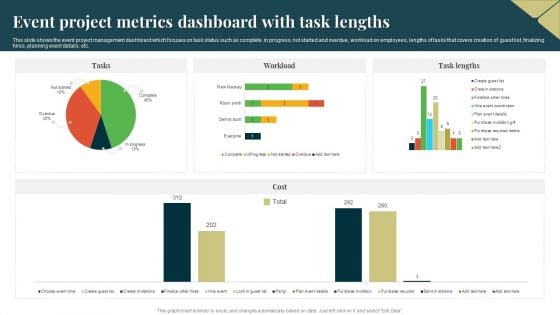
Event Project Metrics Dashboard With Task Lengths Template PDF
This slide shows the event project management dashboard which focuses on task status such as complete, in progress, not started and overdue, workload on employees, lengths of tasks that covers creation of guest list, finalizing hires, planning event details, etc. Showcasing this set of slides titled Event Project Metrics Dashboard With Task Lengths Template PDF. The topics addressed in these templates are Event Project Metrics Dashboard, Cost. All the content presented in this PPT design is completely editable. Download it and make adjustments in color, background, font etc. as per your unique business setting.
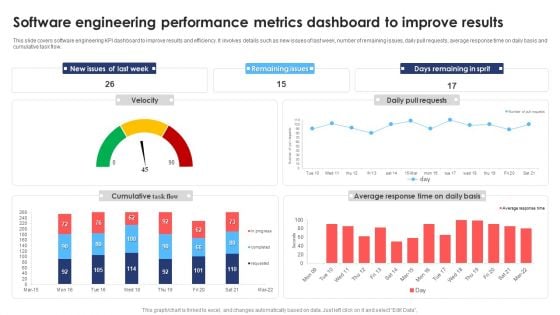
Software Engineering Performance Metrics Dashboard To Improve Results Infographics PDF
This slide covers software engineering KPI dashboard to improve results and efficiency. It involves details such as new issues of last week, number of remaining issues, daily pull requests, average response time on daily basis and cumulative task flow. Pitch your topic with ease and precision using this Software Engineering Performance Metrics Dashboard To Improve Results Infographics PDF. This layout presents information on Software Engineering Performance, Metrics Dashboard Improve Results. It is also available for immediate download and adjustment. So, changes can be made in the color, design, graphics or any other component to create a unique layout.
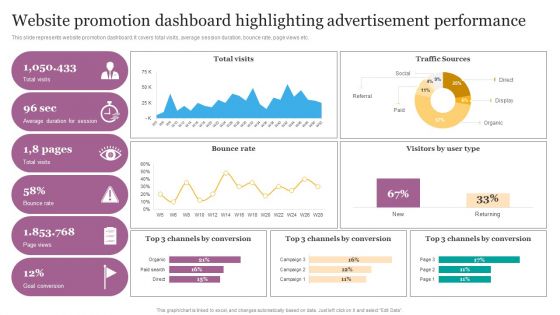
Website Promotion Dashboard Highlighting Advertisement Performance Ppt Infographics Portfolio PDF
This slide represents website promotion dashboard. It covers total visits, average session duration, bounce rate, page views etc. Create an editable Website Promotion Dashboard Highlighting Advertisement Performance Ppt Infographics Portfolio PDF that communicates your idea and engages your audience. Whether youre presenting a business or an educational presentation, pre designed presentation templates help save time. Website Promotion Dashboard Highlighting Advertisement Performance Ppt Infographics Portfolio PDF is highly customizable and very easy to edit, covering many different styles from creative to business presentations. Slidegeeks has creative team members who have crafted amazing templates. So, go and get them without any delay.
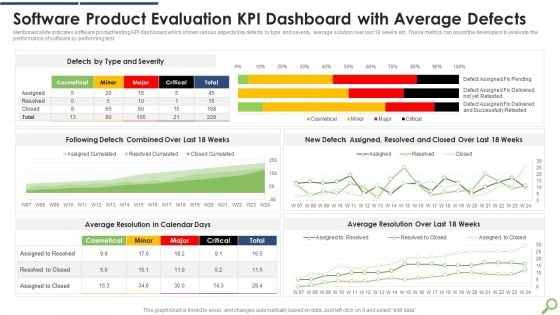
Software Product Evaluation KPI Dashboard With Average Defects Infographics PDF
Mentioned slide indicates software product testing KPI dashboard which shows various aspects like defects by type and severity, average solution over last 18 weeks etc. These metrics can assist the developers to evaluate the performance of software by performing test.Showcasing this set of slides titled Software Product Evaluation KPI Dashboard With Average Defects Infographics PDF The topics addressed in these templates are Software Product, Evaluation Dashboard, Average Defects All the content presented in this PPT design is completely editable. Download it and make adjustments in color, background, font etc. as per your unique business setting.
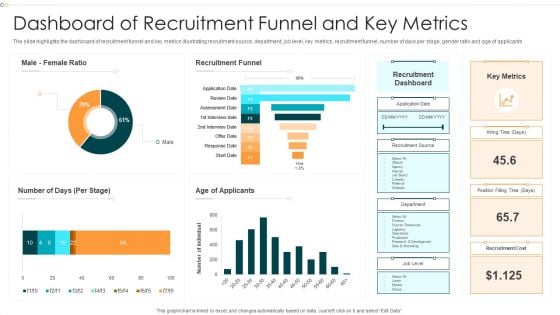
Dashboard Of Recruitment Funnel And Key Metrics Information PDF
The slide highlights the dashboard of recruitment funnel and key metrics illustrating recruitment source, department, job level, key metrics, recruitment funnel, number of days per stage, gender ratio and age of applicants.Pitch your topic with ease and precision using this Dashboard Of Recruitment Funnel And Key Metrics Information PDF This layout presents information on Recruitment Funnel, Recruitment Dashboard, Recruitment Cost It is also available for immediate download and adjustment. So, changes can be made in the color, design, graphics or any other component to create a unique layout.
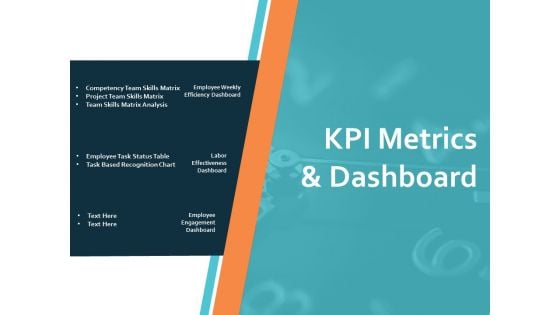
KPI Metrics And Dashboard Ppt PowerPoint Presentation Infographics Model
This is a kpi metrics and dashboard ppt powerpoint presentation infographics model. This is a three stage process. The stages in this process are business, planning, strategy, marketing, management.
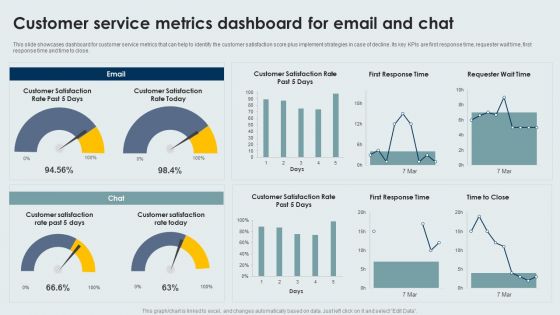
Customer Service Metrics Dashboard For Email And Chat Infographics PDF
This slide showcases dashboard for customer service metrics that can help to identify the customer satisfaction score plus implement strategies in case of decline. Its key KPIs are first response time, requester wait time, first response time and time to close. Pitch your topic with ease and precision using this Customer Service Metrics Dashboard For Email And Chat Infographics PDF. This layout presents information on Customer Service, Metrics Dashboard, Email And Chat. It is also available for immediate download and adjustment. So, changes can be made in the color, design, graphics or any other component to create a unique layout.
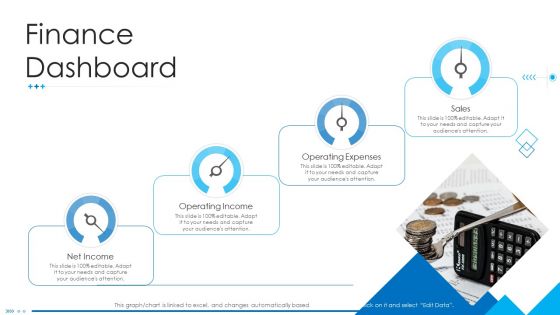
Business Scheme Management Synopsis Finance Dashboard Diagrams PDF
Deliver and pitch your topic in the best possible manner with this business scheme management synopsis finance dashboard diagrams pdf. Use them to share invaluable insights on operating, income, expenses, sales and impress your audience. This template can be altered and modified as per your expectations. So, grab it now.
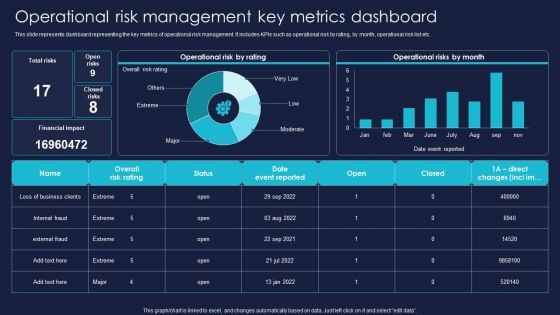
Operational Risk Management Key Metrics Dashboard Professional PDF
This slide represents dashboard representing the key metrics of operational risk management. It includes KPIs such as operational risk by rating, by month, operational risk list etc. Get a simple yet stunning designed Operational Risk Management Key Metrics Dashboard Professional PDF. It is the best one to establish the tone in your meetings. It is an excellent way to make your presentations highly effective. So, download this PPT today from Slidegeeks and see the positive impacts. Our easy to edit Operational Risk Management Key Metrics Dashboard Professional PDF can be your go-to option for all upcoming conferences and meetings. So, what are you waiting for Grab this template today.
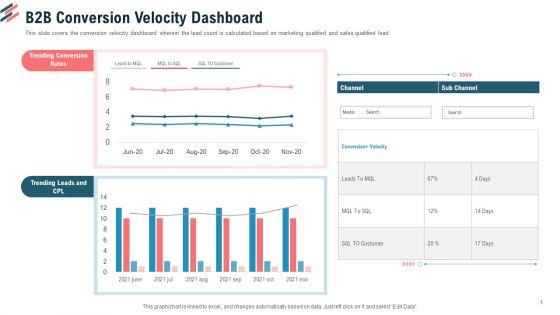
B2B Conversion Velocity Dashboard Ppt Outline Slide Portrait PDF
This slide covers the conversion velocity dashboard wherein the lead count is calculated based on marketing qualified and sales qualified lead.Deliver an awe-inspiring pitch with this creative B2B conversion velocity dashboard ppt outline slide portrait pdf. bundle. Topics like trending conversion rates, trending leads and cpl can be discussed with this completely editable template. It is available for immediate download depending on the needs and requirements of the user.
Dashboard And Kpis Marketing Ppt PowerPoint Presentation Ideas Portrait
This is a dashboard and kpis marketing ppt powerpoint presentation ideas portrait. The topics discussed in this diagram are marketing, business, management, planning, strategy This is a completely editable PowerPoint presentation, and is available for immediate download.
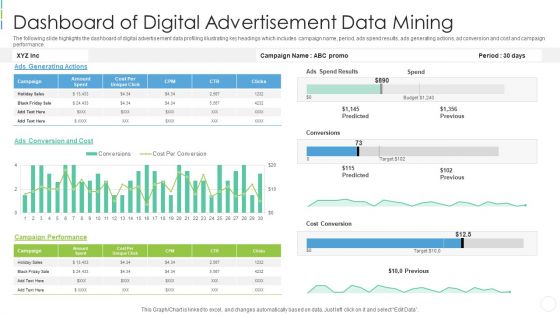
Dashboard Of Digital Advertisement Data Mining Professional PDF
The following slide highlights the dashboard of digital advertisement data profiling illustrating key headings which includes campaign name, period, ads spend results, ads generating actions, ad conversion and cost and campaign performance. Pitch your topic with ease and precision using this dashboard of digital advertisement data mining professional pdf . This layout presents information on dashboard of digital advertisement data mining . It is also available for immediate download and adjustment. So, changes can be made in the color, design, graphics or any other component to create a unique layout.
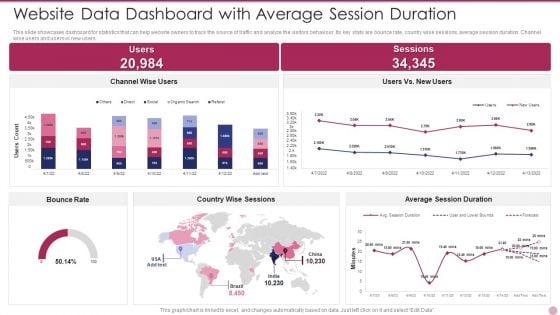
Website Data Dashboard With Average Session Duration Ideas PDF
This slide showcases dashboard for statistics that can help website owners to track the source of traffic and analyze the visitors behaviour. Its key stats are bounce rate, country wise sessions, average session duration. Channel wise users and users vs new users. Pitch your topic with ease and precision using this Website Data Dashboard With Average Session Duration Ideas PDF. This layout presents information on Website Data Dashboard With Average Session Duration. It is also available for immediate download and adjustment. So, changes can be made in the color, design, graphics or any other component to create a unique layout.
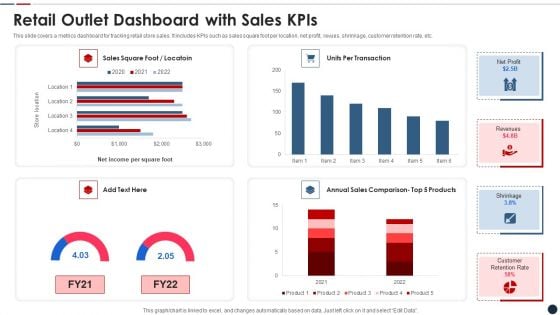
Retail Outlet Dashboard With Sales Kpis Clipart PDF
This slide covers a metrics dashboard for tracking retail store sales. It includes KPIs such as sales square foot per location, net profit, revues, shrinkage, customer retention rate, etc. Pitch your topic with ease and precision using this retail outlet dashboard with sales kpis clipart pdf This layout presents information on Retail outlet dashboard with sales kpis It is also available for immediate download and adjustment. So, changes can be made in the color, design, graphics or any other component to create a unique layout.
Waste Bin Kpi Dashboard Ppt PowerPoint Presentation Icon Show PDF
This slide covers the Key performance indicator for waste bins such as fill level, odour level and weight. Deliver an awe inspiring pitch with this creative waste bin kpi dashboard ppt powerpoint presentation icon show pdf bundle. Topics like waste bin kpi dashboard can be discussed with this completely editable template. It is available for immediate download depending on the needs and requirements of the user.
Waste Management Tracking Dashboard Ppt PowerPoint Presentation File Information PDF
This slide covers the key performance indicators for waste management including waste trucks tracker, green house gasses emissions, energy used and many more. Deliver an awe inspiring pitch with this creative waste management tracking dashboard ppt powerpoint presentation file information pdf bundle. Topics like waste management tracking dashboard can be discussed with this completely editable template. It is available for immediate download depending on the needs and requirements of the user.
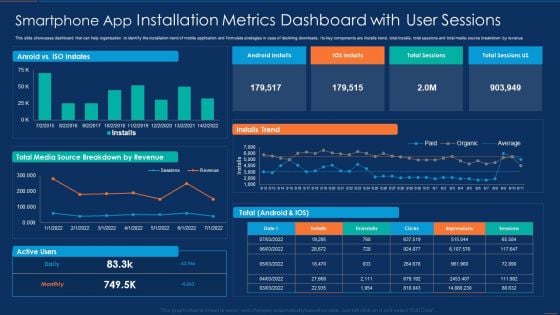
Smartphone App Installation Metrics Dashboard With User Sessions Microsoft PDF
This slide showcases dashboard that can help organization to identify the installation trend of mobile application and formulate strategies in case of declining downloads. Its key components are installs trend, total installs, total sessions and total media source breakdown by revenue. Pitch your topic with ease and precision using this Smartphone App Installation Metrics Dashboard With User Sessions Microsoft PDF. This layout presents information on Smartphone App Installation Metrics Dashboard With User Sessions. It is also available for immediate download and adjustment. So, changes can be made in the color, design, graphics or any other component to create a unique layout.
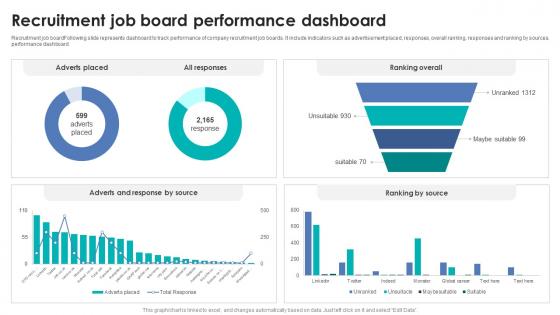
Integrating Automation For Effective Business Recruitment Job Board Performance Dashboard
Recruitment job boardFollowing slide represents dashboard to track performance of company recruitment job boards. It include indicators such as advertisement placed, responses, overall ranking, responses and ranking by sources performance dashboard. Presenting this PowerPoint presentation, titled Integrating Automation For Effective Business Recruitment Job Board Performance Dashboard, with topics curated by our researchers after extensive research. This editable presentation is available for immediate download and provides attractive features when used. Download now and captivate your audience. Presenting this Integrating Automation For Effective Business Recruitment Job Board Performance Dashboard. Our researchers have carefully researched and created these slides with all aspects taken into consideration. This is a completely customizable Integrating Automation For Effective Business Recruitment Job Board Performance Dashboard that is available for immediate downloading. Download now and make an impact on your audience. Highlight the attractive features available with our PPTs. Recruitment job boardFollowing slide represents dashboard to track performance of company recruitment job boards. It include indicators such as advertisement placed, responses, overall ranking, responses and ranking by sources performance dashboard.
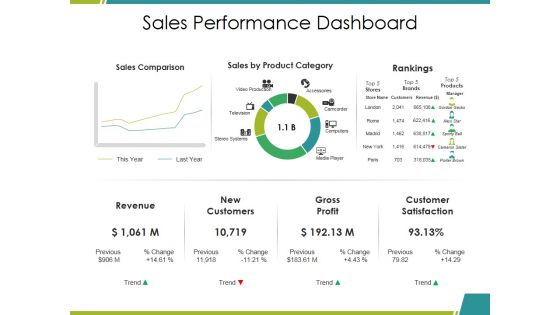
Sales Performance Dashboard Ppt PowerPoint Presentation Infographics Mockup
This is a sales performance dashboard ppt powerpoint presentation infographics mockup. This is a three stage process. The stages in this process are sales comparison, sales by product category, rankings, revenue, gross profit.
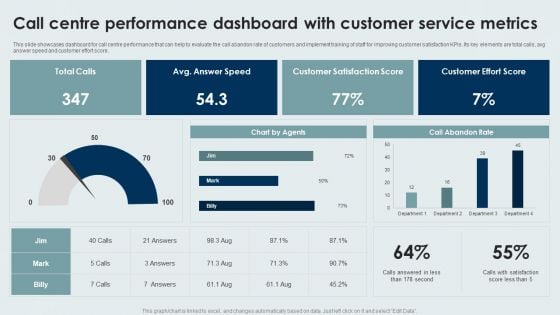
Call Centre Performance Dashboard With Customer Service Metrics Background PDF
This slide showcases dashboard for call centre performance that can help to evaluate the call abandon rate of customers and implement training of staff for improving customer satisfaction KPIs. Its key elements are total calls, avg answer speed and customer effort score. Showcasing this set of slides titled Call Centre Performance Dashboard With Customer Service Metrics Background PDF. The topics addressed in these templates are Call Centre Performance Dashboard, Customer Service Metrics. All the content presented in this PPT design is completely editable. Download it and make adjustments in color, background, font etc. as per your unique business setting.
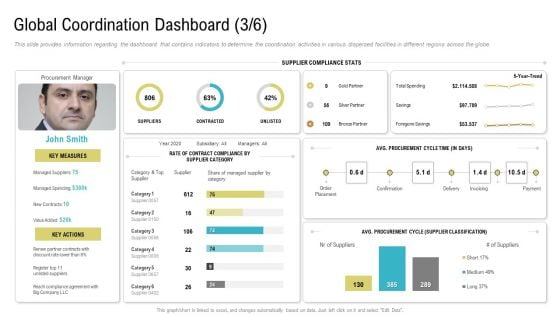
Global Coordination Dashboard Category Ppt Professional Outline PDF
This slide provides information regarding the dashboard that contains indicators to determine the coordination activities in various dispersed facilities in different regions across the globe.Deliver an awe-inspiring pitch with this creative global coordination dashboard category ppt professional outline pdf. bundle. Topics like supplier compliance stats, rate of contract compliance by supplier category can be discussed with this completely editable template. It is available for immediate download depending on the needs and requirements of the user.

Data Center Infrastructure Management KPI Dashboard Designs PDF
This slide covers data center infrastructure management KPI dashboard. It involves details such as cabinets with free data and power ports, data ports usage per user and items per connected power supplies. Showcasing this set of slides titled Data Center Infrastructure Management KPI Dashboard Designs PDF. The topics addressed in these templates are Data Center Infrastructure, Management KPI Dashboard. All the content presented in this PPT design is completely editable. Download it and make adjustments in color, background, font etc. as per your unique business setting.
Data Mining Dashboard Of Gender And Age Demographics Icons PDF
The following slide highlights the data profiling dashboard of gender and age demographics illustrating gender and age per month, gender and general age, average age per month and individual per age group to find the gender and age composition of area Showcasing this set of slides titled data mining dashboard of gender and age demographics icons pdf . The topics addressed in these templates are data mining dashboard of gender and age demographics . All the content presented in this PPT design is completely editable. Download it and make adjustments in color, background, font etc. as per your unique business setting.
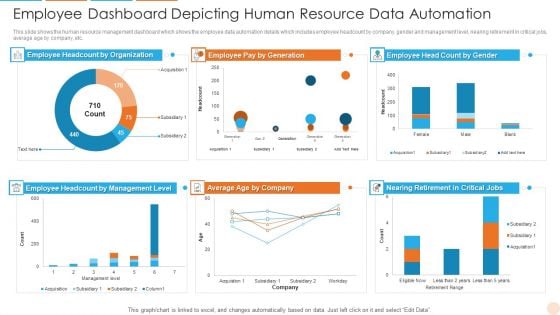
Employee Dashboard Depicting Human Resource Data Automation Professional PDF
This slide shows the human resource management dashboard which shows the employee data automation details which includes employee headcount by company, gender and management level, nearing retirement in critical jobs, average age by company, etc. Showcasing this set of slides titled Employee Dashboard Depicting Human Resource Data Automation Professional PDF. The topics addressed in these templates are Employee Dashboard Depicting Human Resource Data Automation. All the content presented in this PPT design is completely editable. Download it and make adjustments in color, background, font etc. as per your unique business setting.
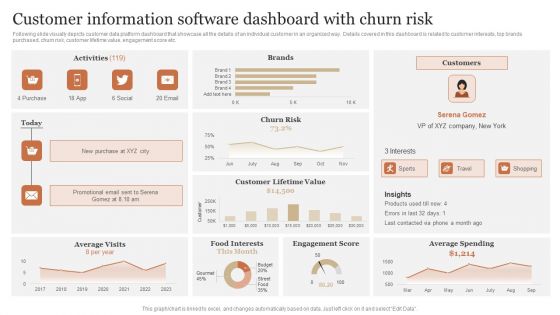
Customer Information Software Dashboard With Churn Risk Information PDF
Following slide visually depicts customer data platform dashboard that showcase all the details of an individual customer in an organized way. Details covered in this dashboard is related to customer interests, top brands purchased, churn risk, customer lifetime value, engagement score etc. Pitch your topic with ease and precision using this Customer Information Software Dashboard With Churn Risk Information PDF. This layout presents information on Customer Lifetime, Engagement Score, Average Spending. It is also available for immediate download and adjustment. So, changes can be made in the color, design, graphics or any other component to create a unique layout.
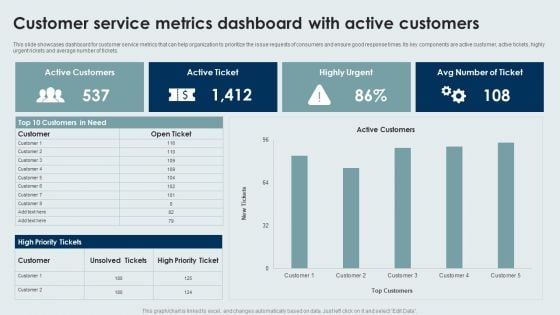
Customer Service Metrics Dashboard With Active Customers Ideas PDF
This slide showcases dashboard for customer service metrics that can help organization to prioritize the issue requests of consumers and ensure good response times. Its key components are active customer, active tickets, highly urgent rickets and average number of tickets. Showcasing this set of slides titled Customer Service Metrics Dashboard With Active Customers Ideas PDF. The topics addressed in these templates are Customer Service, Metrics Dashboard, Active Customers. All the content presented in this PPT design is completely editable. Download it and make adjustments in color, background, font etc. as per your unique business setting.
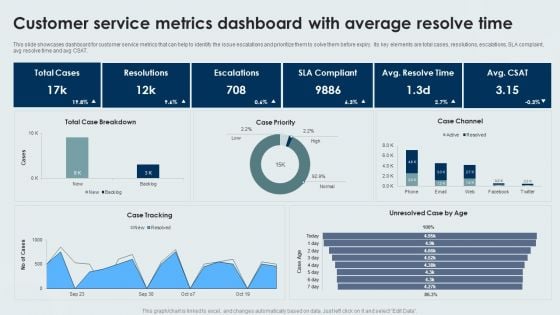
Customer Service Metrics Dashboard With Average Resolve Time Sample PDF
This slide showcases dashboard for customer service metrics that can help to identify the issue escalations and prioritize them to solve them before expiry. Its key elements are total cases, resolutions, escalations, SLA complaint, avg resolve time and avg CSAT. Showcasing this set of slides titled Customer Service Metrics Dashboard With Average Resolve Time Sample PDF. The topics addressed in these templates are Customer Service, Metrics Dashboard, Average Resolve Time. All the content presented in this PPT design is completely editable. Download it and make adjustments in color, background, font etc. as per your unique business setting.
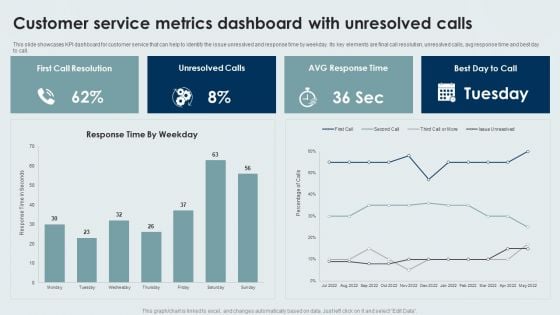
Customer Service Metrics Dashboard With Unresolved Calls Designs PDF
This slide showcases KPI dashboard for customer service that can help to identify the issue unresolved and response time by weekday. Its key elements are final call resolution, unresolved calls, avg response time and best day to call. Showcasing this set of slides titled Customer Service Metrics Dashboard With Unresolved Calls Designs PDF. The topics addressed in these templates are Customer Service, Metrics Dashboard, Unresolved Calls. All the content presented in this PPT design is completely editable. Download it and make adjustments in color, background, font etc. as per your unique business setting.
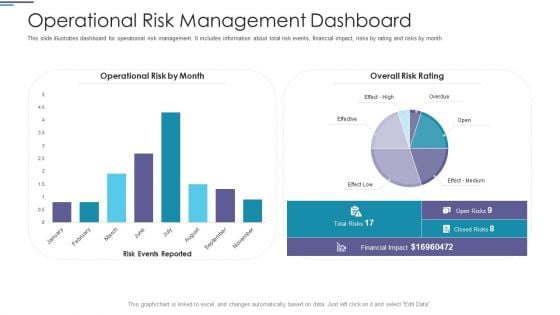
Operational Risk Management Dashboard Ppt PowerPoint Presentation Styles Pictures PDF
This slide illustrates dashboard for operational risk management. It includes information about total risk events, financial impact, risks by rating and risks by month.Deliver an awe-inspiring pitch with this creative operational risk management dashboard ppt powerpoint presentation styles pictures pdf. bundle. Topics like financial impact, operational risk by month, overall risk rating can be discussed with this completely editable template. It is available for immediate download depending on the needs and requirements of the user.
Data Breach Prevention Status Tracking Dashboard Data Fortification Strengthening Defenses
This slide represents the critical cyber security performance indicators for the organization. The key components include application health, encryption status, license consumption, windows defender, etc.Are you in need of a template that can accommodate all of your creative concepts This one is crafted professionally and can be altered to fit any style. Use it with Google Slides or PowerPoint. Include striking photographs, symbols, depictions, and other visuals. Fill, move around, or remove text boxes as desired. Test out color palettes and font mixtures. Edit and save your work, or work with colleagues. Download Data Breach Prevention Status Tracking Dashboard Data Fortification Strengthening Defenses and observe how to make your presentation outstanding. Give an impeccable presentation to your group and make your presentation unforgettable. This slide represents the critical cyber security performance indicators for the organization. The key components include application health, encryption status, license consumption, windows defender, etc.
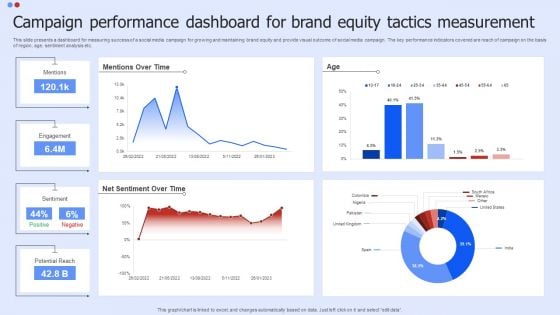
Campaign Performance Dashboard For Brand Equity Tactics Measurement Slides PDF
This slide presents a dashboard for measuring success of a social media campaign for growing and maintaining brand equity and provide visual outcome of social media campaign. The key performance indicators covered are reach of campaign on the basis of region, age, sentiment analysis etc. Showcasing this set of slides titled Campaign Performance Dashboard For Brand Equity Tactics Measurement Slides PDF. The topics addressed in these templates are Campaign Performance Dashboard For Brand Equity Tactics Measurement Slides PDF. All the content presented in this PPT design is completely editable. Download it and make adjustments in color, background, font etc. as per your unique business setting.


 Continue with Email

 Home
Home


