Dashboards Summary
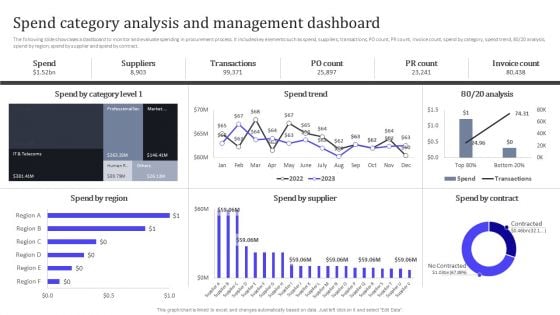
Spend Category Analysis And Management Dashboard Ppt PowerPoint Presentation Diagram PDF
The following slide showcases a dashboard to monitor and evaluate spending in procurement process. It includes key elements such as spend, suppliers, transactions, PO count, PR count, invoice count, spend by category, spend trend, 80 or 20 analysis, spend by region, spend by supplier and spend by contract. Do you have to make sure that everyone on your team knows about any specific topic I yes, then you should give Spend Category Analysis And Management Dashboard Ppt PowerPoint Presentation Diagram PDF a try. Our experts have put a lot of knowledge and effort into creating this impeccable Spend Category Analysis And Management Dashboard Ppt PowerPoint Presentation Diagram PDF. You can use this template for your upcoming presentations, as the slides are perfect to represent even the tiniest detail. You can download these templates from the Slidegeeks website and these are easy to edit. So grab these today.
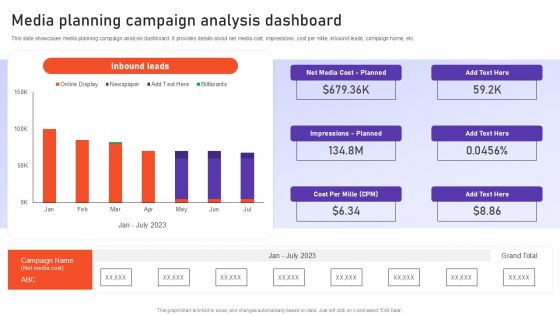
Media Planning Campaign Analysis Dashboard Ppt PowerPoint Presentation File Background Images PDF
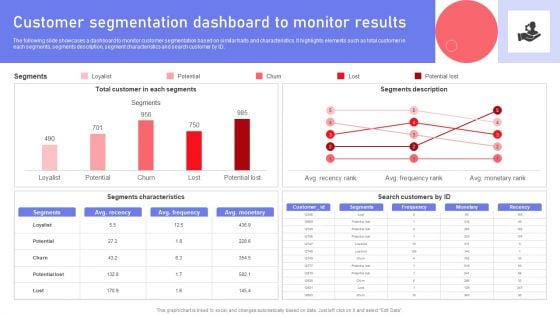
Customer Segmentation Dashboard To Monitor Results Ppt PowerPoint Presentation File Deck PDF
The following slide showcases a dashboard to monitor customer segmentation based on similar traits and characteristics. It highlights elements such as total customer in each segments, segments description, segment characteristics and search customer by ID. Formulating a presentation can take up a lot of effort and time, so the content and message should always be the primary focus. The visuals of the PowerPoint can enhance the presenters message, so our Customer Segmentation Dashboard To Monitor Results Ppt PowerPoint Presentation File Deck PDF was created to help save time. Instead of worrying about the design, the presenter can concentrate on the message while our designers work on creating the ideal templates for whatever situation is needed. Slidegeeks has experts for everything from amazing designs to valuable content, we have put everything into Customer Segmentation Dashboard To Monitor Results Ppt PowerPoint Presentation File Deck PDF.
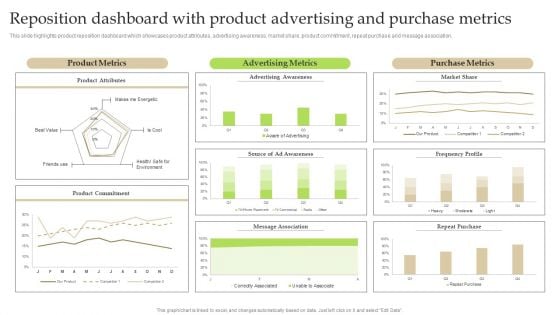
Reposition Dashboard With Product Advertising And Purchase Metrics Ppt PowerPoint Presentation File Show PDF
This slide highlights product reposition dashboard which showcases product attributes, advertising awareness, market share, product commitment, repeat purchase and message association. Formulating a presentation can take up a lot of effort and time, so the content and message should always be the primary focus. The visuals of the PowerPoint can enhance the presenters message, so our Reposition Dashboard With Product Advertising And Purchase Metrics Ppt PowerPoint Presentation File Show PDF was created to help save time. Instead of worrying about the design, the presenter can concentrate on the message while our designers work on creating the ideal templates for whatever situation is needed. Slidegeeks has experts for everything from amazing designs to valuable content, we have put everything into Reposition Dashboard With Product Advertising And Purchase Metrics Ppt PowerPoint Presentation File Show PDF
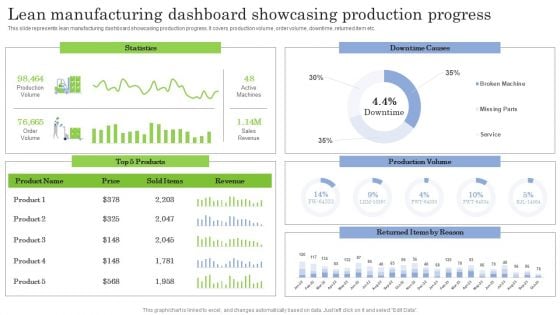
Lean Manufacturing Dashboard Showcasing Production Progress Ppt PowerPoint Presentation File Model PDF
This slide represents lean manufacturing dashboard showcasing production progress. It covers production volume, order volume, downtime, returned item etc. Formulating a presentation can take up a lot of effort and time, so the content and message should always be the primary focus. The visuals of the PowerPoint can enhance the presenters message, so our Lean Manufacturing Dashboard Showcasing Production Progress Ppt PowerPoint Presentation File Model PDF was created to help save time. Instead of worrying about the design, the presenter can concentrate on the message while our designers work on creating the ideal templates for whatever situation is needed. Slidegeeks has experts for everything from amazing designs to valuable content, we have put everything into Lean Manufacturing Dashboard Showcasing Production Progress Ppt PowerPoint Presentation File Model PDF
Influencers Marketing Campaign Performance Tracking Dashboard Ppt PowerPoint Presentation Diagram Lists PDF
This slide covers performance monitoring dashboard of influencer based referral marketing program. It includes elements such as impressions on Instagram, likes, comments, clicks, sales generated along with value calculators and campaign breakdown based on gender and age. Formulating a presentation can take up a lot of effort and time, so the content and message should always be the primary focus. The visuals of the PowerPoint can enhance the presenters message, so our Influencers Marketing Campaign Performance Tracking Dashboard Ppt PowerPoint Presentation Diagram Lists PDF was created to help save time. Instead of worrying about the design, the presenter can concentrate on the message while our designers work on creating the ideal templates for whatever situation is needed. Slidegeeks has experts for everything from amazing designs to valuable content, we have put everything into Influencers Marketing Campaign Performance Tracking Dashboard Ppt PowerPoint Presentation Diagram Lists PDF
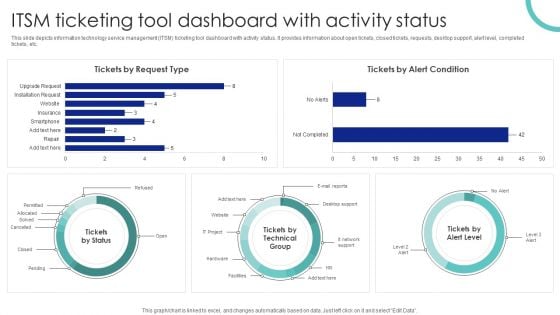
ITSM Ticketing Tool Dashboard With Activity Status Ppt PowerPoint Presentation File Diagrams PDF
This slide depicts information technology service management ITSM ticketing tool dashboard with activity status. It provides information about open tickets, closed tickets, requests, desktop support, alert level, completed tickets, etc. Crafting an eye catching presentation has never been more straightforward. Let your presentation shine with this tasteful yet straightforward ITSM Ticketing Tool Dashboard With Activity Status Ppt PowerPoint Presentation File Diagrams PDF template. It offers a minimalistic and classy look that is great for making a statement. The colors have been employed intelligently to add a bit of playfulness while still remaining professional. Construct the ideal ITSM Ticketing Tool Dashboard With Activity Status Ppt PowerPoint Presentation File Diagrams PDF that effortlessly grabs the attention of your audience Begin now and be certain to wow your customers.
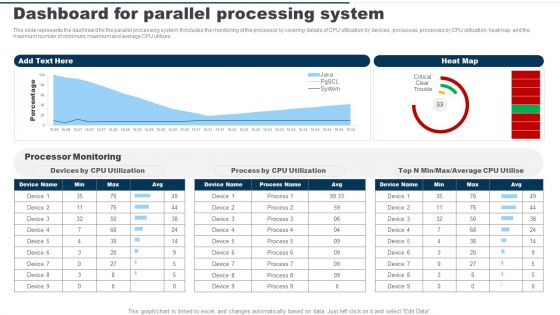
Dashboard For Parallel Processing System Ppt PowerPoint Presentation File Portfolio PDF
This slide represents the dashboard for the parallel processing system. It includes the monitoring of the processor by covering details of CPU utilization by devices, processes, processes by CPU utilization, heatmap, and the maximum number of minimum, maximum and average CPU utilizes. Crafting an eye catching presentation has never been more straightforward. Let your presentation shine with this tasteful yet straightforward Dashboard For Parallel Processing System Ppt PowerPoint Presentation File Portfolio PDF template. It offers a minimalistic and classy look that is great for making a statement. The colors have been employed intelligently to add a bit of playfulness while still remaining professional. Construct the ideal Dashboard For Parallel Processing System Ppt PowerPoint Presentation File Portfolio PDF that effortlessly grabs the attention of your audience Begin now and be certain to wow your customers.
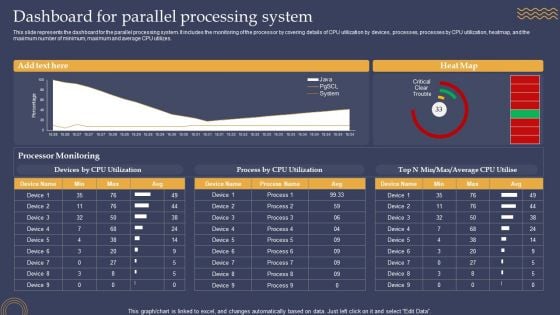
Dashboard For Parallel Processing System Ppt PowerPoint Presentation File Pictures PDF
This slide represents the dashboard for the parallel processing system. It includes the monitoring of the processor by covering details of CPU utilization by devices, processes, processes by CPU utilization, heatmap, and the maximum number of minimum, maximum and average CPU utilizes. Crafting an eye catching presentation has never been more straightforward. Let your presentation shine with this tasteful yet straightforward Dashboard For Parallel Processing System Ppt PowerPoint Presentation File Pictures PDF template. It offers a minimalistic and classy look that is great for making a statement. The colors have been employed intelligently to add a bit of playfulness while still remaining professional. Construct the ideal Dashboard For Parallel Processing System Ppt PowerPoint Presentation File Pictures PDF that effortlessly grabs the attention of your audience Begin now and be certain to wow your customers.
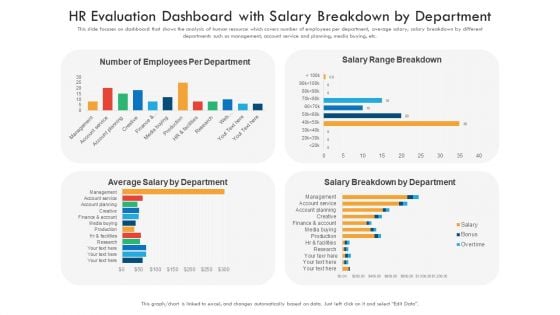
HR Evaluation Dashboard With Salary Breakdown By Department Ppt PowerPoint Presentation Templates PDF
This slide focuses on dashboard that shows the analysis of human resource which covers number of employees per department, average salary, salary breakdown by different departments such as management, account service and planning, media buying, etc. Showcasing this set of slides titled HR evaluation dashboard with salary breakdown by department ppt powerpoint presentation templates pdf. The topics addressed in these templates are finance account, web development, account planning. All the content presented in this PPT design is completely editable. Download it and make adjustments in color, background, font etc. as per your unique business setting.
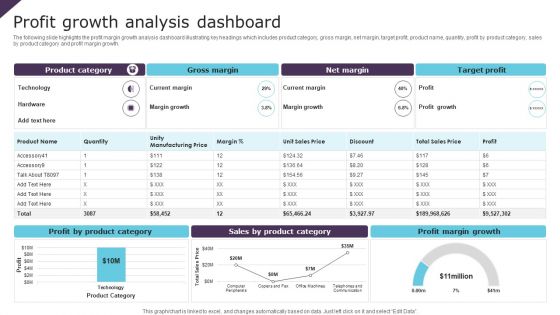
Profit Growth Analysis Dashboard Ppt PowerPoint Presentation File Design Templates PDF
The following slide highlights the profit margin growth analysis dashboard illustrating key headings which includes product category, gross margin, net margin, target profit, product name, quantity, profit by product category, sales by product category and profit margin growth. Showcasing this set of slides titled Profit Growth Analysis Dashboard Ppt PowerPoint Presentation File Design Templates PDF. The topics addressed in these templates are Gross Margin, Net Margin, Target Profit. All the content presented in this PPT design is completely editable. Download it and make adjustments in color, background, font etc. as per your unique business setting.
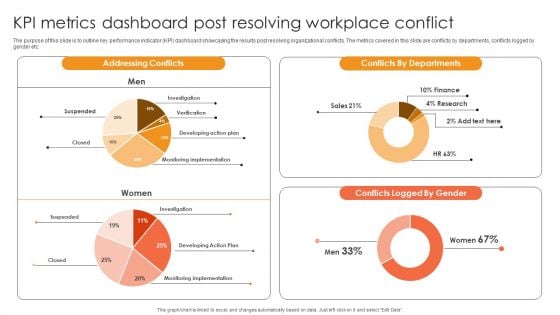
Kpi Metrics Dashboard Post Resolving Workplace Conflict Ppt Inspiration Graphics Download PDF
The purpose of this slide is to outline key performance indicator KPI dashboard showcasing the results post resolving organizational conflicts. The metrics covered in this slide are conflicts by departments, conflicts logged by gender etc. This Kpi Metrics Dashboard Post Resolving Workplace Conflict Ppt Inspiration Graphics Download PDF is perfect for any presentation, be it in front of clients or colleagues. It is a versatile and stylish solution for organizing your meetings. The Kpi Metrics Dashboard Post Resolving Workplace Conflict Ppt Inspiration Graphics Download PDF features a modern design for your presentation meetings. The adjustable and customizable slides provide unlimited possibilities for acing up your presentation. Slidegeeks has done all the homework before launching the product for you. So, do not wait, grab the presentation templates today
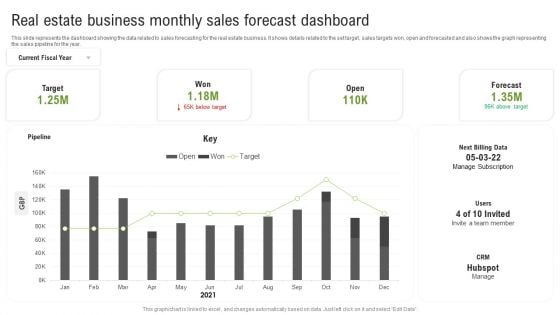
Real Estate Business Monthly Sales Forecast Dashboard Ppt Layouts Grid PDF
This slide represents the dashboard showing the data related to sales forecasting for the real estate business. It shows details related to the set target, sales targets won, open and forecasted and also shows the graph representing the sales pipeline for the year. Showcasing this set of slides titled Real Estate Business Monthly Sales Forecast Dashboard Ppt Layouts Grid PDF. The topics addressed in these templates are Next Billing Data, Pipeline, Current Fiscal Year. All the content presented in this PPT design is completely editable. Download it and make adjustments in color, background, font etc. as per your unique business setting.
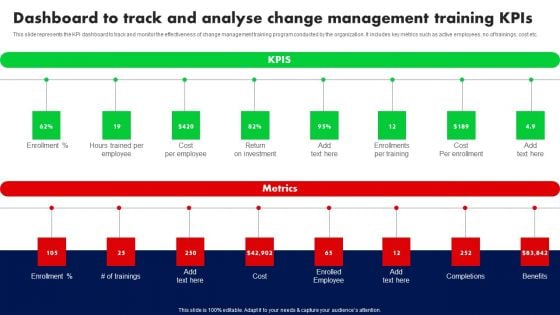
Dashboard To Track And Analyse Change Management Training Kpis Ppt PowerPoint Presentation File Gallery PDF
This slide represents the KPI dashboard to track and monitor the effectiveness of change management training program conducted by the organization. It includes key metrics such as active employees, no.of trainings, cost etc. From laying roadmaps to briefing everything in detail, our templates are perfect for you. You can set the stage with your presentation slides. All you have to do is download these easy to edit and customizable templates. Dashboard To Track And Analyse Change Management Training Kpis Ppt PowerPoint Presentation File Gallery PDF will help you deliver an outstanding performance that everyone would remember and praise you for. Do download this presentation today.
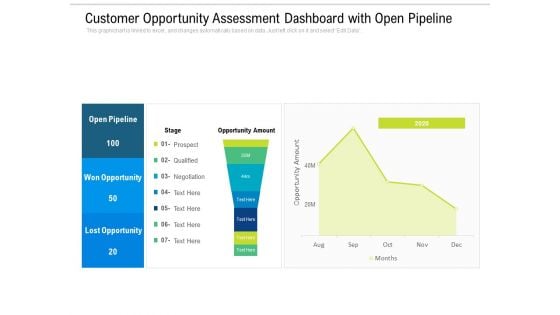
Customer Opportunity Assessment Dashboard With Open Pipeline Ppt PowerPoint Presentation Pictures Layout Ideas PDF
Showcasing this set of slides titled customer opportunity assessment dashboard with open pipeline ppt powerpoint presentation pictures layout ideas pdf. The topics addressed in these templates are open pipeline, won opportunity, lost opportunity, opportunity amount, prospect. All the content presented in this PPT design is completely editable. Download it and make adjustments in color, background, font etc. as per your unique business setting.
Energy Tracking Device KPI Dashboard Sales Ppt PowerPoint Presentation Layouts Rules PDF
Deliver an awe-inspiring pitch with this creative energy tracking device kpi dashboard sales ppt powerpoint presentation layouts rules pdf bundle. Topics like average production costs, consumption sector, total consumption, total sales, contribution renewable energy, energy sources, sales sector can be discussed with this completely editable template. It is available for immediate download depending on the needs and requirements of the user.
Strategic Marketing Plan Marketing Management Dashboard Revenue Ppt PowerPoint Presentation Icon Layout PDF
Deliver an awe-inspiring pitch with this creative strategic marketing plan marketing management dashboard revenue ppt powerpoint presentation icon layout pdf bundle. Topics like active customers, solid units, total revenue, net profit, customers region, new customer signups can be discussed with this completely editable template. It is available for immediate download depending on the needs and requirements of the user.
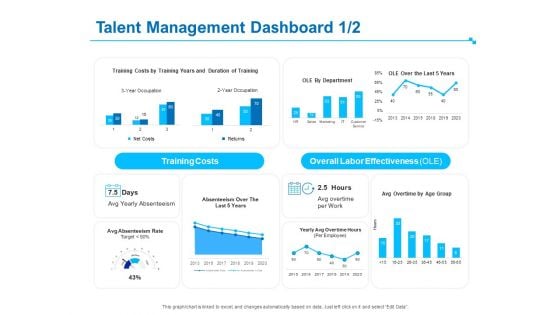
Strategic Talent Management Talent Management Dashboard Ppt PowerPoint Presentation Pictures Layout Ideas PDF
Deliver an awe-inspiring pitch with this creative strategic talent management talent management dashboard ppt powerpoint presentation pictures layout ideas pdf bundle. Topics like training costs, overall labor effectiveness, avg overtime by age group, avg absenteeism rate can be discussed with this completely editable template. It is available for immediate download depending on the needs and requirements of the user.
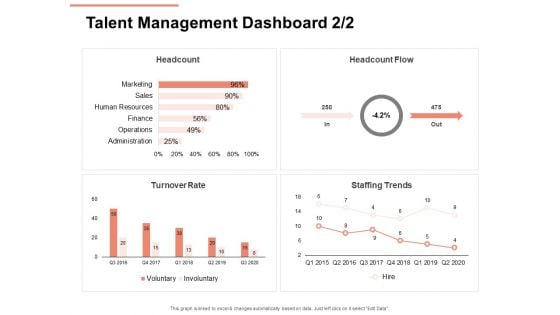
Workforce Planning System Talent Management Dashboard Ppt PowerPoint Presentation Layouts Example File PDF
Deliver an awe-inspiring pitch with this creative workforce planning system talent management dashboard ppt powerpoint presentation layouts example file pdf bundle. Topics like staffing trends, turnover rate, headcount flow, headcount can be discussed with this completely editable template. It is available for immediate download depending on the needs and requirements of the user.
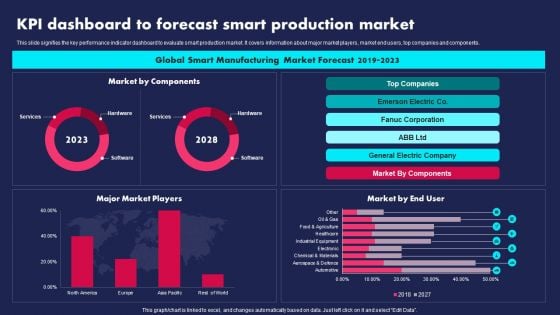
KPI Dashboard To Forecast Smart Production Market Ppt PowerPoint Presentation Gallery Visual Aids PDF
This slide signifies the key performance indicator dashboard to evaluate smart production market. It covers information about major market players, market end users, top companies and components. Pitch your topic with ease and precision using this KPI Dashboard To Forecast Smart Production Market Ppt PowerPoint Presentation Gallery Visual Aids PDF. This layout presents information on Global Smart Manufacturing, Market Forecast, 2019 To 2023. It is also available for immediate download and adjustment. So, changes can be made in the color, design, graphics or any other component to create a unique layout.

Info Security Compliance Dashboard Of Information Security Ppt PowerPoint Presentation File Graphics Download PDF
This slide depicts the cyber security compliance report on how data and hardware are monitored in different categories such as standard, regulation, and asset type control. Deliver an awe inspiring pitch with this creative info security compliance dashboard of information security ppt powerpoint presentation file graphics download pdf bundle. Topics like compliance dashboard, asset type control, control issues by standard, control issues by regulation can be discussed with this completely editable template. It is available for immediate download depending on the needs and requirements of the user.
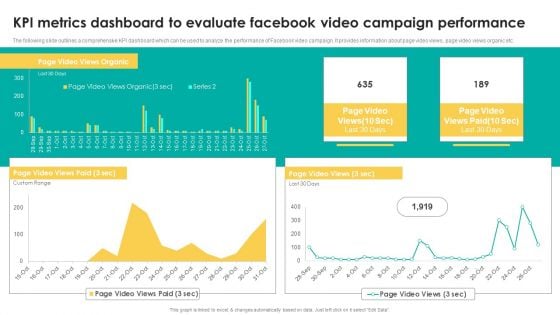
KPI Metrics Dashboard To Evaluate Facebook Video Campaign Performance Introduction PDF
The following slide outlines a comprehensive KPI dashboard which can be used to analyze the performance of Facebook video campaign. It provides information about page video views, page video views organic etc. Formulating a presentation can take up a lot of effort and time, so the content and message should always be the primary focus. The visuals of the PowerPoint can enhance the presenters message, so our KPI Metrics Dashboard To Evaluate Facebook Video Campaign Performance Introduction PDF was created to help save time. Instead of worrying about the design, the presenter can concentrate on the message while our designers work on creating the ideal templates for whatever situation is needed. Slidegeeks has experts for everything from amazing designs to valuable content, we have put everything into KPI Metrics Dashboard To Evaluate Facebook Video Campaign Performance Introduction PDF.
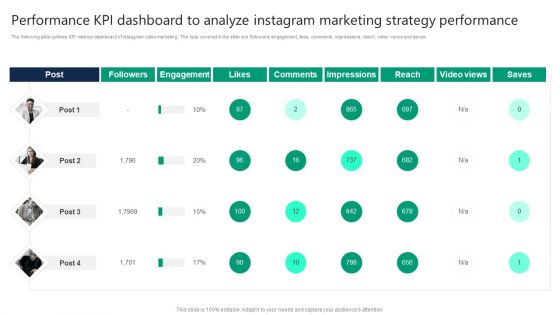
Performance Kpi Dashboard To Analyze Instagram Marketing Strategy Performance Introduction PDF
The following slide outlines KPI metrics dashboard of instagram video marketing. The kpis covered in the slide are followers, engagement, likes, comments, impressions, reach, video views and saves. The best PPT templates are a great way to save time, energy, and resources. Slidegeeks have 100 percent editable powerpoint slides making them incredibly versatile. With these quality presentation templates, you can create a captivating and memorable presentation by combining visually appealing slides and effectively communicating your message. Download Performance Kpi Dashboard To Analyze Instagram Marketing Strategy Performance Introduction PDF from Slidegeeks and deliver a wonderful presentation.
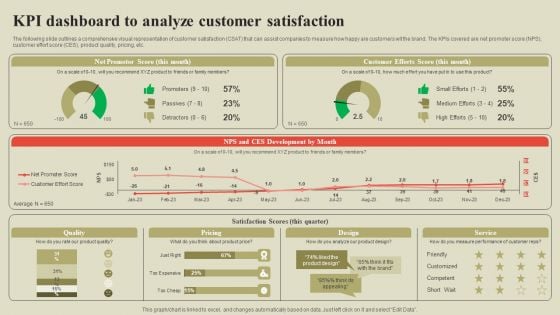
Steps To Effectively Conduct Market Research KPI Dashboard To Analyze Customer Satisfaction Introduction PDF
The following slide outlines a comprehensive visual representation of customer satisfaction CSAT that can assist companies to measure how happy are customers wit the brand. The KPIs covered are net promoter score NPS, customer effort score CES, product quality, pricing, etc. Presenting this PowerPoint presentation, titled Steps To Effectively Conduct Market Research KPI Dashboard To Analyze Customer Satisfaction Introduction PDF, with topics curated by our researchers after extensive research. This editable presentation is available for immediate download and provides attractive features when used. Download now and captivate your audience. Presenting this Steps To Effectively Conduct Market Research KPI Dashboard To Analyze Customer Satisfaction Introduction PDF. Our researchers have carefully researched and created these slides with all aspects taken into consideration. This is a completely customizable Steps To Effectively Conduct Market Research KPI Dashboard To Analyze Customer Satisfaction Introduction PDF that is available for immediate downloading. Download now and make an impact on your audience. Highlight the attractive features available with our PPTs.
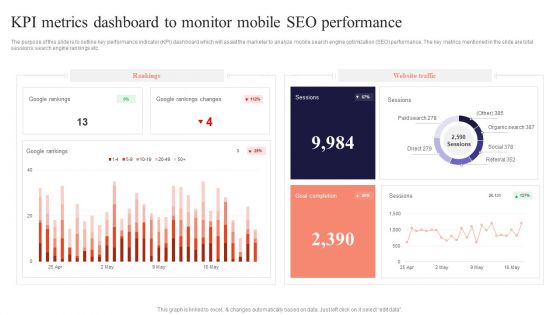
KPI Metrics Dashboard To Monitor Mobile Performing Mobile SEO Audit To Analyze Web Traffic Graphics PDF
The purpose of this slide is to outline key performance indicator KPI dashboard which will assist the marketer to analyze mobile search engine optimization SEO performance. The key metrics mentioned in the slide are total sessions, search engine rankings etc.Find highly impressive KPI Metrics Dashboard To Monitor Mobile Performing Mobile SEO Audit To Analyze Web Traffic Graphics PDF on Slidegeeks to deliver a meaningful presentation. You can save an ample amount of time using these presentation templates. No need to worry to prepare everything from scratch because Slidegeeks experts have already done a huge research and work for you. You need to download KPI Metrics Dashboard To Monitor Mobile Performing Mobile SEO Audit To Analyze Web Traffic Graphics PDF for your upcoming presentation. All the presentation templates are 100 precent editable and you can change the color and personalize the content accordingly. Download now.
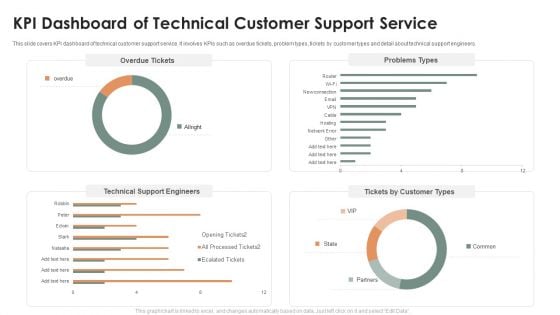
KPI Dashboard Of Technical Customer Support Service Ppt Layouts Professional PDF
This slide covers KPI dashboard of technical customer support service. It involves KPIs such as overdue tickets, problem types, tickets by customer types and detail about technical support engineers. Showcasing this set of slides titled KPI Dashboard Of Technical Customer Support Service Ppt Layouts Professional PDF. The topics addressed in these templates are Overdue Tickets, Problems Types, Technical Support Engineers. All the content presented in this PPT design is completely editable. Download it and make adjustments in color, background, font etc. as per your unique business setting.
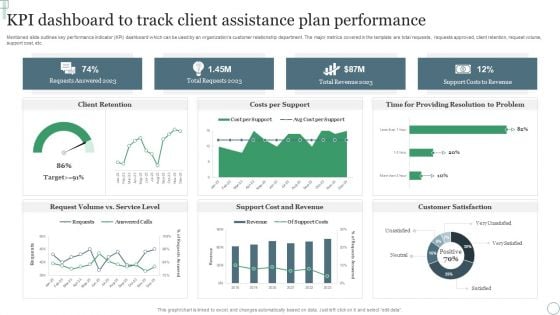
KPI Dashboard To Track Client Assistance Plan Performance Ppt Professional Outfit PDF
Mentioned slide outlines key performance indicator KPI dashboard which can be used by an organizations customer relationship department. The major metrics covered in the template are total requests, requests approved, client retention, request volume, support cost, etc. Pitch your topic with ease and precision using this KPI Dashboard To Track Client Assistance Plan Performance Ppt Professional Outfit PDF. This layout presents information on Requests Answered 2023, Total Requests 2023, Total Revenue 2023. It is also available for immediate download and adjustment. So, changes can be made in the color, design, graphics or any other component to create a unique layout.
Conformance Testing Performance Tracking Dashboard Compliance Assessment Ppt Layouts Graphics PDF
This slide depicts the conformance testing performance tracking dashboard by covering details of test case analysis, tests linked to requirements, test case breakdown, tests per requirement, and so on. If your project calls for a presentation, then Slidegeeks is your go-to partner because we have professionally designed, easy-to-edit templates that are perfect for any presentation. After downloading, you can easily edit Conformance Testing Performance Tracking Dashboard Compliance Assessment Ppt Layouts Graphics PDF and make the changes accordingly. You can rearrange slides or fill them with different images. Check out all the handy templates
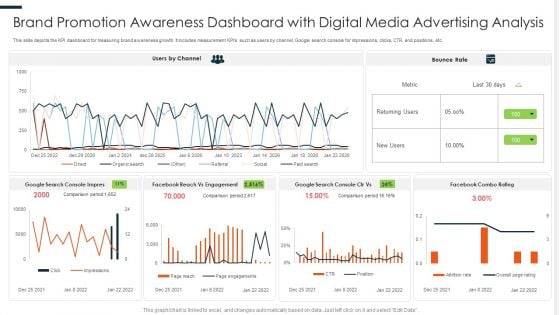
Brand Promotion Awareness Dashboard With Digital Media Advertising Analysis Ppt PowerPoint Presentation Design Ideas PDF
This slide depicts the KPI dashboard for measuring brand awareness growth. It includes measurement KPIs such as users by channel, Google search console for impressions, clicks, CTR, and positions, etc. Pitch your topic with ease and precision using this Brand Promotion Awareness Dashboard With Digital Media Advertising Analysis Ppt PowerPoint Presentation Design Ideas PDF. This layout presents information on Console Impress, Reach Engagement, Combo Rating. It is also available for immediate download and adjustment. So, changes can be made in the color, design, graphics or any other component to create a unique layout.
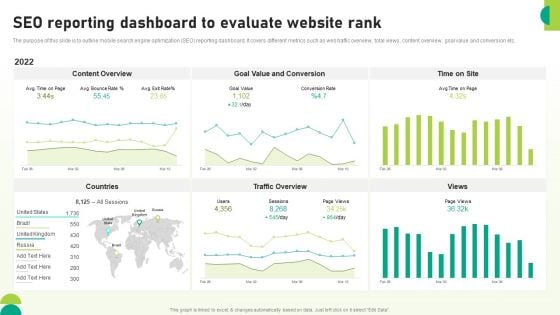
Utilizing SEO To Boost Customer SEO Reporting Dashboard To Evaluate Website Rank Background PDF
The purpose of this slide is to outline mobile search engine optimization SEO reporting dashboard. It covers different metrics such as web traffic overview, total views, content overview, goal value and conversion etc. Take your projects to the next level with our ultimate collection of Utilizing SEO To Boost Customer SEO Reporting Dashboard To Evaluate Website Rank Background PDF. Slidegeeks has designed a range of layouts that are perfect for representing task or activity duration, keeping track of all your deadlines at a glance. Tailor these designs to your exact needs and give them a truly corporate look with your own brand colors theyll make your projects stand out from the rest.
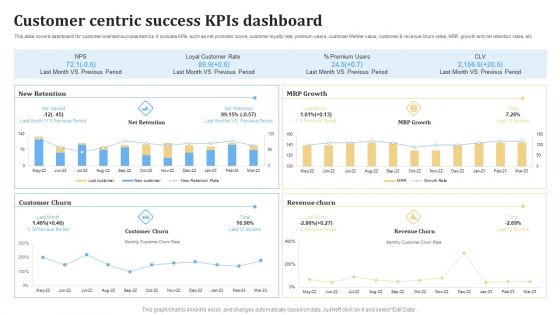
Customer Centric Success KPIS Dashboard Ppt PowerPoint Presentation Styles Example File PDF
This slide covers dashboard for customer oriented success metrics. It includes KPIs such as net promoter score, customer loyalty rate, premium users, customer lifetime value, customer and revenue churn rates, MRR growth and net retention rates, etc. Showcasing this set of slides titled Customer Centric Success KPIS Dashboard Ppt PowerPoint Presentation Styles Example File PDF. The topics addressed in these templates are New Retention, Customer Churn, Revenue Churn. All the content presented in this PPT design is completely editable. Download it and make adjustments in color, background, font etc. as per your unique business setting.
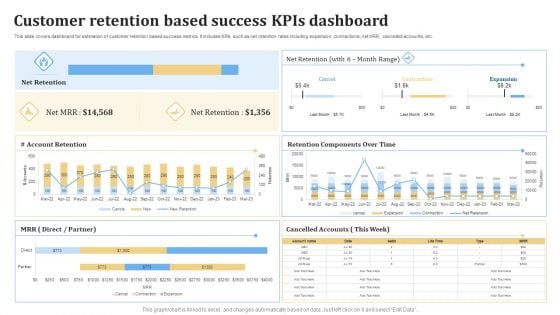
Customer Retention Based Success KPIS Dashboard Ppt PowerPoint Presentation Slides Graphics Pictures PDF
This slide covers dashboard for estimation of customer retention based success metrics. It includes KPIs such as net retention rates including expansion, contractions, net MRR, cancelled accounts, etc. Showcasing this set of slides titled Customer Retention Based Success KPIS Dashboard Ppt PowerPoint Presentation Slides Graphics Pictures PDF. The topics addressed in these templates are Account Retention, Cancelled Accounts, Retention Components. All the content presented in this PPT design is completely editable. Download it and make adjustments in color, background, font etc. as per your unique business setting.
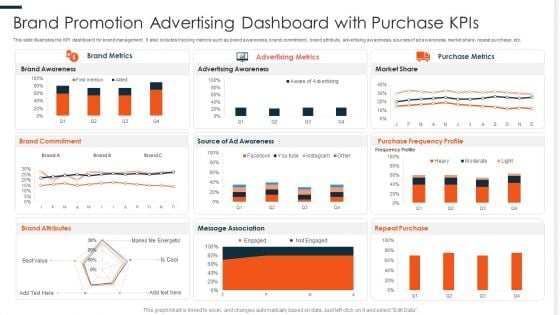
Brand Promotion Advertising Dashboard With Purchase Kpis Ppt PowerPoint Presentation File Format PDF
This slide illustrates the KPI dashboard for brand management. It also includes tracking metrics such as brand awareness, brand commitment, brand attribute, advertising awareness, sources of ad awareness, market share, repeat purchase, etc. Showcasing this set of slides titled Brand Promotion Advertising Dashboard With Purchase Kpis Ppt PowerPoint Presentation File Format PDF. The topics addressed in these templates are Brand Awareness, Advertising Awareness, Purchase Frequency. All the content presented in this PPT design is completely editable. Download it and make adjustments in color, background, font etc. as per your unique business setting.
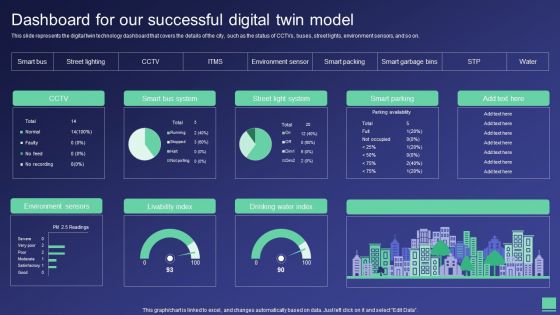
Digital Twin Tech IT Dashboard For Our Successful Digital Twin Model Ppt Layouts Grid PDF
This slide represents the digital twin technology dashboard that covers the details of the city, such as the status of CCTVs, buses, street lights, environment sensors, and so on. Boost your pitch with our creative Digital Twin Tech IT Dashboard For Our Successful Digital Twin Model Ppt Layouts Grid PDF. Deliver an awe-inspiring pitch that will mesmerize everyone. Using these presentation templates you will surely catch everyones attention. You can browse the ppts collection on our website. We have researchers who are experts at creating the right content for the templates. So you dont have to invest time in any additional work. Just grab the template now and use them.
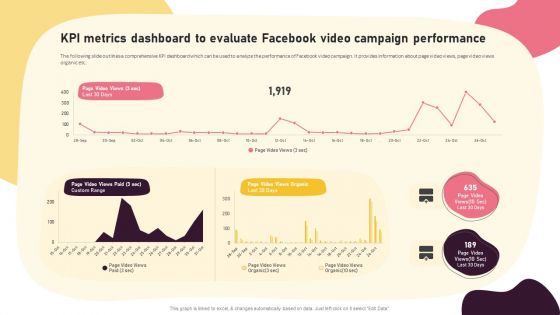
Video Promotion Techniques KPI Metrics Dashboard To Evaluate Facebook Video Introduction PDF
The following slide outlines a comprehensive KPI dashboard which can be used to analyze the performance of Facebook video campaign. It provides information about page video views, page video views organic etc. The best PPT templates are a great way to save time, energy, and resources. Slidegeeks have 100 percent editable powerpoint slides making them incredibly versatile. With these quality presentation templates, you can create a captivating and memorable presentation by combining visually appealing slides and effectively communicating your message. Download Video Promotion Techniques KPI Metrics Dashboard To Evaluate Facebook Video Introduction PDF from Slidegeeks and deliver a wonderful presentation.
Enterprise SMS Marketing Subscribers Tracking Dashboard Ppt PowerPoint Presentation File Slides PDF
This slide represents the key metrics dashboard to monito and track the SMS marketing subscribers of the enterprise. It includes details related to KPIs such as total subscribers, new subscribers, total unsubscribes etc. Do you have an important presentation coming up Are you looking for something that will make your presentation stand out from the rest Look no further than Enterprise SMS Marketing Subscribers Tracking Dashboard Ppt PowerPoint Presentation File Slides PDF. With our professional designs, you can trust that your presentation will pop and make delivering it a smooth process. And with Slidegeeks, you can trust that your presentation will be unique and memorable. So why wait Grab Enterprise SMS Marketing Subscribers Tracking Dashboard Ppt PowerPoint Presentation File Slides PDF today and make your presentation stand out from the rest.
Enterprise SMS Marketing Subscribers Tracking Dashboard Ppt PowerPoint Presentation Diagram PDF
This slide represents the key metrics dashboard to monito and track the SMS marketing subscribers of the enterprise. It includes details related to KPIs such as total subscribers, new subscribers, total unsubscribes etc. Do you have an important presentation coming up Are you looking for something that will make your presentation stand out from the rest Look no further than Enterprise SMS Marketing Subscribers Tracking Dashboard Ppt PowerPoint Presentation Diagram PDF. With our professional designs, you can trust that your presentation will pop and make delivering it a smooth process. And with Slidegeeks, you can trust that your presentation will be unique and memorable. So why wait Grab Enterprise SMS Marketing Subscribers Tracking Dashboard Ppt PowerPoint Presentation Diagram PDF today and make your presentation stand out from the rest.
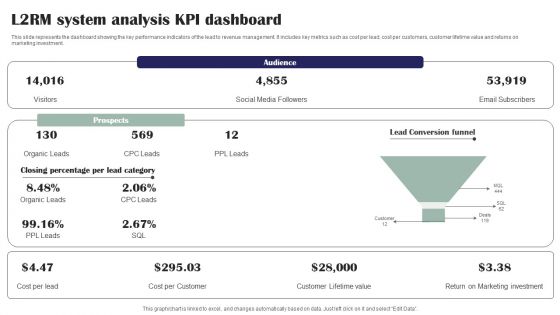
L2RM System Analysis KPI Dashboard Ppt PowerPoint Presentation File Microsoft PDF
This slide represents the dashboard showing the key performance indicators of the lead to revenue management. It includes key metrics such as cost per lead, cost per customers, customer lifetime value and returns on marketing investment. Presenting L2RM System Analysis KPI Dashboard Ppt PowerPoint Presentation File Microsoft PDF to dispense important information. This template comprises one stages. It also presents valuable insights into the topics including Audience, Prospects, Lead Conversion Funnel. This is a completely customizable PowerPoint theme that can be put to use immediately. So, download it and address the topic impactfully.
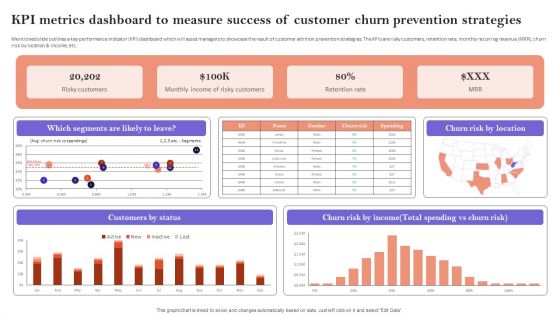
KPI Metrics Dashboard To Measure Success Of Customer Churn Prevention Strategies Diagrams PDF
Mentioned slide outlines a key performance indicator KPI dashboard which will assist managers to showcase the result of customer attrition prevention strategies. The KPIs are risky customers, retention rate, monthly recurring revenue MRR, churn risk by location and income, etc. This KPI Metrics Dashboard To Measure Success Of Customer Churn Prevention Strategies Diagrams PDF is perfect for any presentation, be it in front of clients or colleagues. It is a versatile and stylish solution for organizing your meetings. The KPI Metrics Dashboard To Measure Success Of Customer Churn Prevention Strategies Diagrams PDF features a modern design for your presentation meetings. The adjustable and customizable slides provide unlimited possibilities for acing up your presentation. Slidegeeks has done all the homework before launching the product for you. So, do not wait, grab the presentation templates today
OEM Spare Parts Sales Tracking Dashboard Ppt PowerPoint Presentation Gallery Inspiration PDF
This slide showcases dashboard that can help organization to keep track of aftermarket components sales. Its key elements are sold quantity per spare part and deviation of sold units. Pitch your topic with ease and precision using this oem spare parts sales tracking dashboard ppt powerpoint presentation gallery inspiration pdf. This layout presents information on sold quantity, budgeted quantity, quantity ytd ly. It is also available for immediate download and adjustment. So, changes can be made in the color, design, graphics or any other component to create a unique layout.
SFA Dashboard To Track Performance Ppt PowerPoint Presentation Icon Example File PDF
This Slide visually represents sales force automation dashboard to track performance which can be utilized by marketing managers to streamline the process of automated selling. It includes information about sales pipeline, competitors, opportunities, key competitors, etc. Pitch your topic with ease and precision using this sfa dashboard to track performance ppt powerpoint presentation icon example file pdf. This layout presents information on sales pipeline, sales pipeline by sales rep, key competitors, forecast by month, key opportunities. It is also available for immediate download and adjustment. So, changes can be made in the color, design, graphics or any other component to create a unique layout.
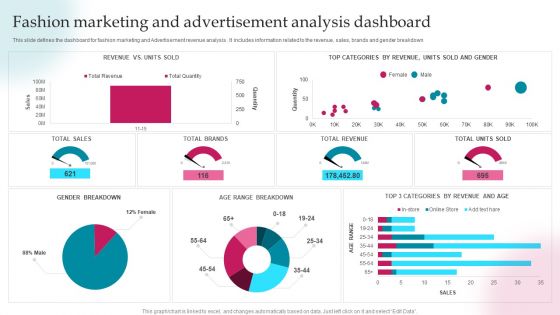
Fashion Marketing And Advertisement Analysis Dashboard Ppt PowerPoint Presentation Gallery Topics PDF
This slide defines the dashboard for fashion marketing and Advertisement revenue analysis . It includes information related to the revenue, sales, brands and gender breakdown. Pitch your topic with ease and precision using this Fashion Marketing And Advertisement Analysis Dashboard Ppt PowerPoint Presentation Gallery Topics PDF. This layout presents information on Total Revenue, Total Brands, Total Sales. It is also available for immediate download and adjustment. So, changes can be made in the color, design, graphics or any other component to create a unique layout.
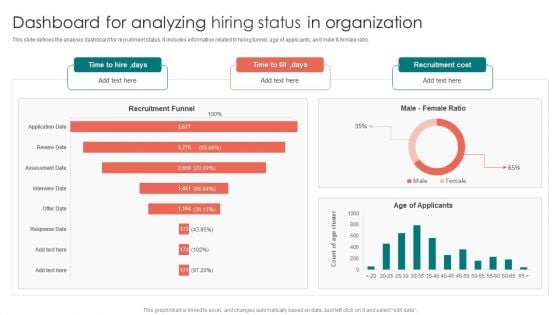
Dashboard For Analyzing Hiring Status In Organization Ppt PowerPoint Presentation Gallery Images PDF
This slide defines the analysis dashboard for recruitment status. It includes information related to hiring funnel, age of applicants, and male and female ratio. Pitch your topic with ease and precision using this Dashboard For Analyzing Hiring Status In Organization Ppt PowerPoint Presentation Gallery Images PDF. This layout presents information on Recruitment Funnel, Time To Hire, Age Applicants. It is also available for immediate download and adjustment. So, changes can be made in the color, design, graphics or any other component to create a unique layout.
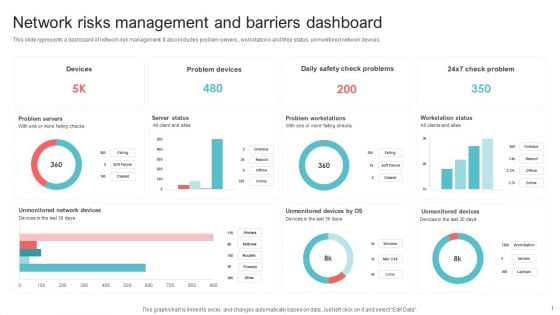
Network Risks Management And Barriers Dashboard Ppt PowerPoint Presentation Gallery Graphic Tips PDF
This slide represents a dashboard of network risk management. It also includes problem servers , workstations and their status, unmonitored network devices. Pitch your topic with ease and precision using this Network Risks Management And Barriers Dashboard Ppt PowerPoint Presentation Gallery Graphic Tips PDF. This layout presents information on Problem Servers, Server Status, Problem Workstations, Workstation Status. It is also available for immediate download and adjustment. So, changes can be made in the color, design, graphics or any other component to create a unique layout.
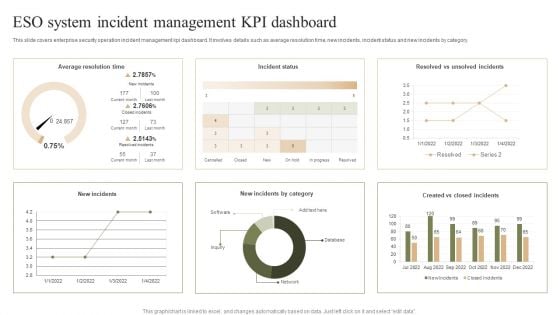
ESO System Incident Management KPI Dashboard Ppt PowerPoint Presentation File Graphic Images PDF
This slide covers enterprise security operation incident management kpi dashboard. It involves details such as average resolution time, new incidents, incident status and new incidents by category. Pitch your topic with ease and precision using this ESO System Incident Management KPI Dashboard Ppt PowerPoint Presentation File Graphic Images PDF. This layout presents information on Average Resolution Time, Incident Status, New Incidents. It is also available for immediate download and adjustment. So, changes can be made in the color, design, graphics or any other component to create a unique layout.
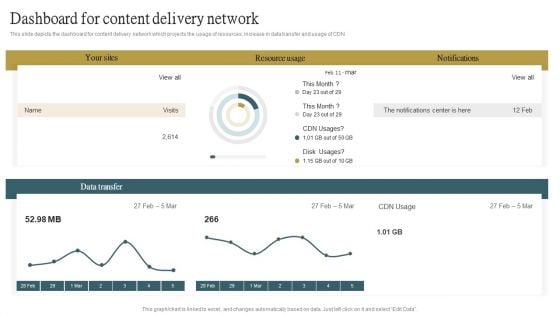
Dashboard For Content Delivery Network Ppt PowerPoint Presentation File Styles PDF
This slide depicts the dashboard for content delivery network which projects the usage of resources, increase in data transfer and usage of CDN. From laying roadmaps to briefing everything in detail, our templates are perfect for you. You can set the stage with your presentation slides. All you have to do is download these easy to edit and customizable templates. Dashboard For Content Delivery Network Ppt PowerPoint Presentation File Styles PDF will help you deliver an outstanding performance that everyone would remember and praise you for. Do download this presentation today.
Data Driven Marketing Campaigns Key Metrics Dashboard Ppt Icon Graphics Pictures PDF
This slide represents the KPI dashboard to track and monitor performance of data driven marketing campaigns launched by the marketing team. It includes details related to conversions by google ads, Facebook and Instagram etc. Explore a selection of the finest Data Driven Marketing Campaigns Key Metrics Dashboard Ppt Icon Graphics Pictures PDF here. With a plethora of professionally designed and pre made slide templates, you can quickly and easily find the right one for your upcoming presentation. You can use our Data Driven Marketing Campaigns Key Metrics Dashboard Ppt Icon Graphics Pictures PDF to effectively convey your message to a wider audience. Slidegeeks has done a lot of research before preparing these presentation templates. The content can be personalized and the slides are highly editable. Grab templates today from Slidegeeks.
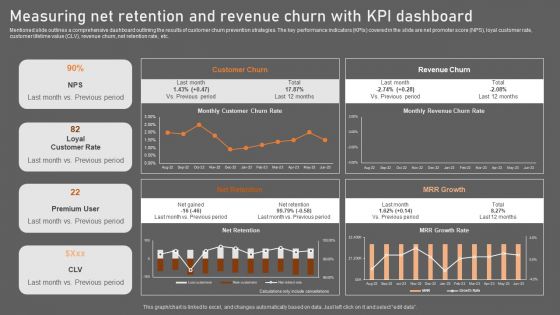
Measuring Net Retention And Revenue Churn With KPI Dashboard Introduction PDF
Mentioned slide outlines a comprehensive dashboard outlining the results of customer churn prevention strategies. The key performance indicators KPIs covered in the slide are net promoter score NPS, loyal customer rate, customer lifetime value CLV, revenue churn, net retention rate, etc. Do you have to make sure that everyone on your team knows about any specific topic I yes, then you should give Measuring Net Retention And Revenue Churn With KPI Dashboard Introduction PDF a try. Our experts have put a lot of knowledge and effort into creating this impeccable Measuring Net Retention And Revenue Churn With KPI Dashboard Introduction PDF. You can use this template for your upcoming presentations, as the slides are perfect to represent even the tiniest detail. You can download these templates from the Slidegeeks website and these are easy to edit. So grab these today.
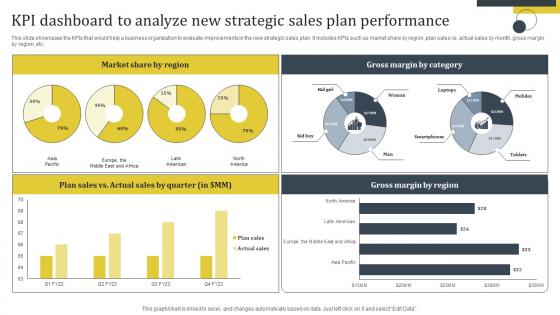
Enhance Customer Retention Kpi Dashboard To Analyze New Strategic Sales Plan Elements Pdf
This slide showcases the KPIs that would help a business organization to evaluate improvements in the new strategic sales plan. It includes KPIs such as market share by region, plan sales vs. actual sales by month, gross margin by region, etc. Welcome to our selection of the Enhance Customer Retention Kpi Dashboard To Analyze New Strategic Sales Plan Elements Pdf. These are designed to help you showcase your creativity and bring your sphere to life. Planning and Innovation are essential for any business that is just starting out. This collection contains the designs that you need for your everyday presentations. All of our PowerPoints are 100 percent editable, so you can customize them to suit your needs. This multi-purpose template can be used in various situations. Grab these presentation templates today. This slide showcases the KPIs that would help a business organization to evaluate improvements in the new strategic sales plan. It includes KPIs such as market share by region, plan sales vs. actual sales by month, gross margin by region, etc.
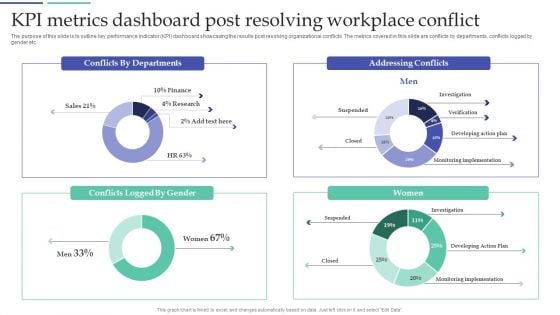
Resolving Team Disputes In Organization KPI Metrics Dashboard Post Resolving Workplace Conflict Pictures PDF
The purpose of this slide is to outline key performance indicator KPI dashboard showcasing the results post resolving organizational conflicts. The metrics covered in this slide are conflicts by departments, conflicts logged by gender etc. Get a simple yet stunning designed Resolving Team Disputes In Organization KPI Metrics Dashboard Post Resolving Workplace Conflict Pictures PDF. It is the best one to establish the tone in your meetings. It is an excellent way to make your presentations highly effective. So, download this PPT today from Slidegeeks and see the positive impacts. Our easy to edit Resolving Team Disputes In Organization KPI Metrics Dashboard Post Resolving Workplace Conflict Pictures PDF can be your go-to option for all upcoming conferences and meetings. So, what are you waiting for Grab this template today.
Marketers Guide To Data Analysis Optimization KPI Dashboard For Tracking Paid Ad Campaign Performance Clipart PDF
This slide covers the dashboard for analyzing paid search metrics such as ad cost, clicks, impressions, click-through rate, cost per conversion, conversion rate, cost per click, etc. Here you can discover an assortment of the finest PowerPoint and Google Slides templates. With these templates, you can create presentations for a variety of purposes while simultaneously providing your audience with an eye catching visual experience. Download Marketers Guide To Data Analysis Optimization KPI Dashboard For Tracking Paid Ad Campaign Performance Clipart PDF to deliver an impeccable presentation. These templates will make your job of preparing presentations much quicker, yet still, maintain a high level of quality. Slidegeeks has experienced researchers who prepare these templates and write high quality content for you. Later on, you can personalize the content by editing the Marketers Guide To Data Analysis Optimization KPI Dashboard For Tracking Paid Ad Campaign Performance Clipart PDF.
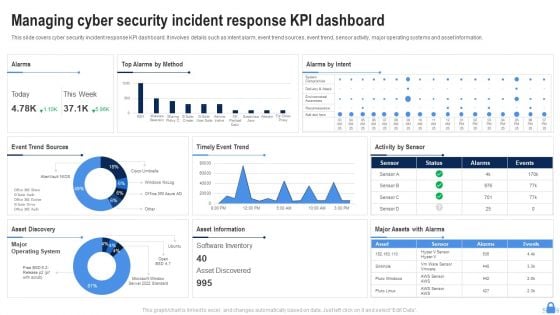
Managing Cyber Security Incident Response KPI Dashboard Ppt Layouts Shapes PDF
This slide covers cyber security incident response KPI dashboard. It involves details such as intent alarm, event trend sources, event trend, sensor activity, major operating systems and asset information. Pitch your topic with ease and precision using this Managing Cyber Security Incident Response KPI Dashboard Ppt Layouts Shapes PDF. This layout presents information on Top Alarms Method, Alarms Intent, Timely Event Trend. It is also available for immediate download and adjustment. So, changes can be made in the color, design, graphics or any other component to create a unique layout.
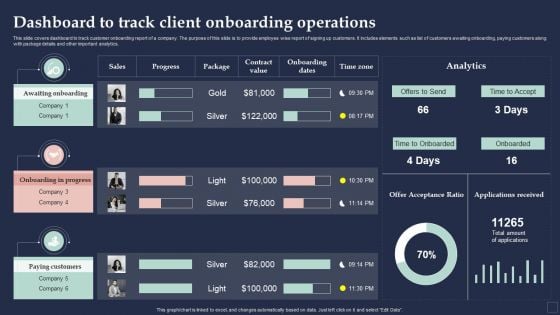
BPM System Methodology Dashboard To Track Client Onboarding Operations Sample PDF
This slide covers dashboard to track customer onboarding report of a company. The purpose of this slide is to provide employee wise report of signing up customers. It includes elements such as list of customers awaiting onboarding, paying customers along with package details and other important analytics. Formulating a presentation can take up a lot of effort and time, so the content and message should always be the primary focus. The visuals of the PowerPoint can enhance the presenters message, so our BPM System Methodology Dashboard To Track Client Onboarding Operations Sample PDF was created to help save time. Instead of worrying about the design, the presenter can concentrate on the message while our designers work on creating the ideal templates for whatever situation is needed. Slidegeeks has experts for everything from amazing designs to valuable content, we have put everything into BPM System Methodology Dashboard To Track Client Onboarding Operations Sample PDF

Smart Wireless Sensor Networks Dashboard For Spectrum Consumption In Cognitive Radio Professional PDF
This slide depicts the dashboard for spectrum consumption in cognitive radio by covering an overview of the types of data that spectrum contains, spectrum results, user reputation, and locations. Get a simple yet stunning designed Smart Wireless Sensor Networks Dashboard For Spectrum Consumption In Cognitive Radio Professional PDF. It is the best one to establish the tone in your meetings. It is an excellent way to make your presentations highly effective. So, download this PPT today from Slidegeeks and see the positive impacts. Our easy-to-edit Smart Wireless Sensor Networks Dashboard For Spectrum Consumption In Cognitive Radio Professional PDF can be your go-to option for all upcoming conferences and meetings. So, what are you waiting for Grab this template today.
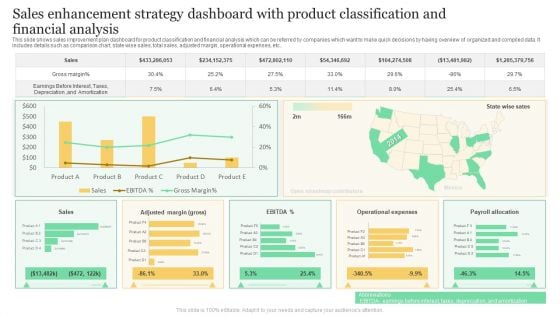
Sales Enhancement Strategy Dashboard With Product Classification And Financial Analysis Formats PDF
This slide shows sales improvement plan dashboard for product classification and financial analysis which can be referred by companies which want to make quick decisions by having overview of organized and compiled data. It includes details such as comparison chart, state wise sales, total sales, adjusted margin, operational expenses, etc. Showcasing this set of slides titled Sales Enhancement Strategy Dashboard With Product Classification And Financial Analysis Formats PDF. The topics addressed in these templates are Gross Margin, Sales, Operational Expenses. All the content presented in this PPT design is completely editable. Download it and make adjustments in color, background, font etc. as per your unique business setting.
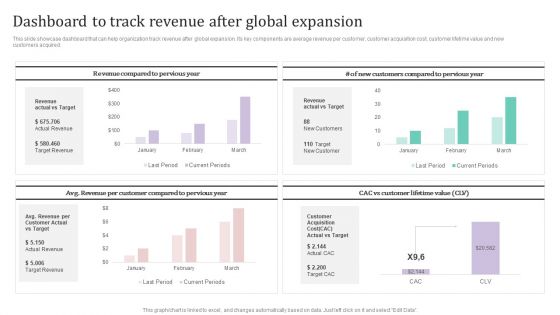
Dashboard To Track Revenue After Global Expansion Ppt PowerPoint Presentation File Example PDF
This slide showcase dashboard that can help organization track revenue after global expansion. Its key components are average revenue per customer, customer acquisition cost, customer lifetime value and new customers acquired.Take your projects to the next level with our ultimate collection of Dashboard To Track Revenue After Global Expansion Ppt PowerPoint Presentation File Example PDF. Slidegeeks has designed a range of layouts that are perfect for representing task or activity duration, keeping track of all your deadlines at a glance. Tailor these designs to your exact needs and give them a truly corporate look with your own brand colors they all make your projects stand out from the rest.
Dashboard For Cloud Storage Tracking Ppt PowerPoint Presentation File Example PDF
This slide represents the dashboard for cloud storage tracking by covering details of users, available workspaces, shared files, downloads, uploads, and moves. Take your projects to the next level with our ultimate collection of Dashboard For Cloud Storage Tracking Ppt PowerPoint Presentation File Example PDF. Slidegeeks has designed a range of layouts that are perfect for representing task or activity duration, keeping track of all your deadlines at a glance. Tailor these designs to your exact needs and give them a truly corporate look with your own brand colors they will make your projects stand out from the rest.
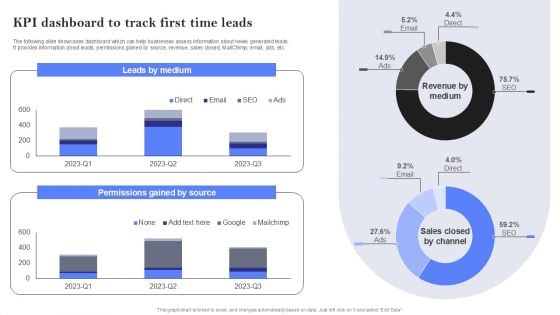
KPI Dashboard To Track First Time Leads Ppt PowerPoint Presentation File Pictures PDF
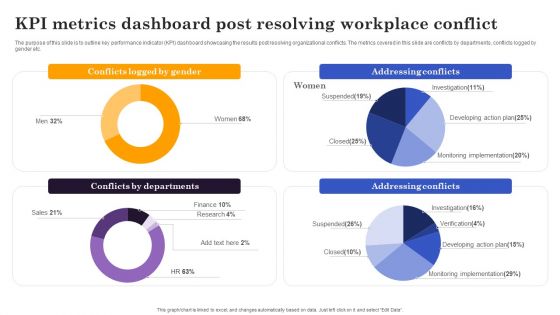
Conflict Resolution Method KPI Metrics Dashboard Post Resolving Workplace Download PDF
The purpose of this slide is to outline key performance indicator KPI dashboard showcasing the results post resolving organizational conflicts. The metrics covered in this slide are conflicts by departments, conflicts logged by gender etc. Do you have to make sure that everyone on your team knows about any specific topic I yes, then you should give Conflict Resolution Method KPI Metrics Dashboard Post Resolving Workplace Download PDF a try. Our experts have put a lot of knowledge and effort into creating this impeccable Conflict Resolution Method KPI Metrics Dashboard Post Resolving Workplace Download PDF. You can use this template for your upcoming presentations, as the slides are perfect to represent even the tiniest detail. You can download these templates from the Slidegeeks website and these are easy to edit. So grab these today.
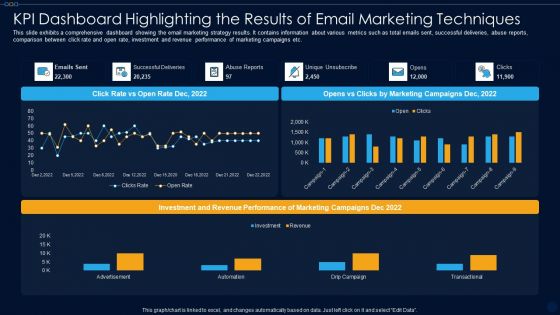
KPI Dashboard Highlighting The Results Of Email Marketing Techniques Ppt PowerPoint Presentation File Format PDF
This slide exhibits a comprehensive dashboard showing the email marketing strategy results. It contains information about various metrics such as total emails sent, successful deliveries, abuse reports, comparison between click rate and open rate, investment and revenue performance of marketing campaigns etc. Showcasing this set of slides titled kpi dashboard highlighting the results of email marketing techniques ppt powerpoint presentation file format pdf. The topics addressed in these templates are advertisement, automation, drip campaign, transactional. All the content presented in this PPT design is completely editable. Download it and make adjustments in color, background, font etc. as per your unique business setting.


 Continue with Email

 Home
Home


